
Abstract
The crisis in Greece led to one of the largest economic shocks in European history. Drawing on micro-data from the Greek Labour Force Survey, we utilize standard micro-econometric methods and non-linear decomposition techniques to measure the size of the shock exerted on the Greek regional and national labor markets and the compositional and price adjustments in response to this. We find elements of economic dynamism, with some sizeable price adjustments in the economy of the Greek capital, Athens; but overall our results show that compositional adjustments (in labor quality/characteristics) have been partial and limited, becoming stronger only in the more recent recovery. Our results suggest a significant metropolitan advantage with regard to economic resilience, coming predominantly from a more efficient functioning of the labor market in metropolitan areas vis-a-vis other regions. Our use of the decomposition techniques for the analysis of macro-level developments in the labor market offers a novel perspective to the application of the decomposition methodology.
Introduction
The Greek crisis represented an immense shock to the Greek labor market. Reversing abruptly the trajectory seen since the country’s entry into the eurozone, unemployment rose from a fifteen-year low of 7.8% in 2008 to 27.3% in 2013; before starting subsiding more recently. As is shown in Figure 1, across the Greek regions 1 unemployment rose from values of below 10% in 2008 to values in excess of 20%—and in some areas in excess of 30%—in 2013. With the recovery, unemployment subsided everywhere, albeit more strongly in some areas than in others, with the two metropolitan areas of Athens and Thessaloniki maintaining unemployment rates above 20% and some of the peripheral regions (West Macedonia, North Aegean, Ioanian islands) showing very little adjustment from the crisis. A number of studies have examined the impact of the crisis—and of the policy measures implemented under the country’s economic adjustment programmes—on the national economy and the labor market in particular (see, inter alia, Monastiriotis 2014b; Christopoulou and Monastiriotis 2014, 2016; Cholezas and Kanellopoulos 2015; Daouli et al. 2017; Georgiadis, Kaplanis, and Monastiriotis 2020). At the regional level, studies examining the impact of the crisis have been more limited. In an early analysis, Monastiriotis (2011) estimated the costs of adjustment to be greater for some peripheral regions, predicting a widening of regional inequalities during the economic recovery (despite evidence of regional convergence during the crisis—Monastiriotis 2014a) and a particular advantage for the metropolitan region of Athens. More recent studies have confirmed empirically this prediction (Palaskas et al. 2015; Patrakos and Psycharis 2016), showing that the Athens economy has shown more resilience to the economic shock.
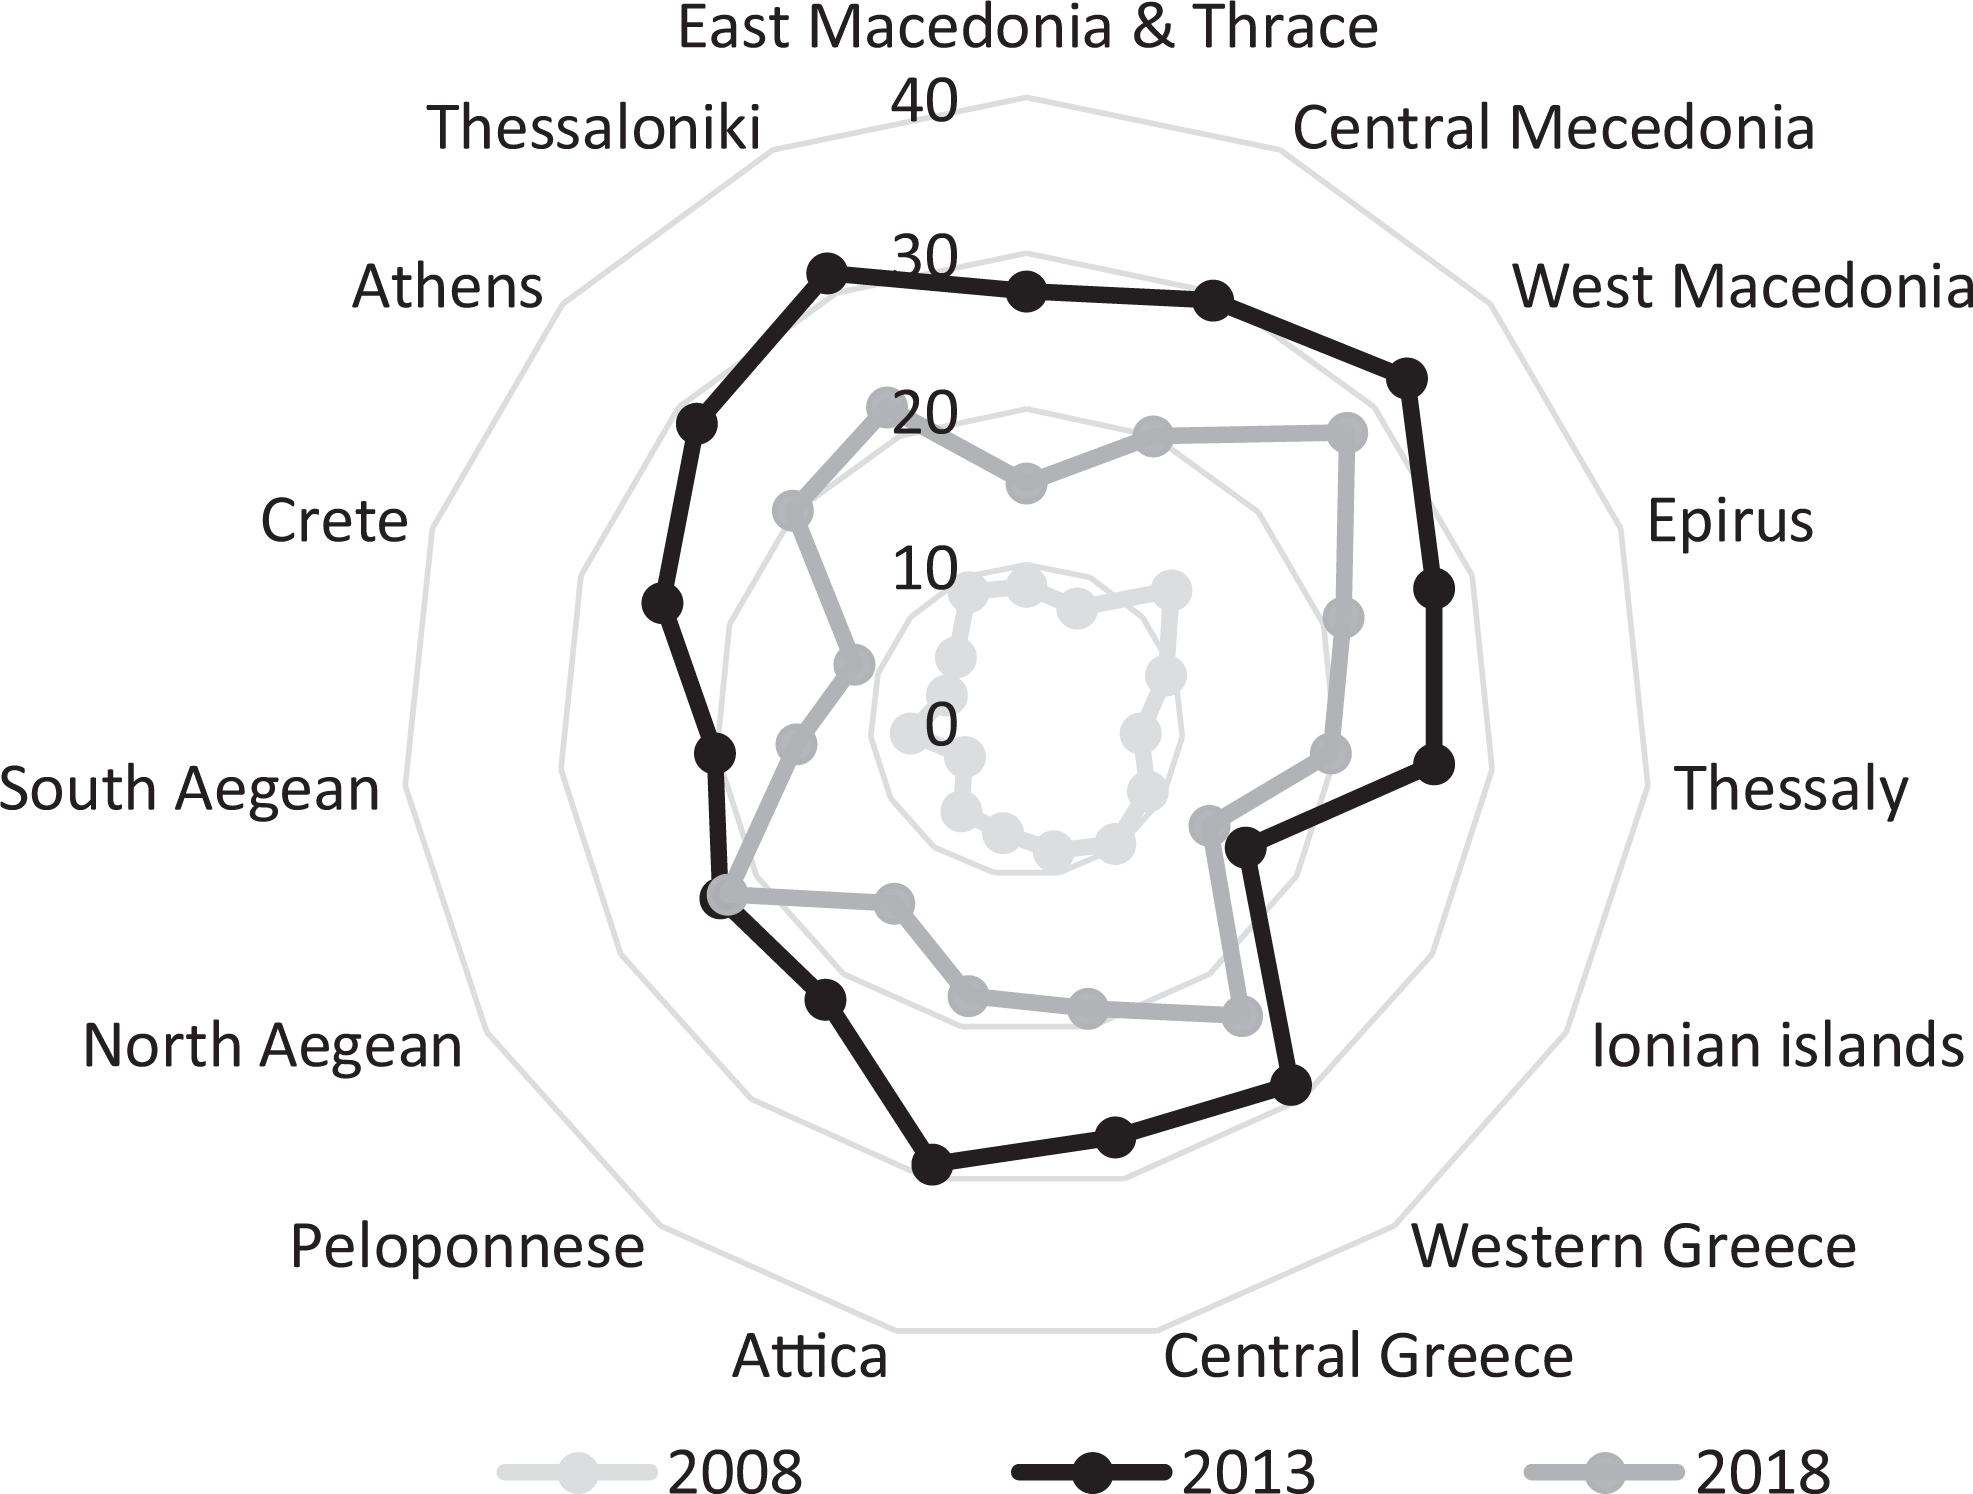
Regional unemployment evolutions in Greece during crisis and recovery.
The question of regional adjustments to economic shocks has traditionally been examined in the literature via the so-called Okun’s Law, which stipulates a relationship between output (our “output gap”) and unemployment. Studies covering the period prior to the crisis for Greece have shown limited regional adjustments in this regard for the country. For example, Apergis and Rezitis (2003) have found a low responsiveness of unemployment to changes in GDP (especially to positive GDP growth) for all but two regions and generally little inter-regional differences in this regard. Similarly, Christopoulos (2004) also showed limited responsiveness of regional unemployment to regional GDP in the country, concerning mainly some peripheral regions.
Evidence during the crisis and post-crisis periods is more limited. At the national level for Greece, the studies by Bournakis and Christopoulos (2017), Koutroulis, Panagopoulos, and Tsouma (2016), Katris (2016) and Karfakis, Katrakilidis, and Tsanana (2014) have confirmed previous findings of low responsiveness of unemployment to GDP changes, in the Okun’s Law tradition, showing also asymmetric responses between expansions and contractions (with periods of output expansion associated with lower reductions in unemployment, thus suggesting structural deficiencies in the labor market). Studies at the regional level, for other countries with similar experiences during the crisis (mainly, Spain), have also highlighted structural issues as key determinants for the Okun Law elasticity. For example, Melguizo (2017) has shown the unemployment elasticity to be higher for Spanish provinces with less diversified industries and greater specialization in services; while, for the same country, Bande and Martín-Román (2018) and Porras-Arena and Martin-Roman (2019) provided evidence of heterogeneity in the Okun coefficient at the regional level. 2
This paper deviates from this literature by adopting a different approach to examining the degree and type of adjustments in relation to the economic shock of the crisis. Using micro-data from the Greek Labour Force Survey (LFS) we apply a set of standard micro-econometric and decomposition techniques in a novel way that allows us to measure the extent of the shock in the Greek economy and its regions and the adjustments that took place in response to this, both during the crisis (2008–2013) and in the subsequent recovery (2013–2018). Our approach is as follows. First, we run a series of unemployment probits to estimate the contribution of various individual and household characteristics to individual unemployment risk during and after the crisis, examining in this way how the crisis affected the unemployment probability for different groups of the active population and how it re-shaped the marginal employment probabilities of different marketable characteristics such as education and labor market experience (as proxied by age). Subsequently, we apply a decomposition analysis to derive a number of distinct components of the overall change in unemployment, identifying specifically a measure of the extent of the shock to the economy and two measures showing the size of the compositional and price adjustments that took place in response to this shock. While we examine these adjustments across the thirteen NUTS2 regions of Greece, our focus in this paper is on the case of the Greek capital, Athens, which we contrast to evolutions in the rest of the country. The reason for this is twofold. First, because Athens constitutes the main agglomeration of the country, accounting for about 30% of total population and 34% of total national GDP, having a per capita GDP 35% higher than the rest of the country. 3 Second, because prior literature (as reviewed above), as well as the evidence we present subsequently, has shown that Athens has had a substantially different experience with regard to the crisis than the rest of the country. Although variations across other dimensions of the economic geography of Greece do of course exist (see, inter alia, Monastiriotis and Martelli 2013; Arvanitopoulos et al. forthcoming), our attention on how the footprint of the crisis, and adjustment to it, varied between the main urban agglomeration in the country and the rest of the Greece.
In our analysis we find that adjustment to the shock came predominantly through changes in shadow prices (price adjustments), especially in the more urban areas of the country, representing mostly an intensified sorting (into/out of employment) on the basis of some individual characteristics, both marketable (education) and exogenous (ethnicity); while some more minor quantitative adjustments (towards rising overall labor quality) also took place. However, these adjustments were nowhere near sufficient to negate the extent of the shock, resulting in the tripling of unemployment in the country in the space of four years. Absence of a more intensive adjustment (especially outside the main urban agglomeration of the capital, Athens) and the overall magnitude of the shock (especially in Athens) show in a way the nature of the unemployment problem in Greece: an unprecedented collapse in demand and a structural weakness to respond sufficiently to this collapse via internal adjustments, including quantitatively, through migration. Adjustments in the more recent period of economic recovery seem more promising, with both labor quality and employment sorting on the basis of education improving further, but to a large extent the geographical differences between the main agglomeration of Athens and the rest of the country persist—with Athens presenting an advantage in terms of adjustment and economic resilience both during the crisis and during the economic recovery.
The structure of the paper is as follows. The next section discusses our empirical approach and methodology. Section 3 presents our micro-econometric analysis of individual unemployment risk and discusses the changes in this, during the crisis and recovery periods. Section 4 implements a detailed (variable-specific) decomposition of these changes, which allows us to examine the extent of the shock and the price and compositional adjustments to it. The last section summarizes our findings and discusses their implications for policy and for economic resilience.
Data and Methodology
Our empirical methodology combines a micro-econometric analysis of individual unemployment risk along with application of non-linear detailed decompositions. We use individual-level data from the spring waves of the Greek Labour Force Survey for the years 2008, 2013 and 2018 4 representing, respectively, the year prior to the crisis, the peak of the crisis and the most recent year of recovery. As a first step, we run a set of probit regressions which enable us to estimate the probability of observing a specific unemployment outcome for each individual on the basis of a series of individual and household characteristics, using an extended “Mincerian” specification which includes the standard controls for education, gender and age, amended by various socio-demographic characteristics (ethnicity, marital status, household size, status in the household). Although our choice of right-hand-side variables is limited by data availability in the Greek Labour Force Survey, we note that this set of regressors is used very commonly in similar studies in the literature. 5
Given that the “choice” between employment and unemployment is conditional on an individual’s participation to the labor force, we also estimate our unemployment probits using a Heckman correction for selection (Heckprobit). The procedure fits a first-stage regression explaining an individual’s probability of labor force participation (activity probit) and subsequently amends the second-stage regression (unemployment probit) with a correction term (inverse Mills ratio) which controls for the fact that the characteristics (and thus the employability) of individuals that “choose” to participate in the labor market are not a random draw from the set of characteristics observed in the full sample of working age population. To identify the first-stage regression, our empirical analysis uses the number of under-age kids as an instrument. 6
Following this, at a second step we implement the so-called Oaxaca-Ransom decomposition 7 (Oaxaca and Ransom 1999), as extended to the case of non-linear models (see Yun 2005; Fairlie 2005; Bauer and Sinning 2008). This allows us to compare the (predicted) outcomes between two samples (in our case, 2008 versus 2013 and 2013 versus 2018) and decompose their difference into various components broadly grouped into two categories: an “explained” component (endowment effect); and an “unexplained” component (price effect). 8
Formally, the non-linear version of the Oaxaca-Ransom decomposition is given by:
where A and B constitute the two groups (here, years) that are being compared; and the bars above parameters show predicted values. In this simple decomposition the first term (“explained” component) captures the difference between the samples that is due to differences in characteristics,
In our analysis, we implement this as a variable-specific (detailed) decomposition, thus producing the “explained” and “unexplained” components separately for each of the variables included in the model (for example, a separate “price” and “endowment” effect for the gender variable and a separate “price” and “endowment” effect for the education variable) (see Jann 2008). In the context of non-linear (probit) model decompositions, this presents the additional complication that the derived components for the categorical variables included in the model (e.g., the age groups) are not independent from the choice of the omitted base category (see Oaxaca and Ransom 1999). 9 To address this, we implement the iterative method proposed by Yun (2005), which “normalizes” these effects by running sequentially a decomposition for each alternative base category and expresses the estimated effects as deviations from the grand mean. Specifically, Yun’s (2005) correction is by means of the “deviation contrast” transformation which renders the decomposition results for the categorical variables independent of the choice of the base category.
Given that our underlying models (unemployment risk regressions) are estimated with the Heckman correction for selection (into (in)activity), there is an additional adjustment that needs to be implemented in the application of the decomposition analysis. In linear models (e.g., Mincerian wage equations), the approach to this is via a weights-based decomposition of the Mills ratio, as proposed originally by Neuman and Oaxaca (2004) and demonstrated more recently by López-Bazo and Motellón (2012) in the context of regional analysis. In the case of non-linear models, such as the unemployment models estimated here, full decomposition of the Mills ratio is mathematically very complex and computationally near-impossible. As a result, in our application we use the method proposed by Duncan and Leigh (1980) and further explained in Neuman and Oaxaca (2004), which consists of estimating separately each selection-corrected model (for each year) so as to derive the selection-correction terms 10 and subsequently subtracting the difference in these between the two groups from the left-hand-side term in equation (1), so that:
We implement this using the -oaxaca, adjust()- option in Stata, as explained in Jann (2008).
The variable-specific decompositions allow us to depart from the micro-econometric analysis and derive conclusions that have a wider (economy-wide) relevance. In particular, we use the detailed decompositions to derive a “price” component associated to the change in the fixed-effect (intercept) between each pair of year-specific regressions. As the underlying intercepts give us the “baseline” aggregate unemployment probability for each year, net of the individual characteristics and of their prices (coefficients), the difference in unemployment attributable to this component is a direct measure of the change in unemployment that would have occurred between the two years under analysis in the absence of any compositional and price-related changes. It is thus a measure of the shock applied to the economy, between each two years, independent of any (price or compositional) adjustments that may have taken place and may have smoothened or amplified this shock. By this, we are able not only to decompose changes in unemployment into the traditional “explained” and “unexplained” components but, much more crucially, to derive measures of (a) the extent of the shock and (b) the extent of adjustment to this shock—which, jointly, account for the overall observed “effect,” i.e. the actual change in unemployment observed in the data. With this, we are also able to derive a measure of the overall resilience of the labor market, defined as the proportion of the original (exogenous) shock that has been absorbed through compositional and price adjustments. This is a novel and to our knowledge unique approach to the implementation of the decomposition analysis and, we believe, one that makes a highly important contribution to the study of regional labor markets.
The Contribution of Individual Characteristics to Unemployment Risk
We start by reviewing the individual estimates concerning the contribution of the various individual characteristics on the probability of unemployment in the two periods (crisis and recovery), with and without controlling for how different individual characteristics have “selected” people into and out of inactivity. The latter allows us to gauge, for example, if the crisis pushed previously inactive “unemployable” individuals into active job-search (an “added worker” effect which would artificially raise the unemployment figures observed in the data), or if the recovery allowed individuals (e.g., secondary income earners) to withdraw from the labor market (e.g., as suggested by Monastiriotis, Macchiarelli, and Lampropoulou 2019). A recent paper, focusing on local labor markets in Spain, by Martín-Román, Cuéllar-Martín, and Moral (2020), goes in this direction by highlighting a positive spatial dependence in the cyclical sensitivity of labor force participation and showing evidence of a bandwagon worker effect.
Starting from this issue of selection (right-hand panel in Table 1), we can see that processes of selection have risen sharply during the crisis and persisted during the period of recovery. In 2008, selection into (in)activity (“selection” coefficient) did not seem to affect an individual’s probability of unemployment, suggesting that prior to the crisis the decision over labor force participation was not associated with the individual’s chances of gaining employment once in the labor market. By 2013, selection had risen sharply, becoming statistically significant even at the 0.1% level. The negative sign obtained (−0.692) implies that during the crisis the characteristics that “selected” individuals into activity were correlated with a higher likelihood of employment for those individuals. This in turn suggests that during the period less employable individuals withdrew from the labor market altogether (a “discouraged worker” effect, pushing less employable individuals towards inactivity). This pattern subsided somewhat (lower estimated elasticity, of −0.446, and larger standard errors), but largely persisted, during the recovery period (year 2018). 11
Individual Determinants of Unemployment Before, During and After the Crisis.
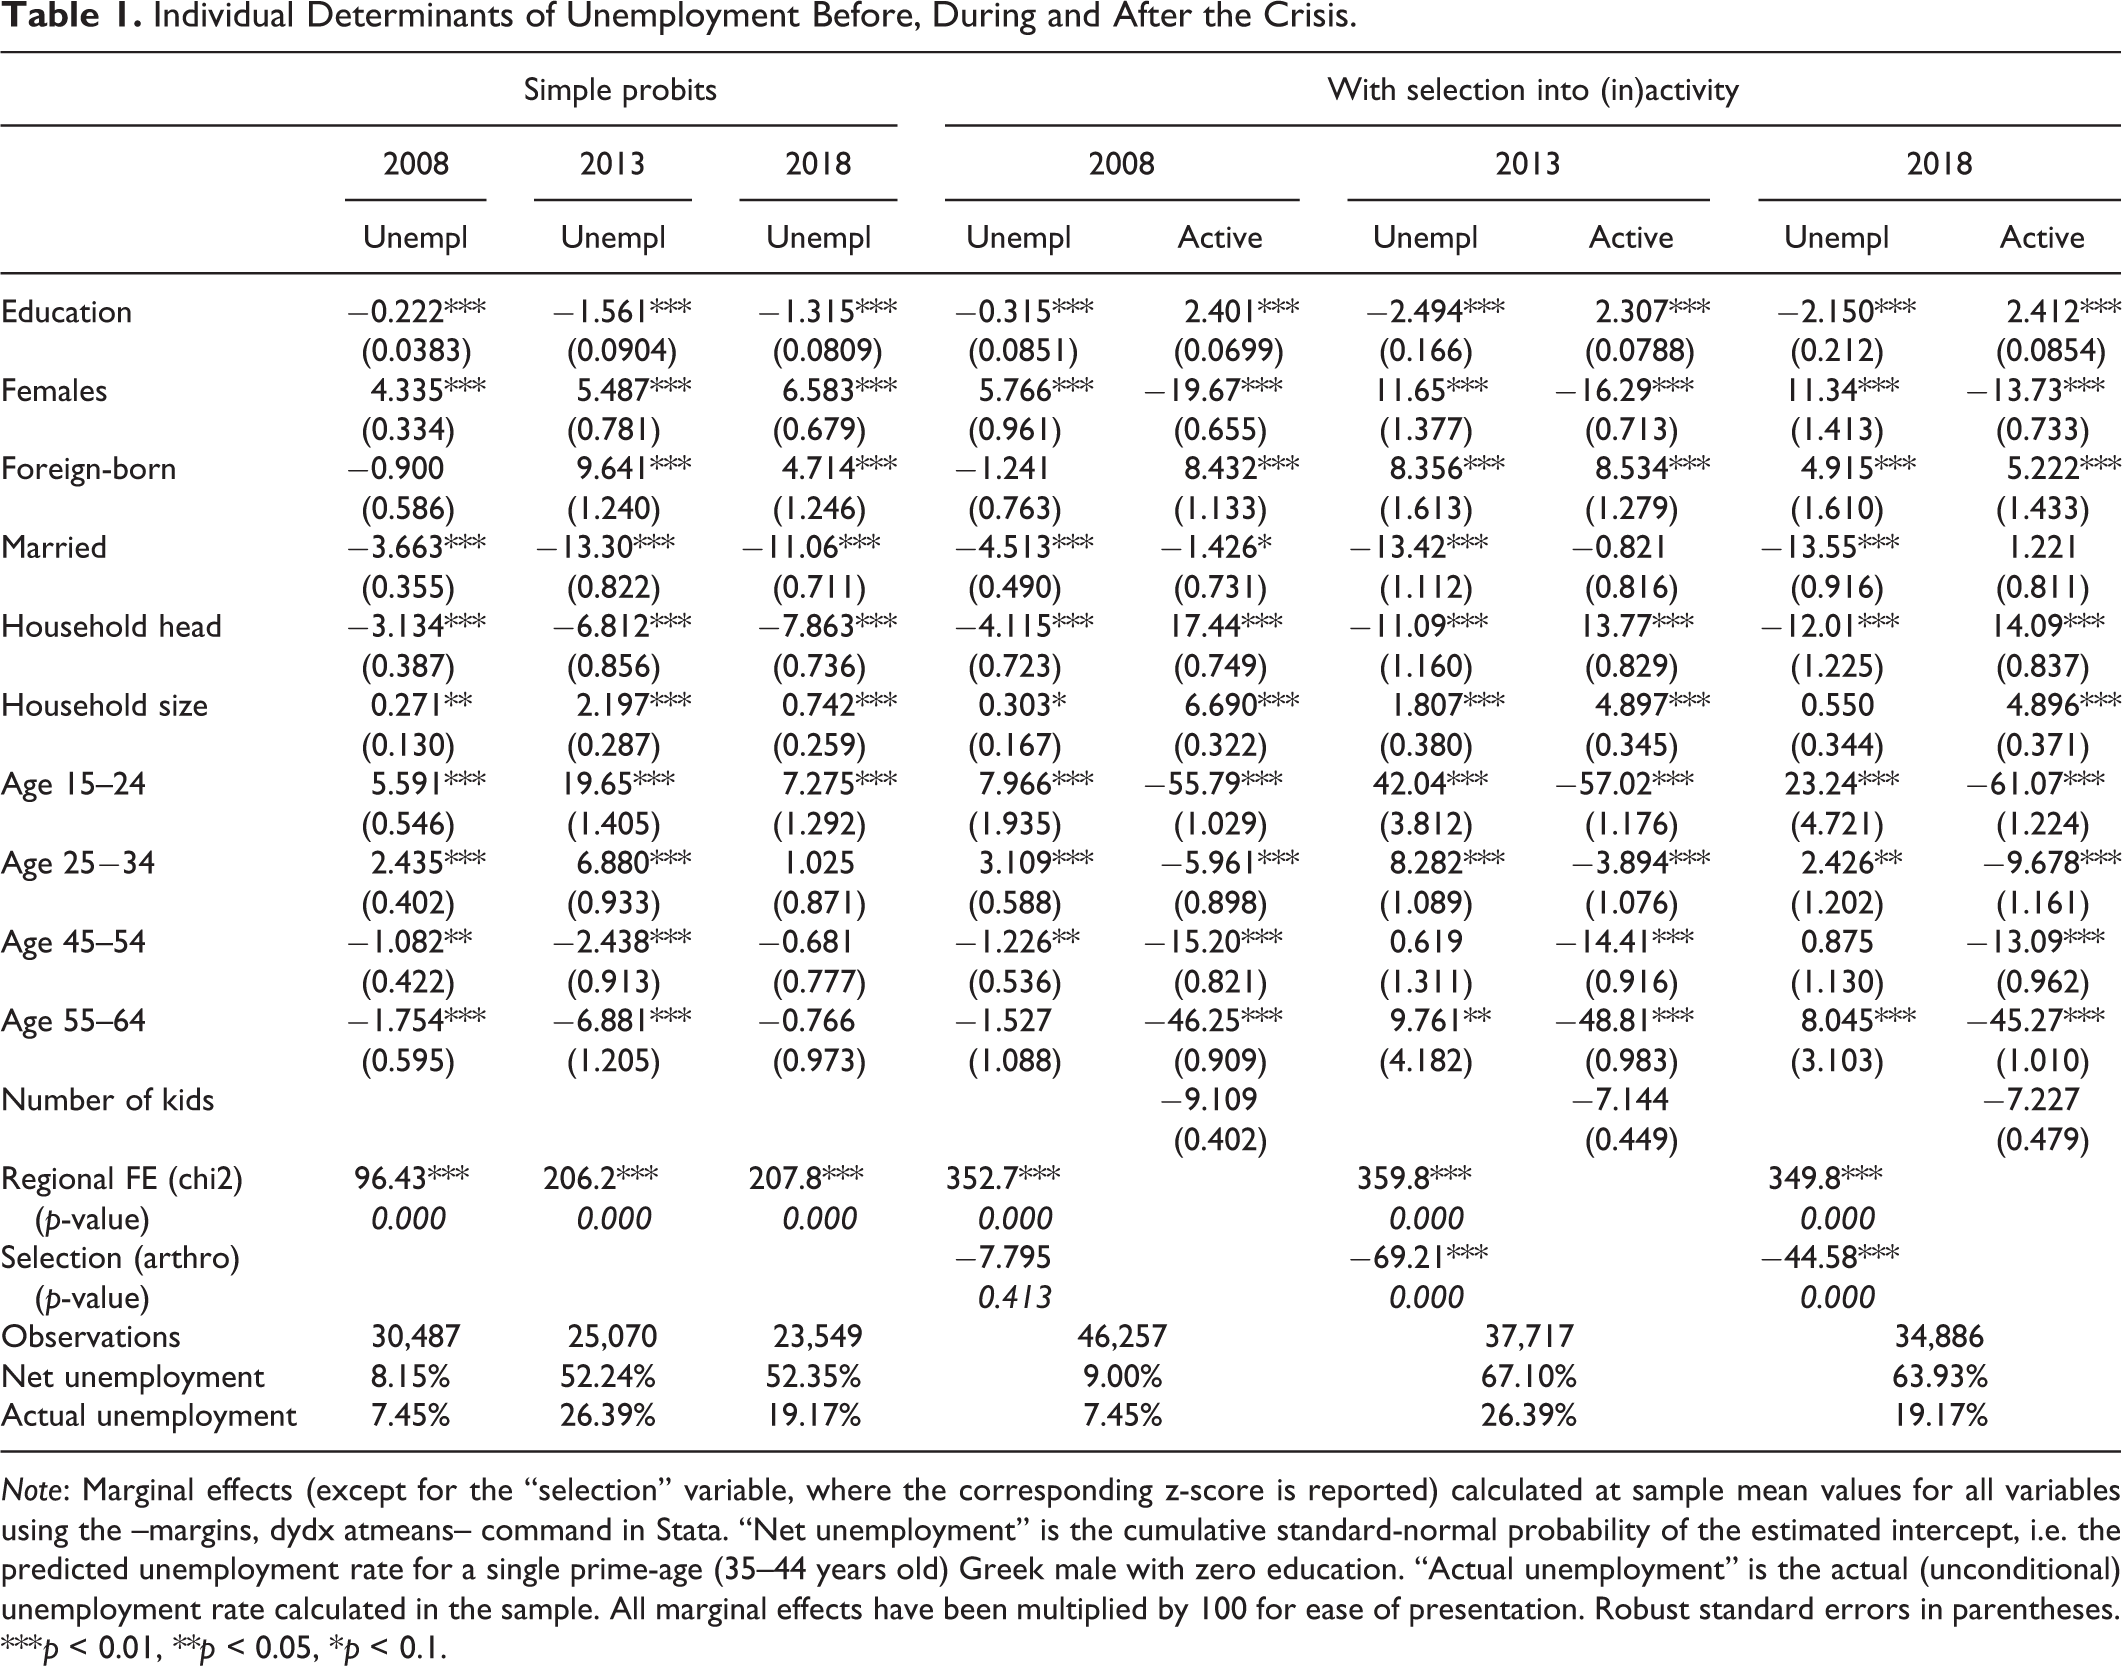
Note: Marginal effects (except for the “selection” variable, where the corresponding z-score is reported) calculated at sample mean values for all variables using the –margins, dydx atmeans– command in Stata. “Net unemployment” is the cumulative standard-normal probability of the estimated intercept, i.e. the predicted unemployment rate for a single prime-age (35–44 years old) Greek male with zero education. “Actual unemployment” is the actual (unconditional) unemployment rate calculated in the sample. All marginal effects have been multiplied by 100 for ease of presentation. Robust standard errors in parentheses. ***p < 0.01, **p < 0.05, *p < 0.1.
As can be seen by comparing the second-stage regression results with those obtained from the simple unemployment probits (left-hand panel of Table 1), selection affects somewhat our estimates for the individual characteristics (e.g., higher elasticities for the female dummy and differences in the estimates for the different age groups), but on the whole makes little difference for these results qualitatively. Rather, the most interesting differences are between years.
Perhaps the most important of these differences, in economic and policy terms, concerns the role of education, which is a significant factor influencing an individual’s probability of unemployment in all years. Prior to the crisis, an additional year of schooling was associated with a 0.22% lower probability of unemployment for an individual with average characteristics. The impact of selection in explaining this result was rather moderate, as even with the Heckman correction the probability remained particularly low (0.31%). Looking at the regional picture 12 (Figure 2, top panel) shows that this concerns all regions quite horizontally, with the majority of regions showing marginal effects for the education variable below 0.5% and only two regions (Thessaloniki and Western Macedonia) returning substantially high marginal effects. The role of education as a sorting mechanism, however, increased substantially with the crisis. By 2013 the employment advantage associated to one additional year of schooling had risen to 1.56% for the individual possessing average characteristics—and to 2.49% when accounting for selection. Across the country, in this period only three regions showed marginal effects for education below traditional levels (below 1.0%), while the whole of the north-west part of Greece (Epirus, West Macedonia, Central Macedonia and Thessaloniki) as well as the wider functional area of the capital (Athens, Attiki and South Aegean) showed marginal effects in excess of 4.0%. The economic recovery brought only a small change to this, with the estimated elasticities in 2018 falling marginally to 1.32% and 2.15% nationally (in the simple probits and the Heckman-selection estimations, respectively) and stabilizing to values above 2.0% across the Greek territory (except for the regions of Crete and East Macedonia & Thrace), suggesting that the crisis brought about a more permanent intensification of employment sorting on the basis of education. Throughout the period, education has also been playing an important role in driving individuals into activity, as is shown in the first-stage Heckman regressions.
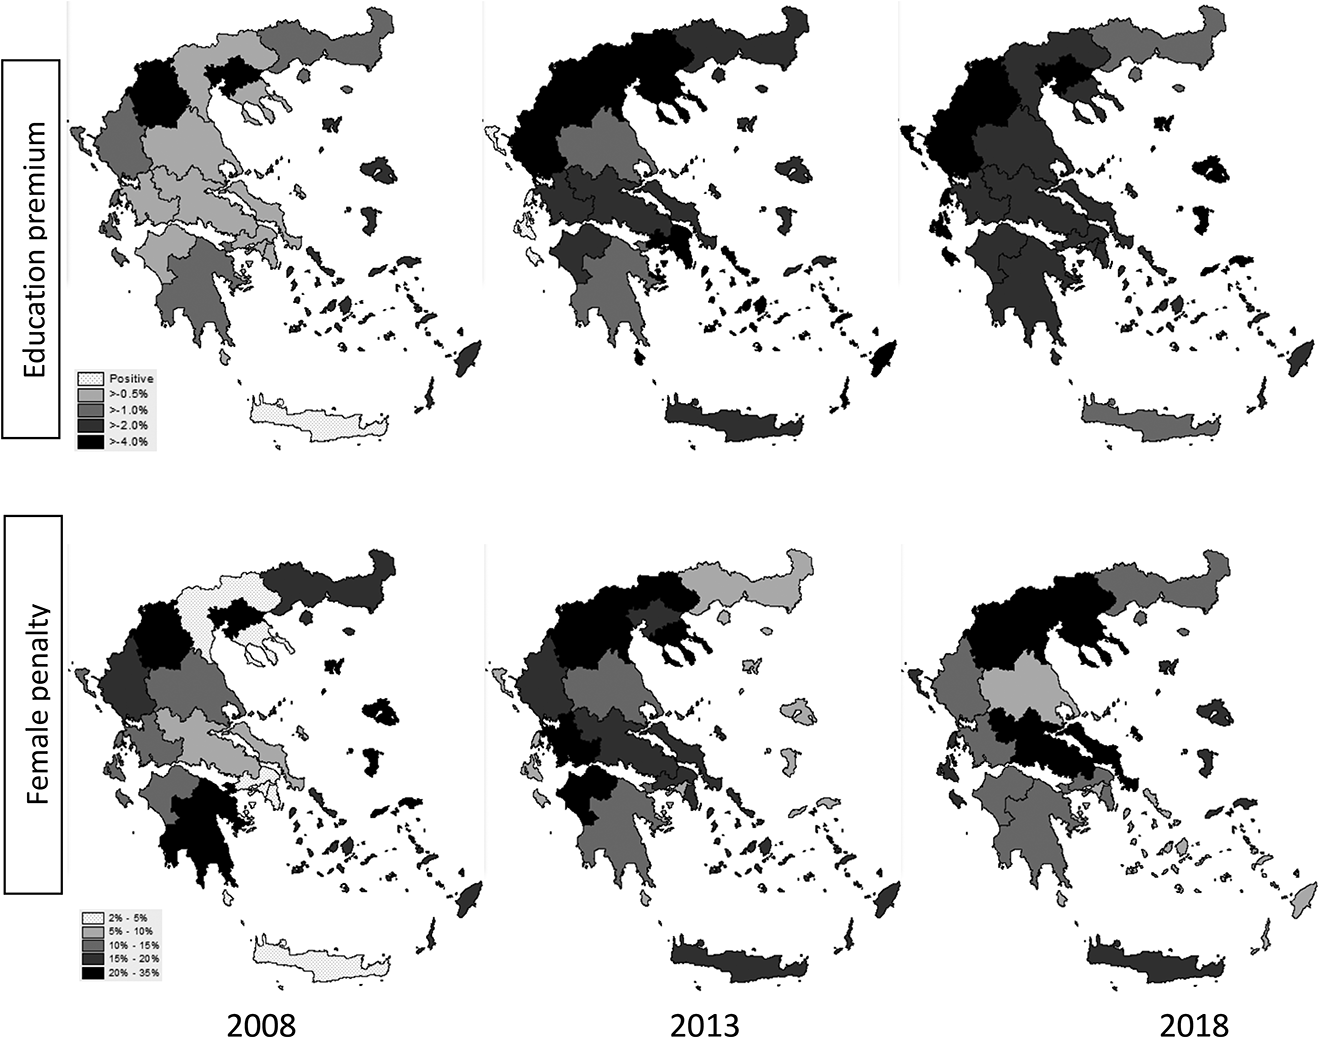
Education premium and female penalty—region-specific estimates.
The other important factor in these models is the gender variable (female penalty), which is often seen as a measure of discrimination in the labor market. The female penalty is quite sizeable (e.g., 4.3% in 2008 in our most conservative estimate) and seems to intensify throughout the period (or to persist in the recovery, according to the Heckman-selection results). Importantly, controlling for selection increases the size of the penalty sizeably: for the crisis period (in 2013), for example, the simple probit estimates a female penalty of 5.5% while the Heckprobit estimate is at 11.6%. In this case, however, the spatial picture is less homogeneous. As is shown in the lower panel of Figure 2, prior to the crisis substantial penalties, of over 20%, existed in regions such as West Macedonia, Peloponnese, North Aegean and Thessaloniki; while in Athens the pre-crisis female penalty was minimal. With the crisis, the penalty persisted in West Macedonia and increased in Athens, Western Greece, Central Greece, Crete, Attiki and Central Macedonia, but it declined in Peloponnese and Thessaloniki. Finally, with the recovery, the geography of the female penalty shifted again, but with Athens maintaining a low level for the female penalty (and the lowest nationally) and Central Greece now joining Central Macedonia and Thessaloniki as the highest-penalty regions.
The effects of the other variables included in the models go generally in the expected direction. For those foreign-born, unemployment probabilities increased substantially with the crisis but subsided subsequently—while remaining higher than pre-crisis. Heads of households and married individuals experienced lower unemployment risks pre-crisis and increasingly so during the crisis; while unemployment remained higher for individuals living in larger households. 13 Concerning the age variables, the probit results show substantial employment sorting on the basis of age pre-crisis and substantial intensification of it during the crisis—with the youth penalty (relative to the base category of 35–44 year-olds) rising from 5.6% in 2008 to 19.6% in 2013. 14 Controlling for selection produces higher age-sorting estimates which tend to persist more in the economic recovery. 15
Region-specific estimates for each of these variables (available upon request) show rather limited variability and in general go in the same direction as the nationally estimated effects. The main exception to this is the foreign-born penalty, which is estimated with much noise (large standard errors), owing to small effective sample-sizes. 16 Instead, an interesting regional picture is obtained from the regional fixed effects, representing the “baseline” unemployment for each region-year. As is shown in Figure 3, in all regions, baseline (or net) unemployment increased dramatically with the crisis, by more than the actual rise in total unemployment, reaching in 2013 values above 40% in Athens, Thessaloniki and West Macedonia and remaining below 30% only in the island regions (South Aegean, North Aegean, Crete, Ionian islands and Peloponnese). With the recovery, baseline unemployment subsided in most regions, but it increased or remained constant in West Macedonia, Epirus, Thessaly, the Ionian islands, Western Greece and the North Aegean. These movements suggest notable underlying movements in individual characteristics (compositional changes) and in their shadow prices (estimated elasticities). It is the exploration of these movements that we turn our attention to, next.
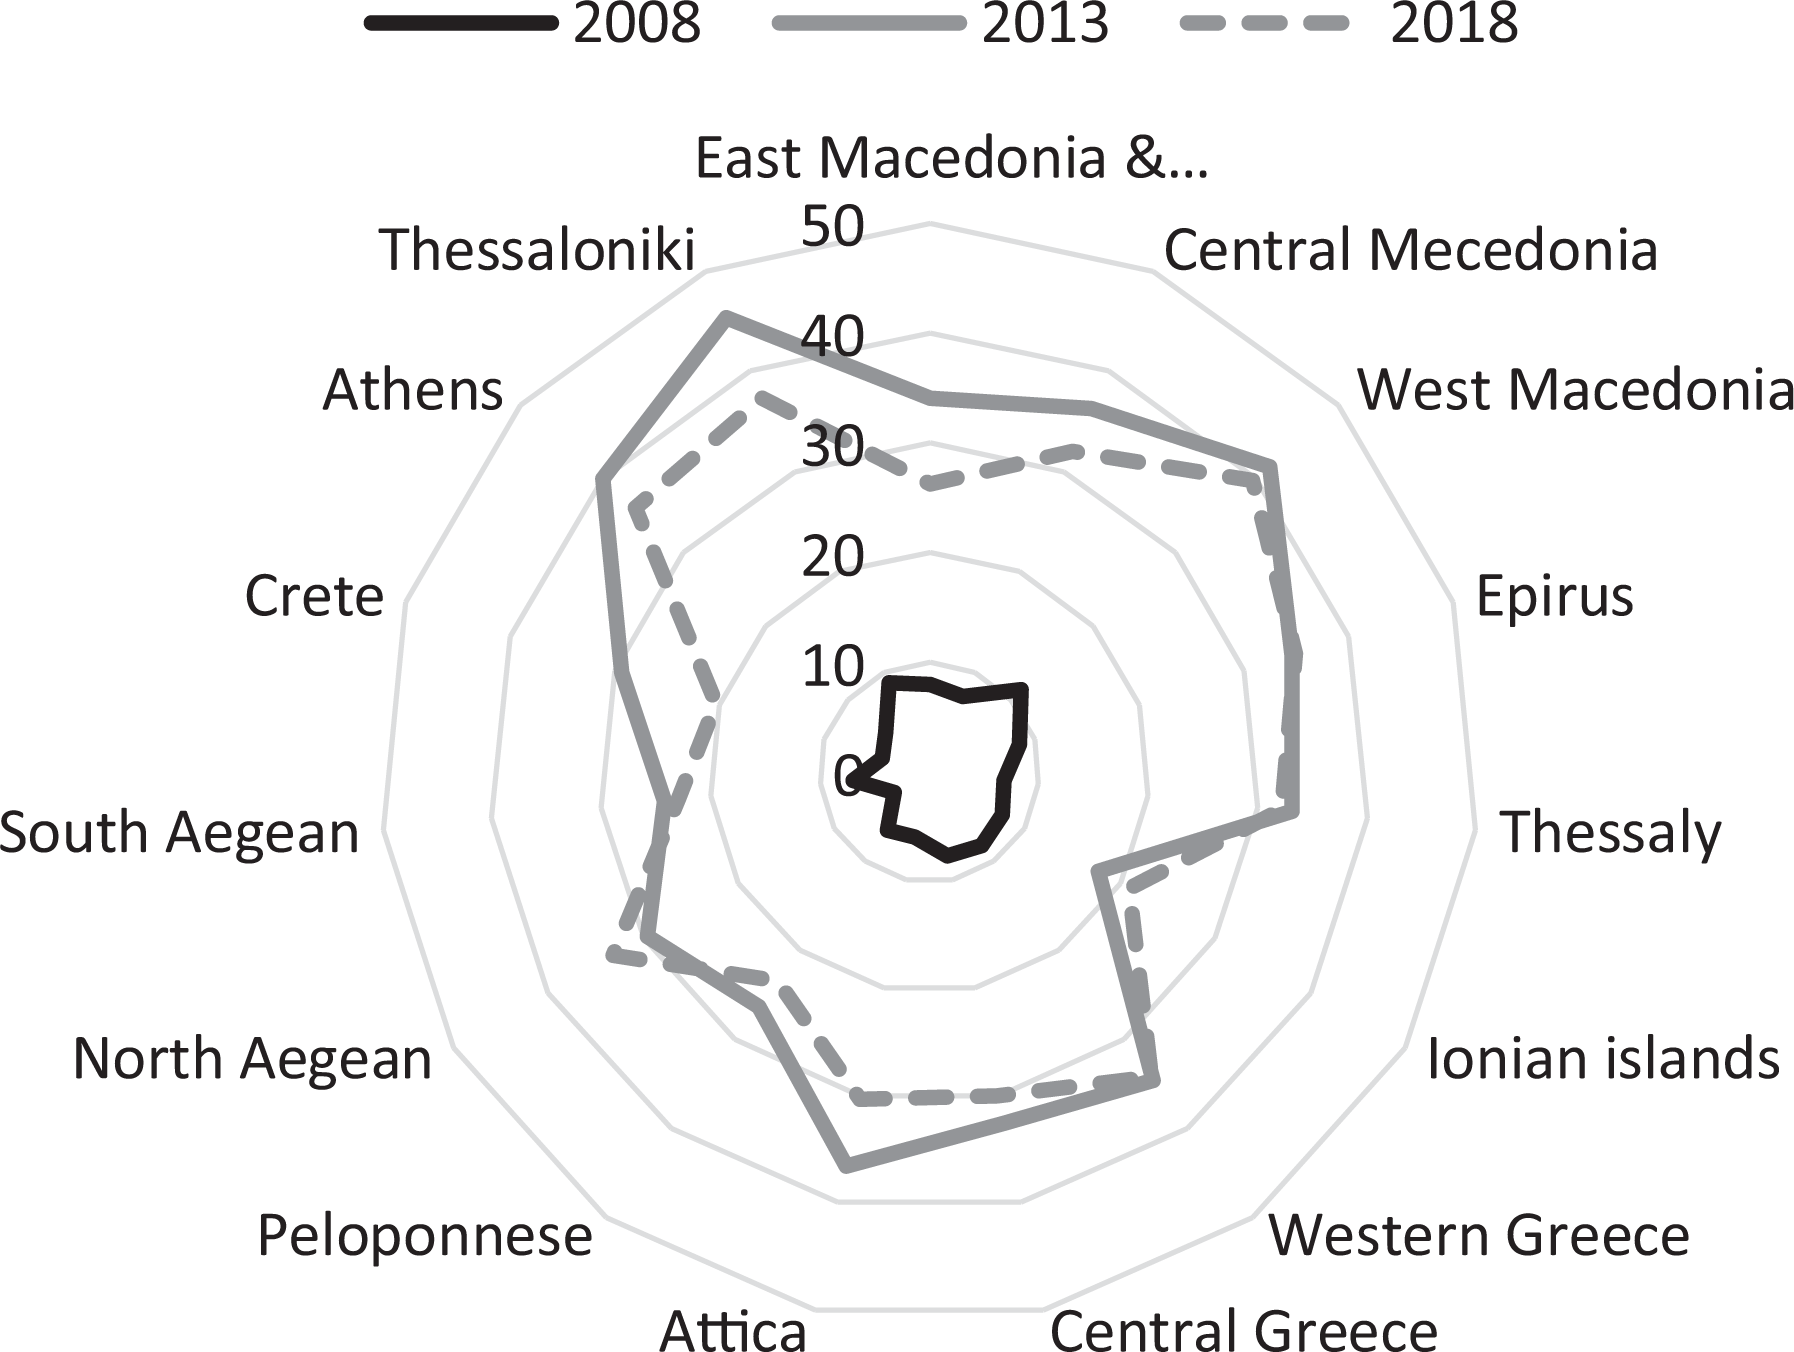
Estimates of net/“baseline” unemployment by region (regional fixed effects).
Labor Market Shocks and Price/Endowment Adjustments—Decomposition Analysis
As mentioned in section 2, to examine the price and compositional changes across the periods of crisis and recovery, as well as the extent of the aggregate shock in each period, we implement the so-called detailed decomposition analysis using the Oaxaca-Ransom (pooled) method. To do so, we draw on the unemployment models that control for selection into activity, as presented in the right panel of Table 1. Doing so for the full set of regions produces a very large number of results which we cannot present, or discuss, in full here. Instead, we focus our analysis—besides the national level—to two regional groups, comprising of the metropolitan region (Athens) and the rest of the country (Rest of Greece). As mentioned previously, our interest on the case of Athens derives from the fact the Greek capital represents around a third of the national economy, being by far the largest urban area in the country and having the greatest concentration of political and financial capital and business services. In addition, Athens possesses significantly higher levels of human capital (average years of schooling) and, as we saw earlier, has a more competitive labor market, characterized by below-average female employment penalties and above-average education employment premia. Region-specific results for the rest of the country are presented in full in the Appendix (Table A2) and discussed here selectively.
We present the results from the decomposition analysis in Table 2. As can be seen at the top panel, the rise in unemployment in Greece between 2008 and 2013 was of about 21 percentage points, a near-tripling of the unemployment rate (by 293%). The increase in Athens and the rest of Greece was of 29 and 19 percentage points, respectively (397% and 250% in terms of rates of change). 17 Selection contributed significantly to keeping this increase relatively dampened: controlling for selection produces a predicted change that is by 23% higher than that actually observed in the data (296.6% versus 292.9%). In contrast, during the recovery, selection seems to make much less of a difference, as the estimated rate of change of unemployment with and without selection is almost identical (−31.3% and −30.2%). In this period, unemployment declined by 7 percentage points in Athens and by 10 percentage points in the rest of Greece—owing mainly to developments in some peripheral regions (Epirus, Crete) as well as in the more metropolitan regions of Thessaloniki and Attiki (see Table A2 in Appendix). As a result, in 2018 Athens had a higher unemployment rate than the average seen in the rest of the country (22.3% versus 18.8%).
Detailed Decomposition of the Change in Unemployment.
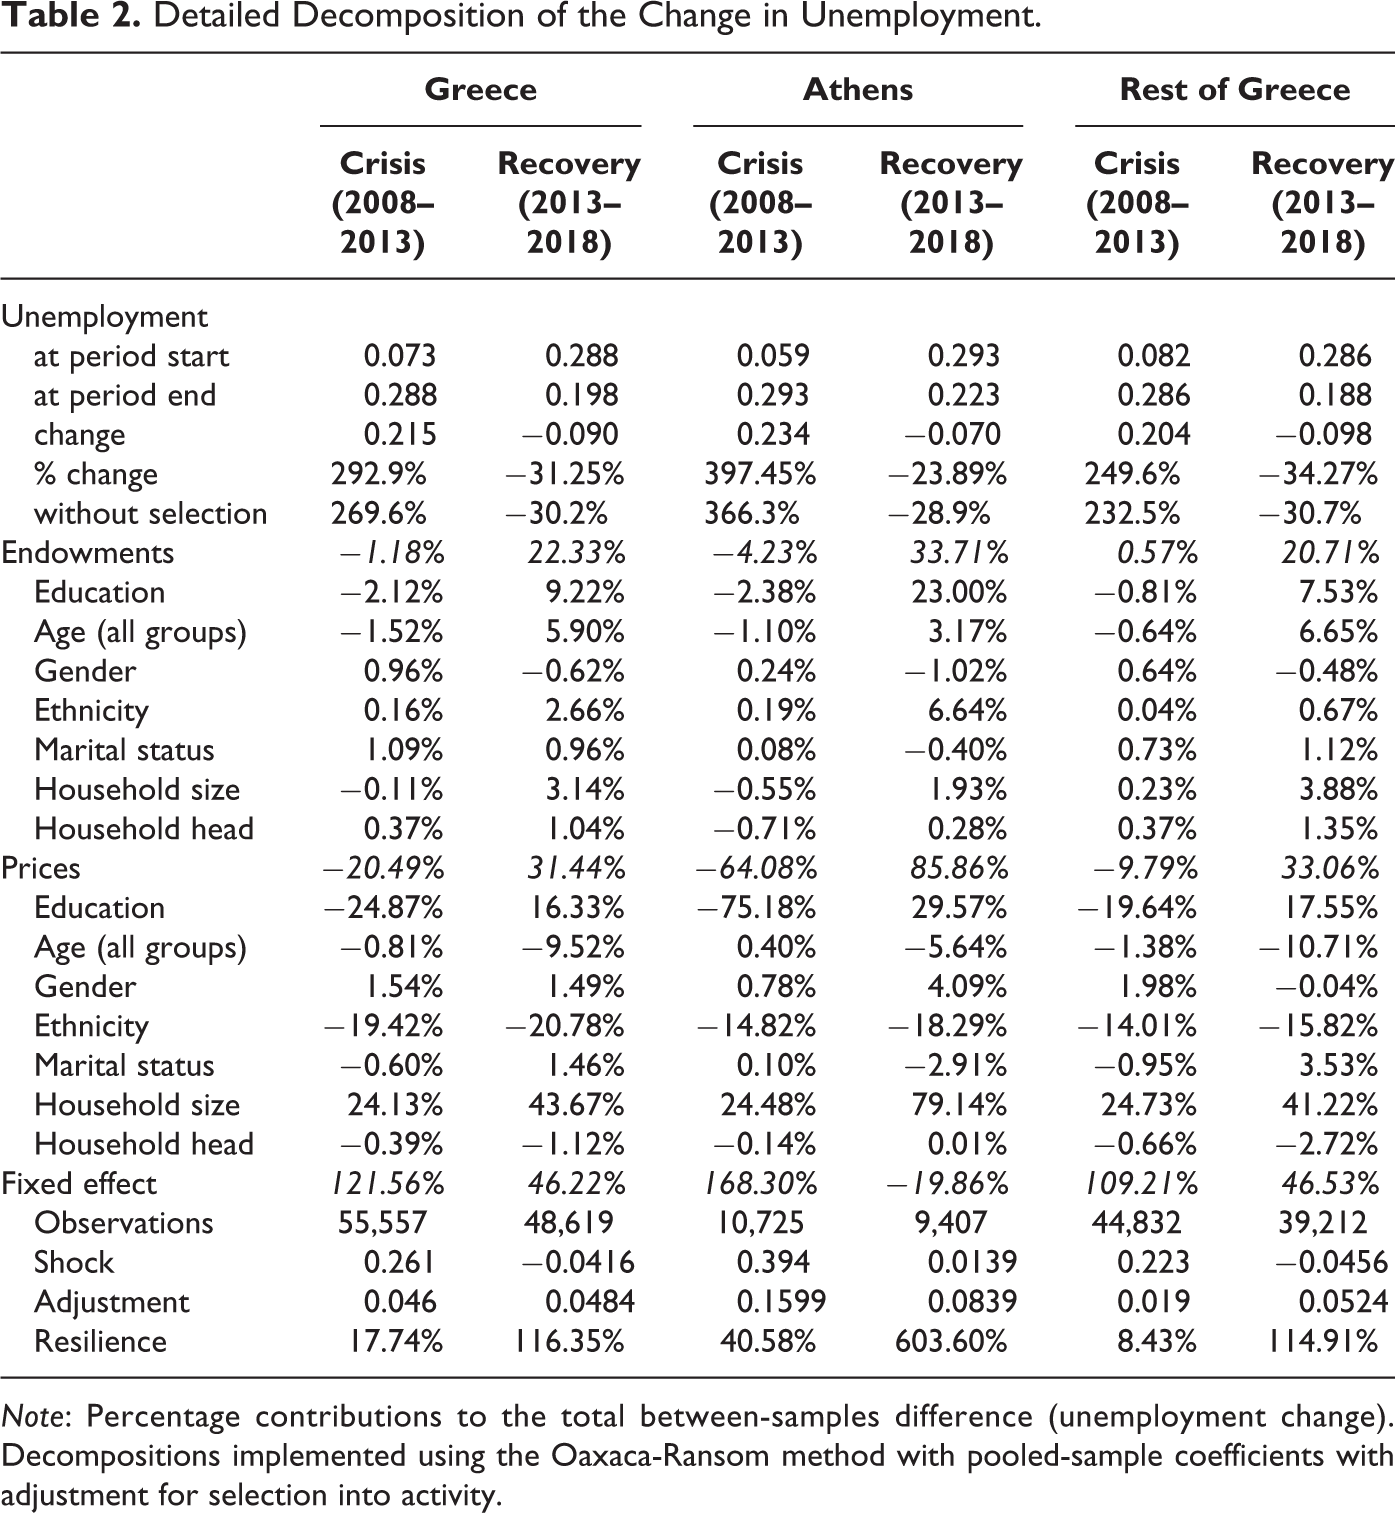
Note: Percentage contributions to the total between-samples difference (unemployment change). Decompositions implemented using the Oaxaca-Ransom method with pooled-sample coefficients with adjustment for selection into activity.
Of more interest, of course, are the results from the decomposition analysis. Drawing on this, we present in Table 2 three “aggregate” components (endowments, prices, and fixed-effect) as well as the detailed sub-components for the price and endowment effects. As was discussed in section 2, the estimated fixed effects represent the change in the intercepts of the underlying unemployment regressions (adjusted to correct for the “decomposition identification problem”) between two years, thus showing the (potential) rise in unemployment that is specific to the period defined by these two years (crisis or recovery), irrespective of changes in the composition of the labor force (the “endowment” component) and in the valuation of the various labor force characteristics (the remainder of the “price” component) that may have taken place in that period. On this basis, we can interpret the “fixed effect” as a measure of the overall shock to the labor market (whether positive or negative) and, consequently, all other “explained” and “unexplained” components as the (compositional and price-related) adjustments that took place in response to the shock. We present our measures of shock and adjustment in absolute values at the bottom panel of Table 2, while the main part of the table presents the contribution of these components to the total change in unemployment (in percentage terms).
Our interpretation of the fixed effect as a measure of the (exogenous) shock to the economy is supported by our empirical results. As can be seen, in all cases during the crisis period the fixed effect component is greater than 100%, i.e. it is larger than the actual increase in unemployment observed in the data. The size of the shock appears very different between the metropolitan region of Athens and the rest of the country. Nationally, the shock is calculated at around 122% of the actual rise in unemployment, corresponding to an increase of 26.1 percentage points (i.e., from 7.3% to 33.4%). In Athens, however, the shock was much bigger, both in absolute size and in percentage terms: it was about 168% of the actual rise in unemployment observed in the capital, or equivalent to 39.4 percentage points of additional unemployment (i.e., from 6% to 45%). Instead, the shock in the rest of the country was only 9% higher than the actual rise in unemployment, equivalent to about 22 percentage points of additional unemployment. 18
At the same time, however, adjustment to the shock was also much greater in Athens than in the rest of Greece. As can be seen, Athens saw a very sizeable adjustment through the price component, accounting for −64% of the total unemployment change. The rest of the country saw a much more modest adjustment through prices (collectively at 9.7% and exceeding values of 30% only in the South Aegean, East Macedonia & Thrace, Central Greece, Thessaly and the Ionian islands), thus resulting in an overall value of adjustment via then price component at 20.5% nationally. In contrast, adjustment through the endowment component (compositional changes) has been much more modest—at 4.2% in Athens and at near 0% in the rest of the country.
The recovery period shows many interesting differences compared to the crisis. Nationally, the shock experienced was this time positive, accounting for 46% of the total unemployment change (falling unemployment) during the period 20013–2018. This was similar for most regions in the country. In Athens, however, the shock continued to be negative, suggesting that exogenous conditions remained adverse there, applying negative pressures on the local labor market (pushing unemployment up). In this period, compositional changes contributed much more significantly to the reduction of unemployment (e.g., by 22% nationally in the recovery period compared to by 1.8% in the crisis); while price adjustments also moved in the same direction and also in a more intense degree (e.g., 31.4% versus 20.5%, respectively for the two periods at the national level). Here, too, however, Athens presents a significantly different experience compared to the rest of the country. 19 For Athens, adjustment through prices is almost three times as high as in the rest of the country, while adjustment through changes in the labor endowment (a measure of labor quality) is one-and-half times higher—resulting in an estimated decline in unemployment (relative to the potential value) of 8.4 percentage points, compared to 5.2 for the rest of the country (see the “adjustment” values in Table 2).
Concerning the overall (national-level) results, the obtained patterns are not too surprising: as is well known, the crisis in the Greek labor market came exogenously through a fiscal policy shock, which affected hugely liquidity and demand conditions in the economy (including demand for labor) but had little to do with any prior shifts in the supply or quality of labor in the country (Monastiriotis 2011). Thus, the endowment (“explained”) component contributed little to changes in unemployment. In turn, the recovery was combined with significant shifts in the supply of labor (including through emigration and withdrawals into inactivity), which apparently affected unemployment favorably, contributing by a fifth to its reduction between 2013 and 2018. Comparing the results with and without selection suggests that selection into inactivity had a negative effect, lowering the quality of the labor endowment (as not controlling for selection produces a lower decline in unemployment due to the endowment effect—results not shown but available upon request). On the whole, however, the endowment effect has contributed to lowering unemployment in both periods—showing that the overall quality of the labor endowment went up, both during the crisis and after. This, despite common perceptions that the emigration wave instigated by the crisis has led to a significant lowering of the quality of the labor endowment in the country (through brain-drain—Cavounidis 2013; Labrianidis 2014). 20
Turning to the detailed decomposition results, we see that few of the variables produce effects of any significant magnitude. Among them, education stands out as the main contributor to adjustment. In terms of the endowment effect of education, this led to an adjustment (abating the rise in unemployment) by some 2.4% in Athens and 0.8% in the rest of the country during the crisis; and a much larger adjustment (pushing again towards lower unemployment) during the recovery period—accounting for as much as 23% of the unemployment change in Athens, some three times more than in the rest of the country. Two other variables appear to have had a significant, in terms of magnitude, impact on unemployment adjustments, both through the price component. Of them, ethnicity contributed to lowering unemployment during the crisis (by 19.4% nationally) but had an effect in the opposite direction (raising unemployment) during the recovery period (by 20.8% nationally)—reflecting the cyclical patterns of intensified and then subsiding sorting on the basis of ethnicity seen earlier (see Table 1). Instead, price changes for the household size variable worked toward pushing unemployment up during the crisis period but down during the recovery period. 21 In the recovery period, the price effect for household size appears particularly large, especially in Athens, where it accounts for over 90% of the total price adjustment (79% of the total adjustment overall)—while for the rest of the country its contribution is almost halved. Of the remaining components, the role of the age variables is perhaps worth highlighting, as it shows systematically larger adjustments in the recovery period and in the regions outside Athens, but with the endowment and price effects moving in opposite directions.
Quite clearly, these patterns of adjustment reflect a substantial variation in the degree (and quality) of economic resilience between Athens and the rest of the Greek territory—with Athens showing evidence of a very high degree of resilience both during the crisis and in the economic recovery (see last row of Table 2). 22 In the crisis period, our results suggest that in response to the crisis employers in Athens started sorting individuals much more intensively on the basis of their education—both in comparison to 2008 and in relation to the rest of Greece—thus pricing out of employment individuals with lower educational qualifications and (apparently) maintaining a disproportionate number of jobs relative to the size of the shock in the economy. 23 Adjustment through the price of education was significant also in the rest of Greece, but much smaller in magnitude (4.0 percentage points or 19.6%). As a result, the combined effect of the shock (“fixed effect”) and the price adjustment of education was a rather comparable rise in unemployment between Athens and the rest of Greece (21.8 versus 18.3 percentage points), despite the fact that the original shock to the Athens economy was over 1.7 times higher than in the rest of the country. In the recovery period, employment sorting on the basis of education continued to intensify in Athens faster than in the rest of the country, helping the economic recovery. But also important were changes in the educational composition of the Athenian workforce, which were more advantageous than in the rest of the country; while changes in the incidence of unemployment within households also helped (with potential second-income earners in Athens getting back into the job-ladder faster than in the rest of Greece). In that, it appears that the advantageous record of Athens with regard to its economic resilience has to do both with the better functioning of its labor market (e.g., shifts in labor demand showing employment sorting on the basis of education) and with its higher attractiveness (shifts in labor supply leading to improvements in labor quality with regard to education). We discuss the implications of this, as well as of our overall analysis more generally, in the concluding section.
Conclusions
Despite the attention afforded to the Greek economy following the country’s immense crisis since 2009, analysis of how the labor market adjusted to the economic shock, both during the crisis and in the subsequent recovery, remains limited. Our analysis in this paper sought to partly fill this gap. By relying on individual-level micro-data and utilizing recently advanced decomposition techniques for non-linear models, we were able to identify not only how the crisis affected the individual unemployment probabilities of various groups and for different labor force characteristics, but also—and more crucially—how the crisis played out more generally in the Greek labor market at the regional and national levels. Our detailed decomposition showed that the overall extent of the shock was notably bigger than the actual rise in unemployment—suggesting that some partial adjustment did in fact take place. A small part of this adjustment had to do with changes in the composition of the workforce (labor endowment/quality): at the height of the crisis in 2013, those in employment had better-quality marketable characteristics (e.g., education) and exogenous characteristics typically associated with less unemployment (e.g., being male). As only a part of this was accounted for by selection/flows into and out of inactivity (with inflows into the workforce by previously inactive more qualified individuals), there is an implication that an important part of this “labor-quality” adjustment happened through migration—both international and, in the case of Athens, inter-regional.
By far, however, the main adjustment happened through the adjustments in shadow prices (“price effect”), i.e. through an intensified sorting of individuals on the basis of their characteristics. Driven mainly by developments in the Athens economy, nationally this sorting-based adjustment was mostly related to the education variable. In response to the crisis, employers started valuing education more and thus more educated individuals became more successful in maintaining/obtaining jobs at the expense of individuals with lower educational qualifications. In the periphery, however, this rather welcome market mechanism operated much less strongly. Instead, the main vehicle of price adjustment there was a change in the “valuation” of ethnicity, with foreign-born individuals being “priced-out” from jobs (and presumably a sub-set of them exiting the Greek labor market via return migration).
During the recovery Athens continued to experience a negative shock, unlike the rest of the country, but also continued to exhibit much superior adjustment. Education sorting intensified even further everywhere in the country and this time labor-quality adjustments became more prevalent, accounting for between 34% (in Athens) and 21% (in the rest of Greece) of the unemployment decline during the period. Thus, while the unemployment decline during the recovery period appears to have been rather uniform across the country, the dynamics that led to this are very heterogeneous geographically.
There is an important lesson that comes out from these results, which should be of interest both to policy and to the wider discussion about economic resilience of places. Although aspects such as “structure,” “competitiveness,” etc—as identified in the literature (see, inter alia, Di Caro and Fratesi 2018; Martin et al. 2016)—of course play a role for economic resilience, our results highlight quite uniquely in the regional literature the very prominent role played by the functioning of the labor market for the economic resilience of regions—and for their ability to adjust to shocks more generally. While macro-economic policy-making does pay attention on the labor market (e.g., recommending reforms to increase flexibility), our results show that there are substantial regional variations in the degree (and types) of labor market adjustments and thus that labor market policy should also pay attention to the sub-national level, seeking to improve labor market functioning across geographical areas. For regional policy, inversely, as well as for the regional literature on economic resilience, our results suggest that more attention should be placed on the labor market of regions, over and beyond the traditional attention afforded to aspects of structure and competitiveness (specializations, accessibility, etc) or to macroeconomic measures of adjustability (e.g., in relation to the Okun coefficient). Moreover, attention should be paid to the advantageous position that national metropoles may have over the rest of the national territory in achieving economic resilience 24 , through their ability to attract more competitive individuals at the expense of other regions—as is indicated in our analysis by the sizeable endowment effect for the education variable in Athens during the economic recovery.
Footnotes
Appendix
Decomposition Results and Analysis by Region.
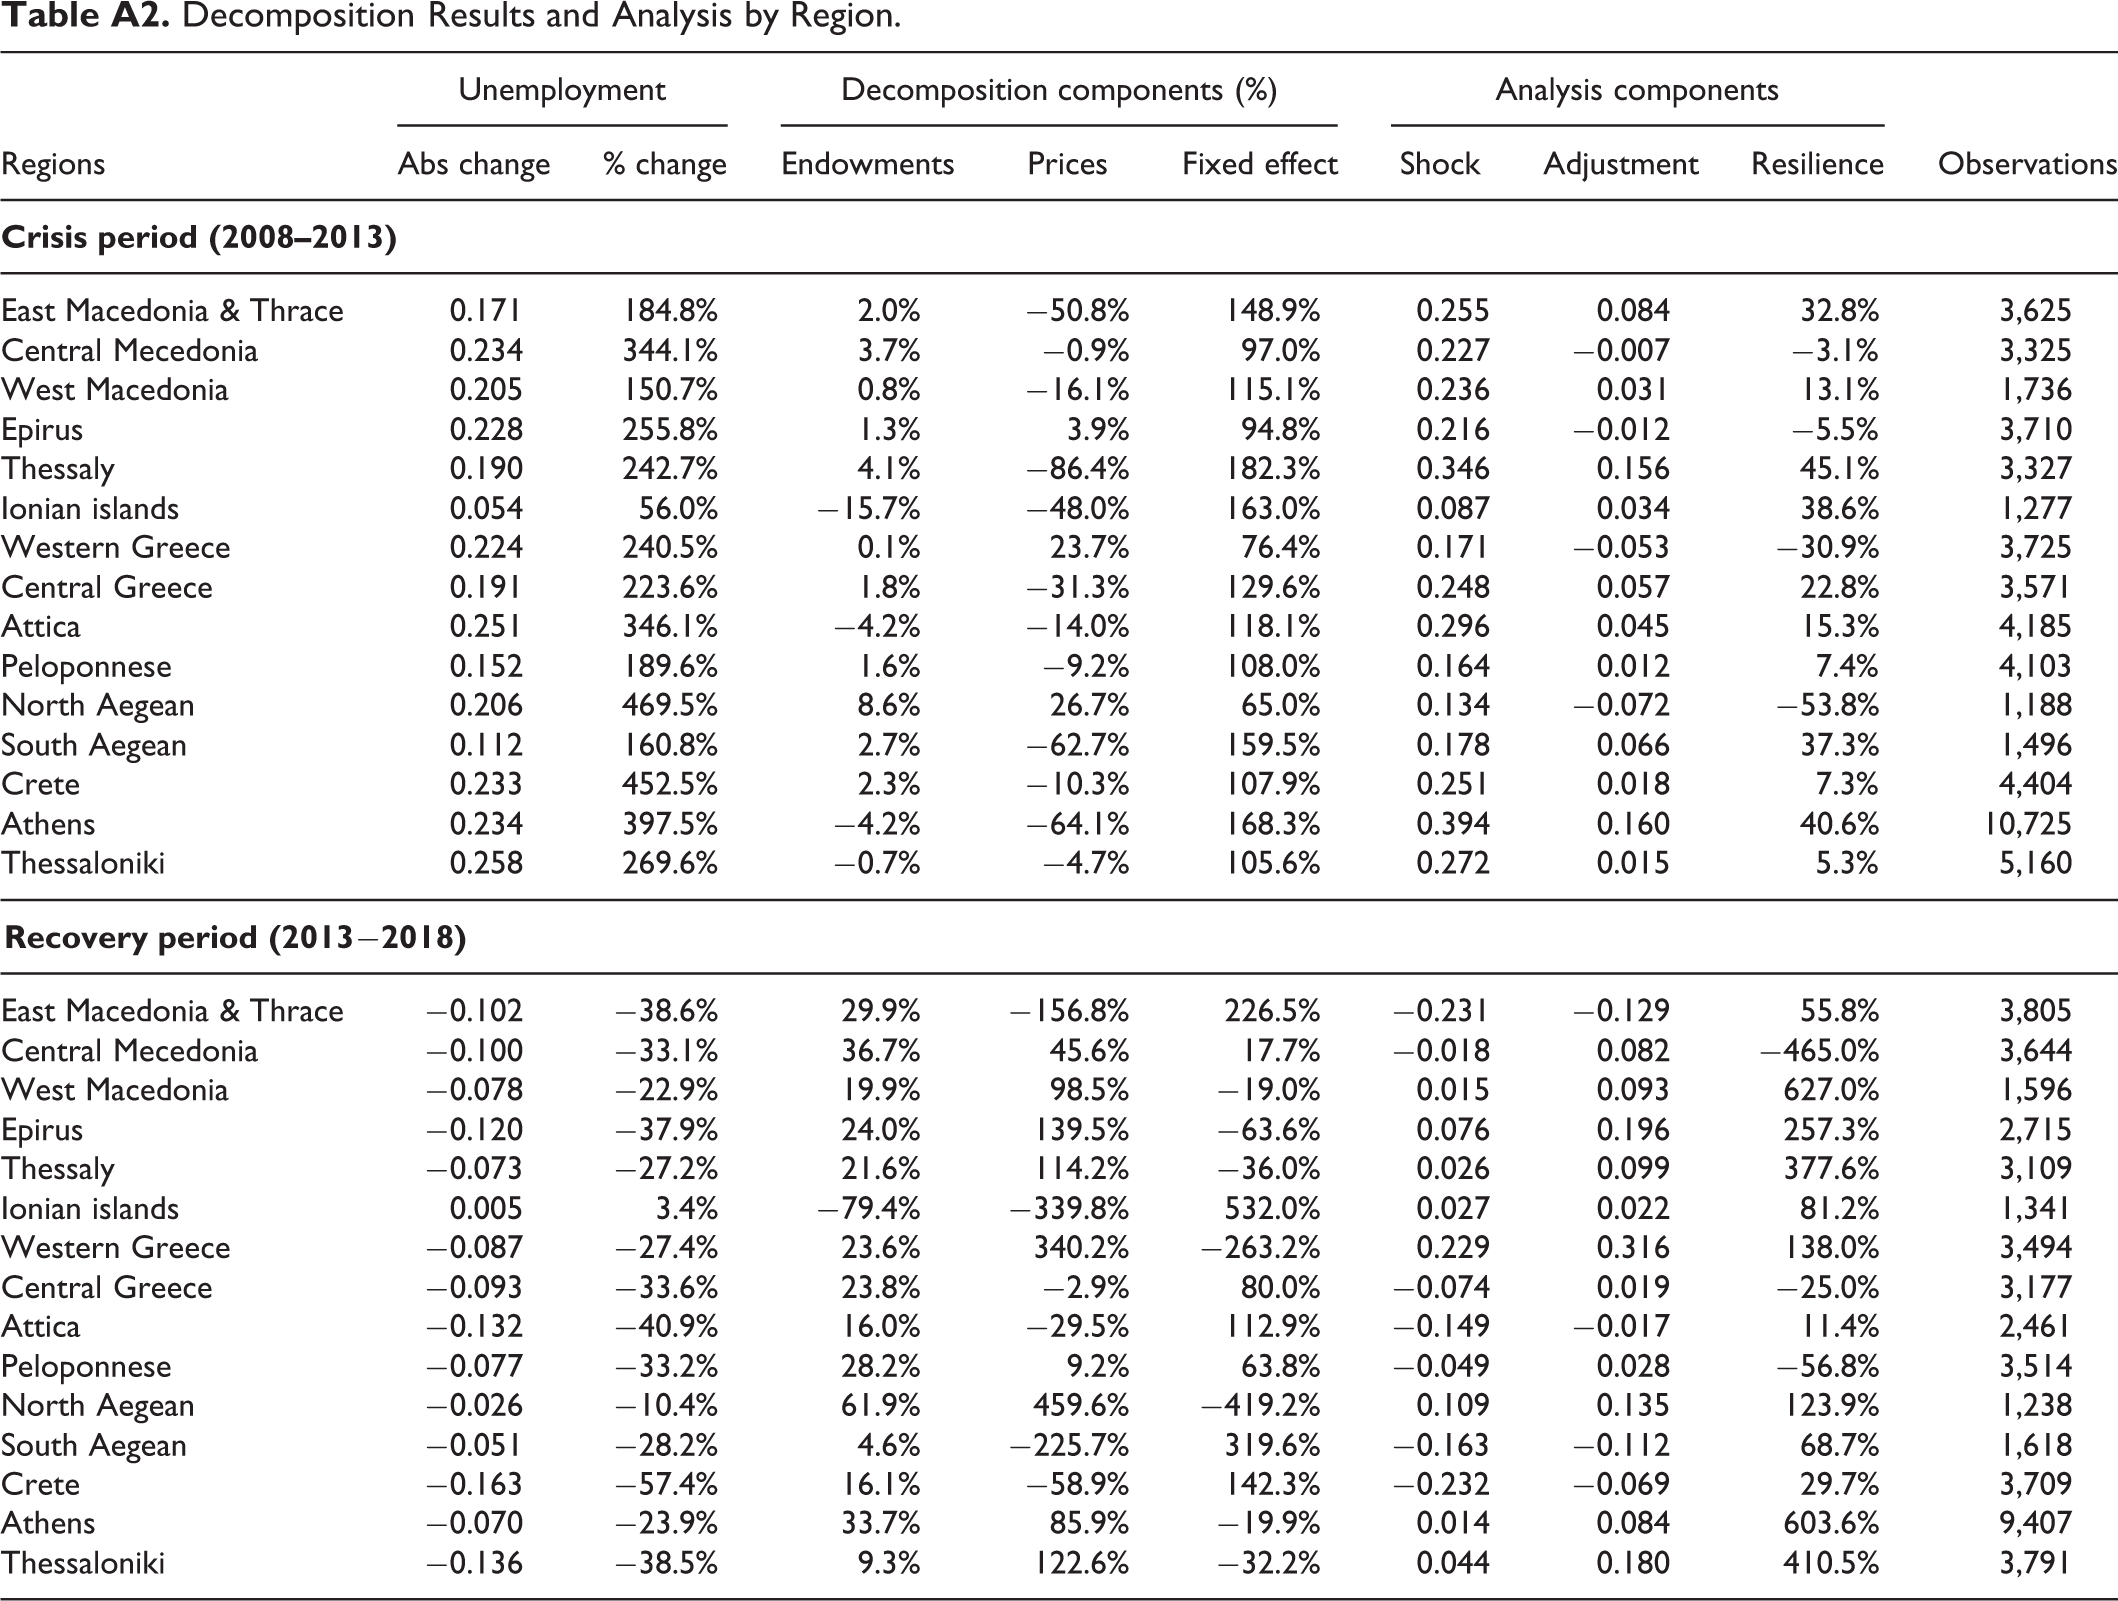
| Regions | Unemployment | Decomposition components (%) | Analysis components | Observations | |||||
|---|---|---|---|---|---|---|---|---|---|
| Abs change | % change | Endowments | Prices | Fixed effect | Shock | Adjustment | Resilience | ||
|
|
|||||||||
| East Macedonia & Thrace | 0.171 | 184.8% | 2.0% | −50.8% | 148.9% | 0.255 | 0.084 | 32.8% | 3,625 |
| Central Mecedonia | 0.234 | 344.1% | 3.7% | −0.9% | 97.0% | 0.227 | −0.007 | −3.1% | 3,325 |
| West Macedonia | 0.205 | 150.7% | 0.8% | −16.1% | 115.1% | 0.236 | 0.031 | 13.1% | 1,736 |
| Epirus | 0.228 | 255.8% | 1.3% | 3.9% | 94.8% | 0.216 | −0.012 | −5.5% | 3,710 |
| Thessaly | 0.190 | 242.7% | 4.1% | −86.4% | 182.3% | 0.346 | 0.156 | 45.1% | 3,327 |
| Ionian islands | 0.054 | 56.0% | −15.7% | −48.0% | 163.0% | 0.087 | 0.034 | 38.6% | 1,277 |
| Western Greece | 0.224 | 240.5% | 0.1% | 23.7% | 76.4% | 0.171 | −0.053 | −30.9% | 3,725 |
| Central Greece | 0.191 | 223.6% | 1.8% | −31.3% | 129.6% | 0.248 | 0.057 | 22.8% | 3,571 |
| Attica | 0.251 | 346.1% | −4.2% | −14.0% | 118.1% | 0.296 | 0.045 | 15.3% | 4,185 |
| Peloponnese | 0.152 | 189.6% | 1.6% | −9.2% | 108.0% | 0.164 | 0.012 | 7.4% | 4,103 |
| North Aegean | 0.206 | 469.5% | 8.6% | 26.7% | 65.0% | 0.134 | −0.072 | −53.8% | 1,188 |
| South Aegean | 0.112 | 160.8% | 2.7% | −62.7% | 159.5% | 0.178 | 0.066 | 37.3% | 1,496 |
| Crete | 0.233 | 452.5% | 2.3% | −10.3% | 107.9% | 0.251 | 0.018 | 7.3% | 4,404 |
| Athens | 0.234 | 397.5% | −4.2% | −64.1% | 168.3% | 0.394 | 0.160 | 40.6% | 10,725 |
| Thessaloniki | 0.258 | 269.6% | −0.7% | −4.7% | 105.6% | 0.272 | 0.015 | 5.3% | 5,160 |
|
|
|||||||||
| East Macedonia & Thrace | −0.102 | −38.6% | 29.9% | −156.8% | 226.5% | −0.231 | −0.129 | 55.8% | 3,805 |
| Central Mecedonia | −0.100 | −33.1% | 36.7% | 45.6% | 17.7% | −0.018 | 0.082 | −465.0% | 3,644 |
| West Macedonia | −0.078 | −22.9% | 19.9% | 98.5% | −19.0% | 0.015 | 0.093 | 627.0% | 1,596 |
| Epirus | −0.120 | −37.9% | 24.0% | 139.5% | −63.6% | 0.076 | 0.196 | 257.3% | 2,715 |
| Thessaly | −0.073 | −27.2% | 21.6% | 114.2% | −36.0% | 0.026 | 0.099 | 377.6% | 3,109 |
| Ionian islands | 0.005 | 3.4% | −79.4% | −339.8% | 532.0% | 0.027 | 0.022 | 81.2% | 1,341 |
| Western Greece | −0.087 | −27.4% | 23.6% | 340.2% | −263.2% | 0.229 | 0.316 | 138.0% | 3,494 |
| Central Greece | −0.093 | −33.6% | 23.8% | −2.9% | 80.0% | −0.074 | 0.019 | −25.0% | 3,177 |
| Attica | −0.132 | −40.9% | 16.0% | −29.5% | 112.9% | −0.149 | −0.017 | 11.4% | 2,461 |
| Peloponnese | −0.077 | −33.2% | 28.2% | 9.2% | 63.8% | −0.049 | 0.028 | −56.8% | 3,514 |
| North Aegean | −0.026 | −10.4% | 61.9% | 459.6% | −419.2% | 0.109 | 0.135 | 123.9% | 1,238 |
| South Aegean | −0.051 | −28.2% | 4.6% | −225.7% | 319.6% | −0.163 | −0.112 | 68.7% | 1,618 |
| Crete | −0.163 | −57.4% | 16.1% | −58.9% | 142.3% | −0.232 | −0.069 | 29.7% | 3,709 |
| Athens | −0.070 | −23.9% | 33.7% | 85.9% | −19.9% | 0.014 | 0.084 | 603.6% | 9,407 |
| Thessaloniki | −0.136 | −38.5% | 9.3% | 122.6% | −32.2% | 0.044 | 0.180 | 410.5% | 3,791 |
Acknowledgments
Part of this paper was written while Vassilis Monastiriotis was visiting the University of Macedonia (Greece). Special thanks to our colleague Theodore Panagiotidis for facilitating this. We are also thankful to Rebekka Christopoulou for her useful comments and help with some data issues; and to Enrique Lopez-Bazo and Tamas Bartus for their suggestions on the application of the non-linear decomposition.
Declaration of Conflicting Interests
The author(s) declared no potential conflicts of interest with respect to the research, authorship, and/or publication of this article.
Funding
The author(s) received no financial support for the research, authorship, and/or publication of this article.