
Abstract
Narcissistic CEOs have been found to invest in corporate social responsibility (CSR) in prior research, but the empirical results are not straightforward. To address this, we bring in the institutional context as a moderator. We build on neo-institutional theory to argue that the institutional context shapes what audiences value and find legitimate in terms of CSR behaviors: Corporate philanthropy, a form of tactical CSR, is appreciated in liberal market economies (LMEs) but less so in coordinated market economies (CMEs), whereas strategic CSR, which requires a long-term horizon and substantial resource investments, is considered legitimate in CMEs but less so in LMEs. We theorize that narcissistic CEOs will try to pursue excellence (among their peers) in CSR activities that align with the norms and expectations in their institutional context in order to gain praise and avoid disapproval from their audiences and to bolster their moral superiority. Hence, we expect that the institutional context will moderate the relationship between CEO narcissism and CSR behavior such that in LMEs narcissistic CEOs will engage more in philanthropy than their peers but not in strategic CSR, whereas in CMEs they will invest more in strategic CSR but not in philanthropy. We test our predictions using panel data (2002-2023) from 148 large firms and 493 CEOs operating in 18 countries. Our pattern of findings supports our theory. By developing and testing a theoretical mechanism that connects macro-level institutional context with micro-level firm and CEO behavior, we contribute to both strategic leadership and CSR literature.
Keywords
Corporate social responsibility (CSR), covering all voluntary firm activities beyond those required by law, benefiting not just the firm’s owners but also other stakeholders (McWilliams & Siegel, 2001), has gained substantial attention in academic research (e.g., Boone, Buyl, Declerck, & Sajko, 2022a; Wang, Tong, Takeuchi, & George, 2016) as well as in business practice. As an illustration of the latter, in his annual CEO letters, Larry Fink, CEO and chairman of investment corporation BlackRock, has repeatedly urged CEOs to incorporate environmental and social criteria in their strategies. 1 In line, scholars increasingly recognize the key impact of CEOs, as firms’ chief strategists and main decision makers, on their firms’ CSR activities. Recent research has shown that CEOs indeed have a major influence on how much their firms invest in CSR—about 30% of total variance in CSR can be attributed to the CEO (Wernicke, Sajko, & Boone, 2022)—and scholars found that (a lack of) CSR was connected to CEOs’ traits, values, and motives, such as greed (Sajko, Boone, & Buyl, 2021), political ideology (Chin, Hambrick, & Trevino, 2013), and overconfidence (Sauerwald & Su, 2019).
One CEO trait that has gained particular attention in prior CSR research is narcissism (e.g., Al-Shammari, Rasheed, & Al-Shammari, 2019; Al-Shammari, Rasheed, & Banerjee, 2022; Petrenko, Aime, Ridge, & Hill, 2016). This scholarly interest is not surprising given the clear intuitive link between CEO narcissism and CSR—that is, narcissists are known for their constant craving for attention and admiration from external audiences (Chatterjee & Hambrick, 2007, 2011), whereas such external audiences are pressuring firms to invest in CSR (Hawn & Ioannou, 2016). As a result, CSR activities may allow narcissistic CEOs to bolster their moral feelings of superiority and give them their desired spot in the limelight (Petrenko et al., 2016)—such activities generally attract (positive) media attention, are reported in publicly available CSR statements, and boost the firm’s public image, bringing about praise and prestige (DesJardine, Bansal, & Yang, 2019; Tang, Mack, & Chen, 2018). A recent meta-analysis indeed found a positive relationship between CEO narcissism and an overall measure for CSR (Wang, Devine, Molina-Sieiro, & Holmes, 2024). However, the effect found in this meta-analysis was relatively small; hence, despite the clear theoretical link between CEO narcissism and CSR, so far the empirical results have been rather inconclusive, which presents an interesting conundrum.
In our study, we attempted to disentangle this conundrum by bringing in the institutional context. Crossland and Hambrick (2011) already demonstrated that CEOs’ effects on organizational outcomes vary across (country-level) institutional contexts. Yet, such contexts still appear to have largely been ignored in prior strategic leadership research (Wang et al., 2024; for an exception, see Boone, Lokshin, Guenter, & Belderbos, 2019). Even more, bringing in the institutional context is particularly relevant for studying CEO narcissism and highly value-laden behaviors such as CSR because it is well established in the neo-institutional theory and comparative corporate governance literature that social norms and what is admired in terms of CSR behavior are majorly affected by the institutional context in which the firm is embedded (Aguilera, Rupp, Williams, & Ganapathi, 2007; Campbell, 2007; DiMaggio & Powell, 1983). The institutional context determines what is regarded to be the “societal role of firms” and hence what is evaluated as good in terms of CSR (Matten & Moon, 2020). Because of their constant craving for attention and admiration, we therefore theorize that the institutional context will be a vital factor driving narcissistic CEOs to tailor their firms’ CSR behavior to what core external audiences value.
We specifically focused on national institutional systems—and especially “varieties of capitalism” or the distinction between liberal market economies (LMEs) and coordinated market economies (CMEs) (Hall & Soskice, 2001)—because prior research found that these national systems strongly determine social norms in terms of what is seen as firms’ societal role (Jackson & Apostolakou, 2010; Matten & Moon, 2008, 2020). In LME contexts, there typically is a strong ethic of stewardship and firms “giving back” to society (Ioannou & Serafeim, 2012; Maignan & Ralston, 2002). In such a context, corporate philanthropy—referring to a firm’s charitable donations (Adams, Hoejmose, & Kastrinaki, 2017)—is a favorable CSR activity. It can be seen as a tactical CSR activity; it is relatively short-term oriented and does not require substantial firm-specific resources or structural adjustments (Bansal, Jian, & Jung, 2015), which shareholders and other external audiences in LMEs generally appreciate (Godfrey, 2005). Hence, given their craving for admiration and awe, we expect that narcissistic CEOs in more liberal institutional contexts are more likely to excel among their peers in corporate philanthropy.
In CME contexts, the incentives to engage in corporate philanthropy historically have been much narrower than in LMEs given the more extensive cultural reliance on representative organizations (e.g., through employee representation, trade unions, environmental regulations, etc.; Matten & Moon, 2008) and, therefore, the higher levels of “institutionalized solidarity” (Jackson & Apostolakou, 2010). Instead, CSR practices that are tightly embedded in firms’ strategy (Aguinis & Glavas, 2013) and that reflect firms’ thorough engagement with stakeholders and commitment to ameliorate long-term firm success and survival (Suto & Takehara, 2020) are evaluated positively. Stakeholders in CME contexts value strategic CSR activities, defined as “corporate social activities that require long time horizons, large resource commitments and significant adjustments to organizational structures” (Bansal et al., 2015: 70). Hence, we expect that narcissistic CEOs in CMEs will excel in strategic CSR activities because this increases the probability of their gaining admiration and a spot in the limelight.
Testing our theoretical predictions using panel data (2002-2023) from 148 large firms and 493 CEOs operating in 18 countries, we found general support. We make two important contributions. First, as mentioned earlier, we contribute to upper-echelons research in general and CEO narcissism research in particular by bringing in the institutional context. Although the focus on the institutional context’s role has been growing (Neely, Lovelace, Cowen, & Hiller, 2020; Yamak, Nielsen, & Escribá-Esteve, 2014), most CEO research so far has still tested its predictions in a singular (often U.S.) institutional context, resulting in potentially “decontextualized” theories and empirical generalizations (Aldrich, 2009). In their recent meta-analysis on the link between strategic leaders and CSR, Wang et al. (2024) included country-level managerial discretion as a potential moderator to address this omission. We go beyond the approach of Wang et al. (2024) by explicitly theorizing about how institutional norms shape the different types of CSR behaviors that are valued by core audiences and how narcissistic CEOs tailor their CSR strategies to match the institutional context. That is, prior literature has already shown that CEOs matter when it comes to CSR (e.g., Wernicke et al., 2022); we add to this by studying how the impact of CEOs differs depending on the institutional context in which they are embedded.
Second, as we develop and test a theoretical mechanism that connects macro-level institutional context with micro-level firm and CEO behavior, we also contribute to institutional theory-based research on CSR, following recent calls for research that ties firm-level agentic choices to engage in particular CSR behaviors with a society’s institutional structures (Galleli & Amaral, 2025; Risi, Vigneau, Bohn, & Wickert, 2023). Our comparative approach, demonstrating that (narcissistic) CEOs adjust their behavior depending on the institutional context in which they are embedded, underscores the merit of their claim. At the very least, such an approach may help to account for inconsistencies in prior studies on the link between CEO narcissism and CSR.
Theory and Hypotheses
CEO Narcissism and CSR
Narcissists have “very inflated self-views” and “are preoccupied with having those self-views continuously reinforced” (Chatterjee & Hambrick, 2007: 351). A major underlying motive of narcissistic CEOs thus is their endless craving for acclaim. To maintain a positive self-image, they are in constant need of “narcissistic supply”—they incessantly need reinforcement of their grandiosity (Cragun, Olson, & Wright, 2020). Narcissistic CEOs therefore are likely to select strategies that spur instantaneous and continuous admiration from their core audience; they want to stand out among their peers and be recognized for being great leaders, and they will adapt their front-stage behavior accordingly (Lehman, O’Connor, Kovacs, & Newman, 2019). For instance, more narcissistic CEOs have been found to engage in bold strategic actions, such as aggressive acquisitions (Chatterjee & Hambrick, 2007), radical innovation (Kashmiri, Nicol, & Arora, 2017), and risk taking (Buyl, Boone, & Wade, 2019).
Similarly, the growing attention and pressure to invest in CSR may inspire narcissistic CEOs to engage in CSR-related behaviors (Al-Shammari et al., 2022), especially because CSR is value laden, and hence, excelling in terms of CSR may showcase their moral superiority (Petrenko et al., 2016). Prior research has indeed investigated this connection between CEO narcissism and CSR, but the results are not very consistent. For instance, Petrenko et al. (2016) found that CEO narcissism was positively related to CSR in general, but they also found that CEO narcissism reduced the effect of CSR on firm performance. Analogously, Tang et al. (2018) as well as Yook and Lee (2020) provided empirical evidence that CEO narcissism promotes CSR initiatives. In contrast, Al-Shammari et al. (2022) found an inverted U-shaped relationship. In a recent meta-analysis, Wang et al. (2024) found a relatively small positive effect of CEO narcissism on an overall measure of CSR.
To make sense of the equivocal findings, some CEO narcissism scholars suggested to unpack the umbrella CSR concept and distinguish between different types of CSR activities. For instance, Al-Shammari et al. (2019) found a positive association of CEO narcissism with fairly visible CSR activities, which focused on external stakeholders such as the broader community, but no significant association with more hidden CSR activities, which were directed at internal stakeholders such as employees. Similarly, Chen, Zhang, and Jia (2021) found that narcissistic CEOs allocated more attention to peripheral CSR—unrelated to the firm’s core business—but were less likely to attend to embedded CSR—focal to the firm’s strategy and competitive positioning. This aligns with Bollaert and Petit’s (2010: 366) stance that “[f]or narcissistic top managers, power and prestige are more important than the performance of the firm. They therefore concentrate on projects which are politically beneficial to them, but which may prevent their firm from adapting to its environment.” All of this suggests that narcissistic CEOs have a rather instrumental approach to CSR—that is, they will invest in specific CSR activities in as far as those activities help them to boost their ego and reputation.
A notable omission in previous studies on the link between CEO narcissism and CSR, though, is that their reasoning is rather context free. That is, they assume that CEOs’ audiences are relatively homogeneous and will be impressed by the same actions; for instance, innovation is generally rather univocally seen as admirable, and because of this, narcissistic CEOs will universally be inclined to invest in innovation (Kashmiri et al., 2017). However, prior research in the comparative corporate governance field (e.g., Aguilera et al., 2007) has indicated that this is not the case for CSR. CSR is a typical “social construction”: “differences across . . . institutional environments generate differences in the roles of various stakeholders within them (Jackson & Apostolakou, 2010; Matten & Moon, 2008), and therefore differences about how stakeholders’ needs, expectations and interests are conceptualized” (Ioannou & Serafeim, 2012: 838). All of this highlights the need to bring in the institutional context when studying the relationship between CEO narcissism and CSR, as we explain below.
Bringing in the Institutional Context: CSR Norms and Expectations in LMEs Versus CMEs
(Neo-)institutional theory has long underlined the importance of the institutional context for firms’ strategic decision makers because it defines the norms and values at play in the environment in which the firm operates and therefore what audiences in this context find appropriate and legitimate (Meyer & Rowan, 1977). Firms (and their CEOs) experience isomorphic pressures to conform to these norms in order to gain legitimacy (DiMaggio & Powell, 1983). Following a “sociologically informed view” (Smulowitz, Rousseau, & Bromiley, 2020), firms can be seen as embedded in institutional contexts, whose norms and values shape local expectations and drive those firms’ actions. Although these insights are “common knowledge” among (neo-)institutional scholars, the repercussions of firms’ embeddedness in their institutional contexts have mostly been ignored in strategy literature in general and strategic leadership research in particular (Wang et al., 2024). As an exception, Krause, Filatotchev, and Bruton (2016: 1366) highlighted the concept of “cultural-cognitive legitimacy,” which organizations achieve “first and foremost, by mimicking the predominant organizational standards of the culture in which a firm is seeking to build legitimacy.” These authors indeed found that firms adjusted their governance characteristics to the institutional context’s “culture”—driven by institutional norms and expectations.
This impact of the institutional context is all the more important for strategic decisions related to CSR because of its above-mentioned nature as socially constructed and value laden. Therefore, what audiences (stakeholders) value in terms of CSR differs substantially depending on the institutional context. In this respect, prior research on institutional contexts and comparative corporate governance has found solid evidence that groups of countries tend to share social norms and common principles (Ioannou & Serafeim, 2012; Jackson & Deeg, 2008). Hall and Soskice’s (2001) seminal “varieties-of-capital framework” clusters countries into LMEs and CMEs and highlights long-standing, historically entrenched institutional differences about what is considered to be a firm’s role in society and what is expected and valued in terms of CSR (Crane, Pallazo, Spence, & Matten, 2014; Desender & Epure, 2021; Matten & Moon, 2008, 2020; Whitley, 1999). 2
In LMEs (other than in CMEs), the government typically has not played a significant or active role in (e.g., the development of cities or communities), whereas firms have taken on leadership roles in the communities in which they operated (Maignan & Ralston, 2002; Vogel, 1992). Culturally, we see a general skepticism about big government in LMEs (especially in the United States), as well as a strong ethic of stewardship and “giving back” (Matten & Moon, 2020). It is considered “the duty of the man of Wealth” (Carnegie, 2006/1889: 10)—and, by extension, that of the corporation—to deploy surplus wealth (profits) for social purposes, relating to paternalism or noblesse oblige (Matten & Moon, 2020). These historical underpinnings are reflected in how firms present themselves on their corporate websites—that is, U.S. and U.K. (prime examples of LMEs) firms are much more eager to appear as “good citizens” than French and Dutch (prime examples of CMEs) firms—and in a general preference for corporate philanthropy in LMEs (Maignan & Ralston, 2002).
In addition, following the “Anglo American model” (Aguilera et al., 2007), a stock market-based financial system and contract-based labor relations are usually in place, which makes firms (and their CEOs) very much aware of the competitive market rationale (Lee, 2020). Financial stakeholders, such as shareholders and investors (e.g., investment companies), are the most salient stakeholders (Aguilera et al., 2007; Desender & Epure, 2021), and shareholder primacy—that is, the principle that the maximization of value for shareholders should be firms’ primary purpose (Friedman, 1962)—has become “a defining feature” (Goranova & Ryan, 2021: 3). To illustrate, between 1997 and 2019, all versions of the “Principles of Corporate Governance” issued by the Business Roundtable, an association of more than 180 CEOs of large U.S. firms, have endorsed shareholder primacy as a guiding principle. 3 The reliance on the stock market as the most prominent source of capital and the salience of shareholder-value-driven stakeholders imply that firms need to be profit oriented and provide high levels of transparency to their investors.
In terms of CSR, these shareholders and investors are mostly interested in firms’ engagement in CSR practices that are clearly visible and immediately associated with profitability (Aguilera et al., 2007). That is, they appreciate tactical CSR activities such as corporate philanthropy—which is generally easy to observe for external audiences (Hawn & Ioannou, 2016), aligns with institutional norms (Matten & Moon, 2020), and has been found to increase shareholder value (Patten, 2008) through the provision of “reputational capital” (Lii & Lee, 2012) and protection of firm value in case of adverse events (“CSR as insurance”; Godfrey, 2005; Godfrey, Merrill, & Hansen, 2009). Corporate philanthropy usually draws substantial positive media attention (Brown, Helland, & Smith, 2006) but at the same time allows firms to “avoid the costs of more substantive CSR engagement” (Adams et al., 2017: 3). Such tactical CSR activities can be quickly adjusted if needed or desired and generally do not require firms to invest in firm-specific resources and capabilities, to modify their organizational structures, or to engage in long-term relationships with other parties (Bansal et al., 2015; Seo, Luo, & Kaul, 2021). 4
In CMEs, conversely, solidarity and social welfare traditionally have been organized at the institutional level, for instance, through government regulation, trade unions, and employee representations (Jackson & Apostolakou, 2010; Matten & Moon, 2008). Consequently, the social responsibilities of businesses have been defined relatively narrowly (Maignan & Ralston, 2002). Where in LMEs we saw skepticism about (big) government, in CMEs we see skepticism, even cynicism, about the true moral motives underlying corporate involvement in social causes (Maignan & Ralston, 2002). This also means that “corporate giving” as a tactical CSR activity generally has not been the norm in more coordinated institutional contexts. Rather, the deep-seated societal norms and expectations in CMEs refer to firms’ strong commitment to increase long-term survival and in-depth engagement with stakeholders (Suto & Takehara, 2020).
Other than in LME contexts, in CME contexts a large set of stakeholders typically is salient, among which are banks, the government, institutional investors such as pension funds, and employees (Lee, 2020). Such stakeholders generally are not impressed by firms that overly “boast” about their CSR activities—they prefer that firms “walk” rather than (only) “talk” (Strand, Freeman, & Hockerts, 2015) and value CSR investments that are strongly embedded in the firm’s core strategies and operations (Matten & Moon, 2020). To illustrate, in their study on firms’ self-representations on their websites, Maignan and Ralston (2002) found that Dutch and French firms (unlike U.S. and U.K. firms) showcased their “good citizenship” not by presenting their involvement in philanthropic programs but rather by highlighting their voluntary practices closely related to production activities and day-to-day operations (e.g., reducing the environmental impact of production, quality management, etc.). Especially since the early 2000s, stakeholders have expected firms to explicitly articulate such CSR activities in their strategies (Matten & Moon, 2020).
All of this implies that in CME contexts, strategic CSR (Bansal et al., 2015) aligns with institutional social norms because stakeholders value CSR activities that require long time horizons and large resource commitments and are firmly embedded in organizational structures, systems, and routines (Bansal et al., 2015; DesJardine et al., 2019). This also makes such strategic CSR less compatible with the social norms in LME contexts, where the most salient stakeholders—that is, shareholders and investors—generally do not appreciate such strategic CSR activities because their benefits may only become evident in the long term, and they may negatively affect shareholder value in the short term due to their generally costly implementation (Chen et al., 2021).
CEO Narcissism and CSR Behavior in LME Versus CME Contexts
As mentioned earlier, in prior work, CEO narcissism scholars have argued that narcissistic CEOs will invest in CSR activities because it will help them flaunt their moral superiority and get them the praise for which they yearn (Cragun et al., 2020; Petrenko et al., 2016). However, prior work has mostly ignored firms’ embeddedness in their contexts, implicitly assuming that audiences (stakeholders) are homogeneous in what they value and find appropriate. This is clearly not the case for CSR; as elaborately explained in the preceding section, social norms and stakeholder expectations differ substantially depending on the institutional context.
We expect that narcissistic CEOs in particular will be sensitive to the CSR-related norms, values, and expectations of the institutional context because of their strong urge to gain admiration from their relevant stakeholders and audiences. Narcissists are known to need “narcissistic supply” or “the fuel for a reinforced self-image,” which predominantly needs to come from external audiences in the form of affirmation and praise (Chatterjee & Hambrick, 2007: 354). Therefore, narcissistic CEOs will instrumentally channel action toward CSR behavior that is regarded as legitimate, congruent with social norms, and praised by stakeholders in that particular institutional context. At the same time, they want to stand out and excel among their peers. Research on “optimal distinctiveness” has shown that firm behavior that is in line with (conforms with) the current social norms but at the same time allows the firm to distinguish itself from its peers is perceived as the most favorable and admirable (Zhang, Wang, & Zhou, 2020; Zhao, Fisher, Lounsbury, & Miller, 2017). On the one hand, firm behavior that conforms to social norms provides stakeholders with evidence that the firm (and its CEO) aligns with taken-for-granted behavioral practices (Bettinazzi, Jacqueminet, Neumann, & Snoeren, 2024; Durand & Kremp, 2016). This could be seen as legitimacy-seeking behavior, which generally results in social approval (Deephouse, 1996). On the other hand, firm behavior that enables firms to distinguish themselves from their peers relates to advantage-seeking behavior, which elicits social approval by showing stakeholders that the firm (and its CEO) has a leading position and unique approach among its peers (Durand, Rao, & Monin, 2007). “Optimal distinctiveness” then refers to “the sweet spot in which firms are perceived as both legitimate and distinct” (Bettinazzi et al., 2024: 153).
Hence, we expect that narcissistic CEOs will pursue CSR activities that allow them to reach such “optimal distinctiveness”—that is, they will pursue excellence (among their peers) in CSR activities that align with the norms and expectations in their institutional context. In particular, in line with the institutional norms and what would get them the highest level of approval from the main stakeholders in their institutional context—that is, shareholders and financial investors in LMEs and a broad set of stakeholders in CMEs—narcissistic CEOs will want to excel in terms of corporate philanthropy in more liberal contexts but not in more coordinated contexts. In the latter contexts, philanthropy is less valued by salient audiences, potentially even resulting in a so-called illegitimacy discount—a penalty for violations of the institutional norms that audiences deem unacceptable and disapprove of (Boone & Özcan, 2020; Zhou, Ye, Liu, & Tang, 2024; Zuckerman, 1999). Prior research has found that narcissistic CEOs may be motivated to abstain from behavior that draws criticism from stakeholders (Petrenko et al., 2016) or may elicit reputational damage (Martínez-Ferrero, Ramón-Llorens, & García-Meca, 2024). As a result, we expect a positive relationship between CEO narcissism and corporate philanthropy in LMEs but no or even a negative relationship in CMEs. In the same vein, narcissistic CEOs will be more likely to strive for excellence in terms of strategic CSR in more coordinated contexts, again because this aligns with institutional norms and stakeholder appreciation in these institutional contexts, but would be less likely to do so in more liberal contexts, where salient audiences might sanction such “illegitimate” deviations from the institutional norms (Zuckerman, 1999). For instance, shareholders in LMEs may criticize the costly implementation of strategic CSR because it might hurt (short-term) value creation, and narcissistic CEOs might want to avoid such disapproval from their most salient stakeholders. As a result, we expect a positive relationship between CEO narcissism and strategic CSR in CMEs but no or even a negative relationship in LMEs. Put differently, the institutional context will work as a moderator and interact with CEO narcissism to affect CSR activities such that the more liberal (coordinated) the institutional context, the more narcissistic CEOs will invest in corporate philanthropy (strategic CSR).
This leads to the following set of hypotheses:
Hypothesis 1 (H1): The extent to which the institutional context is coordinated (vs. liberal) negatively moderates the relationship between CEO narcissism and corporate philanthropy.
Hypothesis 2 (H2): The extent to which the institutional context is coordinated (vs. liberal) positively moderates the relationship between CEO narcissism and strategic CSR.
Methods
Data and Sample
We tested our hypotheses on a panel of large multinational firms headquartered in 18 Organization for Economic Co-operation and Development (OECD) countries representing multiple industries. In our sampling strategy, we focused on European (EU) market leaders, defined as firms with the largest sales volume in the EU market in their respective industries. 5 We then checked these firms’ coverage in the Thomson Reuters ASSET4 database (later acquired by Refinitiv and LSEG) because our focal dependent variables, corporate philanthropy and strategic CSR, are derived from this data source. This sample is appropriate for our study of CEO narcissism and CSR in a variety of institutional contexts for several reasons. First, using a sample that covers multiple industries helps to avoid industry-specific bias that may occur in single-industry studies, which increases the generalizability of findings over industries. In addition, our focus on market leaders—that is, large multinational firms—not only implies that we cover the most prominent firms in their respective industries, which all have a major impact on society, but also ensures systematic availability of CSR-related data. For a full overview of all sample firms and how they are distributed across industries and countries, see Appendix A. Second, because our focus is on the moderating impact of institutional context, we need sufficient variety between countries to test our predictions. We use Hall and Gingerich’s (2004) “coordination index” to measure a country’s institutional context in which the firm is embedded (see below), which is available for the majority of OECD countries. Hence, our focus on EU market leaders headquartered in 18 different OECD countries provides for the necessary breadth of scores on the LME-CME continuum (e.g., Anglo-Saxon countries and Germany, Austria, and Finland) on the coordination index. Finally, our measure of CEO narcissism requires manual scoring of the CEO photograph in the company’s annual report and an accurate measurement of the number and size of signatures (see below). Our selection of the most prominent, publicly traded firms ensured data availability and allowed for manual collection and systematic coding of data for a period that spans more than 20 years.
Following the example of other scholars (e.g., Surroca, Aguilera, Desender, & Tribo, 2020), we obtained CSR data from the ASSET4 database, which provides systematic and auditable CSR information for publicly traded firms across the globe from 2002 onward. The ASSET4 database has gained traction recently among CSR researchers (Wernicke et al., 2022), especially among those using multicountry samples (e.g., Ioannou & Serafeim, 2012). Although ASSET4 contains CSR-related data on a large set of firms globally, its coverage is skewed toward firms that are listed on the leading stock exchanges. These are typically large multinational firms, like the market leaders in our sample. Furthermore, we supplemented firm-level variables from the Datastream database, and we searched and hand collected letters to shareholders, which were the basis of our measures for CEO narcissism. From the company annual reports, we identified for each firm the CEOs that were at the helm of those companies during the observation period and retrieved their demographic data from the short bios in the annual reports, and when this information was not present in the annual reports, we used BoardEx and LinkedIn profiles.
Our final sample includes 148 firms and 493 CEOs who headed these firms during the 22-year observation period (2002-2023). On average, we observe firms for 17.6 years because we were not always able to find historical firm information (such as the letters to shareholders). The average CEO’s tenure in our sample is about 9 years, and in 95% of firms, we observed more than one CEO transition. Our data-collection effort resulted in an unbalanced panel dataset of 2,628 yearly observations.
Measures
CSR: philanthropy and strategic CSR
We built on Bansal et al. (2015) and DesJardine et al. (2019) to operationalize our dependent variables. Specifically, we used corporate philanthropy as a major indicator of tactical CSR (DesJardine et al., 2019). Following Seo et al. (2021), philanthropy was operationalized as a firm’s dollar amount of corporate philanthropic contributions, which we scaled by sales in the same period because the amount given to charity is typically strongly driven by firm size and profitability. 6 In one of the robustness checks we used a nonscaled measure of philanthropy (see below) with very similar results.
To operationalize strategic CSR, prior scholars (i.e., Bansal et al., 2015; DesJardine et al., 2019) included a firm’s engagement in six CSR subdomains: environment, diversity, employee relations, human rights, product quality and safety, and corporate governance. Because these authors used a different database to collect CSR data (i.e., KLD STATS), we had to adjust our selection of specific CSR subdomains to the structure and format of the ASSET4 database, but we followed their conceptualization as closely as possible. Specifically, ASSET4 calculates scores for 10 categories, grouped into three so-called pillars: the environmental pillar (i.e., resource use, emissions, and innovation), the social pillar (i.e., workforce, human rights, community, and product responsibility), and the governance pillar (i.e., management, shareholders, and CSR strategy; LSEG, 2024). To align with the measure of Bansal et al. (2015) and DesJardine et al. (2019), we selected all categories in the environmental pillar (i.e., resource use, emissions, and innovation) as well as workforce, human rights, and product responsibility from the social pillar. We then operationalized strategic CSR as the firm’s weighted average of these six categories using the weights as provided in the ASSET4 database (i.e., resource use = 0.08; emissions = 0.10; innovation = 0.16; workforce = 0.10; human rights = 0.15; product responsibility = 0.09; LSEG, 2024). 7 Appendix B provides a description of these categories as well as their descriptives and correlations. Note that unlike Bansal et al. (2015) and DesJardine et al. (2019) but following many prior studies (e.g., Gupta, Briscoe, & Hambrick, 2017; Habib & Hasan, 2019; Wernicke et al., 2022), we decided to exclude the governance pillar because this refers to “the mechanisms that allow the principals (shareholders) to reward and exert control on other agents (the managers). . . . CSR, on the other hand, deals with social objectives and stakeholders other than shareholders” (Servaes & Tomayo, 2013: 1049). Our selection of six categories covered in the ASSET4 database strongly overlaps with the subdomains selected by Bansal et al. (2015) and DesJardine et al. (2019) and reflects firms’ tangible engagement with stakeholders other than shareholders that require long(er) time horizons and substantial resource commitments firmly embedded in organizational structures, systems, and routines. As a result, these CSR categories are indicative of the extent to which these firms are engaged in strategic CSR (Bansal et al., 2015; DesJardine et al., 2019; Suto & Takehara, 2020).
For the sake of robustness, in supplementary analyses (see below) we use an alternative strategic CSR measure derived from the MSCI database (formerly KLD STATS). Because the structure of the former KLD database changed over time, we again could not exactly replicate the operationalization used by Bansal et al. (2015). However, we followed the approach of Giese, Nagy, and Lee (2020), who studied which subdomains in the MSCI database mattered most for firms’ financial performance in both the short and long run. Given that Bansal et al. (2015) conceptualized strategic CSR as having long-run performance benefits for firms, we selected the subdomains for which Giese et al. (2020) provided evidence that they indeed benefit long-run performance: Firms excelling in these categories were able to translate them into positive differences in performance and prevent the risk of erosion of firm value in the long run. This was the case for the subdomains of carbon emissions, toxic emissions waste, and water stress from the environment pillar and the subdomains human capital development, health and safety, and labor management from the social pillar of the MSCI database. Hence, our alternative strategic CSR measure (based on the MSCI database) was calculated as the average of firms’ scores on these six subdomains. Appendix B provides the descriptives of this measure as well as the correlations with the ASSET4 categories. Note that the correlation between this MSCI-based measure and our ASSET4-based measure of strategic CSR is .35 (p = .000, for a sample of 1,940 overlapping observations), which underscores the convergent validity of our measure. This is remarkable given that prior research showed that CSR data provided by different databases, on aggregate, do not converge (Chatterji, Durand, Levine, & Touboul, 2016; Semenova & Hassel, 2014).
CEO narcissism
CEO narcissism is operationalized with a composite index that includes several markers of narcissism tapped from unobtrusive sources. The use of such a composite index was pioneered by Chatterjee and Hambrick (2007, 2011) and quickly became the most frequently used method to operationalize CEO narcissism (Cragun et al., 2020). Recently, Junge, Graf-Vlachy, Hagen, and Schlichte (2025) provided further evidence that using such unobtrusive measures is valid, showing strong positive correlations between CEO narcissism measures operationalized through Chatterjee and Hambrick’s (2007) original CEO narcissism index, derivatives of this index (e.g., Buyl et al., 2019), a measure based on signature size (Ham, Seybert, & Wang, 2018), and their newly developed measure based on executives’ LinkedIn profiles (Junge et al., 2025). Similarly, Petrenko et al. (2016) found a high and significant correlation between the videometric approach they developed to measure CEO narcissism and Chatterjee and Hambrick’s (2011) index. The international comparative nature, as well as the timeframe of our sample, prevented us from using Petrenko et al.’s (2016) videometric approach. For a subset of 100 CEOs from sample companies outside the United States and the United Kingdom, we checked the availability of videoclips that would be usable for the approach of Petrenko et al. (2016) and found no suitable videoclips for 43 of them, implying that using this approach would substantially decrease the sample size.
We carefully selected three items that all had been used in prior research as indicators for CEO narcissism and operationalized CEO narcissism as the average of these three standardized items. Our first item was the score of the CEO’s photograph in the annual report based on its size and the number of people it portrays 8 (e.g., Chatterjee & Hambrick, 2007, 2011). Second, we calculated the number of signatures in letters to shareholders and reversed the score by subtracting the number of signatures from the highest possible value in our sample (six) so that the higher value corresponded with higher expression of narcissism (Buyl et al., 2019). The third item was the size of the CEO’s signature, calculated as the area it occupied in the annual report divided by the number of characters in the CEO’s name, which is a standard measure for CEO narcissism in the finance and accounting literature (e.g., Aabo, Als, Thomsen, & Wulff, 2020; Ham et al., 2018; Khoo, Perotti, Verousis, & Watermeyer, 2024; Yook & Lee, 2020). All three items load onto a single factor that has an eigenvalue of 1.25, with factor loadings for the photo score 0.23, signature size 0.77, and reverse number of signatures 0.78. Analysis of variance furthermore revealed significant between-CEO variation in the three CEO narcissism items—photo score (F = 7.58, p = .000; R² = 0.59), number of signatures (F = 14.30, p = .000; R² = 0.73), and signature size (F = 10.77, p = .000; R² = 0.67)—as well as in the overall CEO narcissism index (F = 10.67, p = .000; R² = 0.67). We also calculated the intraclass correlations using the approach described in Klein (2018); for each of the three items, F tests rejected the null hypothesis that the intraclass correlation was zero: photo score (0.55, F = 7.10, p = .000), number of signatures (0.70, F = 12.53, p = .000), and signature size (0.61, F = 8.87, p = .000). We averaged all available data points per CEO to calculate a time-invariant CEO narcissism measure, which is consistent with the view that narcissism is a relatively stable personality trait (see also Turner, Adigüzel, & Sidhu, 2024).
Note that unlike Chatterjee and Hambrick (2007, 2011) but in line with other scholars (e.g., Aktas, de Bodt, Bollaert, & Roll, 2016; Buyl et al., 2019; Ham et al., 2018; Lee, Wei, Tang, Choi, & Cooke, 2025; Yook & Lee, 2020), we excluded pay-related items in our CEO narcissism index. We were not able to incorporate CEO’s cash and noncash pay relative to that of the second-highest-paid executive for the full sample because such information was not systematically available for companies outside the United States. Furthermore, we abstained from using the count of the relative use of first-person singular pronouns (e.g., I/me/my) in total personal pronouns (I/me/my + We/us/ours) in the letters to the shareholders as part of the index because recent studies have suggested that narcissists tend to use plural forms of pronouns just as frequently, if not more (e.g., Underberg, Gollwitzer, Oettingen, & Gollwitzer, 2020). We performed sensitivity analyses including the following five alternative operationalizations of CEO narcissism: (1) only the CEO photograph, (2) only the size of the CEO’s signature, (3) signature size and CEO photograph, (4) signature size, CEO photograph, and number of signatures (our reported CEO narcissism measure), and (5) signature size, CEO photograph, number of signatures, and first-person singular/plural pronouns. In supplementary analyses (see Appendix C), we report on the sensitivity analyses using these five alternative operationalizations in our models.
To check for convergent and discriminant validity, we examined how our narcissism measure compared with a range of other variables. 9 First, we computed “narcissistic rhetoric” (Anglin, Wolfe, Short, & McKenny, 2018) based on word counts in our sample firms’ letters to shareholders. Our CEO narcissism index correlates positively with the frequency count of all words from the narcissistic rhetoric dictionary, including words related to vanity, authority, superiority, and exhibitionism (0.05, p = .00). Second, we correlated our CEO narcissism measure with several variables related to CEOs’ personalities and values. We found that our CEO narcissism index positively correlates with several strong markers of hubris by presence identified by Akstinaite, Robinson, and Sadler-Smith (2019) using the standard categories in LIWC, an often-used content-analysis software that assesses “the psychological meaning of words” (Pennebaker, Chung, Frazee, Lavergne, & Beaver, 2014). We found bivariate correlation of CEO narcissism with “reward” (0.08, p = .00) and with “money” (0.12, p = .00). CEO hubris and CEO narcissism intertwine because both are leadership derailers (Owen & Davidson, 2009; Stein, 2013). In support of discriminant validity, we found a negative correlation between CEO narcissism and the “anxiety” LIWC category (−0.05, p = .01). Third and finally, we also explored the correlations between our CEO narcissism measure and several indicators of strategic orientation that have been linked to CEO narcissism previously. We found a positive correlation with “entrepreneurial orientation” (0.05, p = .00), and we also found a positive correlation with “status quo disruption” (0.05, p = .00). This is in line with prior findings that CEO narcissism was associated with innovation (Gerstner, König, Enders, & Hambrick, 2013), bold actions (Chatterjee & Hambrick, 2007), and risk taking (Buyl et al., 2019). Overall, these correlations suggest that our narcissism index has face validity.
Institutional context: coordination index
Informed by the insights from the “varieties of capitalism” framework (Hall & Soskice, 2001; Surroca et al., 2020), the countries in which sample firms have their headquarters can be classified as either CME or LME. This dichotomy is based on the degree to which economic actors (e.g., firms, governments, and trade unions) in these countries coordinate their actions purely relying on market signals. Whereas firms in LME countries react primarily to price signals and coordinate through competitive markets, characterized by arm’s-length relations and formal contracting, firms in CME countries rely on a variety of mechanisms that include strategic interaction with trade unions, suppliers of finance, and other actors (Hall & Gingerich, 2004). In our sample, 57 firms had their headquarters in LME countries and 91 in CME countries (see Table A1 in Appendix A).
We used the coordination index developed by Hall and Gingerich (2004) as our moderator. This index provides an interval measure between 0 and 1 of the extent of market coordination at the country level based on a set of variables that measure the degree to which countries adhere to the competitive market versus strategic mode of coordination 10 (Hall & Gingerich, 2004; Jackson & Apostolakou, 2010). Countries with a more liberal market economy have a lower score (e.g., United States = 0.00) and countries with a more coordinated market economy have a higher score (e.g., Austria = 1.00). Table A1 in Appendix A gives an overview for all countries included in our sample and shows that all countries that are considered as LMEs have a low score on the coordination index (between 0 and 0.29) and that countries that are classified as CME have a high score on the coordination index (between 0.51 and 1).
Control variables
We control for CEO educational attainment, measured on a three-point Likert scale (1 = bachelor’s degree; 2 = master’s degree/MBA; and 3 = PhD degree), CEO gender, CEO duality, equaling 1 (else 0) if the CEO is also chairperson of the board, CEO tenure (years since appointment as CEO), and CEO age in years because (demographic) characteristics of the CEO may affect corporate CSR strategy (Adams, Licht, & Sagiv, 2011; Shafer, Fukukawa, & Lee, 2007). To account for executives’ monetary incentives for CSR engagement, we include a dummy equal to 1 if the CEO’s compensation is linked to total shareholder return and a dummy equal to 1 if the compensation of at least one executive is linked to CSR targets. We also include a dummy variable to account for the institutional context in which the CEO was born. That is, we coded CEOs based on whether they were born in an LME or a CME context (based on their nationality). The variable CEO LME/CME change takes the value of −1 if a CME CEO is replaced by an LME CEO, the value of 1 if an LME CEO is replaced by a CME CEO, and the value of 0 if either there was no CEO change or the new CEO was born in the same institutional context as the old CEO. Our firm-level control variables include firm size (i.e., log of number of employees) because institutional pressures to engage in CSR may be higher for larger firms due to their visibility (Bansal et al., 2015), financial leverage (total debt divided by total assets), firm cash-to-current-assets ratio, and firm return on assets to account for resource scale because more profitable firms are more likely to invest in CSR (Bansal et al., 2015). Furthermore, we also control for board independence by (1) the percentage of independent board members and (2) a dummy to indicate whether the company has a policy regarding the independence of the board, and we also include a dummy to indicate whether the company has a CSR committee or team. Finally, we also include industry and year dummies to account for variation across industries and the unobserved changing macroeconomic conditions that may affect firms’ incentives to engage in CSR. Including industry dummies implies that we treat a firm’s industry as its relevant peers and comparison group; this is in line with the general approach in management literature, where the industry’s average performance is typically used to gauge the peer performance of firms (e.g., Chatterjee & Hambrick, 2011; Greve, 2003; Mount & Baer, 2022).
Analysis
We estimated fractional response models when the dependent variable was philanthropy because it is a proportion that is greater than or equal to 0 and less than 1 (Papke & Wooldridge, 2008) and generalized least squares models when the dependent variable is strategic CSR. We report Huber/White/Sandwich robust standard errors to account for potential heteroskedasticity at multiple levels. Furthermore, to account for potential omitted variables in our estimation strategy, we added year and industry fixed effects in all models. We also used the robustness of inference to replacement (RIR) approach (Frank, Lin, Xu, Maroulis, & Mueller, 2023; Frank, Maroulis, Duong, & Kelcey, 2013) to evaluate the extent to which our focal estimates might be biased due to potential omitted variables (see in the supplementary analyses below).
Finally, the estimated relationship between CEO narcissism and CSR outcomes also may be biased due to endogeneity caused by the selection process (Chatterjee & Hambrick, 2011) if the appointment of narcissistic CEOs is not random, but some CEO or firm characteristics may make it more likely for a narcissistic CEO to be appointed (e.g., narcissistic CEOs are hired to fit with firms’ anticipated CSR engagement). In line with other scholars, such as Chatterjee and Hambrick (2007, 2011), Buyl et al. (2019), and Lee, Ha, Wei, & Sarala (2023, 2025), we applied a Heckman two-stage selection model (Boone, Özcan, & Li, 2022b; Certo, Busenbark, Woo, & Semadeni, 2016; Heckman, 1979; Wolfolds & Siegel, 2019; Wooldridge, 2015) to control for potential nonrandom matching of firms and CEOs. In the first stage of the Heckman model, we first dichotomized our CEO narcissism measure so that a dummy takes the value of 1 if the CEO narcissism score is above the mean and 0 if the score is below the mean (Al-Shammari, Banerjee, Rasheed, Al-Shammari, & Swimberghe, 2024; Lee et al., 2023, 2025), and we then estimated a probit model for hiring a narcissistic CEO on a carefully chosen set of variables that may affect CEO appointment based on theoretical grounds (see Appendix D). We included firm financial leverage, firm size, cash, and return on assets, all measured in the year before the CEO’s appointment. Narcissists generally are attracted to mature and established organizations (i.e., larger organizations with higher levels of leverage and cash) and to settings in which they can act as “savior” (e.g., to turn around troubled or poorly performing firms; Chatterjee & Hambrick, 2007, 2011; Khurana, 2002; Patel & Cooper, 2014). Furthermore, we included CEO age, gender, and education because the tendency in large corporations to hire seasoned, male, and (MBA) educated CEOs (e.g., male selection bias) may coincide with a higher level of narcissism (cfr. Hambrick & Wowak’s (2012) “new breed of CEOs”). We also included the coordination index to capture institutional context and a set of industry dummies. Finally, we included an index that captures the value of the firm’s corporate art collection as an exclusion restriction (i.e., we expect this variable to predict CEO narcissism, but we do not expect it to be associated with CSR behavior). Art collections were acquired by the sample firms before our observation period and have been shown to be a manifestation of corporate identity that projects status and prestige, which may attract narcissists (Howarth, 2017; Kottasz, Bennett, Savani, Mousley, & Ali-Choudhury, 2007). The first-stage model was statistically significant (
Results
Table 1 shows descriptive statistics and pairwise correlations, which are mostly low to moderate. Table 2 shows results for philanthropy (Models 1 and 2) and strategic CSR (Models 3 and 4). 11 The coefficient of CEO narcissism is insignificant in both Model 1 (β = −0.05, p = .205) and Model 3 (β = −0.04, p = .494), implying that CEO narcissism, on average in CME and LME contexts together, is not associated with philanthropy or strategic CSR. Models 2 and 4 introduce interaction effects of CEO narcissism and the coordination index on philanthropy and strategic CSR, respectively. We observe a positive main effect of CEO narcissism and a negative interaction between CEO narcissism and the coordination index (β = −0.40, p = .000) in Model 2. Conversely, Model 4 shows a negative main effect of CEO narcissism and a positive interaction between CEO narcissism and the coordination index (β = 0.58, p = .001).
Descriptive Statistics and Pairwise Correlations
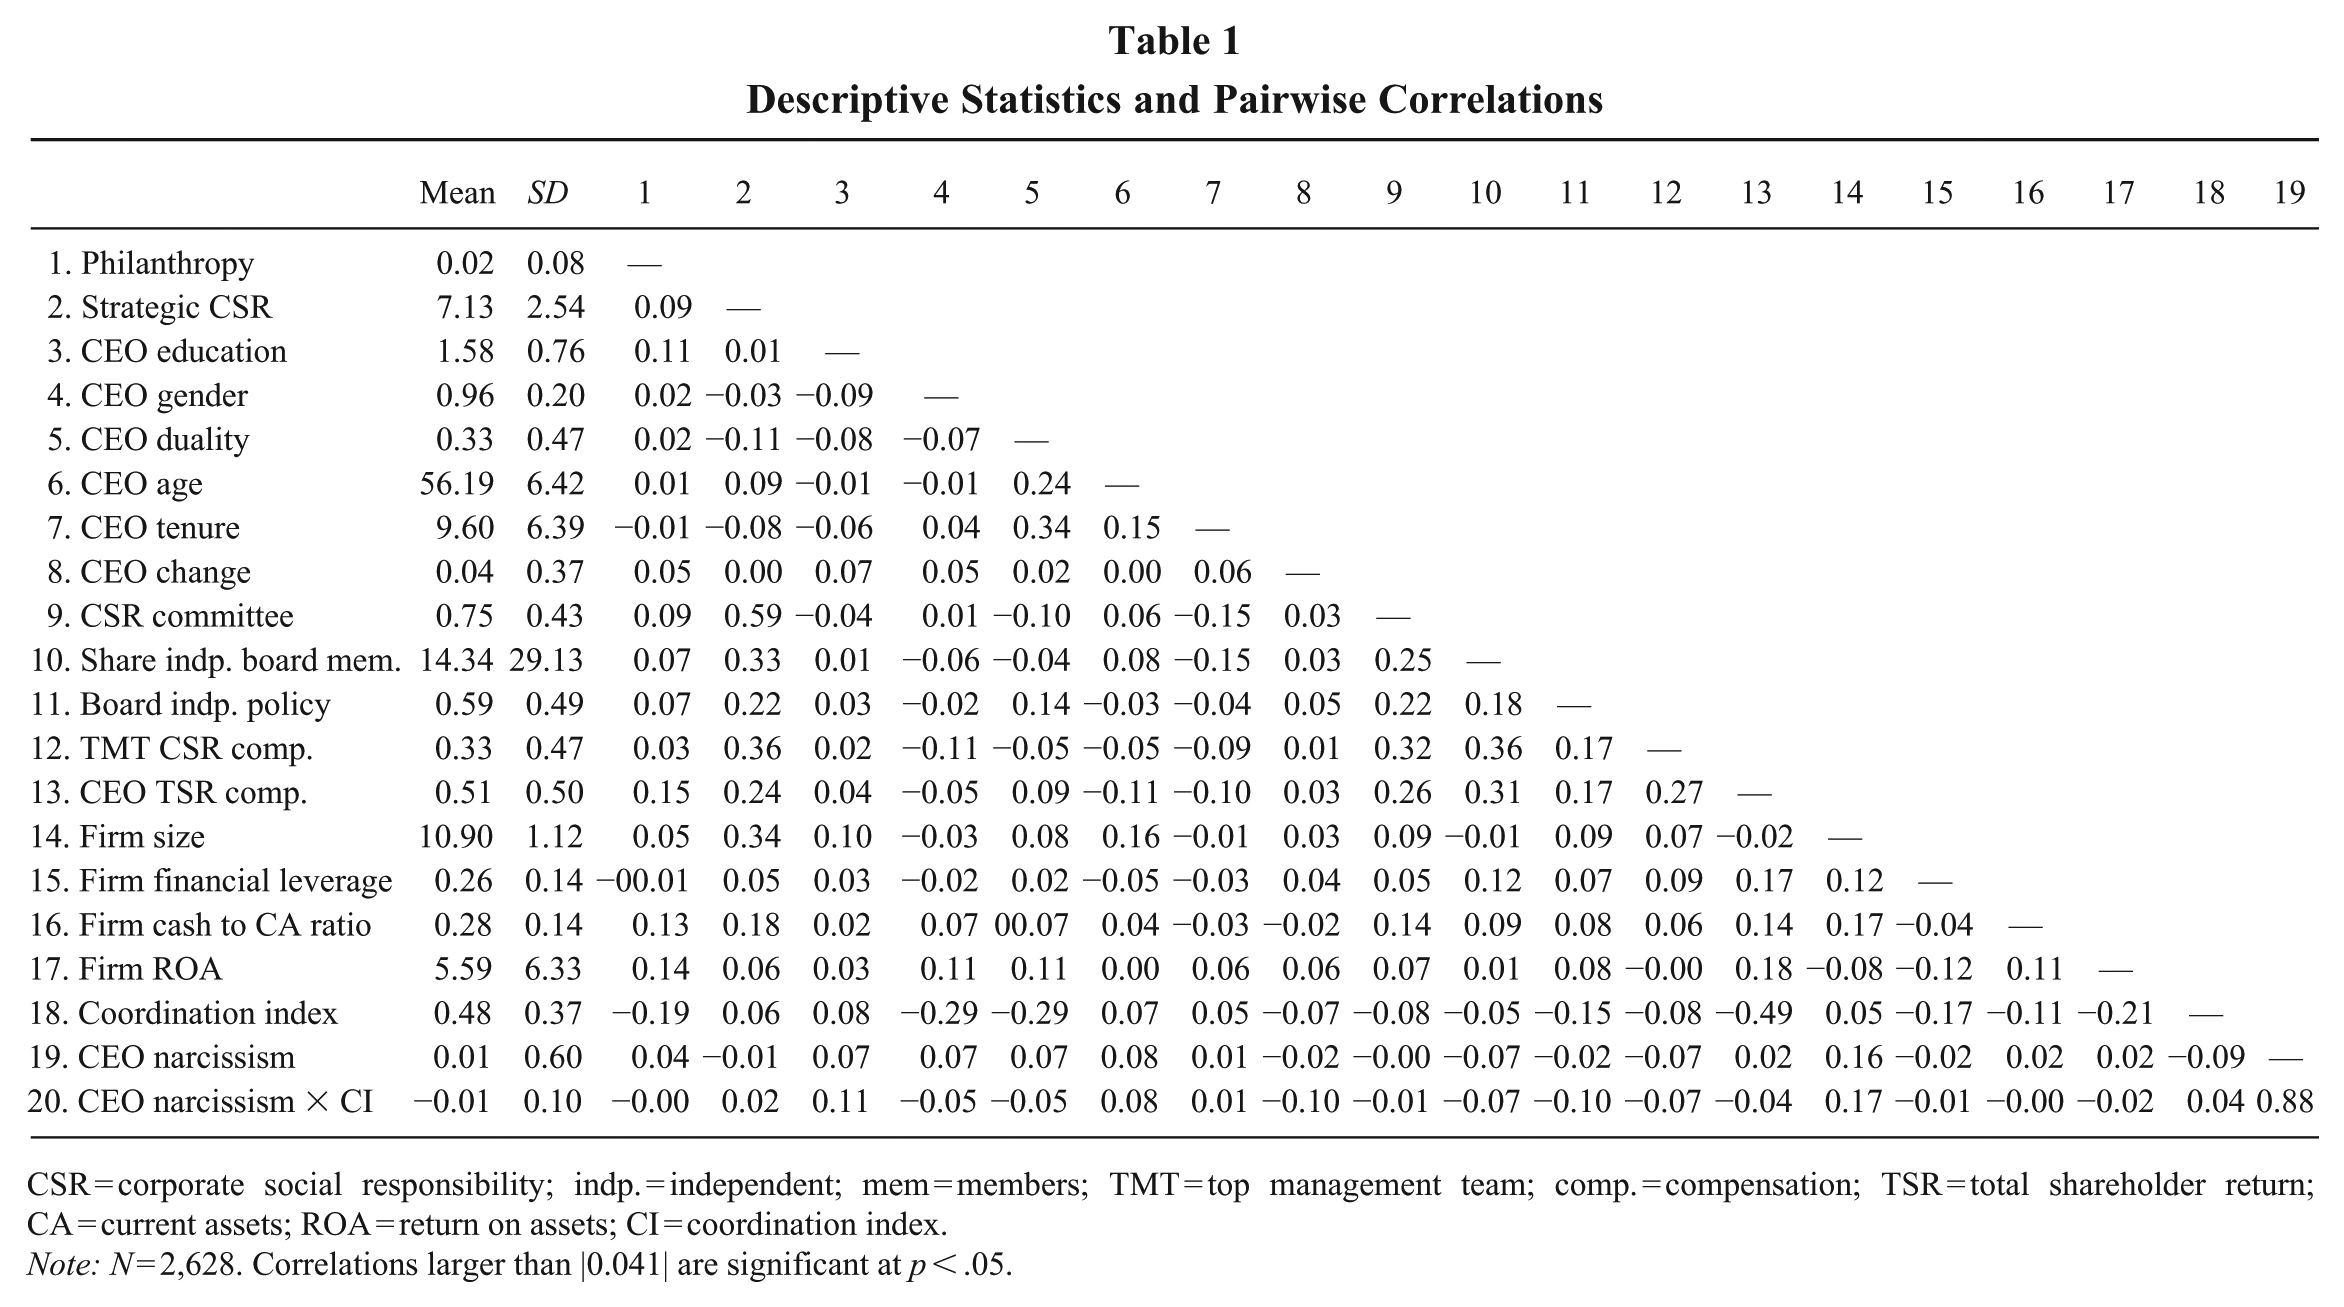
CSR = corporate social responsibility; indp. = independent; mem = members; TMT = top management team; comp. = compensation; TSR = total shareholder return; CA = current assets; ROA = return on assets; CI = coordination index.
Note: N = 2,628. Correlations larger than |0.041| are significant at p < .05.
Philanthropy and Strategic CSR: CEO Narcissism and Institutional Context
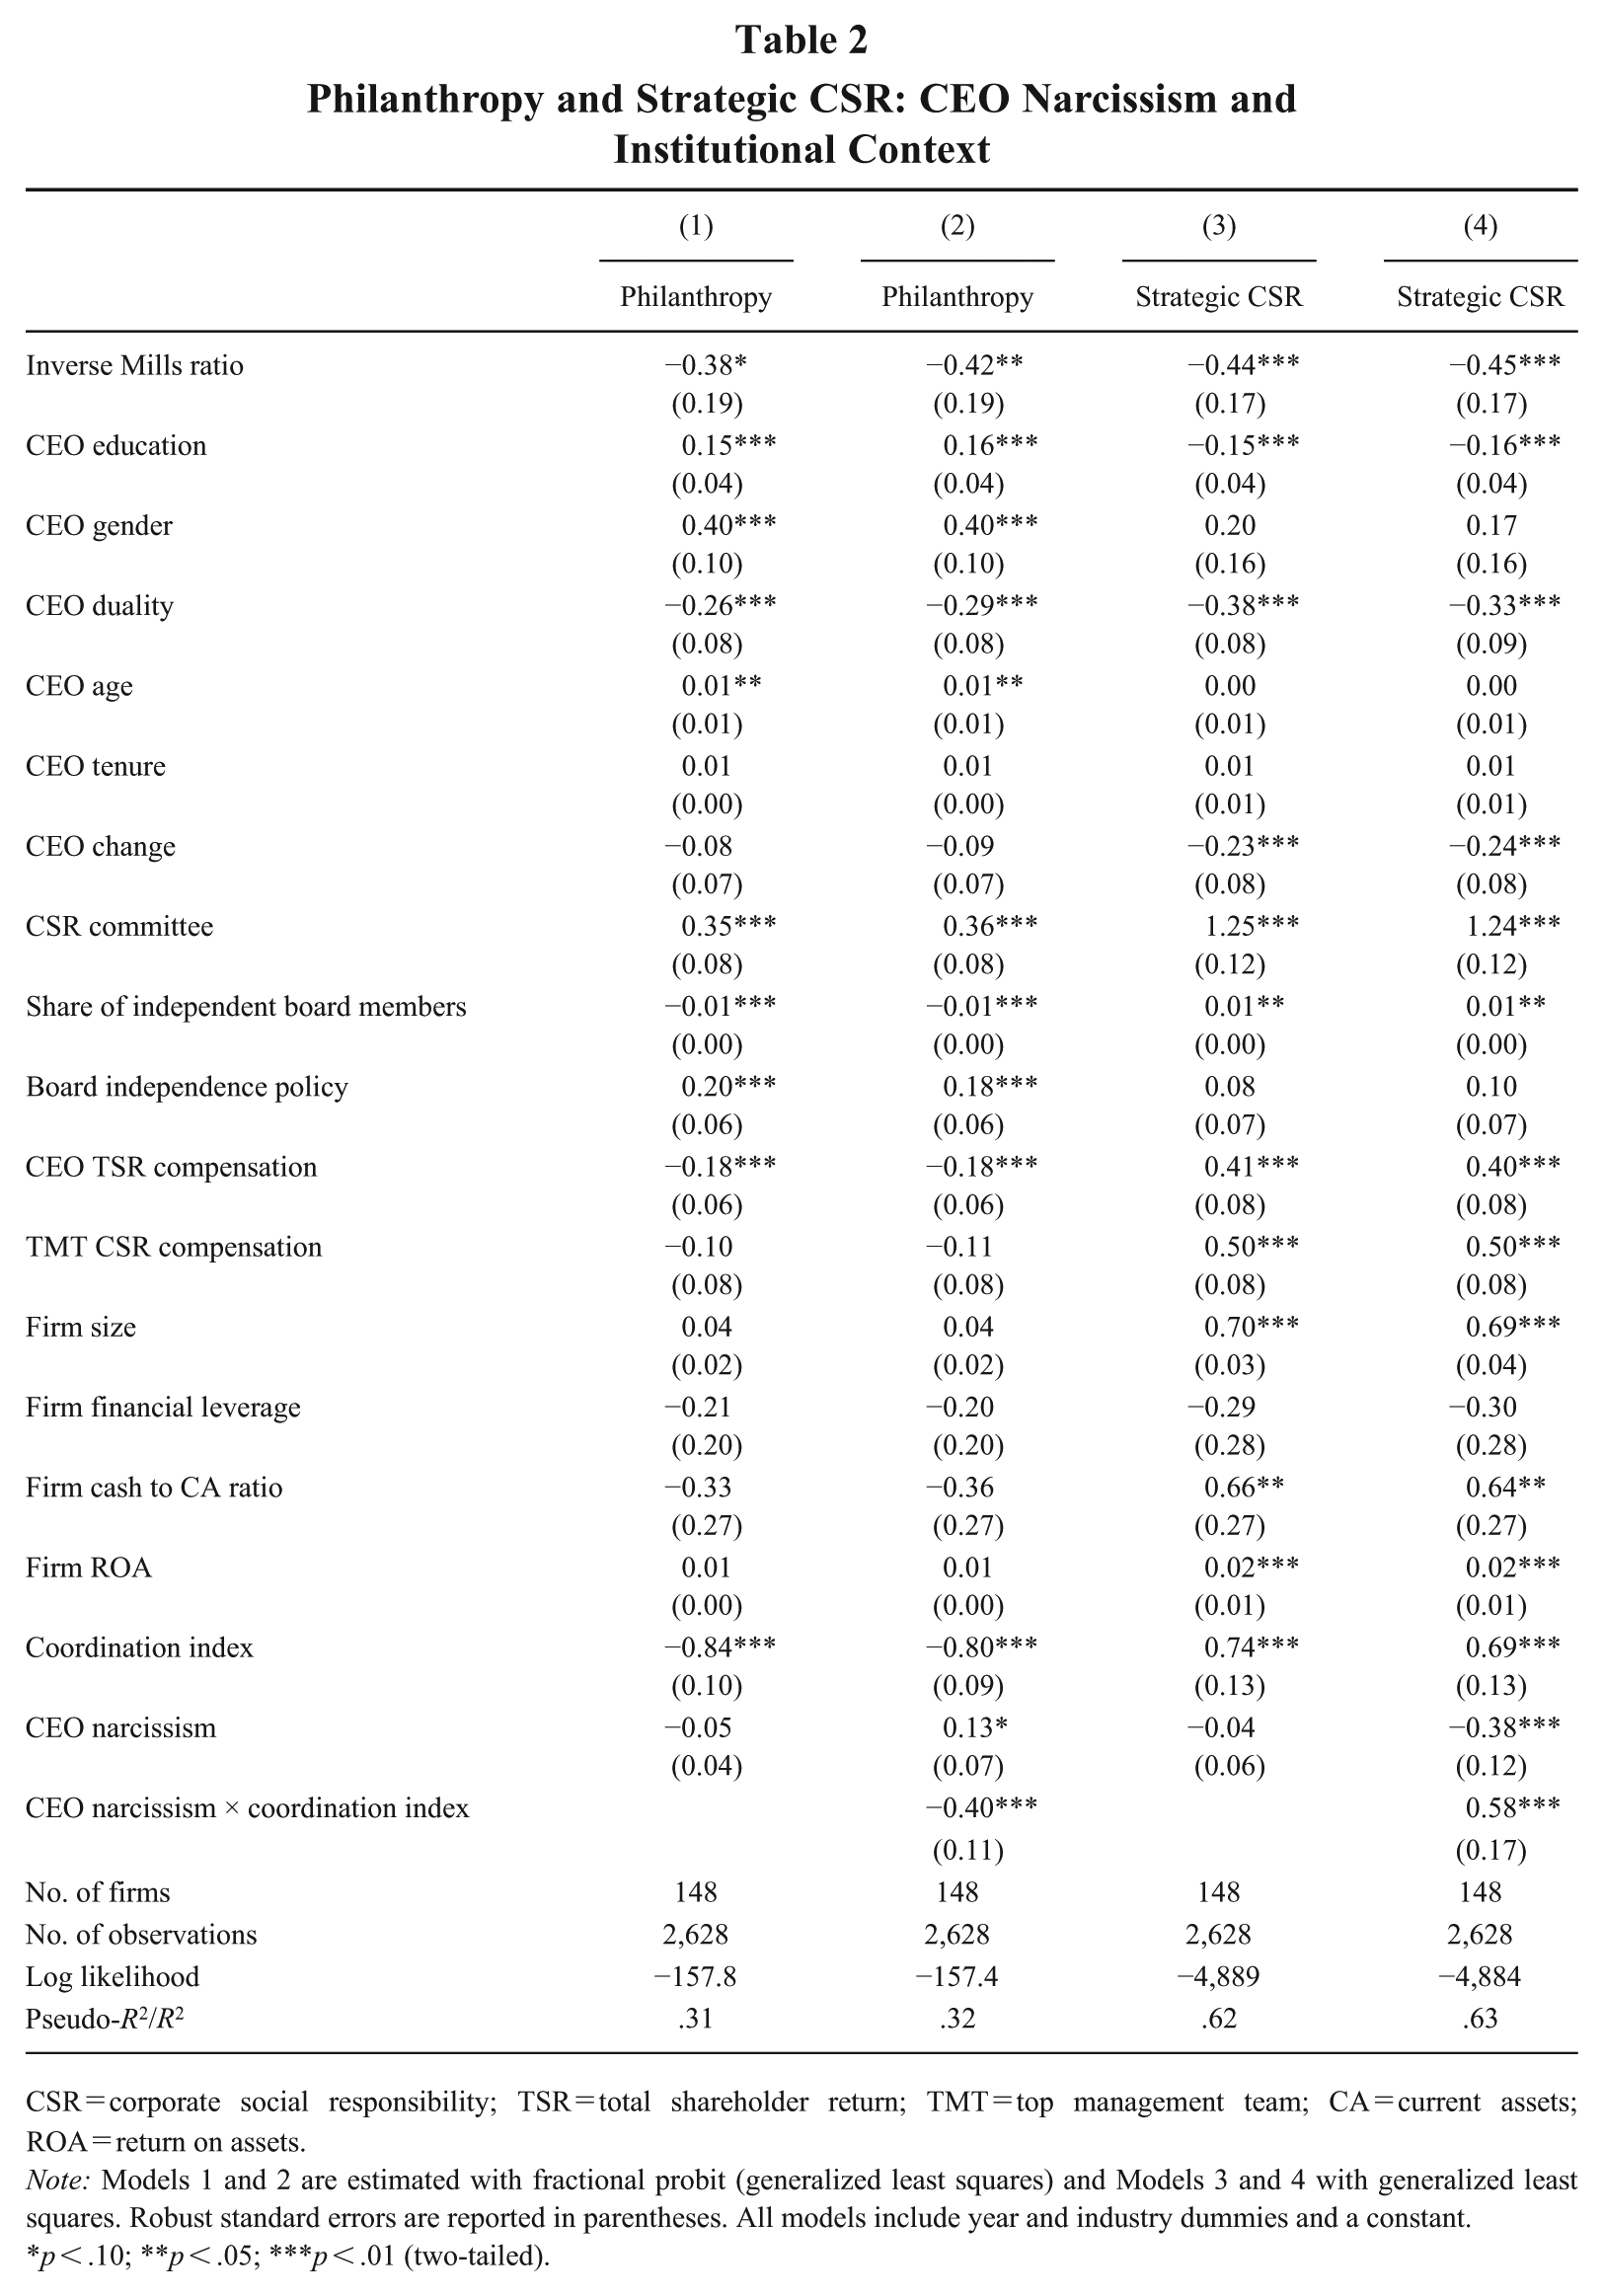
CSR = corporate social responsibility; TSR = total shareholder return; TMT = top management team; CA = current assets; ROA = return on assets.
Note: Models 1 and 2 are estimated with fractional probit (generalized least squares) and Models 3 and 4 with generalized least squares. Robust standard errors are reported in parentheses. All models include year and industry dummies and a constant.
p < .10; **p < .05; ***p < .01 (two-tailed).
Because the magnitude of the interaction effect in nonlinear models, such as a fractional response model, is not straightforward to interpret (Ai & Norton, 2003; Zelner, 2009), Table 3 reports the marginal effects of CEO narcissism on philanthropy (column 1) and on strategic CSR (column 3), calculated at different levels of the coordination index observed in our sample (ranging from 0 to 1) and at the average values for the group of LME countries (0.03) and CME countries (0.75), respectively. We used Stata’s “margins” command to calculate these marginal effects based on the estimates reported in Table 2, that is, Model 2 for philanthropy and Model 4 for strategic CSR.
Marginal Effects and Effect Sizes for Philanthropy and Strategic CSR
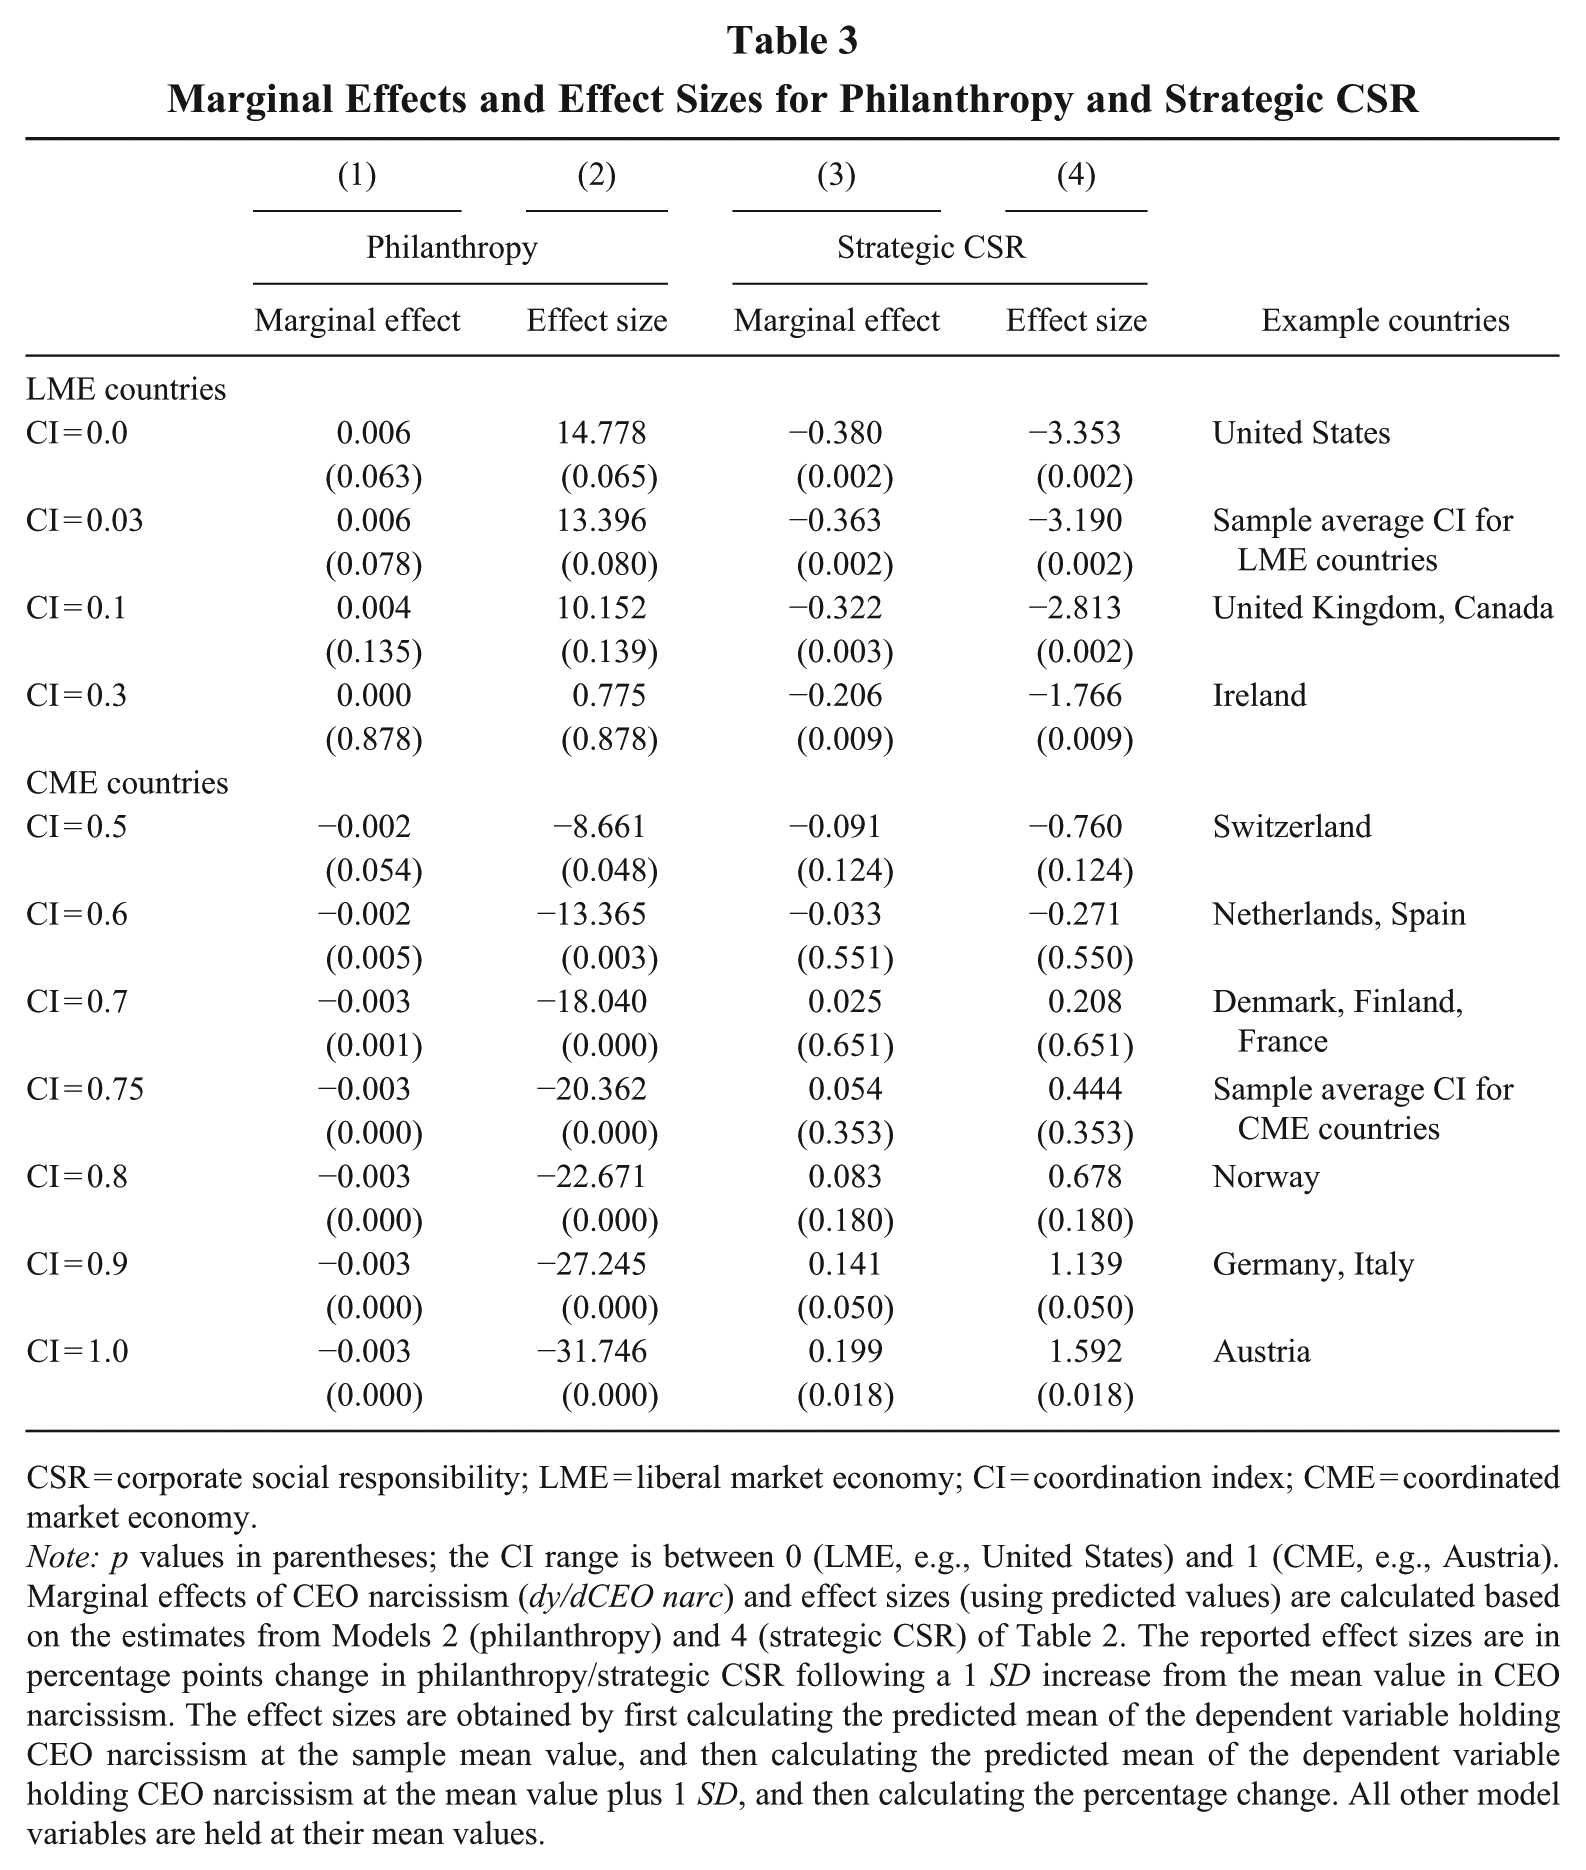
CSR = corporate social responsibility; LME = liberal market economy; CI = coordination index; CME = coordinated market economy.
Note: p values in parentheses; the CI range is between 0 (LME, e.g., United States) and 1 (CME, e.g., Austria). Marginal effects of CEO narcissism (dy/dCEO narc) and effect sizes (using predicted values) are calculated based on the estimates from Models 2 (philanthropy) and 4 (strategic CSR) of Table 2. The reported effect sizes are in percentage points change in philanthropy/strategic CSR following a 1 SD increase from the mean value in CEO narcissism. The effect sizes are obtained by first calculating the predicted mean of the dependent variable holding CEO narcissism at the sample mean value, and then calculating the predicted mean of the dependent variable holding CEO narcissism at the mean value plus 1 SD, and then calculating the percentage change. All other model variables are held at their mean values.
Column (1) of Table 3 shows that the marginal effect of CEO narcissism on philanthropy is decreasing with increasing values of the coordination index. Although in the most liberal environments (with a coordination index of 0.03 and below) the marginal effect of CEO narcissism is positive and (marginally) significant, in CMEs, where the coordination index is above 0.5, the marginal effect is negative and significant. This is in line with H1, which predicted a negative moderation effect of the extent to which the institutional context is coordinated (vs. liberal). In addition, the marginal effects show that this interaction effect is nonmonotonic: The relationship between CEO narcissism and philanthropy is positive and (marginally) significant in more liberal institutional contexts, whereas it is significantly negative in more coordinated contexts.
In support of H2, which predicted a positive moderation effect, column (3) in Table 3 shows that the marginal effect of CEO narcissism on strategic CSR increases with increasing values of the coordination index. Although in LMEs the marginal effect is negative and significant, in more coordinated environments (with a coordination index of 0.9 and above) it is positive and significant. Hence, the change in sign of the marginal effect of CEO narcissism again suggests a nonmonotonic interaction effect of the institutional context: The relationship between CEO narcissism and strategic CSR is significantly positive in more coordinated contexts and significantly negative in more liberal contexts.
To ease the evaluation of the practical impact of these marginal effects, we calculated the percentage changes in both outcome variables following a 1 SD increase in CEO narcissism based on the same estimates of Models 2 and 4 in Table 2. More precisely, these effect sizes (reported in columns 2 and 4 of Table 3) are obtained by first calculating the predicted mean of the dependent variable, holding CEO narcissism at the sample mean value, then calculating the predicted mean of the dependent variable, holding CEO narcissism at the mean value plus 1 SD, and finally calculating the percentage change. All other model variables are held at their mean values. Column (2) of Table 3 shows that a 1 SD increase in CEO narcissism is associated with an increase in philanthropy in LMEs (the countries that score low on the coordination index). For the minimum value of the coordination index (i.e., 0.00, which corresponds with the United States), we find a 14.78% increase (p = .065), and when evaluated at the average value of the coordination index in LME countries (0.03), we find a 13.40% increase (p = .080) in philanthropy. In CMEs, a 1 SD increase in CEO narcissism is associated with a significant decrease in philanthropy, ranging from an 8.66% decrease (p = .048) when the coordination index is 0.50 (Switzerland) to a 31.75% decrease (p = .000) when the coordination index is 1.00 (Austria). We found a 20.36% decrease (p = .000) in philanthropy when evaluated at the average value of the coordination index in CME countries (0.75).
For strategic CSR, in CMEs, a 1 SD increase in CEO narcissism is associated with an increase in strategic CSR of 1.59% (p = .018) when the coordination index is at its maximum (i.e., 1.00, which corresponds with Austria) and a 1.14% increase (p = .050) when the coordination index is 0.90 (Germany and Italy). When set at the average coordination index in CME countries (0.75), we found an insignificant 0.44% increase (p = .353). In LMEs, such a 1 SD increase in CEO narcissism was associated with a significant decrease in strategic CSR, ranging from 3.35% (p = .002) when the coordination index was 0.00 (United States) to 1.77% (p = .009) when the coordination index was 0.30 (Ireland). We found a 3.19% (p = .002) decrease in strategic CSR when the coordination index was set at the average of LME countries (0.03).
Supplementary Analyses
To further explore our findings, we have performed several sets of supplementary analyses. First, we reestimated our models in LME vs. CME subsamples (Table E1 in Appendix E) separately because many scholars studying institutional context still use the LME vs. CME divide as dichotomous (e.g., Desender & Epure, 2021). These subsample analyses are mostly in line with our earlier findings that CEO narcissism is positively associated with philanthropy in LME contexts (β = 0.24, p = .001; Table E1, Model 1), but there is a weaker association in the CME contexts (β = 0.11, p = .038; Table E1, Model 2). 12 Conversely, CEO narcissism is not associated with strategic CSR in LME contexts (β = −0.02, p = .903; Table E1, Model 3) but positively associated in CME contexts (β = 0.11, p = .062; Table E1, Model 4), also in line with our analyses presented in Table 2.
Second, we also undertook efforts to validate the proposed mechanism, based on (neo-) institutional theory, that institutional norms and expectations drive local behavior and that especially narcissistic CEOs will adjust their behavior to match the institutional context. In particular, we checked the association between the institutional context and firms’ shareholder orientation proxied by the use of language that signals shareholder value orientation (SVO) of the CEO (Shin & You, 2020). A high SVO indicates endorsement of the “shareholder primacy” principle and a strong focus on generating economic returns for shareholders and implementing practices that satisfy investors (Shin, Lee, & Bansal, 2022). When regressing SVO 13 on the coordination index and its interaction with CEO narcissism (Table F1 in Appendix F), the coefficient of the coordination index is negative but insignificant (β = −0.02, p = .558), and the interaction term of coordination and CEO narcissism is negative and significant (β = −0.15, p = .004). This is in line with our expectation that in LME contexts, where shareholders are the salient stakeholders, SVO typically will be high and that this will especially be the case for narcissistic CEOs. Because narcissistic CEOs are eager to gain admiration from their firms’ core stakeholders, they are more likely to steer managerial orientation toward shareholders in LME contexts.
Finally, we also performed several analyses to verify the sensitivity and robustness of our findings. First, as mentioned earlier, we calculated five alternative operationalizations for CEO narcissism. As a sensitivity check, we reran our analyses with these five different CEO measures. As can be seen in Appendix C, for the most part, the results are similar when various elements are included in the calculation of the CEO narcissism index.
Second, we reran all philanthropy models using unscaled measures. In our sample, 121 firms and 1,373 firm-year observations have positive values; in all other cases, no philanthropy was reported, which we interpreted as a zero. When visualizing the distribution of unscaled philanthropy (total dollar amount), we observed (1) many zeros and (2) positive values that followed a log-normal distribution. To deal with such a skewed distribution, we first report two models on the positive values of philanthropy only (leaving out the zeros; see Appendix G): Model 1 on a log-transformed value of philanthropy and Model 2 using a Poisson estimator on the value of philanthropy. We report robust standard errors. Model 3 also includes the zero values of philanthropy and therefore pertains to the entire sample. It is also a Poisson estimator using the Huber/White/Sandwich (robust) variance that does not assume that E(yj) = var(yj) and is best suited for such a distributed dependent variable (Wooldridge, 2010). To compare the outcomes across different estimators, we report the marginal effect of CEO narcissism in all models at two different values of the coordination index (i.e., mean − 1 SD and mean + 1 SD). We also report a χ2 test of the null that the two marginal effects are equal. The results of this robustness check suggest that our qualitative conclusion on the support for our hypothesized relationship does not depend on the method of operationalization of the philanthropy measure—that is, in all models, we find that the marginal effect of CEO narcissism is higher (and more significant) when the coordination index is low (i.e., in more liberal institutional contexts).
We also performed two robustness checks using alternative operationalizations of our strategic CSR measure. First, we reran the regressions using each individual score that made up our overall strategic CSR index (see Appendix B) as separate dependent variables. These results are presented in Appendix H in Table H1, columns (1)–(6). For all strategic CSR subscores, we observed a similar pattern as in the main analysis, with the exception of the product responsibility subscore. Second, we used an alternative strategic CSR measure based on the average of six subdomains obtained from the MSCI database (formerly KLD STATS) that have been shown to benefit long-run firm performance (Giese et al., 2020): carbon emissions, toxic emissions waste, water stress, health and safety, human capital development, and labor management (see above). The sample size for this analysis was smaller (1,940) because we were only able to extract scores for 139 (of 148) firms in our sample and because the coverage by MSCI only starts from 2007 onward. The results are presented in Appendix H in Table H1, column (7). It is reassuring to see that our main conclusions do not seem to depend on whether we use a strategic CSR measure derived from either the ASSET4 or the MSCI database.
Third, for some countries (e.g., Portugal and Canada), we only had a limited number of firms in our sample. In addition, for other countries, there may be within-country differences in terms of social norms and values related to CSR. For instance, within the United States, previous work found differences in firms’ CSR-related spending depending on whether those firms were headquartered in Democratic- versus Republican-leaning states (Di Giuli & Kostovetsky, 2014; Gupta et al., 2017). Therefore, to assess the robustness of our inferences against both these limited observations for some countries and the potential within-country heterogeneity in other countries (such as the United States), we estimated philanthropy and strategic CSR models on the subsamples that exclude all firms headquartered in the respective country (we excluded countries one by one) to check how much the core results—that is, the main effect of CEO narcissism and the interaction between CEO narcissism and the coordination index—changed after dropping these firm-year observations. The results, reported in Appendix I, show that for both dependent variables—philanthropy and strategic CSR—the coefficients and standard errors of CEO narcissism and its interaction with the coordination index did not vary substantially, indicating the robustness of our findings.
Finally, we used the robustness of inference to replacement (RIR) tests, as described in Frank et al. (2013, 2023), to assess the extent to which our focal estimates might be biased due to potential omitted variables. These RIR analyses suggested that for the philanthropy model, to nullify the inference of an effect using the threshold of −.001 for statistical significance (with null hypothesis = 0 and alpha = .05), 20.67% of the estimate of the CEO narcissism × coordination index interaction term would have to be due to bias. This implies that to nullify the inference, one would expect to have to replace 543 (20.67%) observations with data points for which the effect is 0 (RIR = 543). For the strategic CSR model, to nullify the inference of an effect using statistical significance (with null hypothesis = 0 and alpha = .05), 41.30% of the estimate of the CEO narcissism × coordination index” interaction term would have to be due to bias. This implies that to nullify the inference, one would expect to have to replace 1,085 (41.30%) observations with data points for which the effect is 0 (RIR = 1,085).
Discussion
The pattern of findings supports our general predictions that the relationship between CEO narcissism and firm CSR behavior is dependent on the institutional context. Not accounting for institutional context, in our multicountry sample, we found no significant effect of CEO narcissism on philanthropy or strategic CSR. However, when we entered the institutional context in the analyses, we observed significant interaction effects, as theoretically predicted: In more liberal contexts, narcissistic CEOs seem to be inclined to invest in philanthropy but not in strategic CSR, whereas the opposite pattern of results emerges in more coordinated contexts. This is in line with our expectations: Based on insights from (neo-)institutional theory, we anticipated that narcissistic CEOs would be drawn toward CSR-related behavior that is aligned with the social norms in their institutional context—that is, corporate philanthropy in LME contexts and strategic CSR in CME contexts. Excelling in CSR behavior that is in line with institutional norms allows narcissistic CEOs to gain praise from their audiences and flaunt their moral superiority.
Interestingly, for both philanthropy and strategic CSR, we found nonmonotonic interaction effects between CEO narcissism and the coordination index because the results also reveal a negative (significant) relationship of CEO narcissism with strategic CSR in LMEs and with philanthropy in CMEs. Apparently, narcissistic CEOs not only engage more in CSR behavior that aligns with the institutional norm, but they also invest less in CSR behavior that is not aligned with that norm. This is remarkable because where scholars so far have mostly argued that narcissistic CEO will engage in behavior that elicits audience approval and admiration, this finding provides evidence for the flip side of that coin: Narcissistic CEOs also may engage less or avoid behavior out of fear of disapproval from stakeholders. This aligns with prior findings that narcissistic CEOs tend to abstain from practices that raise criticism (Petrenko et al., 2016) or may harm their reputation and stakeholder recognition (Martínez-Ferrero et al., 2024). The psychology literature also provides evidence that a key motivation for (vulnerable) narcissists is the avoidance of social approval (Neave, Tzemou, & Fastoso, 2020). As for CSR behavior, violations of the institutional norm may come with “illegitimacy discounts” (Zuckerman, 1999), in the form of stakeholder disapproval and reputational damage. Our findings suggest that narcissistic CEOs may be particularly sensitive to such illegitimacy discounts.
More generally, our findings imply that studying main effects of CEO narcissism in a multicountry comparative study is not very informative precisely because of the major importance of the institutional context in shaping local social norms and, consequently, strategic behavior. Hence, although the meta-analysis of Wang et al. (2024) reported only a weak relationship between CEO narcissism and (overall) CSR, including the institutional context and distinguishing between different CSR activities that fit the institutional context lead to more substantial results and revealing insights.
Contributions and Implications
With this study, and especially its comparative research design, we extend the state of the art in upper echelons and CEO narcissism research. So far, unfortunately, this literature stream has largely left out macro-contextual elements (Neely et al., 2020), which may have led to “decontextualized” theories and findings (Aldrich, 2009). In a recent meta-analysis, Wang et al. (2024) alluded to the important role of the institutional context, but we provided explicit theorizing about how institutional norms shape narcissistic CEOs’ behavior. Our findings indeed reveal that depending on the institutional context, narcissistic CEOs are likely to display different types of CSR behaviors, which underscores the context dependency of narcissistic CEO behavior (Cragun et al., 2020; Gerstner et al., 2013; Li, Wang, Yang, & Tang, 2022).
With this integration of factors at the macro-institutional and CEO levels, we also contribute to the CSR literature. Prior research identified both macro-level (e.g., institutional context) and micro-level (e.g., individual CEO-level traits) drivers for organizations’ CSR actions, but research on both types of CSR drivers largely took place in separate, relatively isolated research strands (Walker, Ni, & Zhang, 2019; Wernicke et al., 2022). In our integrative study, we bridge these levels by theorizing about how institutionally determined social norms that shape which types of CSR behaviors are valued by salient audiences in these institutional contexts and how narcissistic CEOs subsequently match their CSR strategies to excel in behavior that matches those norms. This is in line with the call by Risi et al. (2023) in their recent review of institutional theory-based CSR research to explore how societal values and norms embedded in institutional structures determine firms’ (and CEOs’) agentic choices to engage in CSR. It also addresses the recent calls in the broader management literature (Cowen, Rink, Cuypers, Grégoire, & Weller, 2022; Eckardt et al., 2019) to develop theory that spans multiple levels of analysis to advance our understanding of firm outcomes that are shaped by a combination of macro- and micro-level factors. Our results clearly show that one indeed cannot fully grasp the impact of CEO-level traits on firm-level CSR without accounting for the institutional context in which these firms operate and vice versa.
In terms of managerial implications, in line with prior studies emphasizing that CEO narcissism can have dark but also bright sides (e.g., Bollaert & Petit, 2010; Maccoby, 2000; Patel & Cooper, 2014), our findings highlight that one should go beyond the question of whether narcissism at the CEO level is good or bad because such a sharp distinction may not be very productive. We add to this conversation by demonstrating that the behavior of narcissistic CEOs is context dependent; they flexibly adjust their behavior to what is valued in the context in which they operate. This implies that boards can, at least to some extent, steer CEOs toward preferred (CSR) behavior by emphasizing what they value. Along the same lines, tailoring compensation packages for (narcissistic) CEOs also may align CEOs’ behavior with what firms and societies value. In prior work, Buyl et al. (2019) found that incentivizing narcissistic CEOs with stock options intensifies their risk-taking behavior. In a similar vein, CSR contracting—that is, tying CEO pay to various social and environmental targets—may stimulate narcissistic CEOs to pursue CSR-related behavior (cfr., Boone et al., 2022a).
Limitations and Future Research Avenues
Our findings should be viewed in light of our study’s limitations, which also provide inspiration for future research opportunities. First, in line with the bulk of CEO narcissism research (see Cragun et al., 2020), we use archival measures to capture this trait. For large-scale longitudinal comparative research such as ours, there are no obvious alternatives for using archival data. We acknowledge that such archival measures are only crude proxies of complex personality differences and therefore have their own limitations (Cragun et al., 2020). Nevertheless, past research has demonstrated the validity of this unobtrusive approach (e.g., Buyl et al., 2019; Chatterjee & Hambrick, 2007; Patel & Cooper, 2014). In this study we also found that our CEO narcissism measure correlates with an established measure of “narcissistic rhetoric” (see above) as well as with several CEO- and firm-level variables that have been related to narcissism in the past, underscoring our measure’s face validity. In addition, we have provided sensitivity analyses with five alternative operationalizations of CEO narcissism. That being said, for more detailed, smaller-scaled studies, surveys and/or qualitative studies to gauge CEO narcissism are better suited or potentially large-scale studies using content analysis of large bodies of (spoken) text (cfr., Harrison, Thurgood, Boivie, & Pfarrer’s, 2019, work on CEO personality).
Second, we have chosen to focus on CEOs as the firm’s main decision makers, thereby excluding the potential impact of the remaining executives or other parties that also may affect strategic decision making. In line with Hambrick and Mason’s (1984) plea to study features of the whole dominant coalition and recent work on the internal and external interfaces of the executive suite (e.g., Van Doorn, Heyden, Reimer, Buyl, & Volberda, 2022), it would be fascinating to study how the narcissism levels of various parties included in decision making affect strategic outcomes, such as CSR. Even more so, doing this in a comparative setting would probably be valuable because this joint impact of other decision makers may be especially relevant in CMEs rather than in LMEs, where CEOs are likely to enjoy more managerial discretion (Hambrick & Finkelstein, 1987). In a cross-country comparative study, Crossland and Hambrick (2011) found that informal and formal national institutions are associated with managerial discretion available to the CEO and, in turn, with how much impact CEOs have on their firms’ performance. In particular, they found the highest CEO managerial discretion levels in more liberal countries (United States, United Kingdom, and Canada).
Third, we used the existing varieties-of-capital typology of LME versus CME to represent the institutional context. Although this typology is rather coarse (Witt & Jackson, 2016), it still remains one of the most comprehensive and frequently used typologies in current research (Desender & Epure, 2021). In our analyses, we used a more refined measure, in the form of the continuous coordination index (Hall & Gingerich, 2004). Nevertheless, a major constraint about this typology (and our sample) is the lack of representation of non-Western contexts apart from Japan (Walker et al., 2019). This begs the question of whether our theory is generalizable to other regions of the world. In essence, we would expect that in other contexts, too, narcissistic CEOs will try to adapt their (CSR) behavior to align with the norms and expectations in that institutional context; however, this has not been tested yet. We encourage scholars to study narcissistic CEO behaviors in non-Western settings using our theoretical model as a basis, but translating this logic to what stakeholders value in these particular institutional settings.
Fourth, as a consequence of our sampling strategy, all firms in our sample are large multinational firms that are market leaders in the European market. We speculate that this should not threaten the internal validity of our conclusions. Although it may result in a restriction in range of our core independent variable because the probability of finding a narcissistic CEO is higher in leading firms (Hambrick & Wowak, 2012; also see our first-stage model in Appendix D), such a restriction in range tends to reduce the probability of finding significant results (Shadish, Cook & Campbell, 2002). However, our focus on EU market leaders might limit the external validity of our findings. Although the supplementary sensitivity analyses and robustness checks provide us with confidence that our findings are not dependent on, for instance, specific countries within our sample, we cannot make strong inferences about the generalizability of these findings beyond our sample—for example, to market leaders in countries not included in our dataset and/or to firms that are smaller (and potentially less visible) than the market leaders in our sample.
Finally, because we focused on average differences between institutional contexts in our study, we did not investigate the implications of macro-institutional changes over time. However, Matten and Moon (2020) noted important changes in CSR over the first two decades of the 21st century: In LME contexts, where CSR used to be mostly explicit, they witnessed an “implicitization” trend, whereas in CME contexts, where CSR generally was implicit, they saw an “explicitization” trend. These developments reflect changes in norms and expectations in both institutional contexts related to firm-level CSR outcomes. Moreover, very recently, there seems to be increasing pushback to CSR-related causes, mostly in the United States (spearheaded by the second Trump presidency) but also in Europe (e.g., O’Shea & Wheelan, 2024). In line with our theory about the context-dependent behavior of narcissistic CEOs, we expect that given this recent backlash, narcissistic CEOs might be the first to adjust their behaviors and invest less in CSR-related activities. Our study’s timeframe did not allow us to fully explore the implications of such changes over time, but we hope that future scholars will be inspired to dig deeper into these time-related issues.
Footnotes
Appendix A
Firms and Industries
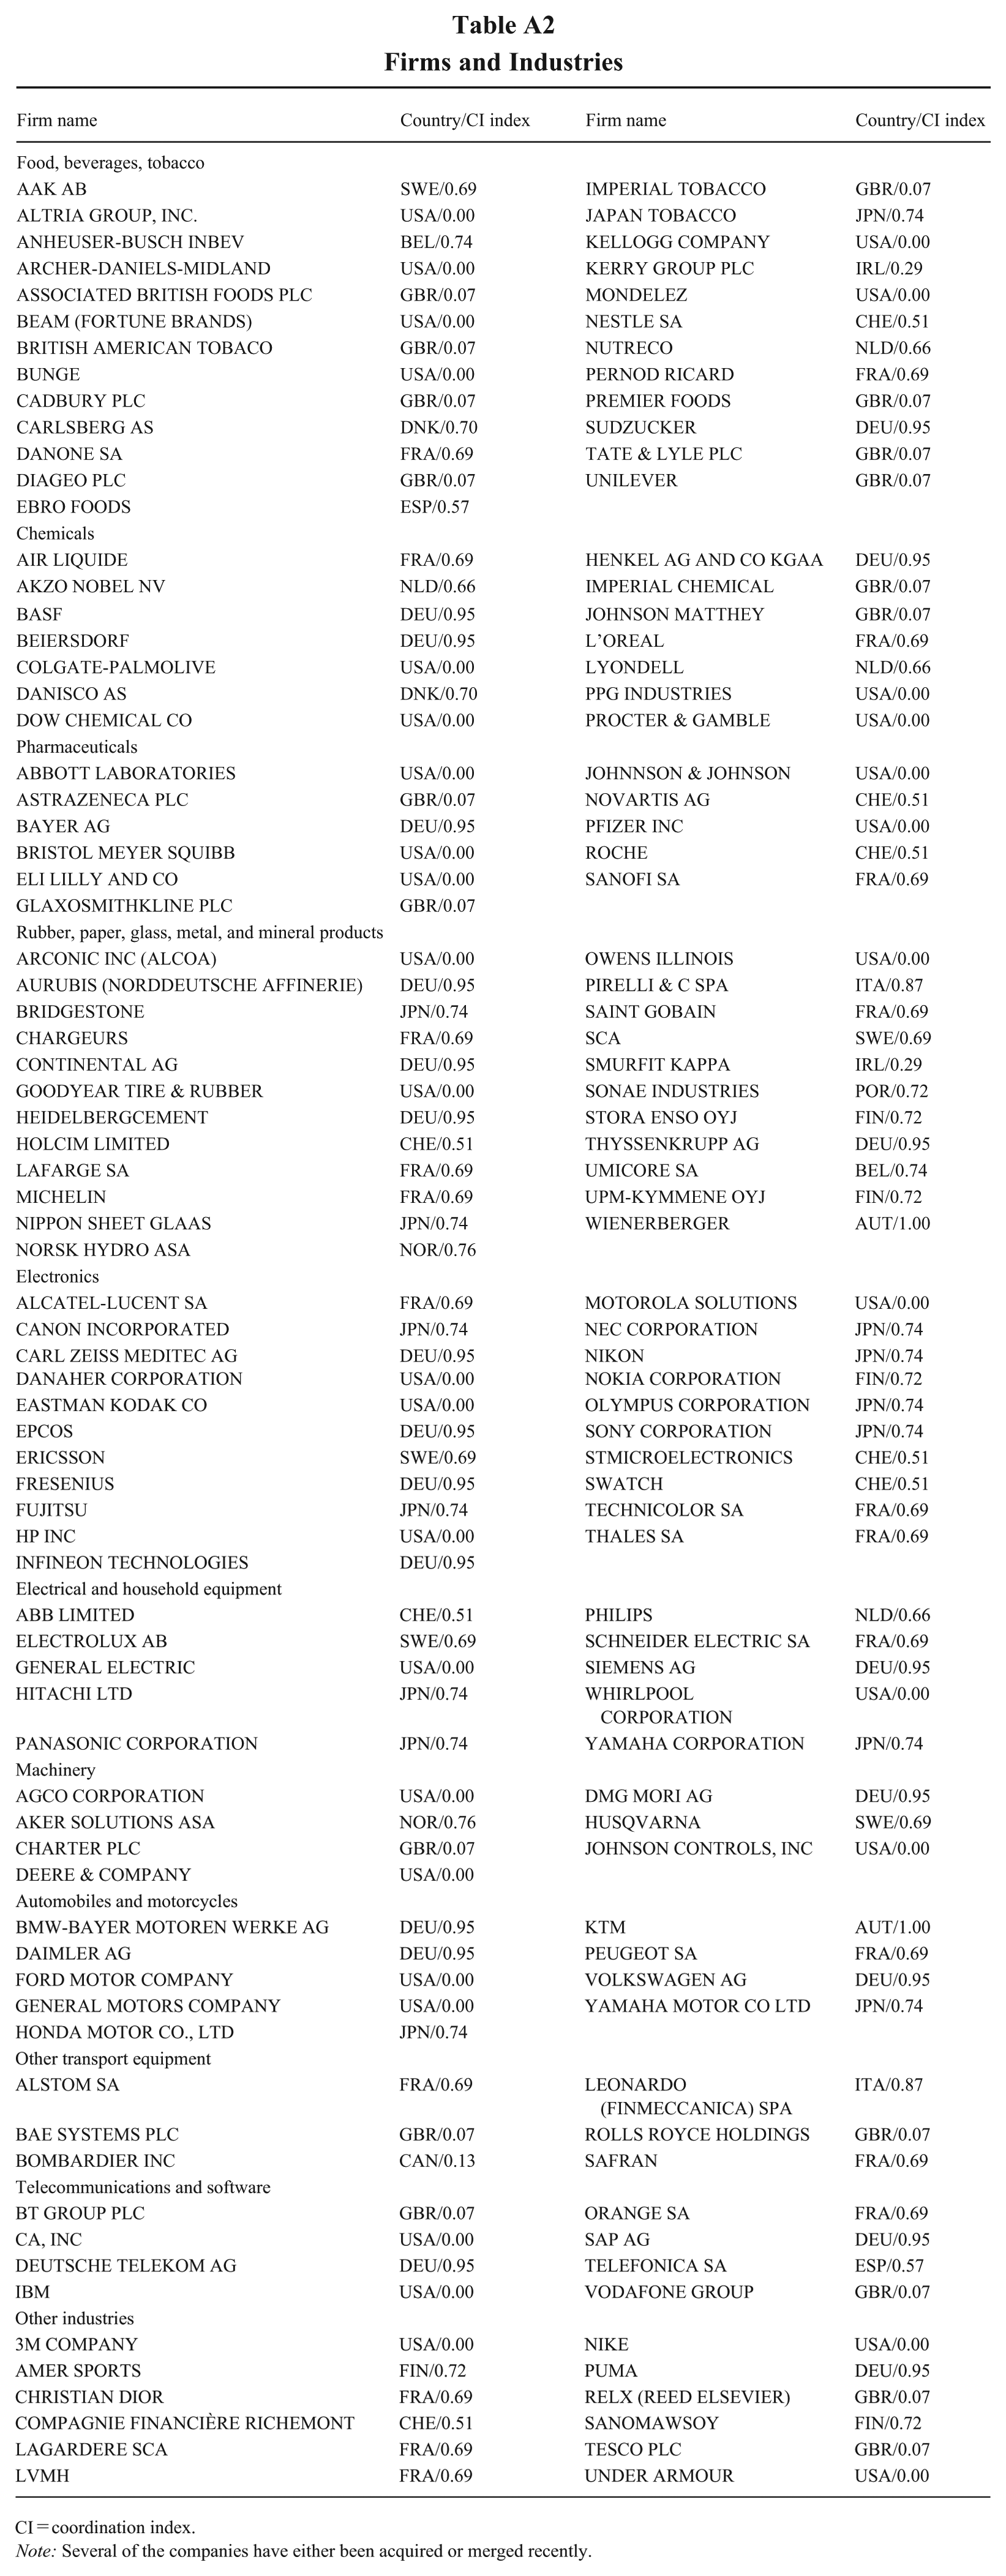
| Firm name | Country/CI index | Firm name | Country/CI index |
|---|---|---|---|
| Food, beverages, tobacco | |||
| AAK AB | SWE/0.69 | IMPERIAL TOBACCO | GBR/0.07 |
| ALTRIA GROUP, INC. | USA/0.00 | JAPAN TOBACCO | JPN/0.74 |
| ANHEUSER-BUSCH INBEV | BEL/0.74 | KELLOGG COMPANY | USA/0.00 |
| ARCHER-DANIELS-MIDLAND | USA/0.00 | KERRY GROUP PLC | IRL/0.29 |
| ASSOCIATED BRITISH FOODS PLC | GBR/0.07 | MONDELEZ | USA/0.00 |
| BEAM (FORTUNE BRANDS) | USA/0.00 | NESTLE SA | CHE/0.51 |
| BRITISH AMERICAN TOBACO | GBR/0.07 | NUTRECO | NLD/0.66 |
| BUNGE | USA/0.00 | PERNOD RICARD | FRA/0.69 |
| CADBURY PLC | GBR/0.07 | PREMIER FOODS | GBR/0.07 |
| CARLSBERG AS | DNK/0.70 | SUDZUCKER | DEU/0.95 |
| DANONE SA | FRA/0.69 | TATE & LYLE PLC | GBR/0.07 |
| DIAGEO PLC | GBR/0.07 | UNILEVER | GBR/0.07 |
| EBRO FOODS | ESP/0.57 | ||
| Chemicals | |||
| AIR LIQUIDE | FRA/0.69 | HENKEL AG AND CO KGAA | DEU/0.95 |
| AKZO NOBEL NV | NLD/0.66 | IMPERIAL CHEMICAL | GBR/0.07 |
| BASF | DEU/0.95 | JOHNSON MATTHEY | GBR/0.07 |
| BEIERSDORF | DEU/0.95 | L’OREAL | FRA/0.69 |
| COLGATE-PALMOLIVE | USA/0.00 | LYONDELL | NLD/0.66 |
| DANISCO AS | DNK/0.70 | PPG INDUSTRIES | USA/0.00 |
| DOW CHEMICAL CO | USA/0.00 | PROCTER & GAMBLE | USA/0.00 |
| Pharmaceuticals | |||
| ABBOTT LABORATORIES | USA/0.00 | JOHNNSON & JOHNSON | USA/0.00 |
| ASTRAZENECA PLC | GBR/0.07 | NOVARTIS AG | CHE/0.51 |
| BAYER AG | DEU/0.95 | PFIZER INC | USA/0.00 |
| BRISTOL MEYER SQUIBB | USA/0.00 | ROCHE | CHE/0.51 |
| ELI LILLY AND CO | USA/0.00 | SANOFI SA | FRA/0.69 |
| GLAXOSMITHKLINE PLC | GBR/0.07 | ||
| Rubber, paper, glass, metal, and mineral products | |||
| ARCONIC INC (ALCOA) | USA/0.00 | OWENS ILLINOIS | USA/0.00 |
| AURUBIS (NORDDEUTSCHE AFFINERIE) | DEU/0.95 | PIRELLI & C SPA | ITA/0.87 |
| BRIDGESTONE | JPN/0.74 | SAINT GOBAIN | FRA/0.69 |
| CHARGEURS | FRA/0.69 | SCA | SWE/0.69 |
| CONTINENTAL AG | DEU/0.95 | SMURFIT KAPPA | IRL/0.29 |
| GOODYEAR TIRE & RUBBER | USA/0.00 | SONAE INDUSTRIES | POR/0.72 |
| HEIDELBERGCEMENT | DEU/0.95 | STORA ENSO OYJ | FIN/0.72 |
| HOLCIM LIMITED | CHE/0.51 | THYSSENKRUPP AG | DEU/0.95 |
| LAFARGE SA | FRA/0.69 | UMICORE SA | BEL/0.74 |
| MICHELIN | FRA/0.69 | UPM-KYMMENE OYJ | FIN/0.72 |
| NIPPON SHEET GLAAS | JPN/0.74 | WIENERBERGER | AUT/1.00 |
| NORSK HYDRO ASA | NOR/0.76 | ||
| Electronics | |||
| ALCATEL-LUCENT SA | FRA/0.69 | MOTOROLA SOLUTIONS | USA/0.00 |
| CANON INCORPORATED | JPN/0.74 | NEC CORPORATION | JPN/0.74 |
| CARL ZEISS MEDITEC AG | DEU/0.95 | NIKON | JPN/0.74 |
| DANAHER CORPORATION | USA/0.00 | NOKIA CORPORATION | FIN/0.72 |
| EASTMAN KODAK CO | USA/0.00 | OLYMPUS CORPORATION | JPN/0.74 |
| EPCOS | DEU/0.95 | SONY CORPORATION | JPN/0.74 |
| ERICSSON | SWE/0.69 | STMICROELECTRONICS | CHE/0.51 |
| FRESENIUS | DEU/0.95 | SWATCH | CHE/0.51 |
| FUJITSU | JPN/0.74 | TECHNICOLOR SA | FRA/0.69 |
| HP INC | USA/0.00 | THALES SA | FRA/0.69 |
| INFINEON TECHNOLOGIES | DEU/0.95 | ||
| Electrical and household equipment | |||
| ABB LIMITED | CHE/0.51 | PHILIPS | NLD/0.66 |
| ELECTROLUX AB | SWE/0.69 | SCHNEIDER ELECTRIC SA | FRA/0.69 |
| GENERAL ELECTRIC | USA/0.00 | SIEMENS AG | DEU/0.95 |
| HITACHI LTD | JPN/0.74 | WHIRLPOOL CORPORATION | USA/0.00 |
| PANASONIC CORPORATION | JPN/0.74 | YAMAHA CORPORATION | JPN/0.74 |
| Machinery | |||
| AGCO CORPORATION | USA/0.00 | DMG MORI AG | DEU/0.95 |
| AKER SOLUTIONS ASA | NOR/0.76 | HUSQVARNA | SWE/0.69 |
| CHARTER PLC | GBR/0.07 | JOHNSON CONTROLS, INC | USA/0.00 |
| DEERE & COMPANY | USA/0.00 | ||
| Automobiles and motorcycles | |||
| BMW-BAYER MOTOREN WERKE AG | DEU/0.95 | KTM | AUT/1.00 |
| DAIMLER AG | DEU/0.95 | PEUGEOT SA | FRA/0.69 |
| FORD MOTOR COMPANY | USA/0.00 | VOLKSWAGEN AG | DEU/0.95 |
| GENERAL MOTORS COMPANY | USA/0.00 | YAMAHA MOTOR CO LTD | JPN/0.74 |
| HONDA MOTOR CO., LTD | JPN/0.74 | ||
| Other transport equipment | |||
| ALSTOM SA | FRA/0.69 | LEONARDO (FINMECCANICA) SPA | ITA/0.87 |
| BAE SYSTEMS PLC | GBR/0.07 | ROLLS ROYCE HOLDINGS | GBR/0.07 |
| BOMBARDIER INC | CAN/0.13 | SAFRAN | FRA/0.69 |
| Telecommunications and software | |||
| BT GROUP PLC | GBR/0.07 | ORANGE SA | FRA/0.69 |
| CA, INC | USA/0.00 | SAP AG | DEU/0.95 |
| DEUTSCHE TELEKOM AG | DEU/0.95 | TELEFONICA SA | ESP/0.57 |
| IBM | USA/0.00 | VODAFONE GROUP | GBR/0.07 |
| Other industries | |||
| 3M COMPANY | USA/0.00 | NIKE | USA/0.00 |
| AMER SPORTS | FIN/0.72 | PUMA | DEU/0.95 |
| CHRISTIAN DIOR | FRA/0.69 | RELX (REED ELSEVIER) | GBR/0.07 |
| COMPAGNIE FINANCIÈRE RICHEMONT | CHE/0.51 | SANOMAWSOY | FIN/0.72 |
| LAGARDERE SCA | FRA/0.69 | TESCO PLC | GBR/0.07 |
| LVMH | FRA/0.69 | UNDER ARMOUR | USA/0.00 |
CI = coordination index.
Note: Several of the companies have either been acquired or merged recently.
Appendix B
ASSET4 Items Included in Strategic CSR Measure and Comparison with MSCI-based Score
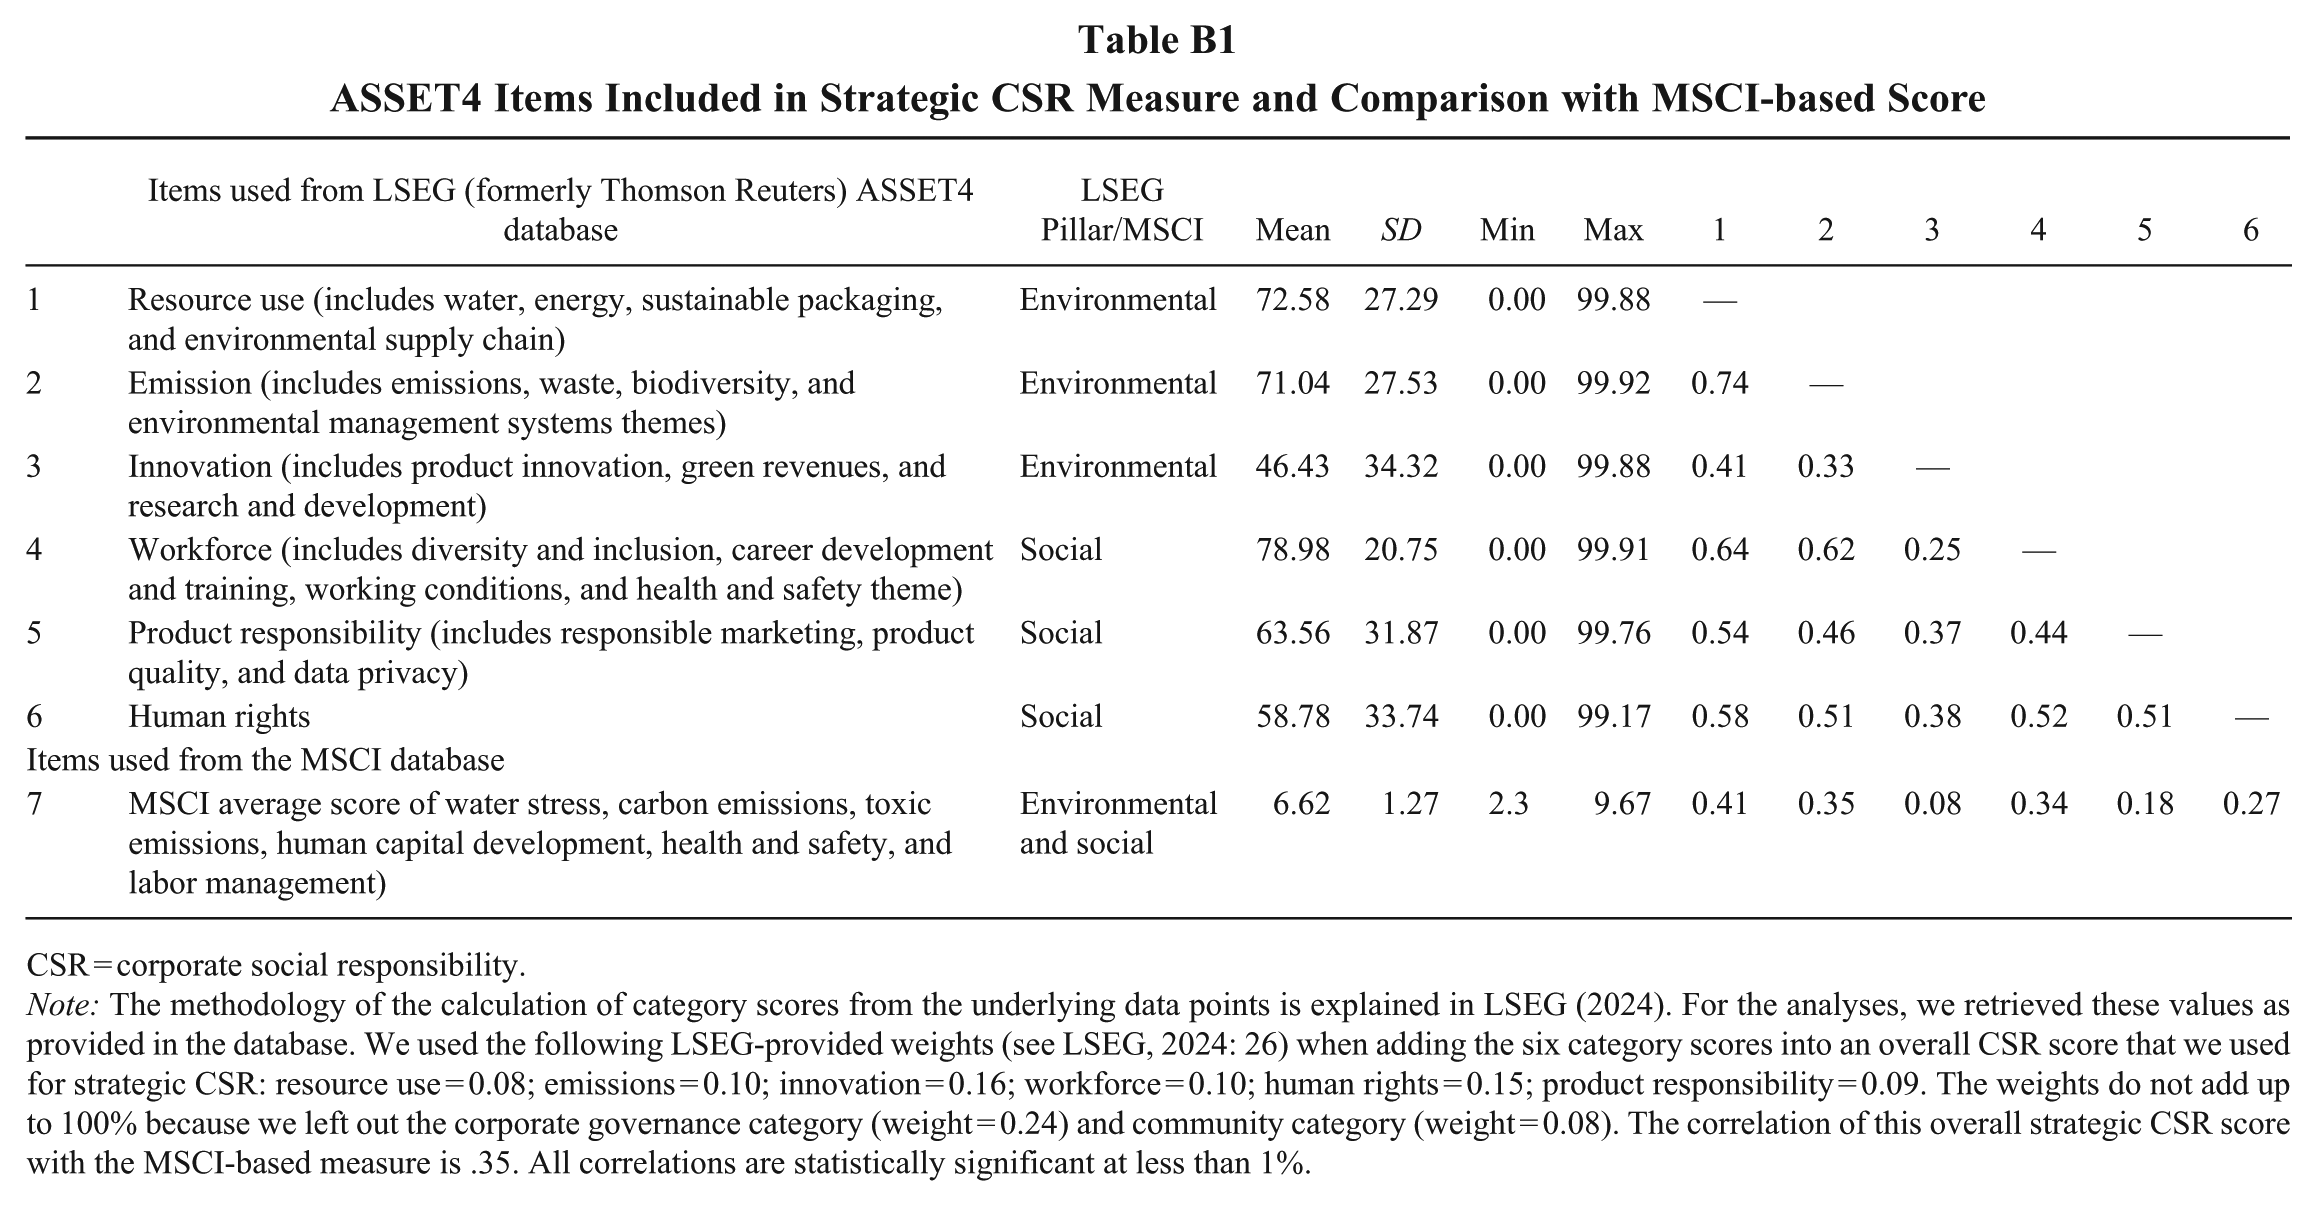
| Items used from LSEG (formerly Thomson Reuters) ASSET4 database | LSEG |
Mean | SD | Min | Max | 1 | 2 | 3 | 4 | 5 | 6 | |
|---|---|---|---|---|---|---|---|---|---|---|---|---|
| 1 | Resource use (includes water, energy, sustainable packaging, and environmental supply chain) | Environmental | 72.58 | 27.29 | 0.00 | 99.88 | — | |||||
| 2 | Emission (includes emissions, waste, biodiversity, and environmental management systems themes) | Environmental | 71.04 | 27.53 | 0.00 | 99.92 | 0.74 | — | ||||
| 3 | Innovation (includes product innovation, green revenues, and research and development) | Environmental | 46.43 | 34.32 | 0.00 | 99.88 | 0.41 | 0.33 | — | |||
| 4 | Workforce (includes diversity and inclusion, career development and training, working conditions, and health and safety theme) | Social | 78.98 | 20.75 | 0.00 | 99.91 | 0.64 | 0.62 | 0.25 | — | ||
| 5 | Product responsibility (includes responsible marketing, product quality, and data privacy) | Social | 63.56 | 31.87 | 0.00 | 99.76 | 0.54 | 0.46 | 0.37 | 0.44 | — | |
| 6 | Human rights | Social | 58.78 | 33.74 | 0.00 | 99.17 | 0.58 | 0.51 | 0.38 | 0.52 | 0.51 | — |
| Items used from the MSCI database | ||||||||||||
| 7 | MSCI average score of water stress, carbon emissions, toxic emissions, human capital development, health and safety, and labor management) | Environmental and social | 6.62 | 1.27 | 2.3 | 9.67 | 0.41 | 0.35 | 0.08 | 0.34 | 0.18 | 0.27 |
CSR = corporate social responsibility.
Note: The methodology of the calculation of category scores from the underlying data points is explained in LSEG (2024). For the analyses, we retrieved these values as provided in the database. We used the following LSEG-provided weights (see LSEG, 2024: 26) when adding the six category scores into an overall CSR score that we used for strategic CSR: resource use = 0.08; emissions = 0.10; innovation = 0.16; workforce = 0.10; human rights = 0.15; product responsibility = 0.09. The weights do not add up to 100% because we left out the corporate governance category (weight = 0.24) and community category (weight = 0.08). The correlation of this overall strategic CSR score with the MSCI-based measure is .35. All correlations are statistically significant at less than 1%.
Appendix C
Sensitivity Analyses Using Alternative CEO Narcissism Measures
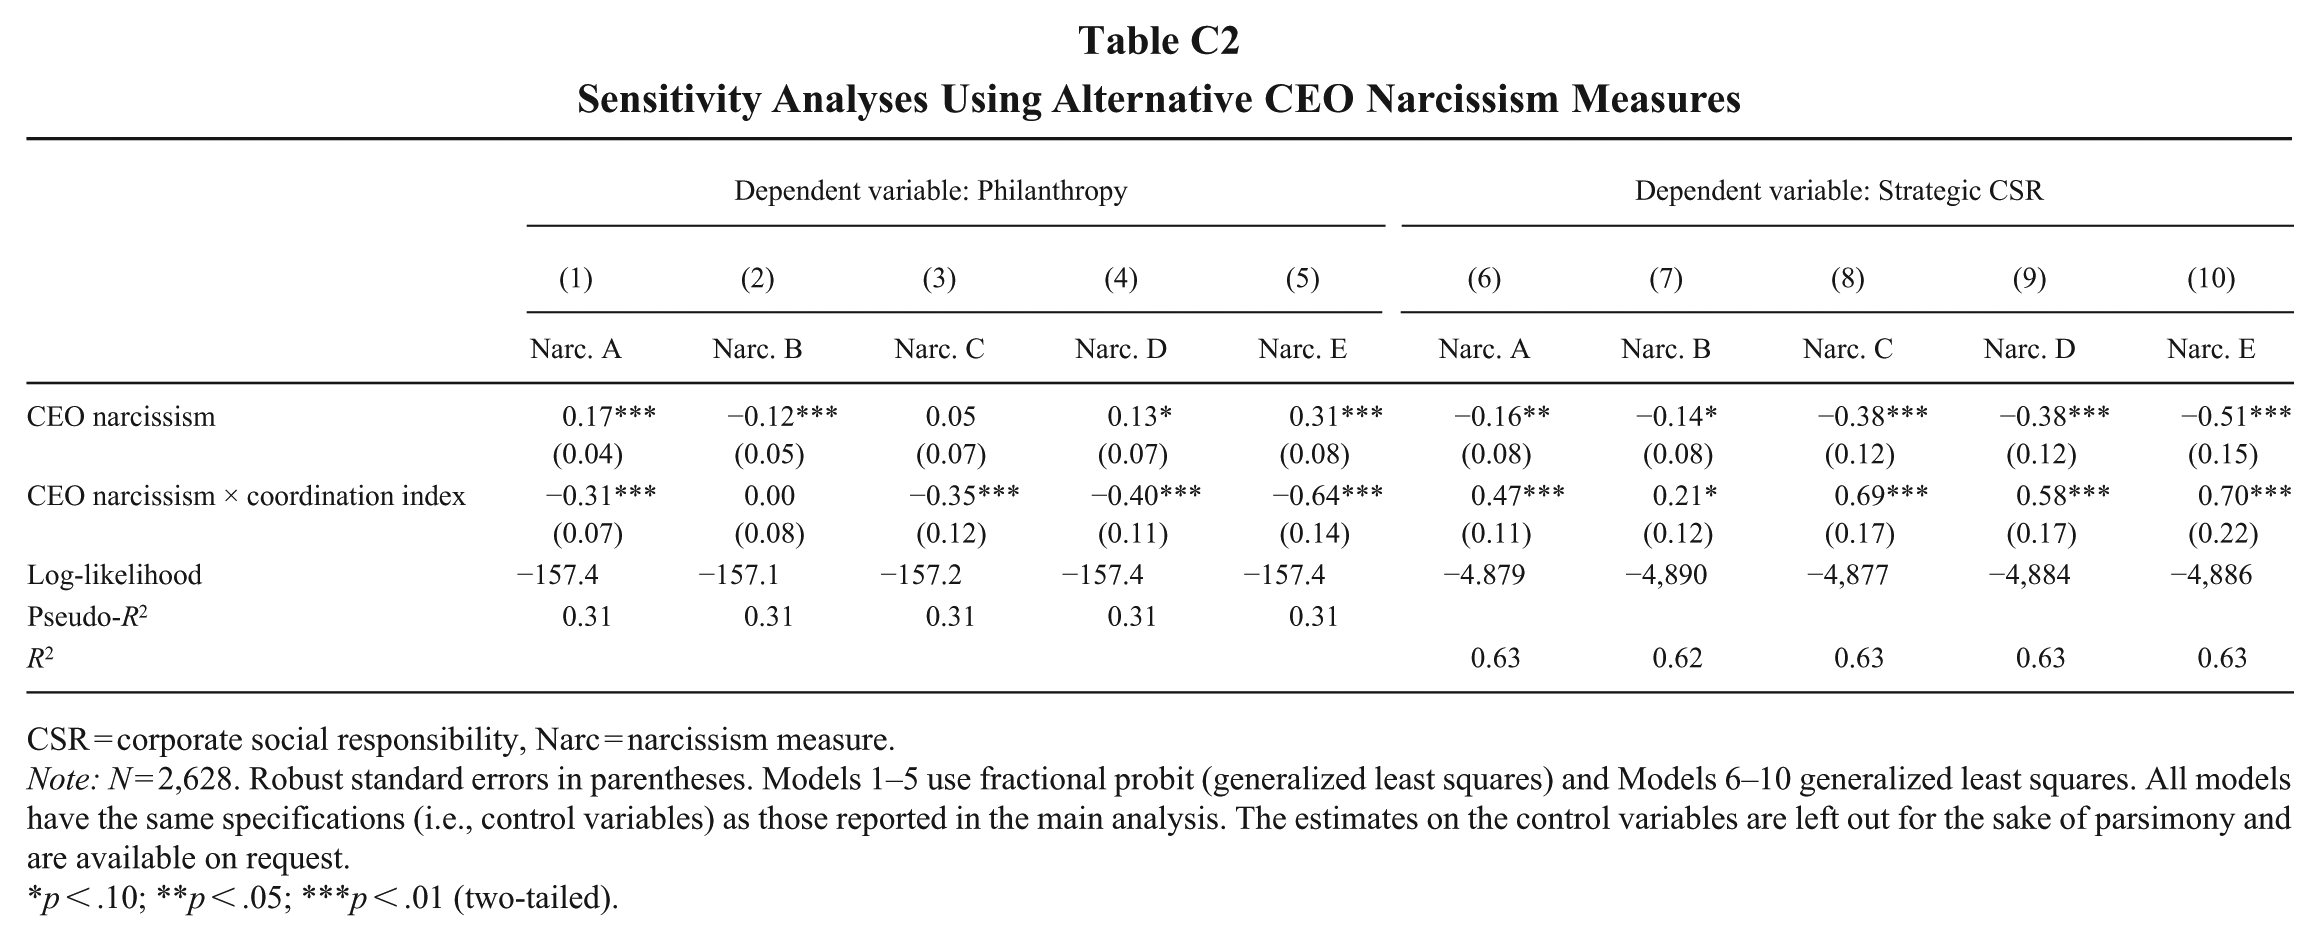
| Dependent variable: Philanthropy | Dependent variable: Strategic CSR | |||||||||
|---|---|---|---|---|---|---|---|---|---|---|
| (1) | (2) | (3) | (4) | (5) | (6) | (7) | (8) | (9) | (10) | |
| Narc. A | Narc. B | Narc. C | Narc. D | Narc. E | Narc. A | Narc. B | Narc. C | Narc. D | Narc. E | |
| CEO narcissism | 0.17***
(0.04) |
−0.12***
(0.05) |
0.05 (0.07) |
0.13*
(0.07) |
0.31***
(0.08) |
−0.16**
(0.08) |
−0.14*
(0.08) |
−0.38***
(0.12) |
−0.38***
(0.12) |
−0.51***
(0.15) |
| CEO narcissism × coordination index | −0.31***
(0.07) |
0.00 (0.08) |
−0.35***
(0.12) |
−0.40***
(0.11) |
−0.64***
(0.14) |
0.47***
(0.11) |
0.21*
(0.12) |
0.69***
(0.17) |
0.58***
(0.17) |
0.70***
(0.22) |
| Log-likelihood | −157.4 | −157.1 | −157.2 | −157.4 | −157.4 | −4.879 | −4,890 | −4,877 | −4,884 | −4,886 |
| Pseudo-R2 | 0.31 | 0.31 | 0.31 | 0.31 | 0.31 | |||||
| R 2 | 0.63 | 0.62 | 0.63 | 0.63 | 0.63 | |||||
CSR = corporate social responsibility, Narc = narcissism measure.
Note: N = 2,628. Robust standard errors in parentheses. Models 1–5 use fractional probit (generalized least squares) and Models 6–10 generalized least squares. All models have the same specifications (i.e., control variables) as those reported in the main analysis. The estimates on the control variables are left out for the sake of parsimony and are available on request.
p < .10; **p < .05; ***p < .01 (two-tailed).
Appendix D
First-Stage Model
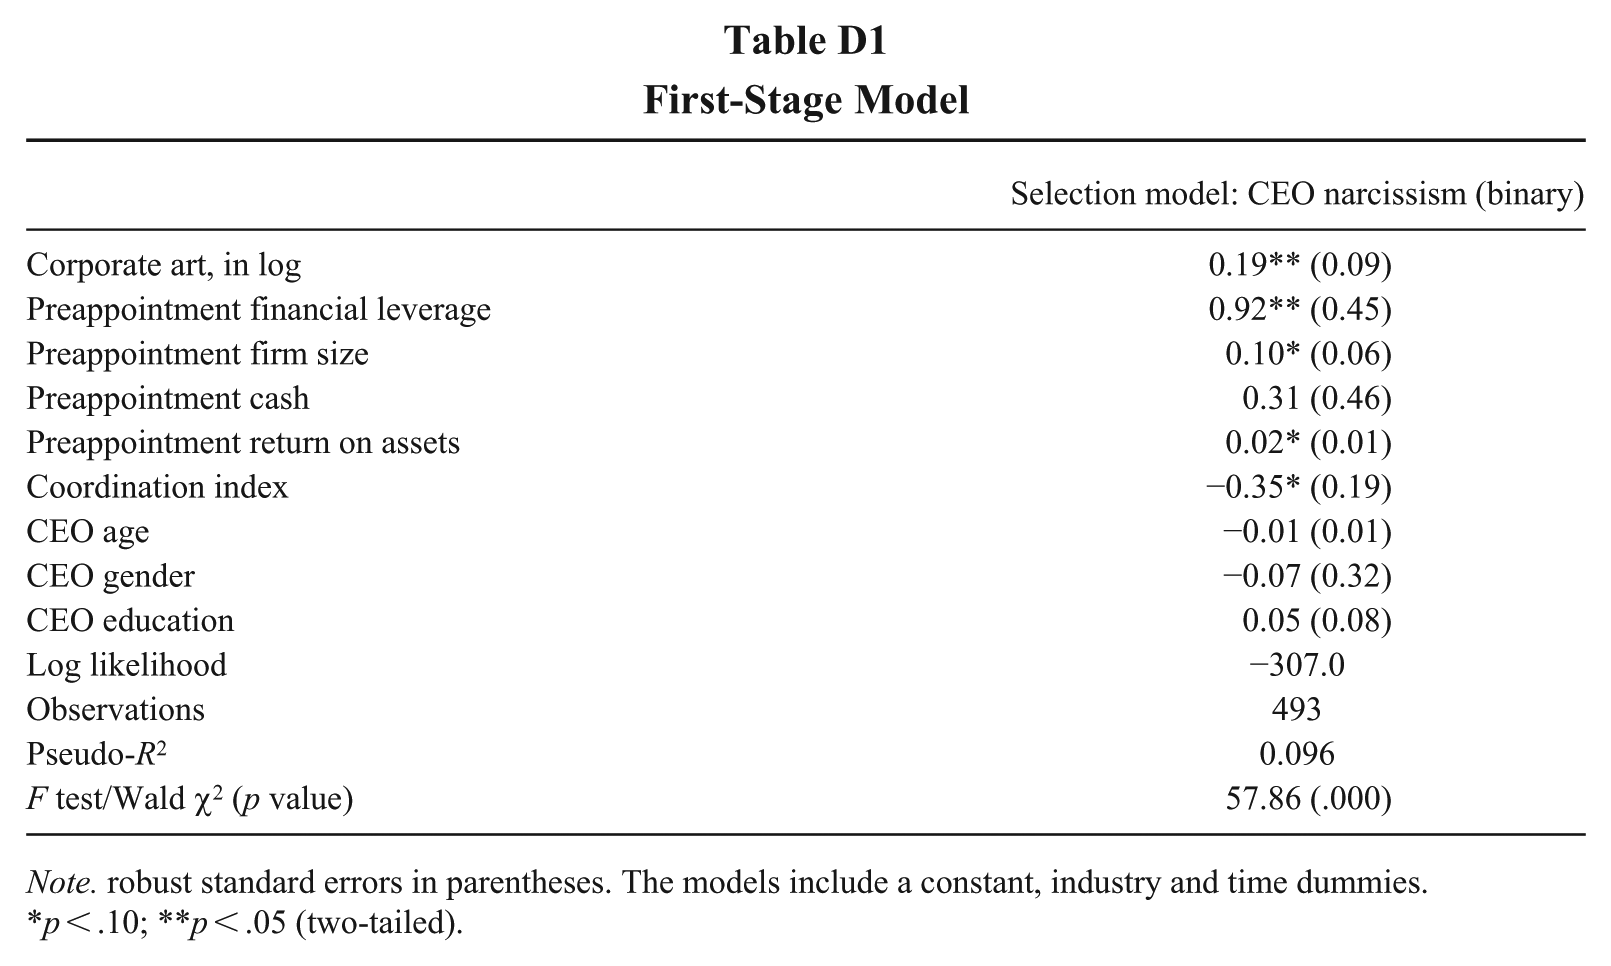
| Selection model: CEO narcissism (binary) | |
|---|---|
| Corporate art, in log | 0.19** (0.09) |
| Preappointment financial leverage | 0.92** (0.45) |
| Preappointment firm size | 0.10* (0.06) |
| Preappointment cash | 0.31 (0.46) |
| Preappointment return on assets | 0.02* (0.01) |
| Coordination index | −0.35* (0.19) |
| CEO age | −0.01 (0.01) |
| CEO gender | −0.07 (0.32) |
| CEO education | 0.05 (0.08) |
| Log likelihood | −307.0 |
| Observations | 493 |
| Pseudo-R2 | 0.096 |
| F test/Wald χ2 (p value) | 57.86 (.000) |
Note. robust standard errors in parentheses. The models include a constant, industry and time dummies.
p < .10; **p < .05 (two-tailed).
Appendix E
Philanthropy and Strategic CSR: CEO Narcissism and Institutional Context (Split Samples)
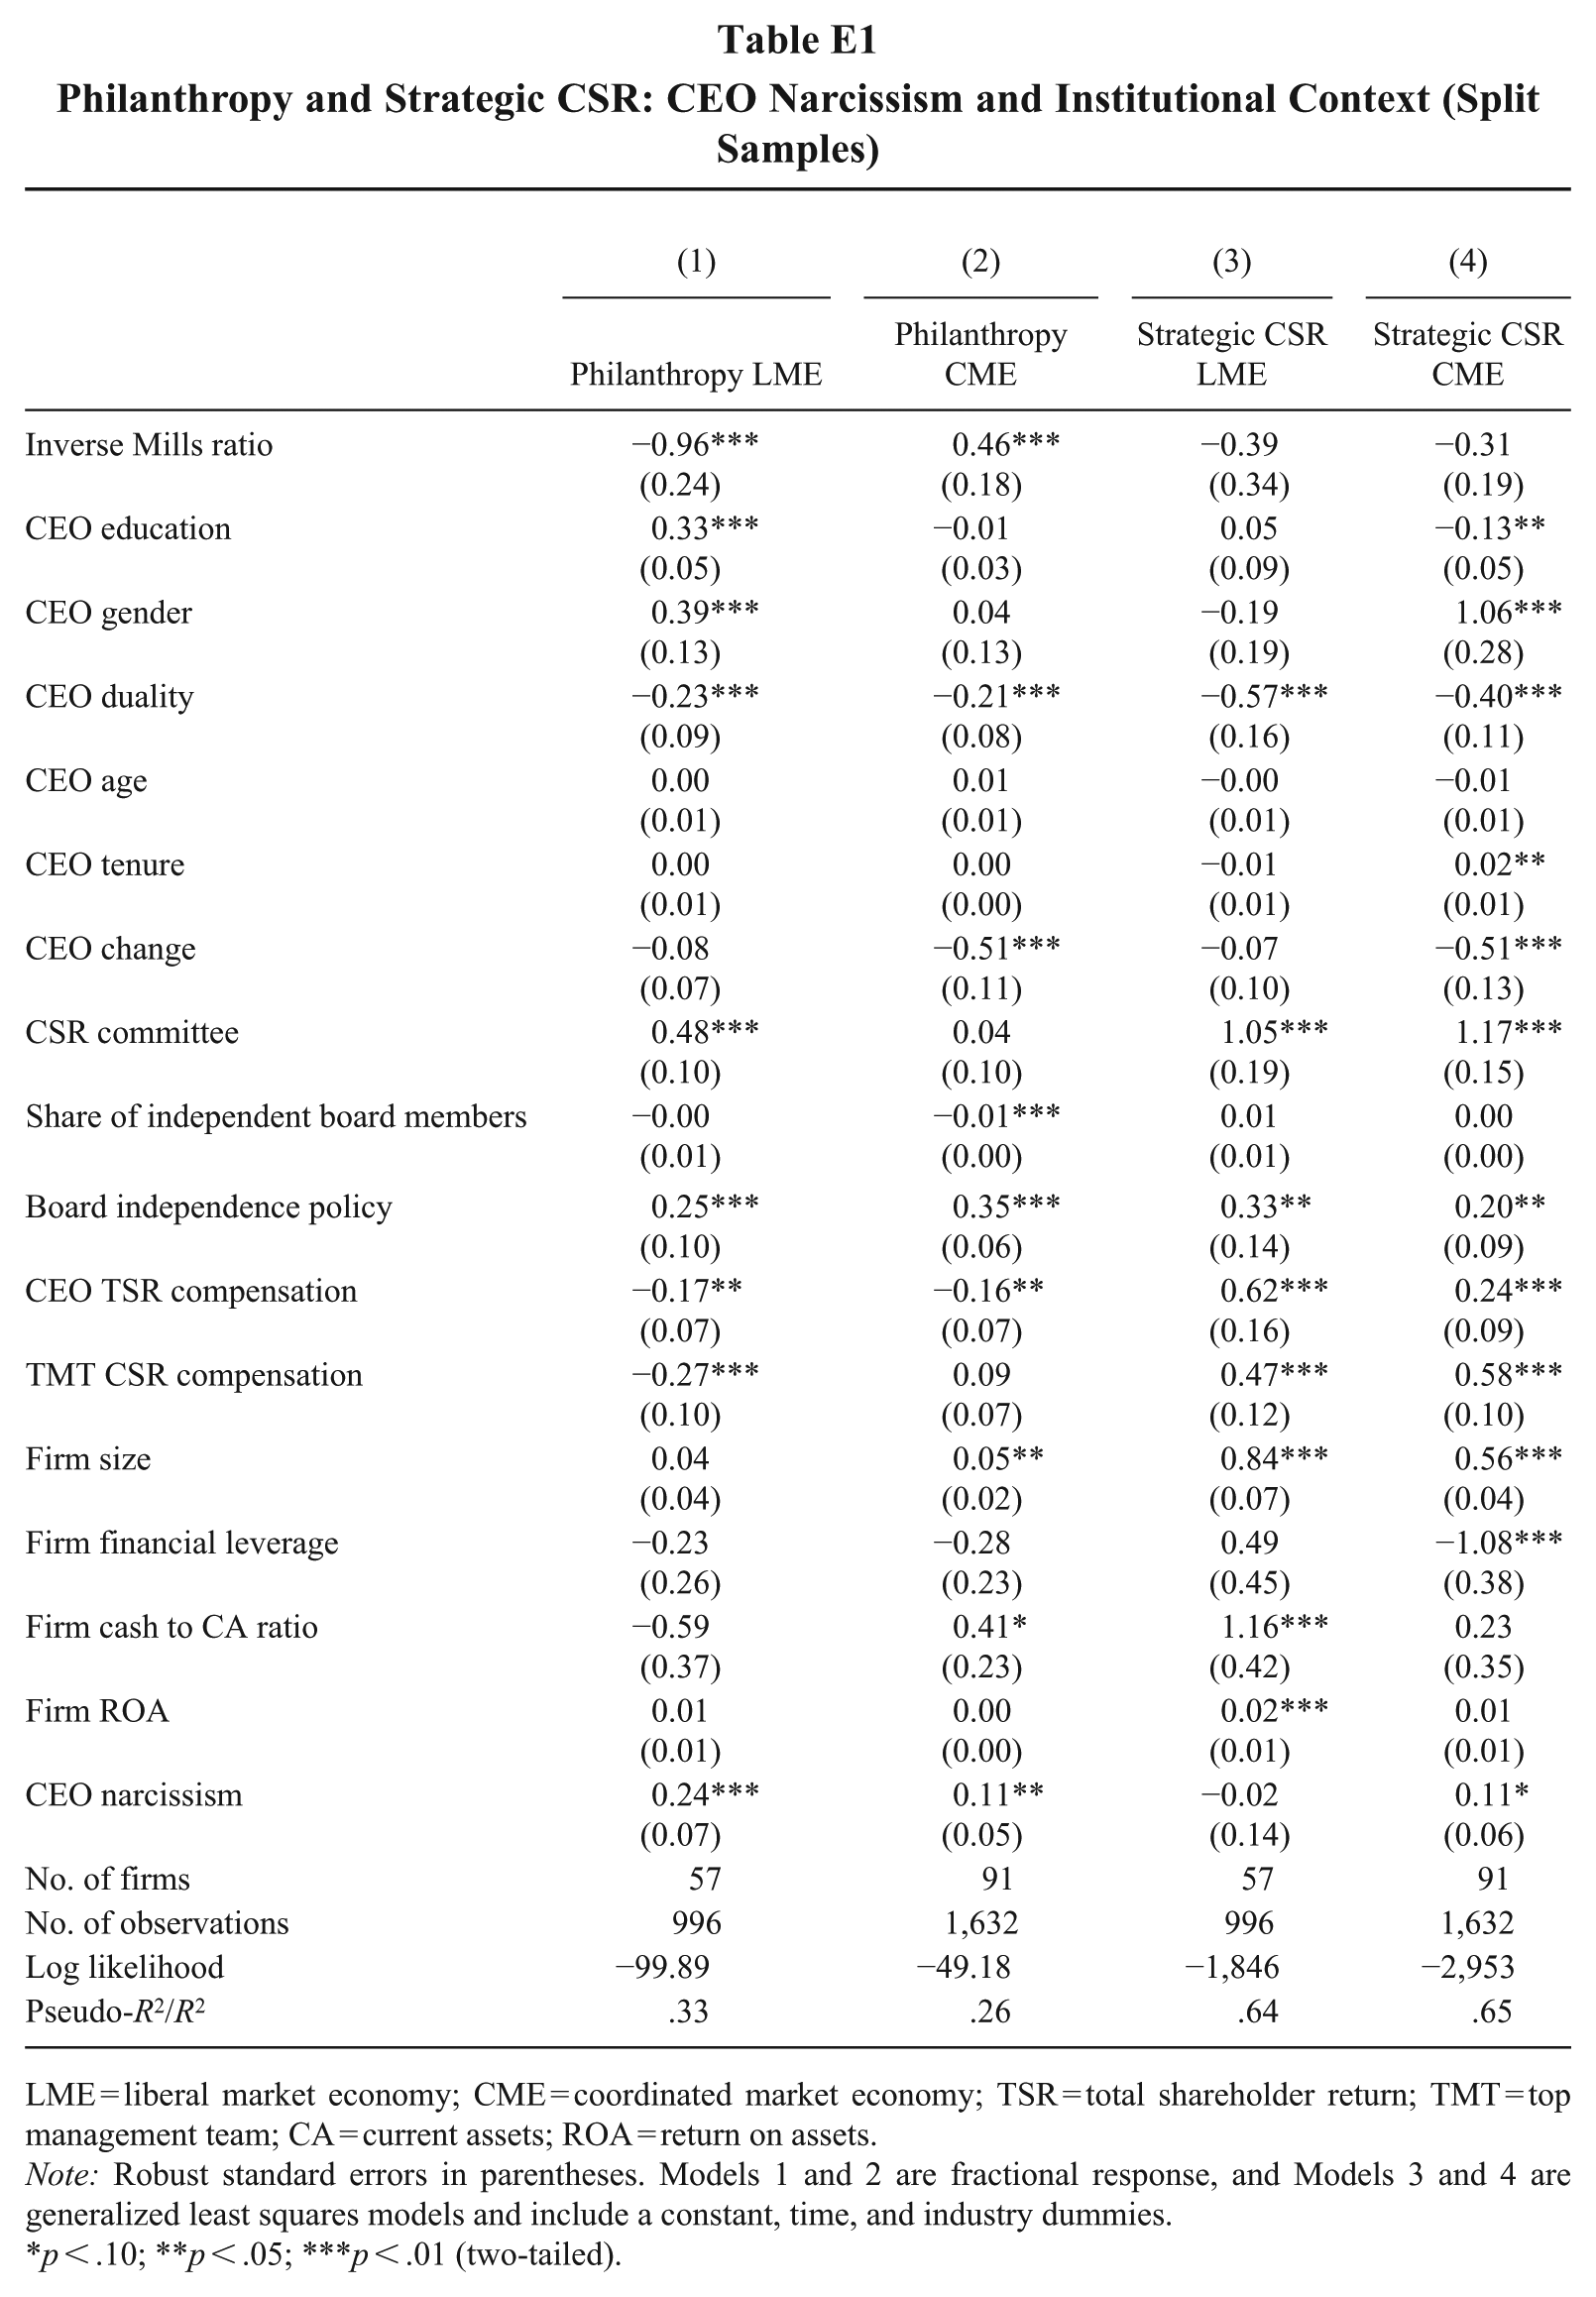
|
|
(1) | (2) | (3) | (4) |
|---|---|---|---|---|
| Philanthropy LME | Philanthropy CME | Strategic CSR LME | Strategic CSR CME | |
| Inverse Mills ratio |
−0.96***(0.24) | 0.46***
(0.18) |
−0.39 (0.34) |
−0.31 (0.19) |
| CEO education | 0.33***
(0.05) |
−0.01 (0.03) |
0.05 (0.09) |
−0.13**
(0.05) |
| CEO gender | 0.39***
(0.13) |
0.04 (0.13) |
−0.19 (0.19) |
1.06***
(0.28) |
| CEO duality | −0.23***
(0.09) |
−0.21***
(0.08) |
−0.57***
(0.16) |
−0.40***
(0.11) |
| CEO age | 0.00 (0.01) |
0.01 (0.01) |
−0.00 (0.01) |
−0.01 (0.01) |
| CEO tenure | 0.00 (0.01) |
0.00 (0.00) |
−0.01 (0.01) |
0.02**
(0.01) |
| CEO change | −0.08 (0.07) |
−0.51***
(0.11) |
−0.07 (0.10) |
−0.51***
(0.13) |
| CSR committee | 0.48***
(0.10) |
0.04 (0.10) |
1.05***
(0.19) |
1.17***
(0.15) |
| Share of independent board members | −0.00 (0.01) |
−0.01***
(0.00) |
0.01 (0.01) |
0.00 (0.00) |
| Board independence policy | 0.25***
(0.10) |
0.35***
(0.06) |
0.33**
(0.14) |
0.20**
(0.09) |
| CEO TSR compensation | −0.17**
(0.07) |
−0.16**
(0.07) |
0.62***
(0.16) |
0.24***
(0.09) |
| TMT CSR compensation | −0.27***
(0.10) |
0.09 (0.07) |
0.47***
(0.12) |
0.58***
(0.10) |
| Firm size | 0.04 (0.04) |
0.05**
(0.02) |
0.84***
(0.07) |
0.56***
(0.04) |
| Firm financial leverage | −0.23 (0.26) |
−0.28 (0.23) |
0.49 (0.45) |
−1.08***
(0.38) |
| Firm cash to CA ratio | −0.59 (0.37) |
0.41*
(0.23) |
1.16***
(0.42) |
0.23 (0.35) |
| Firm ROA | 0.01 (0.01) |
0.00 (0.00) |
0.02***
(0.01) |
0.01 (0.01) |
| CEO narcissism | 0.24***
(0.07) |
0.11**
(0.05) |
−0.02 (0.14) |
0.11*
(0.06) |
| No. of firms | 57 | 91 | 57 | 91 |
| No. of observations | 996 | 1,632 | 996 | 1,632 |
| Log likelihood | −99.89 | −49.18 | −1,846 | −2,953 |
| Pseudo-R2/R2 | .33 | .26 | .64 | .65 |
LME = liberal market economy; CME = coordinated market economy; TSR = total shareholder return; TMT = top management team; CA = current assets; ROA = return on assets.
Note: Robust standard errors in parentheses. Models 1 and 2 are fractional response, and Models 3 and 4 are generalized least squares models and include a constant, time, and industry dummies.
p < .10; **p < .05; ***p < .01 (two-tailed).
Appendix F
Shareholder Value Orientation, CEO Narcissism and Institutional Context
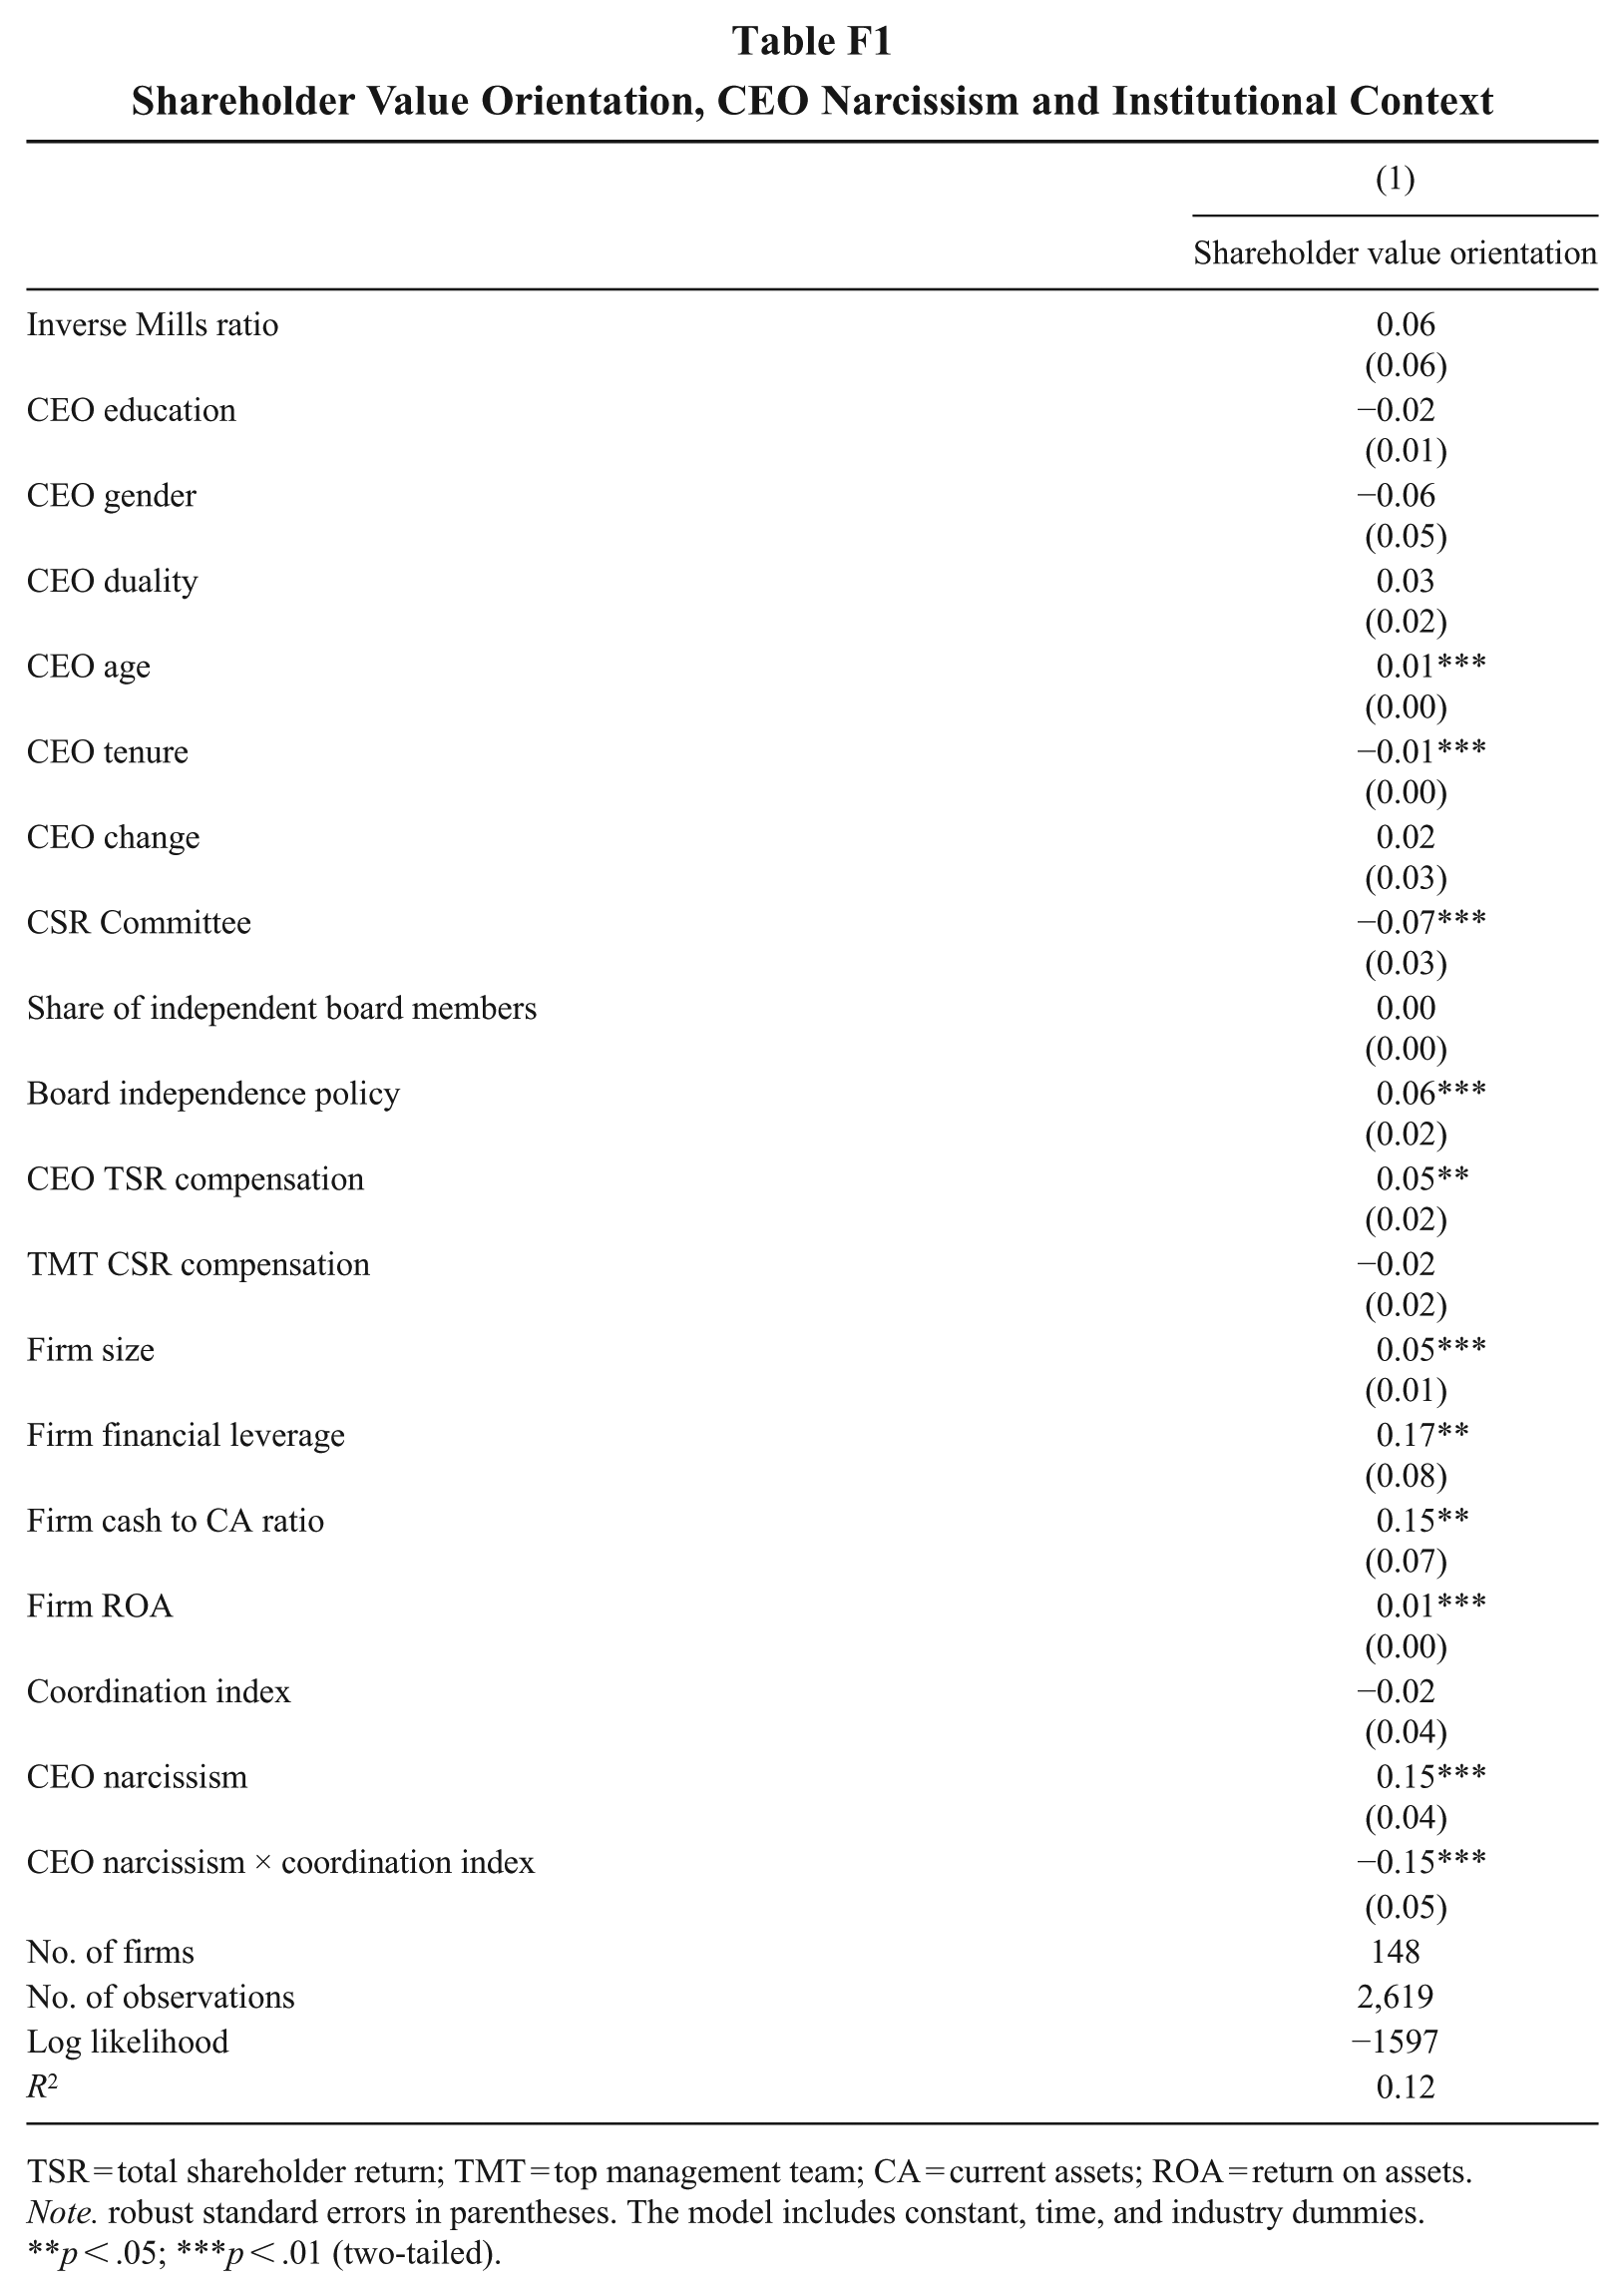
| (1) | |
|---|---|
| Shareholder value orientation | |
| Inverse Mills ratio | 0.06 (0.06) |
| CEO education | −0.02 (0.01) |
| CEO gender | −0.06 (0.05) |
| CEO duality | 0.03 (0.02) |
| CEO age | 0.01***
(0.00) |
| CEO tenure | −0.01***
(0.00) |
| CEO change | 0.02 (0.03) |
| CSR Committee | −0.07***
(0.03) |
| Share of independent board members | 0.00 (0.00) |
| Board independence policy | 0.06***
(0.02) |
| CEO TSR compensation | 0.05**
(0.02) |
| TMT CSR compensation | −0.02 (0.02) |
| Firm size | 0.05***
(0.01) |
| Firm financial leverage | 0.17**
(0.08) |
| Firm cash to CA ratio | 0.15**
(0.07) |
| Firm ROA | 0.01***
(0.00) |
| Coordination index | −0.02 (0.04) |
| CEO narcissism | 0.15***
(0.04) |
| CEO narcissism × coordination index | −0.15*** |
| (0.05) | |
| No. of firms | 148 |
| No. of observations | 2,619 |
| Log likelihood | −1597 |
| R 2 | 0.12 |
TSR = total shareholder return; TMT = top management team; CA = current assets; ROA = return on assets.
Note. robust standard errors in parentheses. The model includes constant, time, and industry dummies.
p < .05; ***p < .01 (two-tailed).
Appendix G
Unscaled Philanthropy Measure
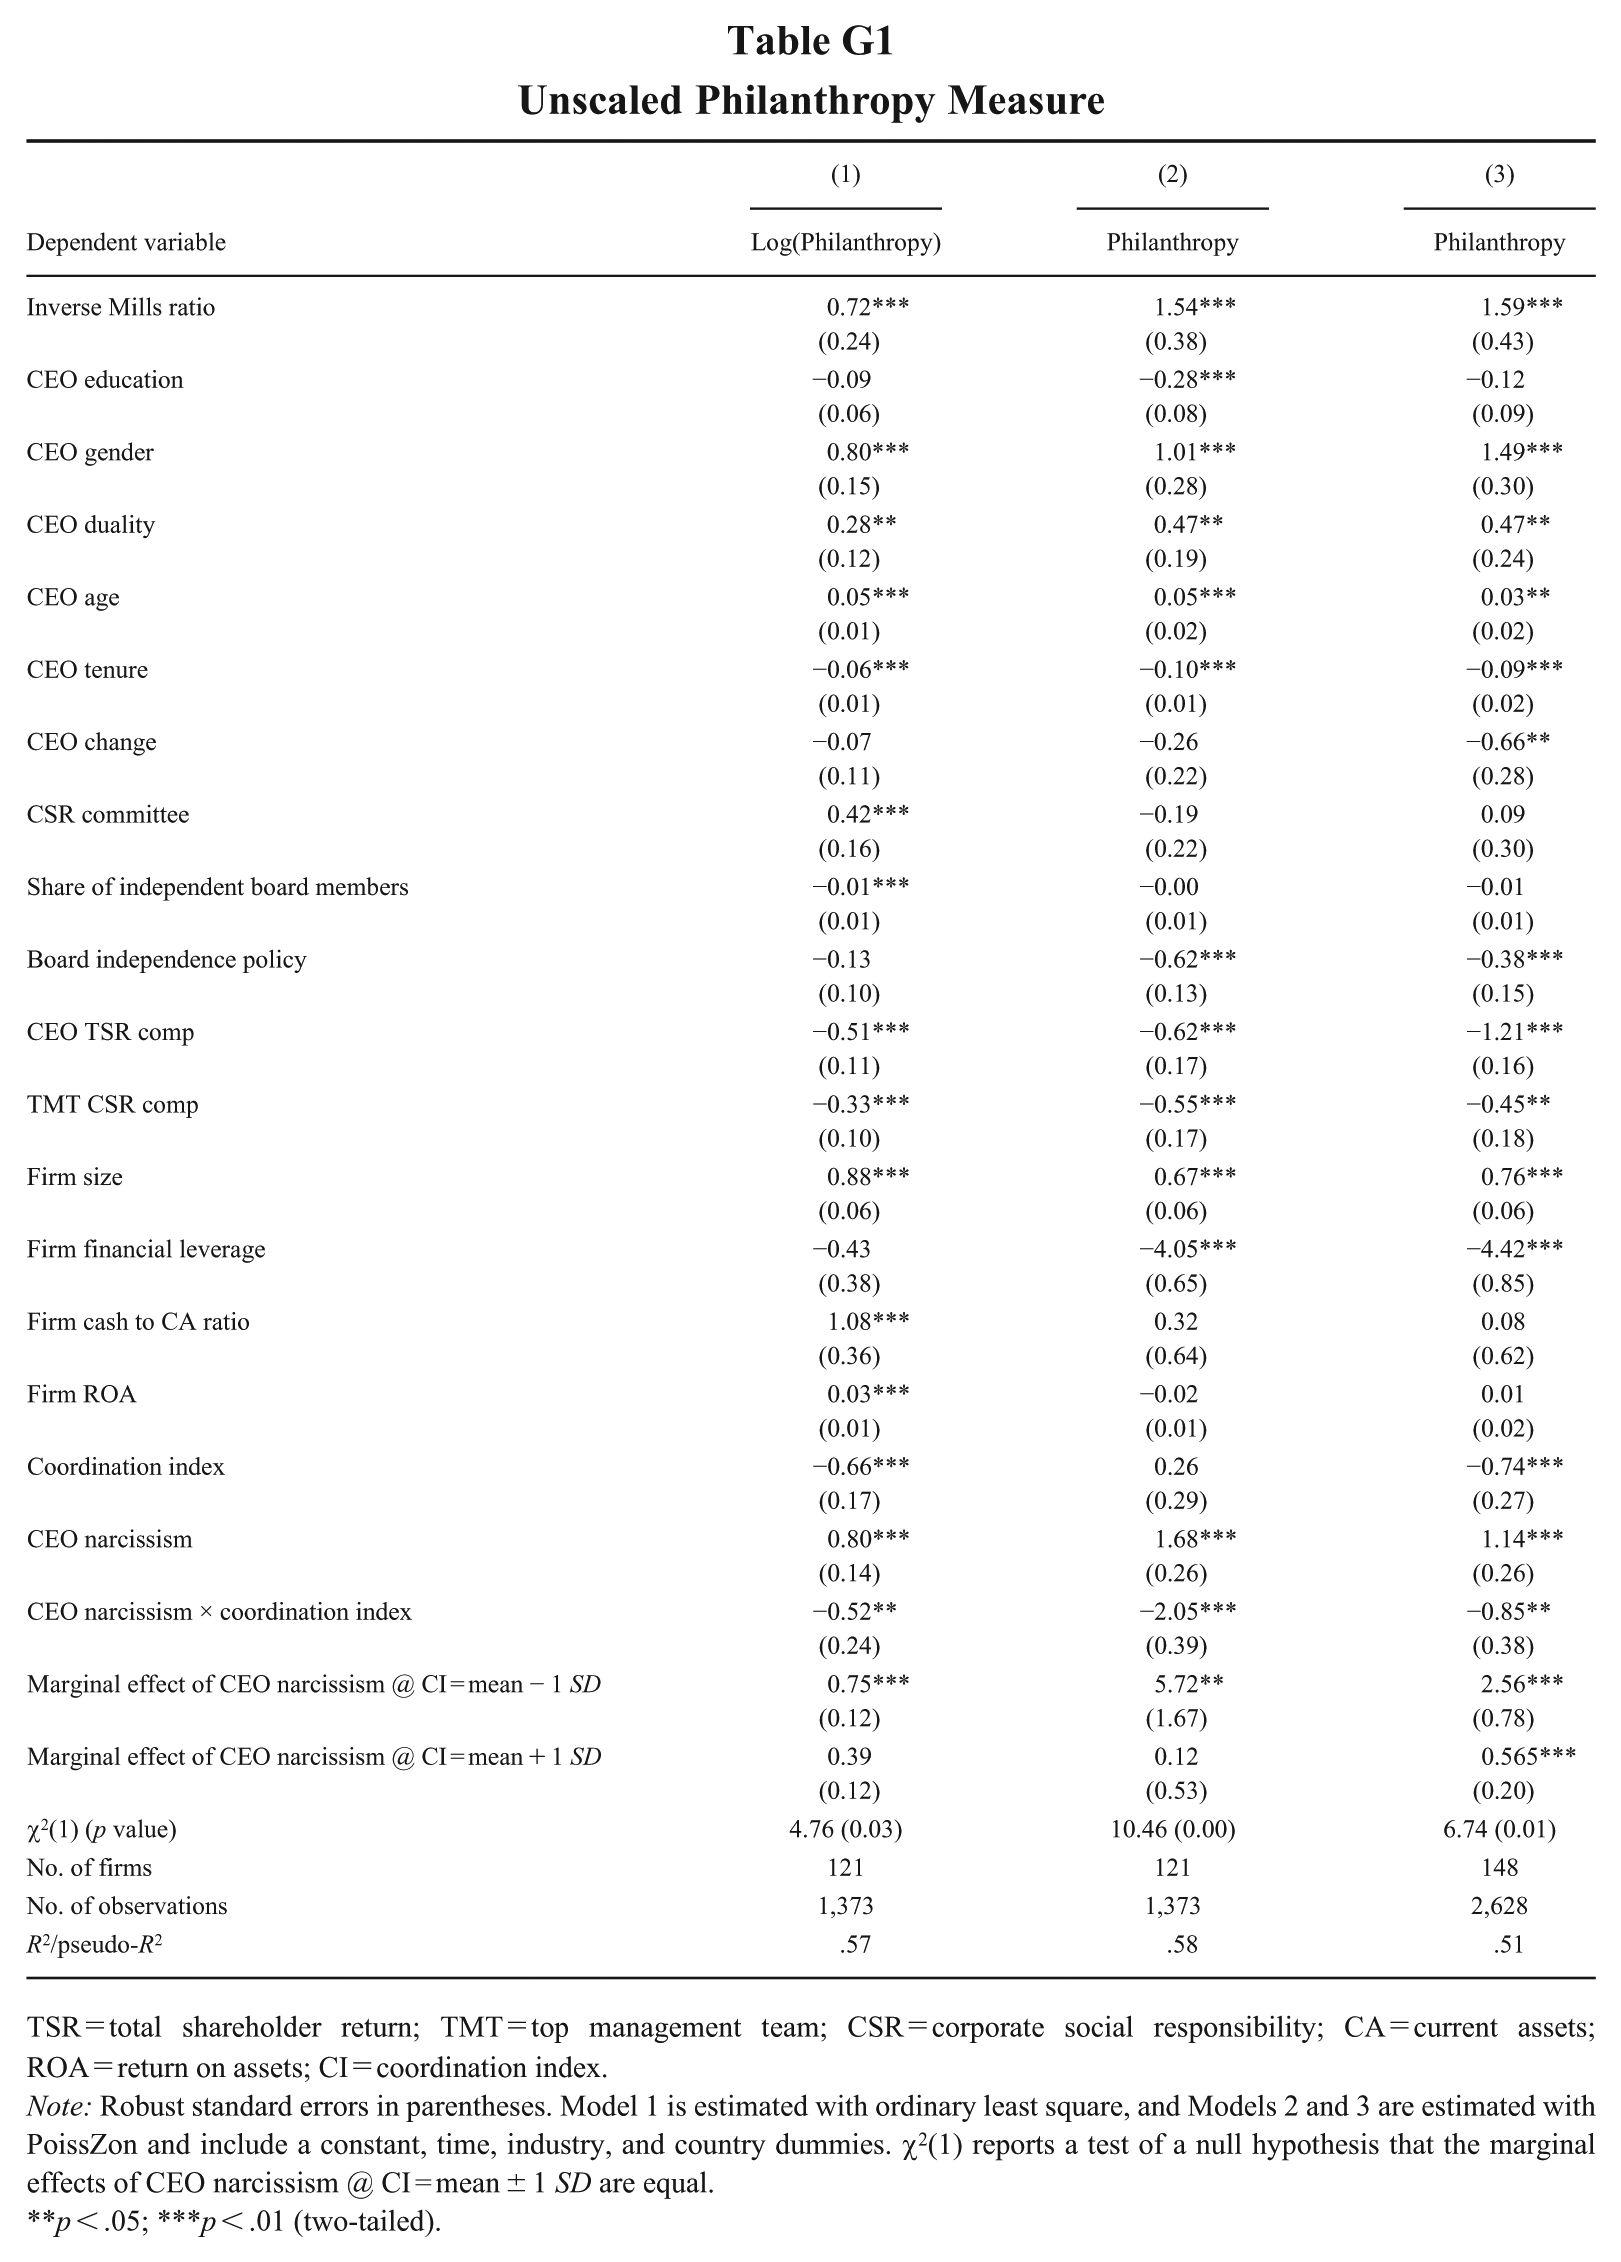
| (1) | (2) | (3) | |
|---|---|---|---|
| Dependent variable | Log(Philanthropy) | Philanthropy | Philanthropy |
| Inverse Mills ratio | 0.72***
(0.24) |
1.54***
(0.38) |
1.59***
(0.43) |
| CEO education | −0.09 (0.06) |
−0.28***
(0.08) |
−0.12 (0.09) |
| CEO gender | 0.80***
(0.15) |
1.01***
(0.28) |
1.49***
(0.30) |
| CEO duality | 0.28**
(0.12) |
0.47**
(0.19) |
0.47**
(0.24) |
| CEO age | 0.05***
(0.01) |
0.05***
(0.02) |
0.03**
(0.02) |
| CEO tenure | −0.06***
(0.01) |
−0.10***
(0.01) |
−0.09***
(0.02) |
| CEO change | −0.07 (0.11) |
−0.26 (0.22) |
−0.66**
(0.28) |
| CSR committee | 0.42***
(0.16) |
−0.19 (0.22) |
0.09 (0.30) |
| Share of independent board members | −0.01***
(0.01) |
−0.00 (0.01) |
−0.01 (0.01) |
| Board independence policy | −0.13 (0.10) |
−0.62***
(0.13) |
−0.38***
(0.15) |
| CEO TSR comp | −0.51***
(0.11) |
−0.62***
(0.17) |
−1.21***
(0.16) |
| TMT CSR comp | −0.33***
(0.10) |
−0.55***
(0.17) |
−0.45**
(0.18) |
| Firm size | 0.88***
(0.06) |
0.67***
(0.06) |
0.76***
(0.06) |
| Firm financial leverage | −0.43 (0.38) |
−4.05***
(0.65) |
−4.42***
(0.85) |
| Firm cash to CA ratio | 1.08***
(0.36) |
0.32 (0.64) |
0.08 (0.62) |
| Firm ROA | 0.03***
(0.01) |
−0.02 (0.01) |
0.01 (0.02) |
| Coordination index | −0.66***
(0.17) |
0.26 (0.29) |
−0.74***
(0.27) |
| CEO narcissism | 0.80***
(0.14) |
1.68***
(0.26) |
1.14***
(0.26) |
| CEO narcissism × coordination index | −0.52**
(0.24) |
−2.05***
(0.39) |
−0.85**
(0.38) |
| Marginal effect of CEO narcissism @ CI = mean − 1 SD | 0.75***
(0.12) |
5.72**
(1.67) |
2.56***
(0.78) |
| Marginal effect of CEO narcissism @ CI = mean + 1 SD | 0.39 (0.12) |
0.12 (0.53) |
0.565***
(0.20) |
| χ2(1) (p value) | 4.76 (0.03) | 10.46 (0.00) | 6.74 (0.01) |
| No. of firms | 121 | 121 | 148 |
| No. of observations | 1,373 | 1,373 | 2,628 |
| R2/pseudo-R2 | .57 | .58 | .51 |
TSR = total shareholder return; TMT = top management team; CSR = corporate social responsibility; CA = current assets; ROA = return on assets; CI = coordination index.
Note: Robust standard errors in parentheses. Model 1 is estimated with ordinary least square, and Models 2 and 3 are estimated with PoissZon and include a constant, time, industry, and country dummies. χ2(1) reports a test of a null hypothesis that the marginal effects of CEO narcissism @ CI = mean ± 1 SD are equal.
p < .05; ***p < .01 (two-tailed).
Appendix H
Strategic CSR: Alternative Measures
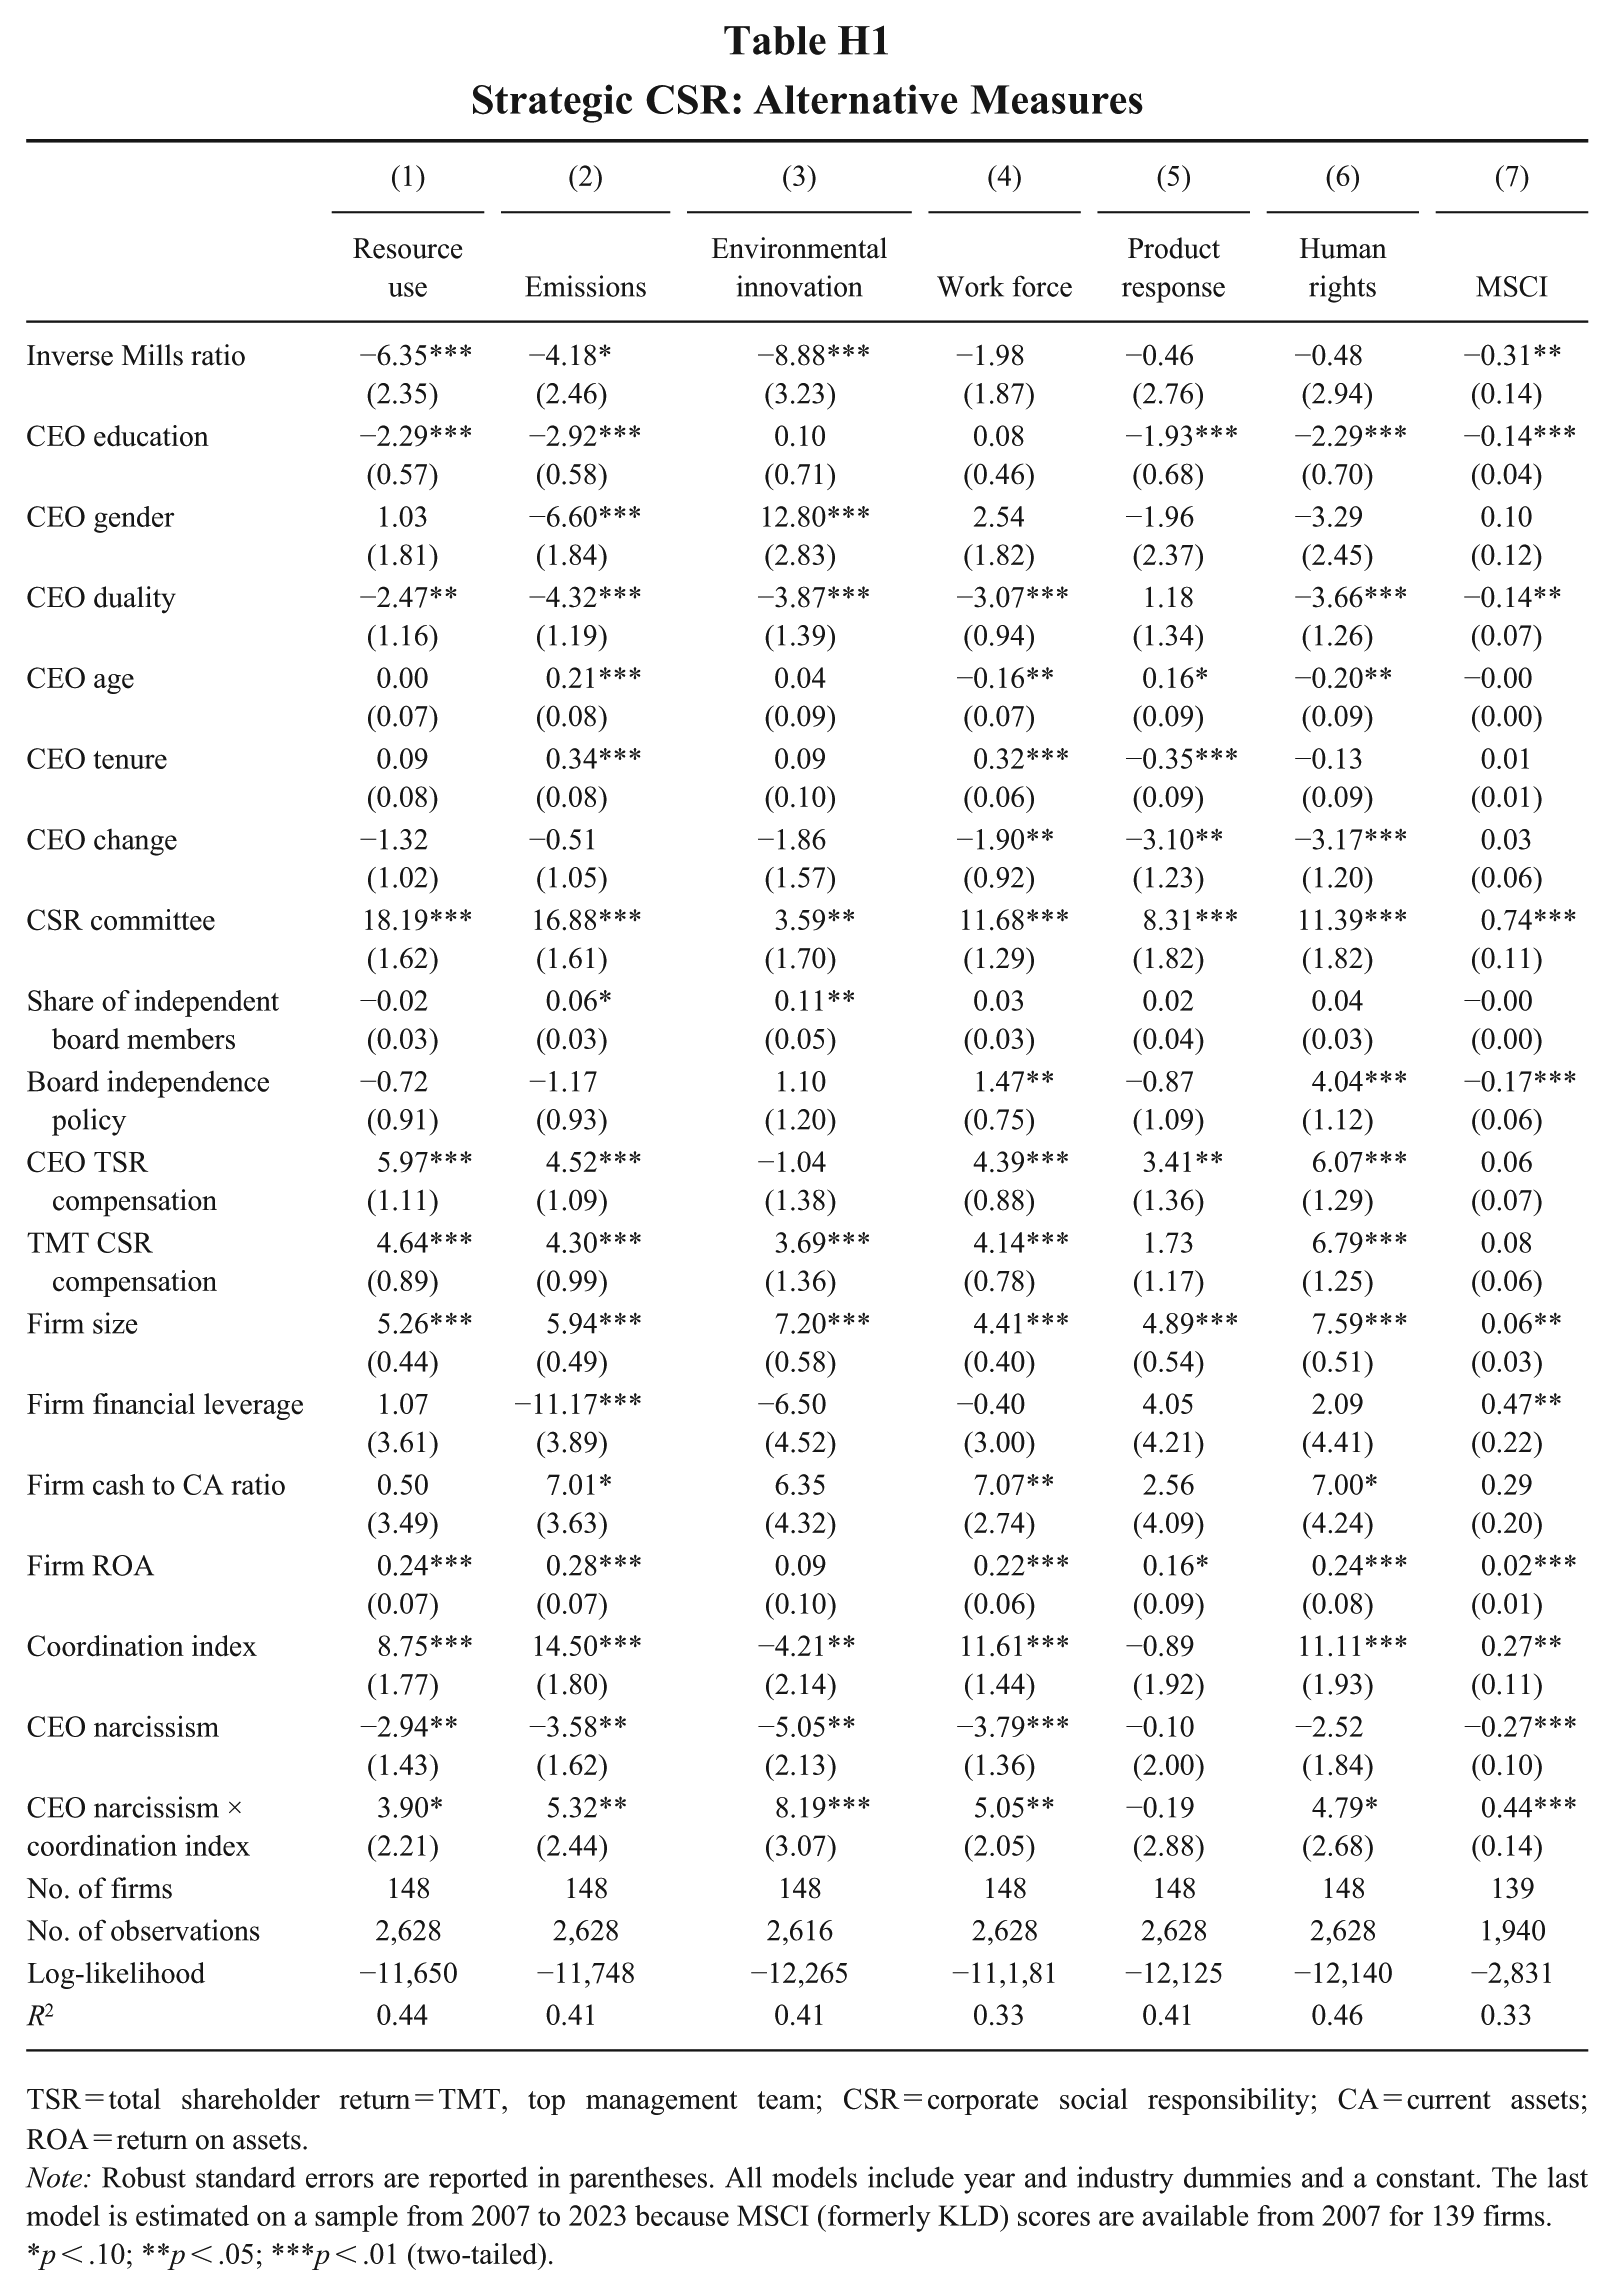
| (1) | (2) | (3) | (4) | (5) | (6) | (7) | |
|---|---|---|---|---|---|---|---|
| Resource use | Emissions | Environmental innovation | Work force | Product response | Human rights | MSCI | |
| Inverse Mills ratio | −6.35***(2.35) | −4.18*
(2.46) |
−8.88***
(3.23) |
−1.98 (1.87) |
−0.46 (2.76) |
−0.48 (2.94) |
−0.31**
(0.14) |
| CEO education | −2.29***
(0.57) |
−2.92***
(0.58) |
0.10 (0.71) |
0.08 (0.46) |
−1.93***
(0.68) |
−2.29***
(0.70) |
−0.14***
(0.04) |
| CEO gender | 1.03 (1.81) |
−6.60***
(1.84) |
12.80***
(2.83) |
2.54 (1.82) |
−1.96 (2.37) |
−3.29 (2.45) |
0.10 (0.12) |
| CEO duality | −2.47**
(1.16) |
−4.32***
(1.19) |
−3.87***
(1.39) |
−3.07***
(0.94) |
1.18 (1.34) |
−3.66***
(1.26) |
−0.14**
(0.07) |
| CEO age | 0.00 (0.07) |
0.21***
(0.08) |
0.04 (0.09) |
−0.16**
(0.07) |
0.16*
(0.09) |
−0.20**
(0.09) |
−0.00 (0.00) |
| CEO tenure | 0.09 (0.08) |
0.34***
(0.08) |
0.09 (0.10) |
0.32***
(0.06) |
−0.35***
(0.09) |
−0.13 (0.09) |
0.01 (0.01) |
| CEO change | −1.32 (1.02) |
−0.51 (1.05) |
−1.86 (1.57) |
−1.90**
(0.92) |
−3.10**
(1.23) |
−3.17***
(1.20) |
0.03 (0.06) |
| CSR committee | 18.19***
(1.62) |
16.88***
(1.61) |
3.59**
(1.70) |
11.68***
(1.29) |
8.31***
(1.82) |
11.39***
(1.82) |
0.74***
(0.11) |
| Share of independent board members | −0.02 (0.03) |
0.06*
(0.03) |
0.11**
(0.05) |
0.03 (0.03) |
0.02 (0.04) |
0.04 (0.03) |
−0.00 (0.00) |
| Board independence policy | −0.72 (0.91) |
−1.17 (0.93) |
1.10 (1.20) |
1.47**
(0.75) |
−0.87 (1.09) |
4.04***
(1.12) |
−0.17***
(0.06) |
| CEO TSR compensation | 5.97***
(1.11) |
4.52***
(1.09) |
−1.04 (1.38) |
4.39***
(0.88) |
3.41**
(1.36) |
6.07***
(1.29) |
0.06 (0.07) |
| TMT CSR compensation | 4.64***
(0.89) |
4.30***
(0.99) |
3.69***
(1.36) |
4.14***
(0.78) |
1.73 (1.17) |
6.79***
(1.25) |
0.08 (0.06) |
| Firm size | 5.26***
(0.44) |
5.94***
(0.49) |
7.20***
(0.58) |
4.41***
(0.40) |
4.89***
(0.54) |
7.59***
(0.51) |
0.06**
(0.03) |
| Firm financial leverage | 1.07 (3.61) |
−11.17***
(3.89) |
−6.50 (4.52) |
−0.40 (3.00) |
4.05 (4.21) |
2.09 (4.41) |
0.47**
(0.22) |
| Firm cash to CA ratio | 0.50 (3.49) |
7.01*
(3.63) |
6.35 (4.32) |
7.07**
(2.74) |
2.56 (4.09) |
7.00*
(4.24) |
0.29 (0.20) |
| Firm ROA | 0.24***
(0.07) |
0.28***
(0.07) |
0.09 (0.10) |
0.22***
(0.06) |
0.16*
(0.09) |
0.24***
(0.08) |
0.02***
(0.01) |
| Coordination index | 8.75***
(1.77) |
14.50***
(1.80) |
−4.21**
(2.14) |
11.61***
(1.44) |
−0.89 (1.92) |
11.11***
(1.93) |
0.27**
(0.11) |
| CEO narcissism | −2.94**
(1.43) |
−3.58**
(1.62) |
−5.05**
(2.13) |
−3.79***
(1.36) |
−0.10 (2.00) |
−2.52 (1.84) |
−0.27***
(0.10) |
| CEO narcissism × coordination index | 3.90*
(2.21) |
5.32**
(2.44) |
8.19***
(3.07) |
5.05**
(2.05) |
−0.19 (2.88) |
4.79*
(2.68) |
0.44***
(0.14) |
| No. of firms | 148 | 148 | 148 | 148 | 148 | 148 | 139 |
| No. of observations | 2,628 | 2,628 | 2,616 | 2,628 | 2,628 | 2,628 | 1,940 |
| Log-likelihood | −11,650 | −11,748 | −12,265 | −11,1,81 | −12,125 | −12,140 | −2,831 |
| R 2 | 0.44 | 0.41 | 0.41 | 0.33 | 0.41 | 0.46 | 0.33 |
TSR = total shareholder return = TMT, top management team; CSR = corporate social responsibility; CA = current assets; ROA = return on assets.
Note: Robust standard errors are reported in parentheses. All models include year and industry dummies and a constant. The last model is estimated on a sample from 2007 to 2023 because MSCI (formerly KLD) scores are available from 2007 for 139 firms.
p < .10; **p < .05; ***p < .01 (two-tailed).
Appendix I
Sensitivity Analyses Excluding Observations From Certain Countries
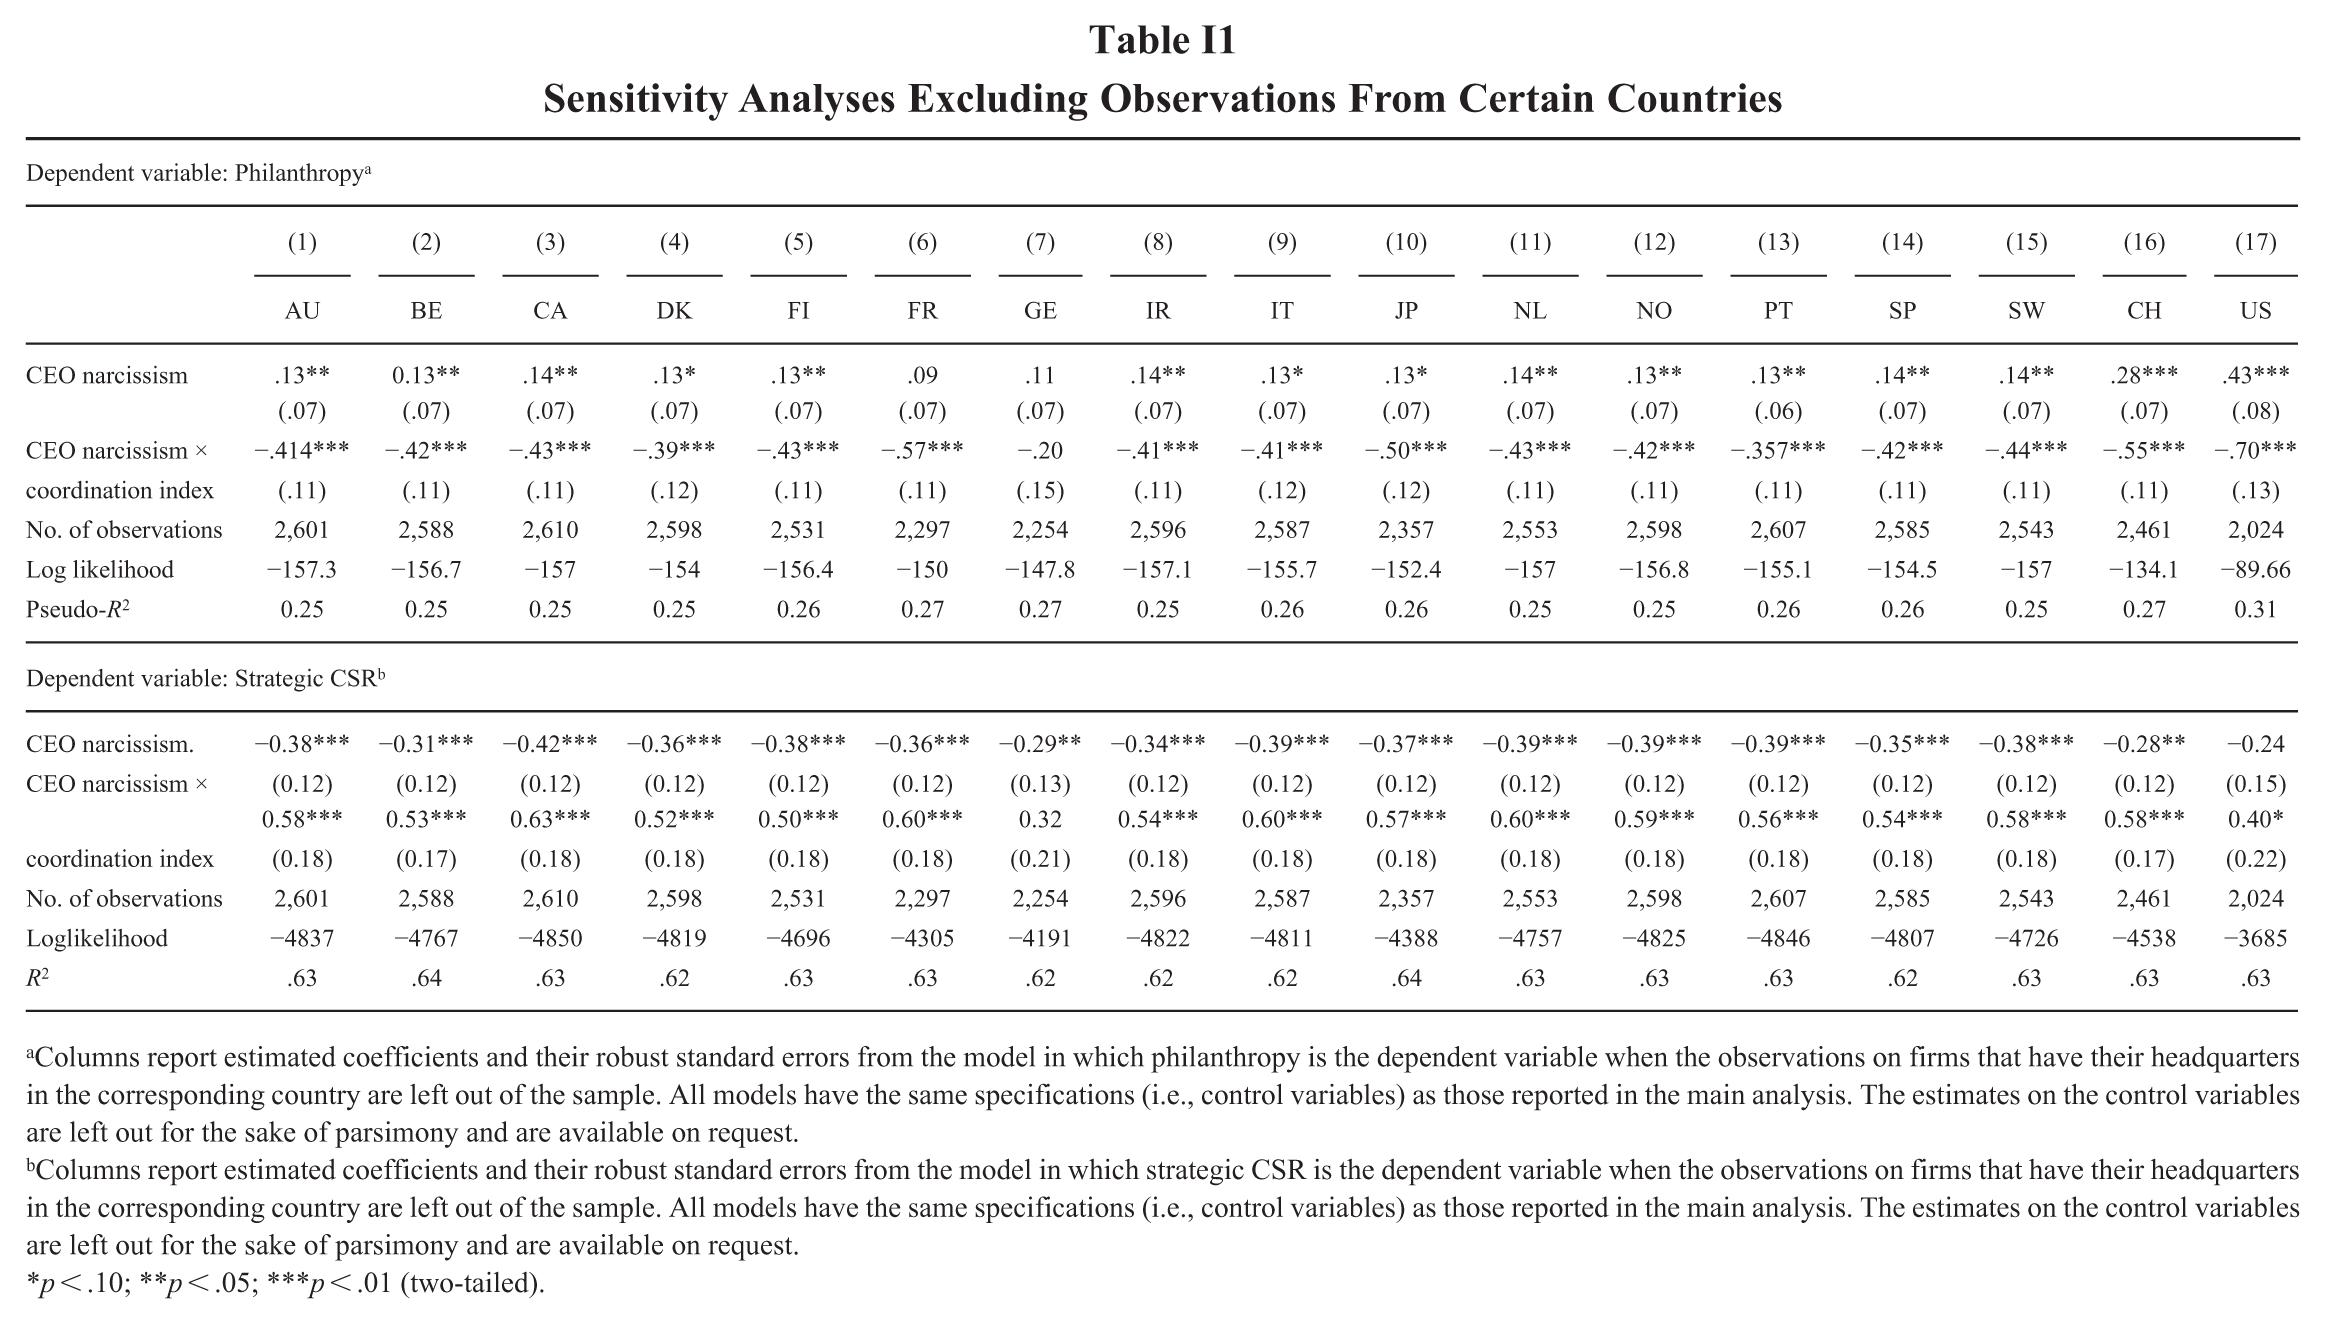
| Dependent variable: Philanthropy a | |||||||||||||||||
|---|---|---|---|---|---|---|---|---|---|---|---|---|---|---|---|---|---|
| (1) | (2) | (3) | (4) | (5) | (6) | (7) | (8) | (9) | (10) | (11) | (12) | (13) | (14) | (15) | (16) | (17) | |
| AU | BE | CA | DK | FI | FR | GE | IR | IT | JP | NL | NO | PT | SP | SW | CH | US | |
| CEO narcissism | .13**
(.07) |
0.13**
(.07) |
.14**
(.07) |
.13*
(.07) |
.13**
(.07) |
.09 (.07) |
.11 (.07) |
.14**
(.07) |
.13*
(.07) |
.13*
(.07) |
.14**
(.07) |
.13**
(.07) |
.13**
(.06) |
.14**
(.07) |
.14**
(.07) |
.28***
(.07) |
.43***
(.08) |
| CEO narcissism × | −.414*** | −.42*** | −.43*** | −.39*** | −.43*** | −.57*** | −.20 | −.41*** | −.41*** | −.50*** | −.43*** | −.42*** | −.357*** | −.42*** | −.44*** | −.55*** | −.70*** |
| coordination index | (.11) | (.11) | (.11) | (.12) | (.11) | (.11) | (.15) | (.11) | (.12) | (.12) | (.11) | (.11) | (.11) | (.11) | (.11) | (.11) | (.13) |
| No. of observations | 2,601 | 2,588 | 2,610 | 2,598 | 2,531 | 2,297 | 2,254 | 2,596 | 2,587 | 2,357 | 2,553 | 2,598 | 2,607 | 2,585 | 2,543 | 2,461 | 2,024 |
| Log likelihood | −157.3 | −156.7 | −157 | −154 | −156.4 | −150 | −147.8 | −157.1 | −155.7 | −152.4 | −157 | −156.8 | −155.1 | −154.5 | −157 | −134.1 | −89.66 |
| Pseudo-R2 | 0.25 | 0.25 | 0.25 | 0.25 | 0.26 | 0.27 | 0.27 | 0.25 | 0.26 | 0.26 | 0.25 | 0.25 | 0.26 | 0.26 | 0.25 | 0.27 | 0.31 |
| Dependent variable: Strategic CSR b | |||||||||||||||||
| CEO narcissism. | −0.38*** | −0.31*** | −0.42*** | −0.36*** | −0.38*** | −0.36*** | −0.29** | −0.34*** | −0.39*** | −0.37*** | −0.39*** | −0.39*** | −0.39*** | −0.35*** | −0.38*** | −0.28** | −0.24 |
| CEO narcissism × | (0.12) 0.58*** |
(0.12) 0.53*** |
(0.12) 0.63*** |
(0.12) 0.52*** |
(0.12) 0.50*** |
(0.12) 0.60*** |
(0.13) 0.32 |
(0.12) 0.54*** |
(0.12) 0.60*** |
(0.12) 0.57*** |
(0.12) 0.60*** |
(0.12) 0.59*** |
(0.12) 0.56*** |
(0.12) 0.54*** |
(0.12) 0.58*** |
(0.12) 0.58*** |
(0.15) 0.40* |
| coordination index | (0.18) | (0.17) | (0.18) | (0.18) | (0.18) | (0.18) | (0.21) | (0.18) | (0.18) | (0.18) | (0.18) | (0.18) | (0.18) | (0.18) | (0.18) | (0.17) | (0.22) |
| No. of observations | 2,601 | 2,588 | 2,610 | 2,598 | 2,531 | 2,297 | 2,254 | 2,596 | 2,587 | 2,357 | 2,553 | 2,598 | 2,607 | 2,585 | 2,543 | 2,461 | 2,024 |
| Loglikelihood | −4837 | −4767 | −4850 | −4819 | −4696 | −4305 | −4191 | −4822 | −4811 | −4388 | −4757 | −4825 | −4846 | −4807 | −4726 | −4538 | −3685 |
| R 2 | .63 | .64 | .63 | .62 | .63 | .63 | .62 | .62 | .62 | .64 | .63 | .63 | .63 | .62 | .63 | .63 | .63 |
Columns report estimated coefficients and their robust standard errors from the model in which philanthropy is the dependent variable when the observations on firms that have their headquarters in the corresponding country are left out of the sample. All models have the same specifications (i.e., control variables) as those reported in the main analysis. The estimates on the control variables are left out for the sake of parsimony and are available on request.
Columns report estimated coefficients and their robust standard errors from the model in which strategic CSR is the dependent variable when the observations on firms that have their headquarters in the corresponding country are left out of the sample. All models have the same specifications (i.e., control variables) as those reported in the main analysis. The estimates on the control variables are left out for the sake of parsimony and are available on request.
p < .10; **p < .05; ***p < .01 (two-tailed).
Acknowledgements
We wish to thank Wei Shi (Action Editor) and the anonymous reviewers for their insightful and constructive feedback.