
Abstract
Insufficient effort responding (IER) presents a significant challenge in management research, potentially leading to flawed inferences. This review critically examines IER practices in 17 leading management journals from 2012 to 2023, highlighting inconsistencies in screening methods, cutoffs, and reporting. We find that IER screening is more prevalent in studies using online paid samples, experimental tasks, and computerized data collection. However, researchers’ IER-related practices, specifically the use of multiple detection methods, predicted IER removal rate above and beyond these study characteristics. Our review revealed that, despite increasing awareness, IER detection and reporting remain unstandardized, with varied practices across studies. While attention checks are frequently used, details about their implementation are often inadequately reported, and multiple detection methods, though recommended, are inconsistently applied. Variability in cutoffs and reliance on single-item checks raise concerns about the risk of retaining IER cases or mistakenly excluding attentive respondents. Our assessment of the impact of IER removal suggests that while it generally improves reliability and model fit, its effect can vary widely across measures and studies. We call on methodologists to resolve existing inconsistencies by developing clearer, empirically derived guidelines for IER detection and removal. We urge researchers to adopt more comprehensive and transparent reporting practices to enhance replicability and methodological rigor, with a flowchart to guide research design and method communication. This review underscores the need for a more systematic approach to IER mitigation in management research to enhance data quality and research validity.
Management scholars frequently rely on voluntary participants to provide data as research input. Such data, often collected in low-stakes contexts, can be plagued by insufficient effort responding 1 (IER), which occurs when some participants are unmotivated to comply with study instructions, read and interpret questions, and provide accurate answers (Huang, Curran, Keeney, Poposki, & DeShon, 2012). While research on IER has tended to focus on questionnaire surveys (e.g., DeSimone, Harms, & DeSimone, 2015; Huang et al., 2012; Meade & Craig, 2012), IER can impact other types of research designs, such as experiments (e.g., Berinsky, Margolis, & Sances, 2014; Oppenheimer, Meyvis, & Davidenko, 2009) and objective tasks and tests (e.g., Huang & DeSimone, 2021; Morgeson, Spitzmuller, Garza, & Campion, 2016). This makes IER, to some extent, a common problem in management research when human subjects are involved. Indeed, research has shown that IER can induce both random and systematic errors that impact the observed relationships between substantive variables (e.g., Carden, Camper, & Holtzman, 2019; Hough, Eaton, Dunnette, Kamp, & McCloy, 1990; Huang et al., 2012; Huang, Liu, & Bowling, 2015; McGrath, Mitchell, Kim, & Hough, 2010). It is thus important for management researchers to pay attention to IER and apply methods to detect and deter IER in empirical studies.
Research on IER has contributed to growing awareness and understanding of IER among management scholars. Before the 2010s, research on IER in the management literature had been sporadic, investigating validity issues due to response biases in different contexts, such as personality and job analysis (e.g., Hough et al., 1990; Johnson, 2005; Morgeson & Campion, 1997). At the time, IER was considered a potential threat alongside others, such as faking and linguistic incompetence, to research findings.
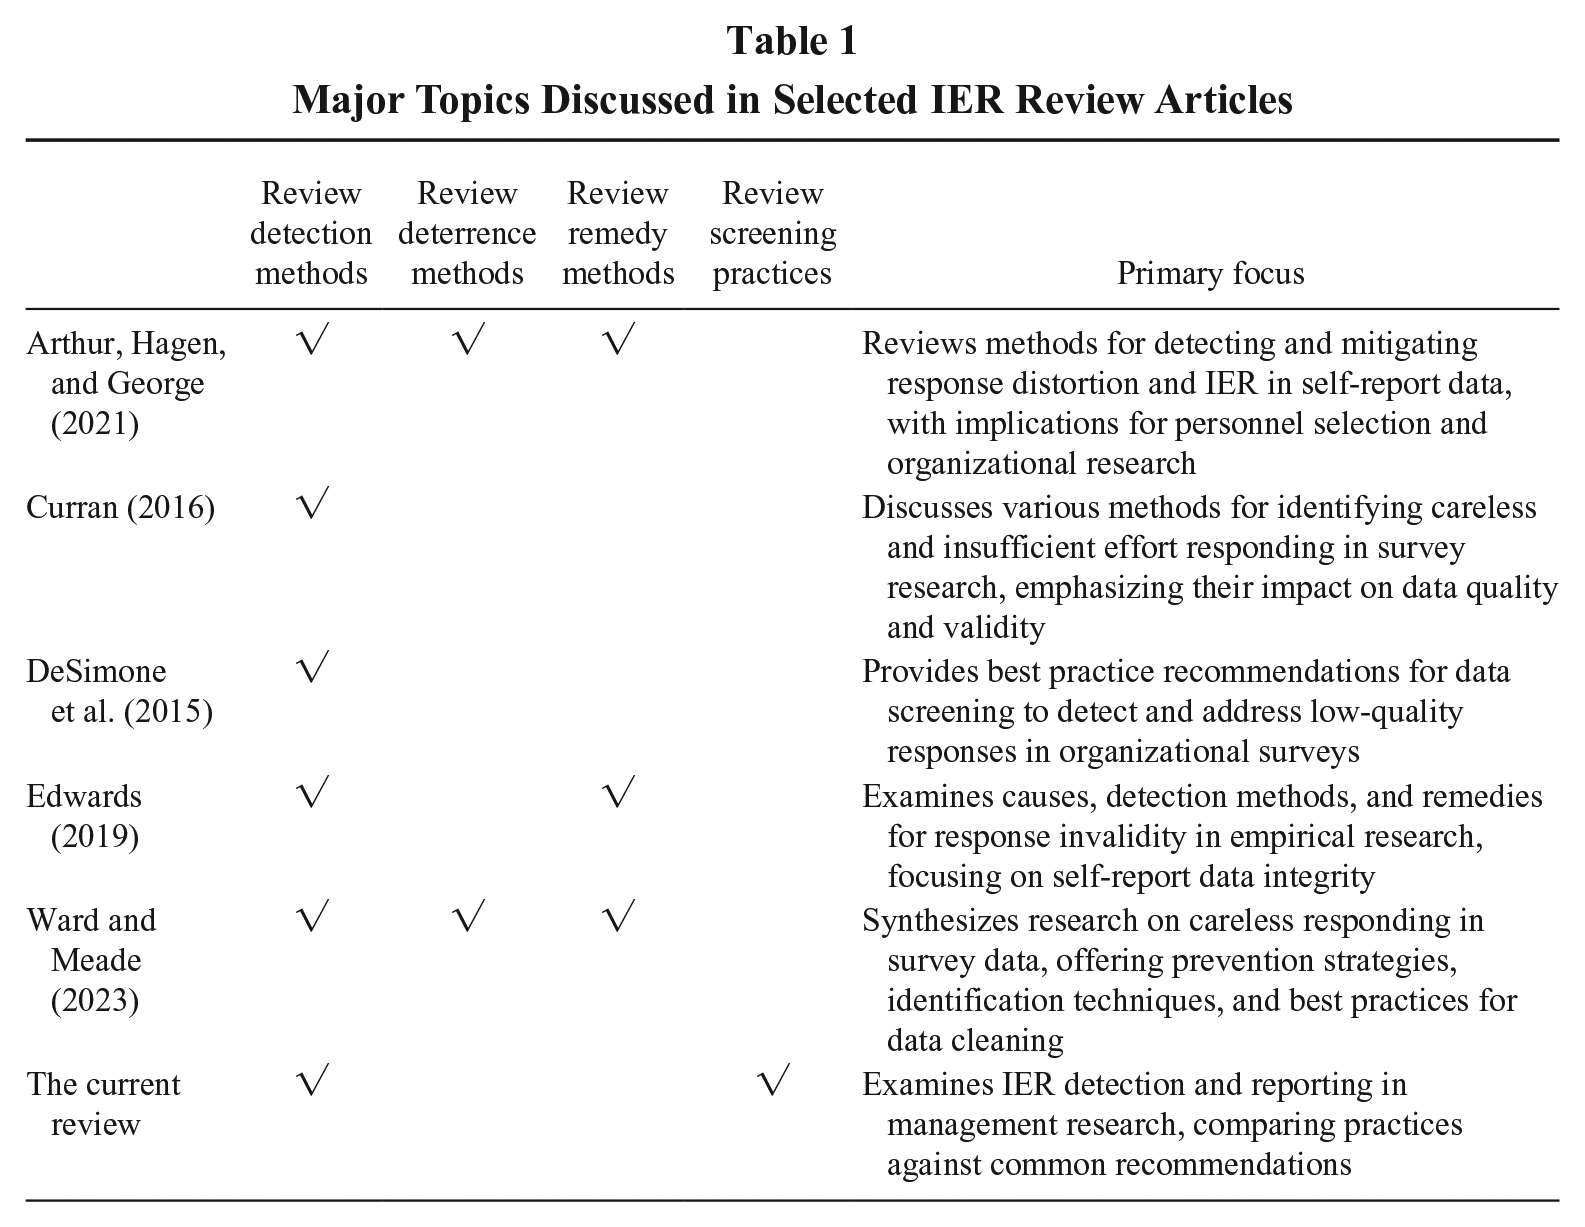
Two articles in 2012 contributed to the recent rise in attention to IER: Both Huang et al. (2012) and Meade and Craig (2012) comprehensively evaluated the efficacy of multiple detection indices. Subsequent research (Huang, Liu, et al., 2015; McGonagle, Huang, & Walsh, 2016) further highlighted IER’s impact, demonstrating that because IER tends to average around scale midpoints (see Goldammer, Annen, Stockli, & Jonas, 2020), its presence can inflate correlations between substantive variables, especially when attentive respondents score well above and below the mean. The relevance of IER detection has only grown with the increased popularity of paid online participant pools such as Amazon MTurk and Prolific (Aguinis, Villamor, & Ramani, 2021; Walter, Seibert, Goering, & O’Boyle, 2019), making it even more critical to identify and address IER in survey data. In response, researchers have advanced the field by refining IER detection tools (Bowling, Gibson, & DeSimone, 2022; Maniaci & Rogge, 2014), identifying the confounding effect of IER beyond self-reports (Huang, Bowling, McLarty, Kluemper, & Wang, 2024; Huang & DeSimone, 2021), and exploring the antecedents of IER behaviors (e.g., Bowling, Huang, Bragg, Khazon, Liu, & Blackmore, 2016; DeSimone, Davison, Schoen, & Bing, 2020). Accordingly, several reviews (see Table 1) in the relevant literature have examined available tools for addressing IER, providing guidelines and recommendations for detection and mitigation.
Major Topics Discussed in Selected IER Review Articles
Despite these advances in IER research, it is unclear whether management scholars have consistently handled IER in a rigorous and replicable manner. A casual read of the literature led to three observations: (a) scholars may not have routinely screened for IER in their data; (b) the decision not to screen for IER has rarely been justified; and (c) in situations where researchers reported the detection of IER, the ways in which they operationalized IER and identified cutoffs seem to vary widely, and so did their reporting practices. It is possible that the more recent best practice recommendations have yet to permeate into management scholars’ research practices, especially considering the amount of time it takes to publish in top-tier management journals. Yet it is also likely that the area of IER is no exception to scholars’ tendency to ignore or misuse best practice articles (Kreamer, Albritton, Tonidandel, & Rogelberg, 2023). In either case, the lack of a uniform approach for the treatment of IER and the associated reporting practices is problematic because it hinders the effective communication of research findings (Appelbaum, Cooper, Kline, Mayo-Wilson, Nezu, & Rao, 2018). To the extent that the removal of IER cases can affect research results, inconsistent application of IER detection methods and cutoffs can exacerbate challenges in replicating existing research (Schmidt, 2009). Furthermore, management scholars, especially junior scholars and doctoral students, may find it confusing when conducting their research due to different practices being reported in our journals.
To systematically assess these concerns, we conducted a comprehensive review to examine how IER screening has been applied in management research. Specifically, we reviewed articles published since 2012 in leading journals in the management field to capture variations in IER-related practices and reporting. Unlike earlier reviews (see Table 1), our study provides a thorough evaluation of how top-tier management research addresses IER. Doing so enables us to understand, after more than a decade of cumulative knowledge of IER since 2012 (Huang et al., 2012; Meade & Craig, 2012), whether there exists a substantial divide between the aspirations set forth by methodologists—who sometimes offer differing recommendations—and the realities of scholarly practices. If left unaddressed, this gap may persist for an extended period. Scholars often look to leading journals to determine common practices and model their work accordingly. This raises the question: how many more articles on “best practice recommendations” will it take to shift perceptions and change practices regarding IER treatment? A comprehensive account of research practices will help the field evaluate whether there have been improvements over time and how far reported practices lag behind the aspirations introduced by methodologists in recent work.
This review contributes to the field in three important ways. First, whether researchers decide to screen for IER may reflect their implicit beliefs about data quality associated with different sample sources and research designs. For instance, researchers may pay less attention to detecting IER in organization-sponsored surveys or longitudinal surveys, possibly because they implicitly believe that certain design features mitigate the risk of IER (see Liu, Bowling, Huang, & Kent, 2013). This phenomenon is akin to the streetlight effect, where researchers focus their efforts on areas that are easier to investigate or align with their assumptions rather than exploring areas where issues like IER may be equally prevalent but more challenging to detect. While our review cannot compare the likelihood of IER across design features, it does shed light on researchers’ practices. Identifying factors that contribute to these implicit beliefs about IER can be a crucial step toward verifying them with empirical data.
Second, identifying the various decisions researchers made when screening for IER, especially in survey studies, highlights both the progress in the field and the areas needing future actions. Unlike experimental manipulation checks that yield clear correct versus incorrect answers, screening for IER in surveys involves a series of decisions, such as selecting the types of indices to use and determining the appropriate cutoffs for IER detection. By contrasting current practices with general guidelines (e.g., Aguinis et al., 2021; DeSimone et al., 2015) and specific recommendations (e.g., Arthur et al., 2021; Ward & Meade, 2023), we can better understand the challenges in implementing these recommendations and potentially stimulate discussions on best practices.
Third, analyzing the rationales behind researchers’ decisions on IER screening can illuminate the complexities involved in using and reporting data screening methods. General practice guidelines in the literature may not fully account for the unique needs of a particular study. For instance, Beus, Payne, Arthur, and Muñoz (2019) adopted a “predetermined decision rule” (p. 1993) to remove respondents who failed three or more of five detection items in a 133-item one-time survey, retaining only 37% of the 1,505 participants, whereas Ehrhardt and Ragins (2019) took “an aggressive approach” (p. 255) to remove cases flagged by any IER detection method, retaining 67% of the 463 participants who participated across three waves of surveys over one year. These “rubber-meets-the-road” scenarios can serve as critical incidents that methodologists can address in future research.
In sum, we aim to assess the current state of awareness and practices in the field regarding IER screening and reporting, pinpoint the key elements affecting the decision to screen (or not screen) for IER, and offer recommendations on IER practices and reporting derived from our review. In the following sections, we first present a brief review of approaches to detect IER, then introduce our research questions and describe the methods we used to review and code articles, and finally discuss the findings and implications of our review.
Review of Major IER Detection Approaches
Approaches to detect IER can fall into one of two categories: procedural detection methods and post hoc statistical methods (Huang & Wang, 2021). With procedural detection methods, researchers embed measures or indices in the study in advance to capture respondents’ IER behaviors. With post hoc statistical methods, researchers calculate within-person indices from completed responses to identify suspected IER cases. We organize these approaches in Table 2 as an overview and direct interested readers to Bowling, Huang, Brower, and Bragg (2023; Table 1: 325–326) for a summary of their strengths and weaknesses.
Overview of Detection Methods
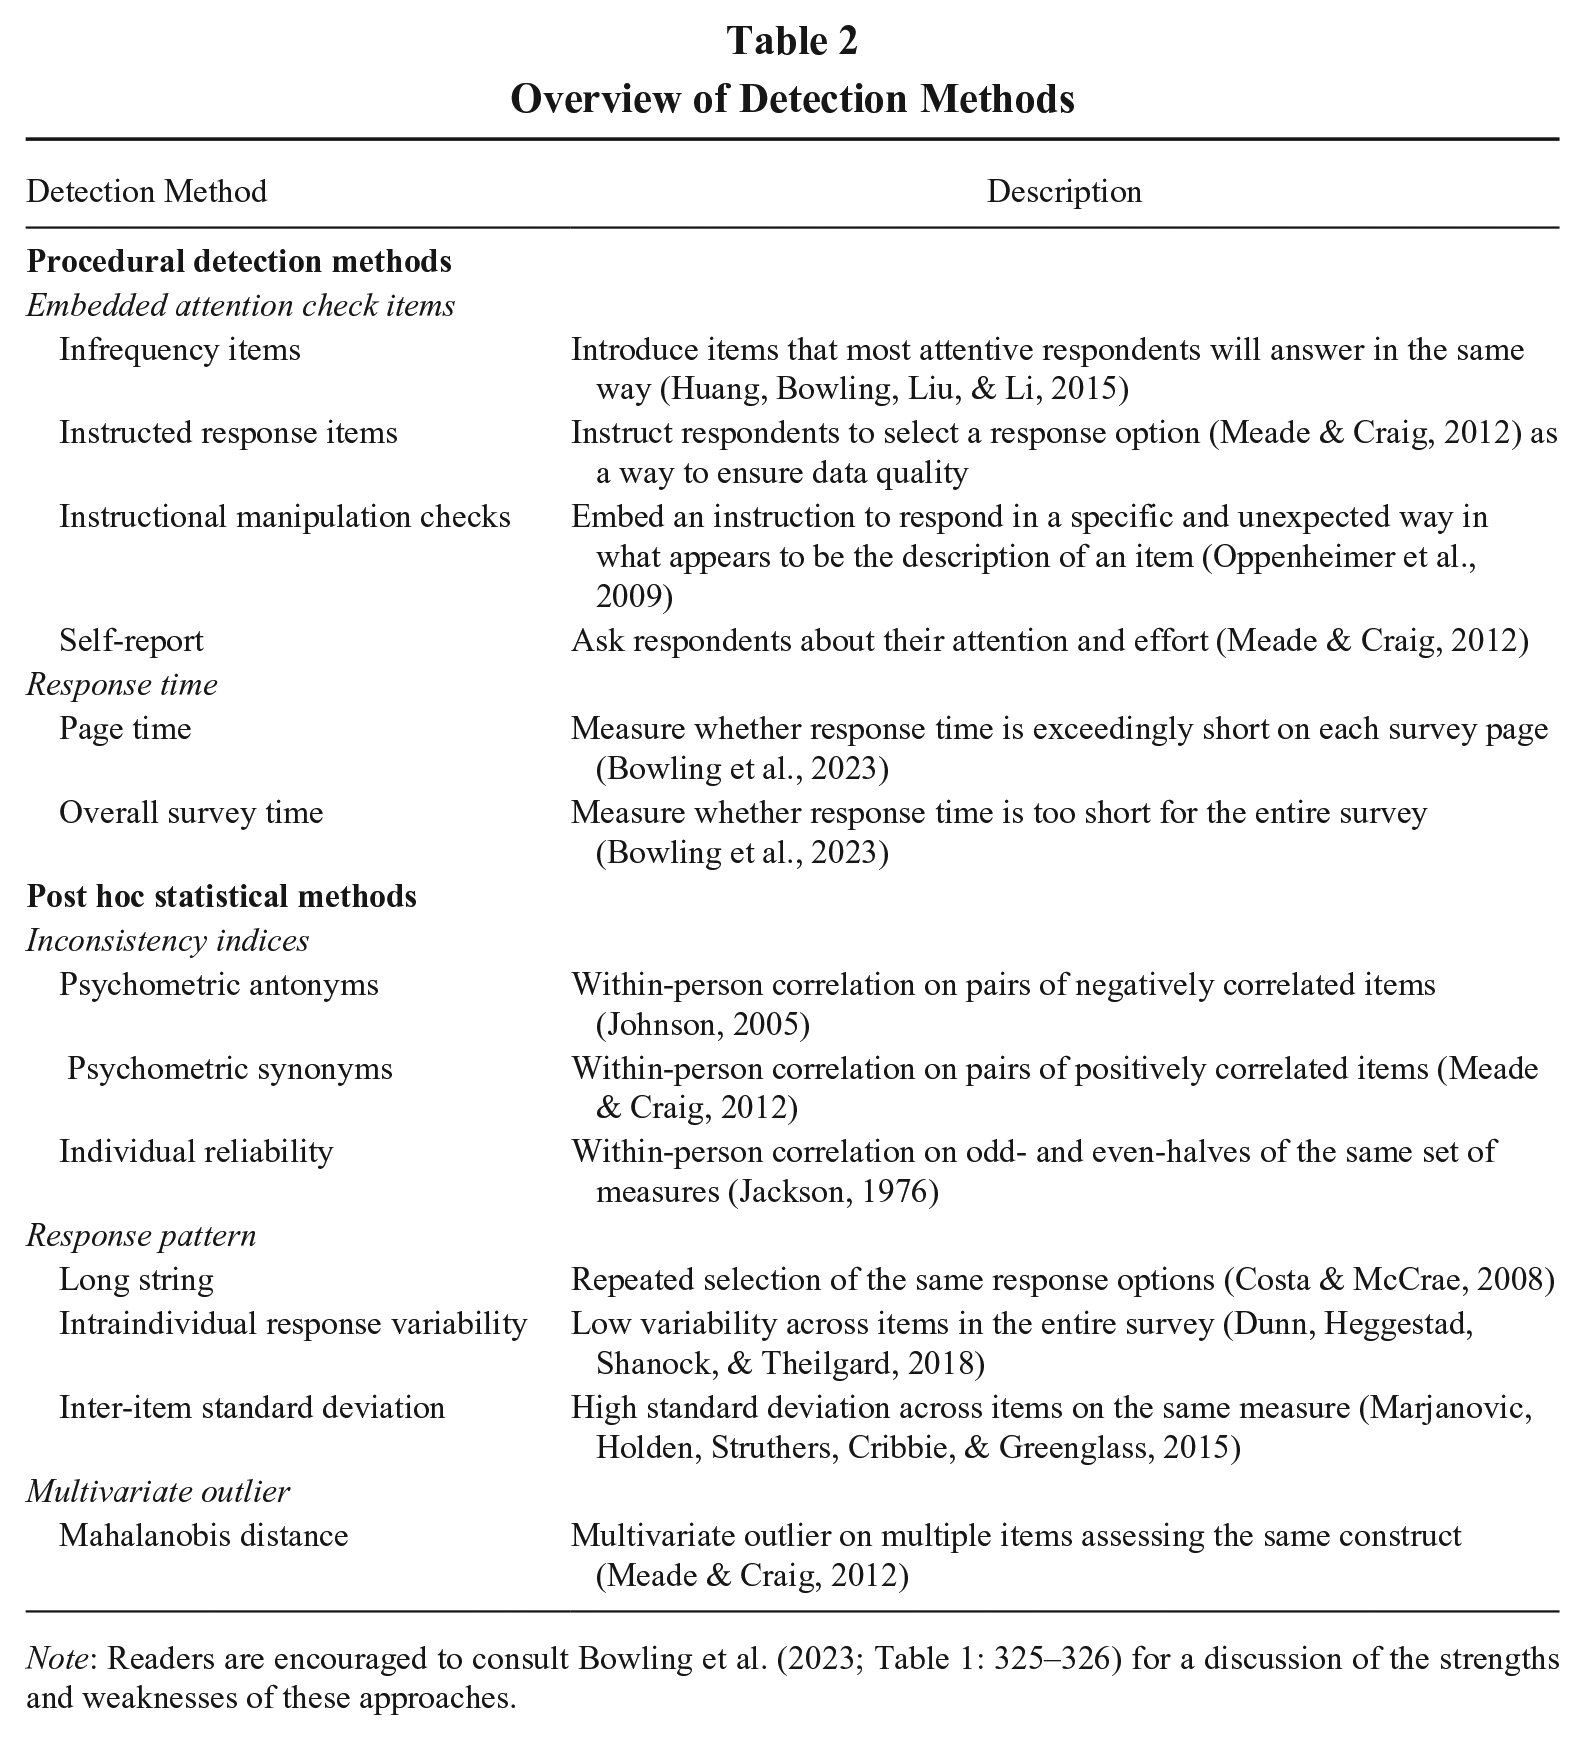
Note: Readers are encouraged to consult Bowling et al. (2023; Table 1: 325–326) for a discussion of the strengths and weaknesses of these approaches.
Common procedural detection methods include embedding attention check items and recording response time. The embedded attention check items can take on somewhat different forms, including instructed response items, instructed manipulation checks, infrequency items, and self-report response effort. Instructed response items ask participants to answer in a specific way (e.g., “Please select strongly disagree to indicate you are paying attention”). Any answers different from the instructed response option would indicate IER. Instructed manipulation checks are designed to capture a lack of diligence in reading instructions. An instructional manipulation check closely resembles other materials included in a study but instructs participants to perform an alternative action instead of completing the task ostensibly described (Oppenheimer et al., 2009). Failure to follow these instructions is indicative of IER. Infrequency items are questions that attentive respondents tend to answer in the same way, leaving the infrequently endorsed response options indicative of IER (hence the name infrequency). They are also called bogus items as these items usually contain nonsensical statements, and participants endorsing any level of agreement with the items may not be paying attention to the questions. Sample items include “I do not understand a word of English” (Meade & Craig, 2012) and “I eat cement occasionally” (Huang, Bowling, et al., 2015). With self-report items (typically at the end of a survey), researchers ask respondents to evaluate their response effort, such as “I responded carelessly to the questions” (Huang et al., 2012) and “In your honest opinion, should we use your data in our analyses in this study?” (Meade & Craig, 2012).
For online surveys, response time can be recorded unobtrusively without adding questions to the survey. Since attentive respondents require time to read and interpret the questions, those who finish the survey in an unusually short period may have answered carelessly. Though the judgment of how long a “short period” is may depend on the survey and task features, Bowling et al. (2023) demonstrated that researchers can effectively detect IER by assessing the amount of time a participant spends on each survey page (also called “page time”; see Huang et al., 2012) and comparing it against an established cutoff (e.g., 2 seconds per item). In contrast, the overall time spent on a survey tends to be a poorer indicator of IER, presumably because the overall time is too coarse to accurately capture IER behavior that occurs in specific sections of the survey (Bowling et al., 2023).
Common post hoc statistical methods include inconsistency indices, response pattern, and multivariate outlier. Inconsistency indices rely on the assumption that attentive respondents will provide comparable responses to similar items. A within-person correlation across items or subscales that are strongly correlated with each other is used to indicate IER. One approach is to compute the psychometric antonym and synonym indices (Huang et al., 2012; Johnson, 2005; Meade & Craig, 2012). Attentive respondents are expected to show strong positive correlations for psychometric synonyms and strong negative correlations for psychometric antonyms. This is because attentive respondents are supposed to answer psychometric antonyms in dissimilar ways but answer psychometric synonyms in similar ways. Another approach is to use the individual reliability index (Jackson, 1976; also known as personal reliability and even-odd consistency). Survey items are separated into two halves of odd- and even-numbered items. A within-person correlation is computed between the odd- and even-numbered half scales for each respondent. High within-person correlations (e.g., a cutoff of .30; Johnson, 2005) indicate attentive responding, whereas low correlations indicate potential IER. Response pattern typically captures IER in the form of continuous selections of the same response option, either in the form of a long string of identical response options (e.g., 15 consecutive “Strongly Agree”) or in the form of a lack of response variability (i.e., low standard deviation across multiple items; Dunn et al., 2018). A rarer use of the response pattern approach focuses on extremely large standard deviations of responses to items on the same measure (Marjanovic et al., 2015). Finally, Mahalanobis distance, a multivariate outlier statistic, can be used to detect IER because of the higher probability that inattentive respondents will present extreme differences in response patterns compared to normal responses (Meade & Craig, 2012).
Aside from deciding which IER indices to use, researchers also need to determine the appropriate cutoffs to identify IER cases, as most indices measure IER on a continuum, without a clear demarcation between IER and attentive responding. Because cutoffs can depend on the survey design and types of items included, the ideal practice is to conduct a pilot study to establish cutoffs: researchers can instruct highly motivated participants to either respond attentively or inattentively and derive cutoffs for IER indices to be used in the main study (Huang et al., 2012). Alternatively, researchers may establish rational cutoffs (Huang et al., 2012) or explore latent classes in responses using multiple indices (Meade & Craig, 2012).
Research Questions on IER-Related Practices and Reporting
Based on our review of major IER detection approaches, it is clear that researchers face several key decisions related to IER when collecting data. However, an often overlooked yet critical initial decision is whether to screen for IER at all. In this section, we first propose three research questions (RQ) concerning management scholars’ decisions on IER: the decision to screen for IER (RQ1); the methods used to screen for IER (RQ2); and the proportion of data excluded due to IER and the cutoffs employed (RQ3). Next, we examine the recommendations provided by methodologists and compare current practices against these guidelines (RQ4). Finally, we assess the impact of IER removal on key analytical outcomes, including reliability, variable associations, model fit, and hypothesis support (RQ5).
Decision to Screen for IER
Our first research question is to explore potential factors that influence researchers in deciding to screen for IER (versus not). First, data quality can be influenced by whether participants face personal consequences as a result of their responses (Gibson & Bowling, 2020). In high-stakes study contexts, such as when participants are pursuing desired outcomes like hiring or promotion, they are more likely to put forth maximum effort, leading to higher data quality. Conversely, in typical low-stakes research settings, where participants do not face direct consequences, there may be a greater likelihood of IER. Research on situational strength (Meyer et al., 2014) suggests that when response behaviors have significant personal implications—either positive or negative—participants are less likely to engage in IER. Therefore, we expect researchers to perform more IER screening in studies where participants face low personal consequences.
We identify having in-person contact with participants as another relevant study feature. Researchers may believe that their presence and in-person interactions with participants could deter IER and thus obviate the need to screen for IER. This belief would be grounded in research, as in-person contact can reduce the psychological distance between interaction parties, thus enhancing trust-based relationships (Eisenberg & DiTomaso, 2021). Indeed, using experimental studies with student samples, Francavilla, Meade, and Young (2019) found that participants in the in-person, proctored condition were less likely to engage in IER than the control group participants who completed surveys in a virtual, non-proctored condition, whereas those in the virtual, proctored condition showed no significant differences in IER engagement compared with the control group. Therefore, researchers who have in-person contact with their participants may feel more confident about the data quality and thus choose not to screen for IER.
Another factor that may influence the decision to screen for IER (versus not) is the type of samples used in a research study. Over the last decade, the use of online paid samples, such as those recruited from MTurk, Prolific, and CloudResearch, has increased steadily in management research (Buhrmester, Talaifar, & Gosling, 2018; Porter, Outlaw, Gale, & Cho, 2019). Participants from these online platforms complete surveys and tasks for monetary incentives, and they can maximize their earnings by rushing through surveys as quickly as possible. They are also more likely to be distracted by environmental disturbances, such as cell phone use, internet surfing, and conversations with others, relative to student samples (Aguinis et al., 2021). Researchers implicitly view self-reports from student samples or samples recruited from the community (e.g., via community flyers) as more attentive responses (Sharpe, Lynam, & Miller, 2023) in comparison with online paid samples, because those participants tend to be more interested and voluntarily engaged in the study. Nonetheless, Sharpe et al. (2023) found that researchers would also include detection methods as part of their methodology when using student (32.4%) and community samples (19.7%). By contrast, researchers who conduct organization-sponsored studies, such as a survey project supported by an organization’s human resource department, may be less likely to suspect IER behavior from employee participants (Ran, Liu, Marchiondo, & Huang, 2015). There may be some truth to this implicit belief, as employees’ perceived organizational membership may translate into a willingness to engage in survey efforts analogous to organizational citizenship behavior (Hui, Lee, & Wang, 2015). Hence, researchers using different types of samples may have preconceptions about the diligence level of research participants and thus decide whether to apply detection methods accordingly.
Yet another study characteristic to consider is task type. Although IER can occur in both surveys and tasks (Huang & DeSimone, 2021), the demands and the ease of identifying IER differ across surveys and tasks. Laboratory or online tasks, such as word scrambling, simulations, and learning tasks, can be more cognitively demanding than questionnaires. Compared to survey respondents, participants working on these tasks may be more likely to experience energy depletion, lose interest, and get bored, resulting in insufficient effort in completing the tasks. At the same time, compared to surveys, it may be easier for researchers to identify IER in tasks because of the presence of correct and incorrect responses.
It is possible that study duration can influence the practice of IER screening. Specifically, we compare single-time surveys with longitudinal studies that collect survey data at multiple time points. Participants in longitudinal studies might become disengaged over time due to diminishing interest or fatigue from repeated tasks, potentially necessitating the use of IER detection tools more than in single-time studies. Conversely, the practical challenges of implementing IER detection methods, like attention check items, at each phase of a longitudinal study could increase the burden on participants. This might lead to hesitancy to screen for IER in longitudinal settings. On the other hand, single-time surveys may present a more straightforward context for IER detection, making it a more feasible option.
Finally, computerized data collection, whether conducted online or in person, offers researchers additional opportunities to screen for IER, as participants’ response time will be readily available. At the same time, participants may find it easier to respond carelessly in a computerized assessment environment due to an increased sense of anonymity, compared to traditional paper-and-pencil studies. It is likely that the use of computerized data collection (rather than paper-and-pencil) will be associated with higher levels of IER screening.
Research Question 1 (RQ1): In studies based on individual-level data published in leading management journals, what study characteristics (personal consequences; in-person interactions; sample types; task types; study duration; data collection format) are associated with the decision to screen for IER (versus not)?
Methods Used to Screen for IER
Once researchers decide to examine IER in their studies, they need to determine which IER detection indices to include. As reviewed above, procedural detection methods require embedded measurements in advance, while post hoc statistical methods apply within-person statistics to completed data without needing to modify the study design. In particular, most of the procedural detection methods, with the exception of time-based measures, require the inclusion of additional items in the survey, such as infrequency items, instructed response items, and self-report items. Their advantage in ease of use is counterbalanced by the burden placed on respondents due to extended survey lengths (Gibson & Bowling, 2020). Moreover, seasoned survey takers (e.g., professional workers on survey platforms) may be on the lookout for such items, thus reducing their effectiveness. As for response time, it is only available when studies are administered on a computer or a digital device rather than in paper-and-pencil formats. Compared to procedural detection methods, post hoc statistical methods have constraints of their own: computing within-person statistics tends to require a large number of items on the survey, and their calculations tend to be complex, especially for psychometric antonyms, psychometric synonyms, and individual reliability. In summary, each IER screening method has its advantages and constraints. Indeed, methodologists have advocated for the use of more than one index (e.g., DeSimone et al., 2015) for screening IER, further complicating the practical applications of IER screening methods.
RQ2: What is the current landscape of IER methods adopted in leading management journals, considering both the frequency of use and the simultaneous applications of specific methods?
IER Removal Rate and Cutoffs
After applying IER screening methods, researchers need to determine the cases to potentially remove from their data, but they are faced with a lack of established cutoffs for IER screening—as mentioned above, researchers may develop cutoffs in a pilot study with motivated respondents, identify rational cutoffs, or examine latent classes of respondents. Although surveying the literature to document how researchers apply the cutoffs will inform future practice in IER screening and provide input for future studies of IER, the dearth of reporting on cutoffs and how they were determined made it quite challenging for us to systematically review this issue. Instead, we first turn to IER removal rate, defined as the percentage of suspect IER cases removed from the data containing both IER and retained cases. We expect the study characteristics discussed earlier to influence IER removal rate. These study characteristics may affect participant motivation, thereby influencing the occurrence of IER. Meanwhile, researchers’ implicit beliefs about data quality could also affect the rigor with which they removed IER.
Beyond the objective characteristics of a study, we can also examine how researchers’ design decisions may be associated with IER removal rate. Methodologists have consistently advocated for the use of multiple approaches to detect IER (e.g., Edwards, 2019). When researchers employ more than one approach, they are more likely to identify various forms of IER behavior (e.g., DeSimone, DeSimone, Harms, & Wood, 2018), which can potentially lead to the removal of a higher proportion of IER cases. Likewise, when researchers utilize attention check items, more items are likely to provide broader coverage of the survey, allowing for a more thorough evaluation of response effort throughout the study.
RQ3: Are study characteristics (personal consequences; in-person interactions; sample types; task types; study duration; data collection format) and IER-related practices (multiple methods; more attention check items) related to the percentage of cases screened due to IER in leading management journals? What decision rules did researchers follow to set cutoffs for IER removal?
After addressing the first three research questions, another approach to assessing IER screening in the leading management literature is to compare existing practices with best practice recommendations. As we mentioned above, the current practices among management scholars may not yet align with ideal standards or may simply require time to evolve to meet methodologists’ recommendations. In either case, it is essential to evaluate and document the current state of the literature in handling IER in order to advance the field.
RQ4: How well are current practices aligned with best practice recommendations?
Impact of IER Removal
A natural question arising from IER-related reporting practices is whether removing IER cases affects key analytic outcomes, including reliability, variable associations, model fit, and hypothesis support. Although methodological studies have explored these issues (e.g., Goldammer et al., 2020; Huang et al., 2012; Meade & Craig, 2012), our review presents an opportunity to assess how these effects manifest in actual research practice.
In terms of reliability, IER tends to introduce measurement noise, thus reducing internal consistency (e.g., Cronbach’s alpha). Removing IER cases generally improves reliability (e.g., Goldammer et al., 2020; Huang et al., 2012). However, under certain conditions, such as when IER manifests in long-string responding, IER can increase the reliability of observed scores (DeSimone et al., 2018). In addition, when item means are consistently above or below the response scale midpoint, IER can inflate inter-item correlations, increasing measure reliability through the mechanism described in Huang, Liu, et al. (2015).
For variable associations, the impact of IER will depend on variables’ means in relation to the midpoint of the response scale: When at least one variable’s mean is near the midpoint, IER tends to attenuate associations. However, when both variables have means further from the midpoint, IER tends to inflate observed relationships (Huang & DeSimone, 2021; Huang, Liu, et al., 2015).
For model fit, researchers have generally shown that IER can improve the fit of measurement models (Huang et al., 2012; Schmitt & Stults, 1985; Woods, 2006). However, Goldammer et al. (2020) found no consistent change in model fit after IER removal. As for hypothesis support, the impact of IER removal will likely depend on multiple factors, such as the extent of IER in the sample, the nature of the variables, and the nature of the hypotheses tested.
RQ5: How does the removal of IER impact (a) reliability, (b) variable associations, (c) model fit, and (d) hypothesis support?
Review Methodology and Findings
We focused our review on articles published in the twelve years following 2012 in 17 high-impact journals in the field of management. We selected these journals using information primarily from the Clarivate Journal Citation Reports 2020 while also referencing the SCImago Journal Rankings 2021 and the Financial Times Top 50 Journals. We considered journals listed in the Q1 and Q2 categories in the field of applied psychology, organizational behavior, and management but excluded journals that focus on other management subjects (e.g., marketing, information systems, strategy, etc.) or those not publishing empirical studies. We ranked the journals appearing in at least two listing sources by their impact scores and used a cutoff impact factor of 5 to identify leading journals for our review. As a result, we included 17 journals in our review of IER practices (see the Appendix).
As RQ1 pertains to the study characteristics associated with researchers’ decisions to screen for IER, we focused on quantitative studies that drew data from individuals. We coded relevant studies for the following characteristics: personal consequences (no consequences, some consequences), task type (only questionnaires, lab or experimental tasks, archival), duration (single survey, multi-wave survey, experience sampling), sample type (organization-sponsored, recruited from the community, student sample, online paid panel), in-person interactions (in-person, no in-person contact), and data collection format (paper-and-pencil, computerized). Our coding was conducted at the study level; for a multi-study article, each relevant study was coded separately. RQ2 and RQ3 focus on the subgroup of studies identified as having screened for IER. To address these two questions, we coded these studies for the indices used to detect IER, recorded cutoffs and other justifications pertaining to the treatment of IER, and calculated IER removal rate.
We conducted coding in three stages. In the initial stage, we coded key study information from journal articles as described above. Six undergraduate and graduate research assistants coded the articles. To ensure coding agreement and quality while also completing the large amount of work involved in coding all articles from 17 journals published since 2012, we extensively trained all coders to make sure they understood the coding scheme, followed the same coding procedure, and recorded information in a consistent way. Coders then worked independently on their assigned journal articles and met weekly to discuss coding issues. One of the authors double-checked the coding results of 5% randomly selected study entries in our review data (agreement = 97%). In the second stage, two senior members of the author team reviewed all the articles that reported IER screening (N = 1,859) and verified the screening methods used. Agreement between the second and the first stage of coding was 95%, and all discrepancies were resolved by discussion between the two authors. In the third stage, we added the coding for personal consequences and checked for overlapping samples after receiving developmental feedback from the journal reviewers. Four graduate research assistants coded personal consequences after two rounds of extensive training. One of the authors randomly checked 5% of the coded results from each of the primary coders and found 99% agreement. One of the research assistants also went through all relevant studies to examine whether the data of a given study overlapped with another study within the scope of our review. The findings were verified by one of the authors.
Summary of Findings
Of the 19,530 studies we coded, 10,759 (55.1%) were quantitative studies that collected data at the individual level. Following Wood’s (2008) recommendations, we excluded 38 studies with overlapping samples. After removing overlaps, the final sample consisted of 10,721 studies, which we analyzed to examine IER screening practices and reporting. Across the 17 journals, an overall of 1,859 (17.3%) studies among the 10,721 studies we coded reported using screening methods to detect IER (see Appendix). A breakdown of reporting rates by journal reveals that some, such as Organizational Behavior and Human Decision Processes (24.0%) and Journal of Business and Psychology (22.3%), led in IER reporting rates (above 20%). Others, like Academy of Management Journal (17.5%) and Journal of Organizational Behavior (17.2%), reported around the average. Notably, some high-impact journals, such as Journal of Management (9.6%) and Administrative Science Quarterly (9.1%), reported IER screening in less than 10% of their quantitative, individual-level studies.
RQ1: Decision to Screen
RQ1 focused on study characteristics in relation to the decision to screen for IER. Table 3 summarizes the breakdown of studies within each study characteristic and the rate of IER screening 2 within each category. Among the varying screening rates across categories, it is noteworthy that 46.6% of studies using online paid panels screened for IER, in sharp contrast with the average reporting rate in other sample types. For example, studies based on organization-sponsored samples had a low IER screening rate of 3.0%. These findings provide initial evidence that researchers may have more concerns over data quality when using online paid samples than other sample types.
Summary of Study Characteristics and IER Screening
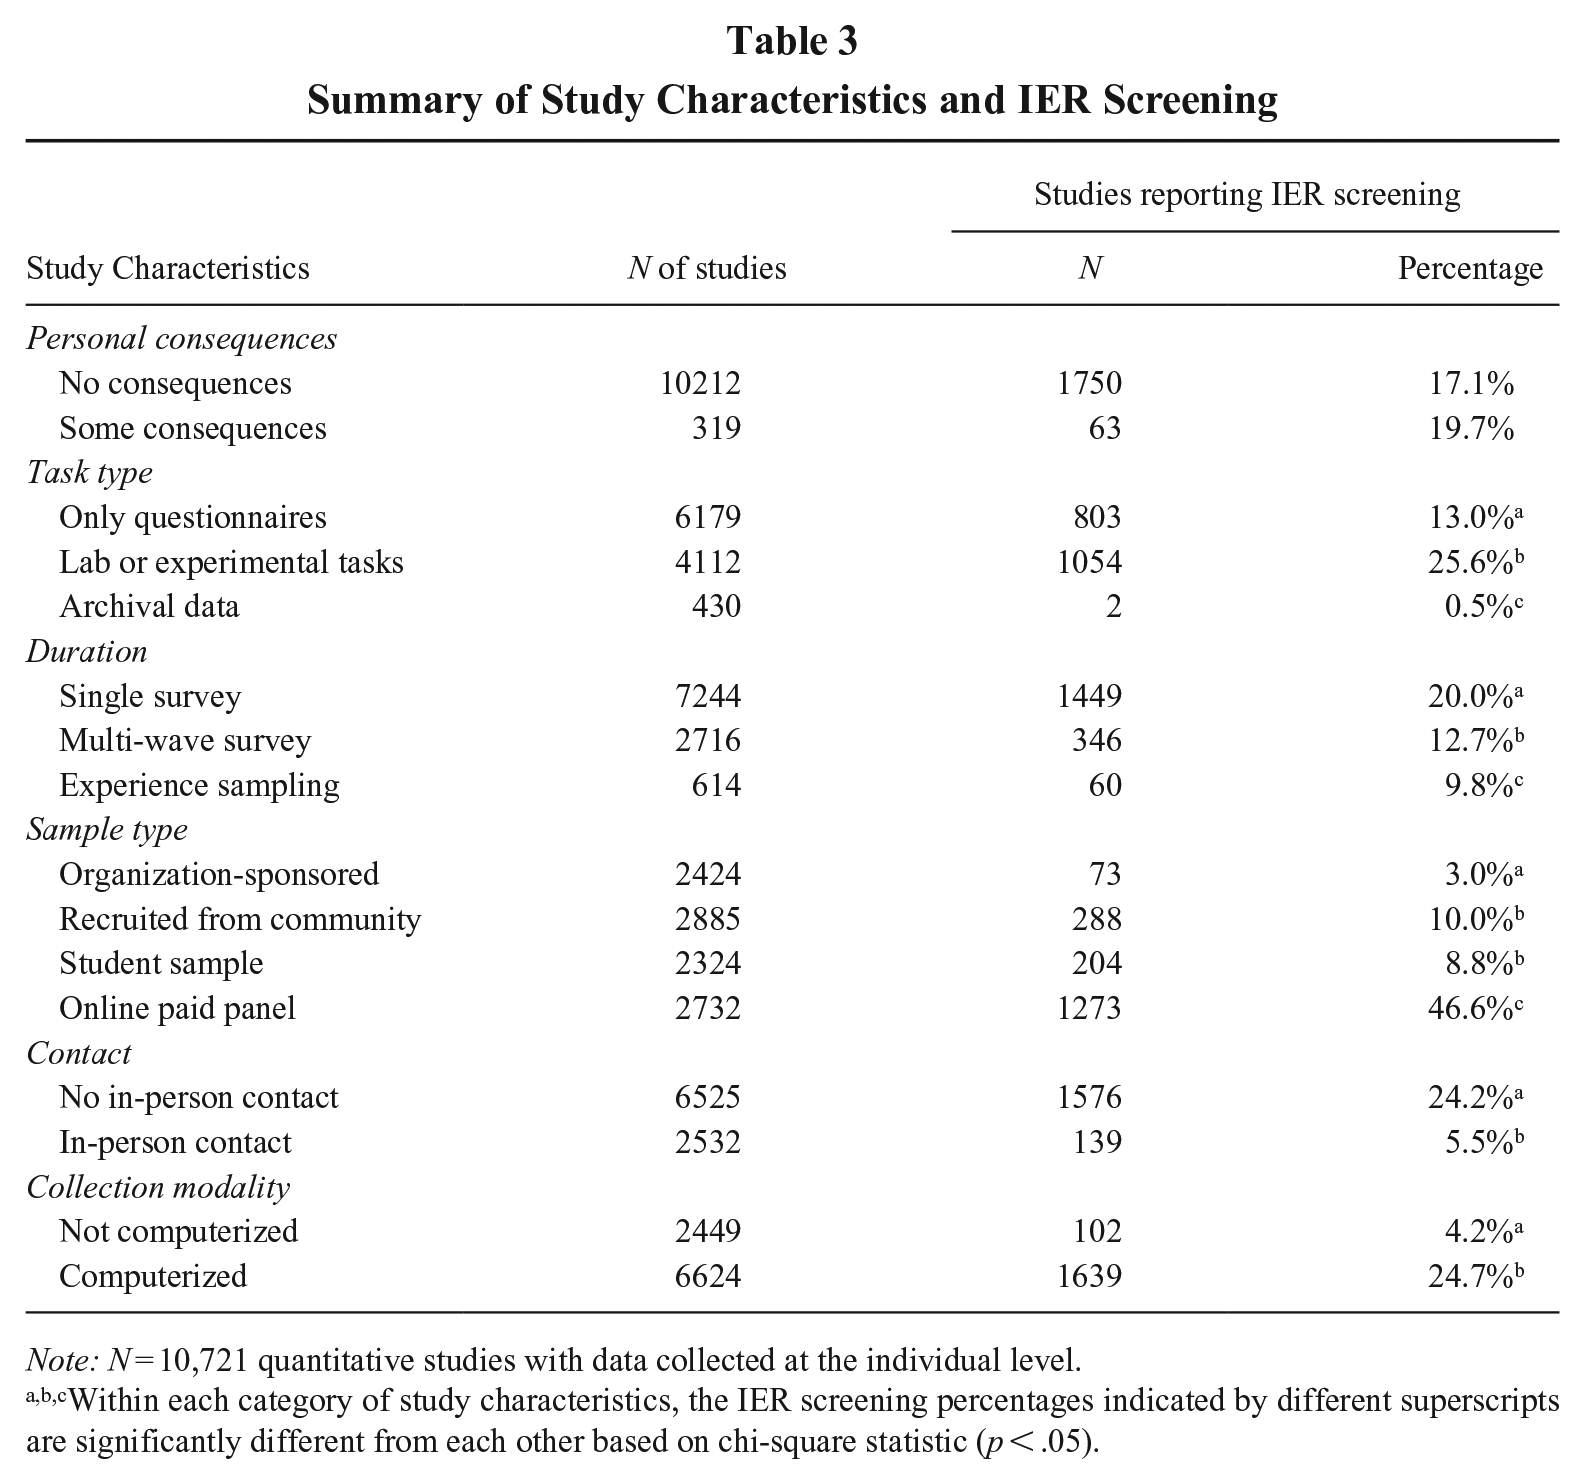
Note: N = 10,721 quantitative studies with data collected at the individual level.
Within each category of study characteristics, the IER screening percentages indicated by different superscripts are significantly different from each other based on chi-square statistic (p < .05).
Interestingly, studies where data collection had some personal consequences for participants received similar levels of IER screening (19.7%) to those bearing no personal consequences (17.1%). We hasten to note that most of the personal consequences were quite minor (e.g., additional monetary reward for superior performance), and thus may not reach the level of situational strength to impact response behaviors. Therefore, it may not be surprising that researchers still chose to screen for IER in those studies.
When researchers did not have in-person contact with the participants, they tended to screen for IER more frequently (24.2%) than in studies with in-person contact (5.5%). In a similar vein, studies using a computerized mode of data collection had a higher reporting rate (24.7%) than those using the paper-and-pencil format (4.2%). It is likely that when surveys were administered in a computerized setting and/or without in-person contact, researchers believed IER would be more likely, thus deciding to screen for IER in these settings.
We also observed that IER screening was more common in studies using lab or experimental tasks (25.6%) than in those using only questionnaires (13.0%). This is likely because participants’ attention to study instructions, requirements, and other materials is critical to the success of manipulations and interventions, and the routine practice of conducting manipulation checks spilled over to attention checks. Finally, IER screening rate did not differ when researchers collected data for different durations: the screening rates appeared similar across single surveys, multiple waves of data collection, and experience sampling methods.
The observations above about individual study characteristics are not independent from each other. That is, some characteristics (e.g., online paid samples and computerized measurement) are likely to co-occur. We conducted binary logistic regression to assess the impact of study characteristics on IER screening. Coding studies reporting IER screening as 1 and those not reporting IER screening as 0, we entered study characteristics as categorical variables in the binary logistic regression model. Studies with missing data on any of the predictors were excluded from this analysis. Table 4 presents the model results. The omnibus test of the model indicates a good fit to the data (χ2 = 1888.04, df = 10, p < .001). Together, the study characteristics explained between 20% and 32% of the variance in IER screening, as reflected in the pseudo-R2 estimates. We next interpret the odds ratios for study characteristics, where an odds ratio greater than 1 indicates higher odds of screening for IER, and an odds ratio less than 1 indicates lower odds. Regarding task type, compared to studies relying solely on questionnaires, those incorporating laboratory or experimental tasks were 24% more likely to screen for IER (odds ratio = 1.24, p = .004). However, studies using archival data were significantly less likely to screen for IER (odds ratio = 0.12, p = .04). For data collection duration, studies collecting multiple waves of data were 35% more likely to screen for IER than single-wave studies (odds ratio = 1.35, p < .001), while studies using experience sampling did not differ significantly. In terms of sample type, relative to studies using online paid panels, studies using organization-sponsored samples, samples recruited from the community, and student samples (odds ratio = .05, .17, and .12, respectively) were all significantly less likely to screen for IER. In other words, studies using online paid samples were 20 times (1/.05 = 20) more likely to screen for IER than organization-sponsored samples, six times (1/.17 ≈ 6) more likely to screen for IER than those using community-recruited samples, and about eight times (1/.12 ≈ 8) more likely than those using student samples. In addition, studies employing a computerized format were more than twice as likely to screen for IER compared to those that did not (odds ratio = 2.39, p < .001). Finally, we did not find significant effects associated with personal consequences or in-person contact. In sum, we found in response to RQ1 that four study characteristics (task type, duration, sample type, and data collection modality) were significantly associated with the practice of IER screening. 3
Binary Logistic Regression Results Using Study Characteristics to Predict IER Screening
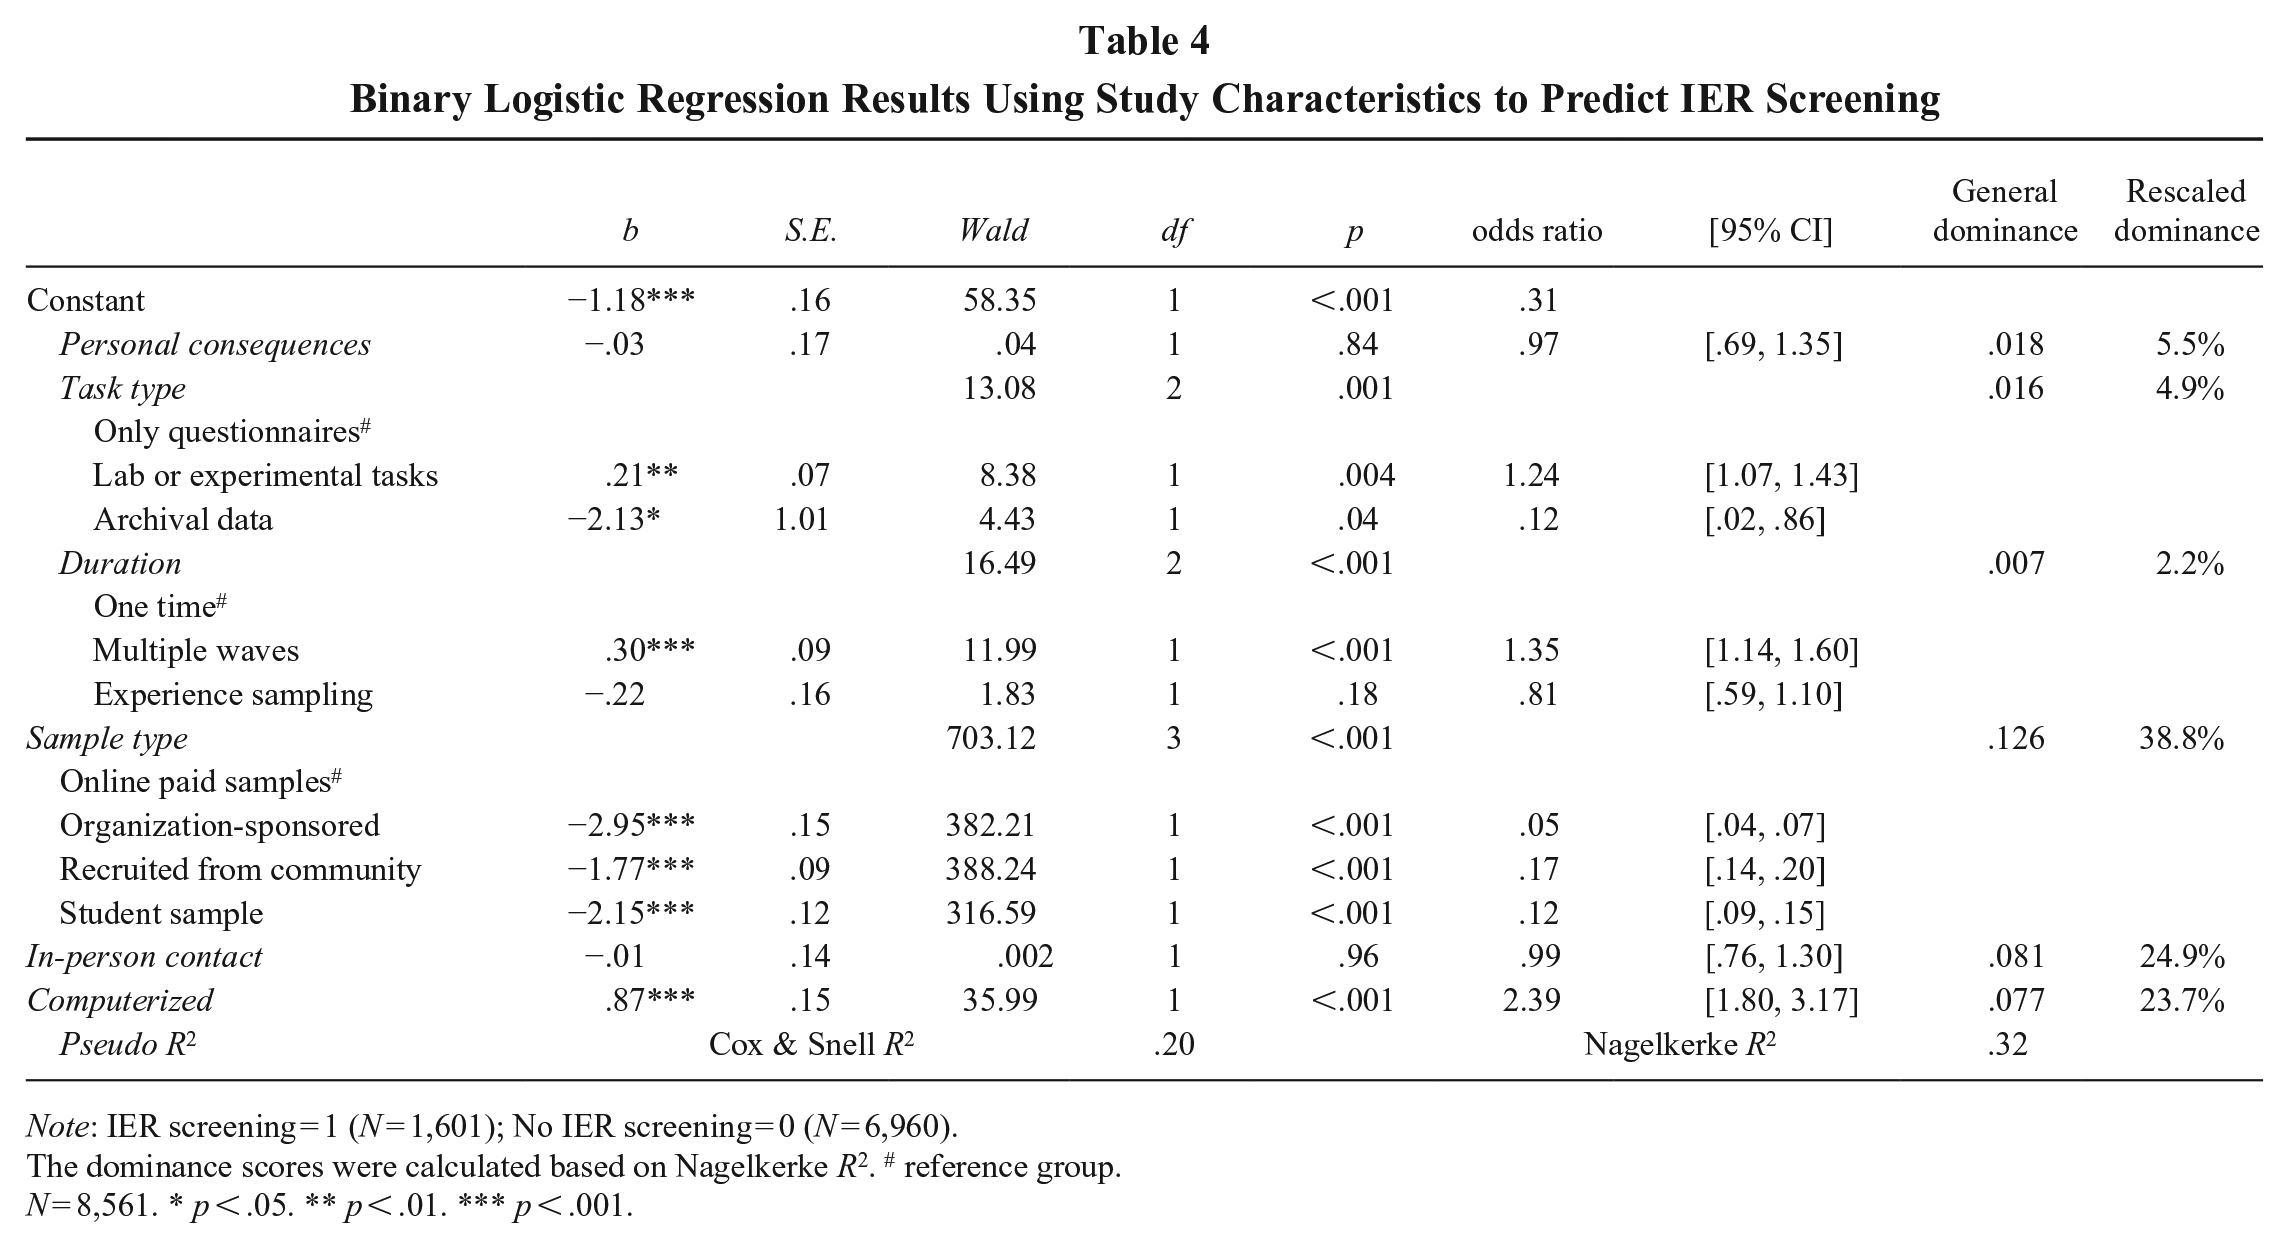
Note: IER screening = 1 (N = 1,601); No IER screening = 0 (N = 6,960).
The dominance scores were calculated based on Nagelkerke R2. # reference group.
N = 8,561. * p < .05. ** p < .01. *** p < .001.
In addition, we assessed the relative importance of these variables in predicting IER screening using dominance analysis for logistic regression (Tonidandel & LeBreton, 2010). Simply put, dominance analysis compares predictors’ contributions to explained variance across all possible model combinations. While general dominance expresses contributions in original R² units, rescaled dominance represents them as a percentage of the total variance explained. We performed the analysis with the R package “dominanceanalysis” (Navarrete & Soares, 2024). We found that sample type (38.8%) had the greatest influence, followed by in-person contact (24.9%) and computerized format (23.7%). In contrast, personal consequences (5.5%), task type (4.9%), and duration (2.2%) played comparatively smaller roles.
RQ2: Screening Methods
RQ2 asked what types of IER screening methods researchers utilized in their studies. Focusing on the group of studies (N = 1,859) that reported the detection of IER, we present a summary of the screening methods researchers used in the online supplemental Table S1. 4 It is worth noting that 384 (20.7%) of the studies answered methodologists’ calls (e.g., DeSimone et al., 2015; Meade & Craig, 2012) to employ more than one method to screen for IER, and as such, the sum of the percentages in Table S1 was larger than 100%. The majority of studies (69.1%) used attention check items either as their sole method or as one of multiple approaches for IER screening. This included 24.5% using instructed response items (ranging from 1 to 9 items, M = 2.14, SD = 1.43), 5.5% using instructed manipulation check (ranging from 1 to 3 items, M = 1.10, SD = .37), 3.3% using self-report response effort (ranging from 1 to 2 items, M = 1.21, SD = .41), 2.6% using infrequency items (ranging from 1 to 6 items, M = 3.52, SD = 1.85), as well as 53.8% of studies that did not provide the necessary details about the type of attention check items used. The prevalent use of instructed response items is noteworthy for two reasons: (a) there has been mixed support for the effectiveness of instructed response items (e.g., Huang et al., 2012); and (b) these items can be easily spotted by seasoned survey takers and even survey completion bots (see Bernerth, Aguinis, & Taylor, 2021). In contrast, the more covert kind of attention check items, infrequency items, were utilized much less frequently.
Besides attention check items, researchers also recorded response time in 16.5% of the studies as a procedural approach to detect IER. Most of these studies (79.2%) reported using the total time spent on the questionnaires, while a smaller percentage reported adopting a page time approach (11.1%). Considering the conclusion that the page time approach is “superior to that of total completion time” (Bowling et al., 2023: 323) because the latter may be too coarse to capture occasional inattentiveness, our review suggests that this recent conclusion has yet to be embraced in the literature.
The combined results on attention check items and response time suggest that researchers tended to anticipate potential issues with IER and thus planned ahead for their data collection. In contrast, post hoc approaches tended to see less use, with response patterns being the most utilized (8.1%), followed by response inconsistency (2.0%) and multivariate outlier (1.3%). The difference in utilization may be due in part to the relative ease of obtaining these indices: While response pattern can be easily calculated from various surveys, response inconsistency and multivariate outlier tended to require longer surveys with many items.
To assess the joint use of two different screening methods, we calculated conditional probabilities from the present data (see online supplement Table S2). Most notably, when researchers utilized attention check items, they typically relied on them alone, with response time being the most likely additional screening method used only 12% of the time. In contrast, when response time was utilized, attention check items (50%) and response pattern (21%) tended to be used as well. Likewise, when response inconsistency was used, attention check items (42%), response time (47%), and response pattern (34%) tended to be adopted as well.
Aside from the categories we coded above, we also encountered situations where researchers reported other approaches, including examining participants’ understanding of reading materials or instructions (11.5%), a manual review of response quality (9.0%), and the use of precautionary interventions to prevent IER (1.7%). Finally, 3.0% of studies reported screening for IER cases but did not provide sufficient information for us to code the approaches utilized.
RQ3: Removal Rate and Cutoffs
RQ3 focused on the percentage of IER cases researchers removed. When scholars screened for IER, they removed an average of 9.8% of cases (ranging from 0% to 64%, SD = 10.3%). When examining individual study features (see Table 5), several factors appeared to influence IER removal rate. Specifically, studies that used only questionnaires had a higher removal rate compared to those using lab or experimental tasks (Cohen’s d = .21). Similarly, studies with multi-wave surveys exhibited a higher removal rate compared to single surveys (Cohen’s d = .24) or experience sampling (Cohen’s d = .41). In terms of sample type, community-recruited samples had a higher removal rate than student samples (Cohen’s d = .39) or online paid panels (Cohen’s d = .28). Additionally, studies without in-person contact had a slightly higher removal rate than those with in-person contact (Cohen’s d = .20). Personal consequences and collection modality, however, did not significantly affect the removal rate. Table 6 presents descriptive statistics and correlations among these study features. It might be worth noting that procedural IER screening methods were more commonly used in online paid samples (r = .24, p < .001) compared to other sample types (rs ranged from −.14 to −.12).
Study Characteristics and IER Removal Rate
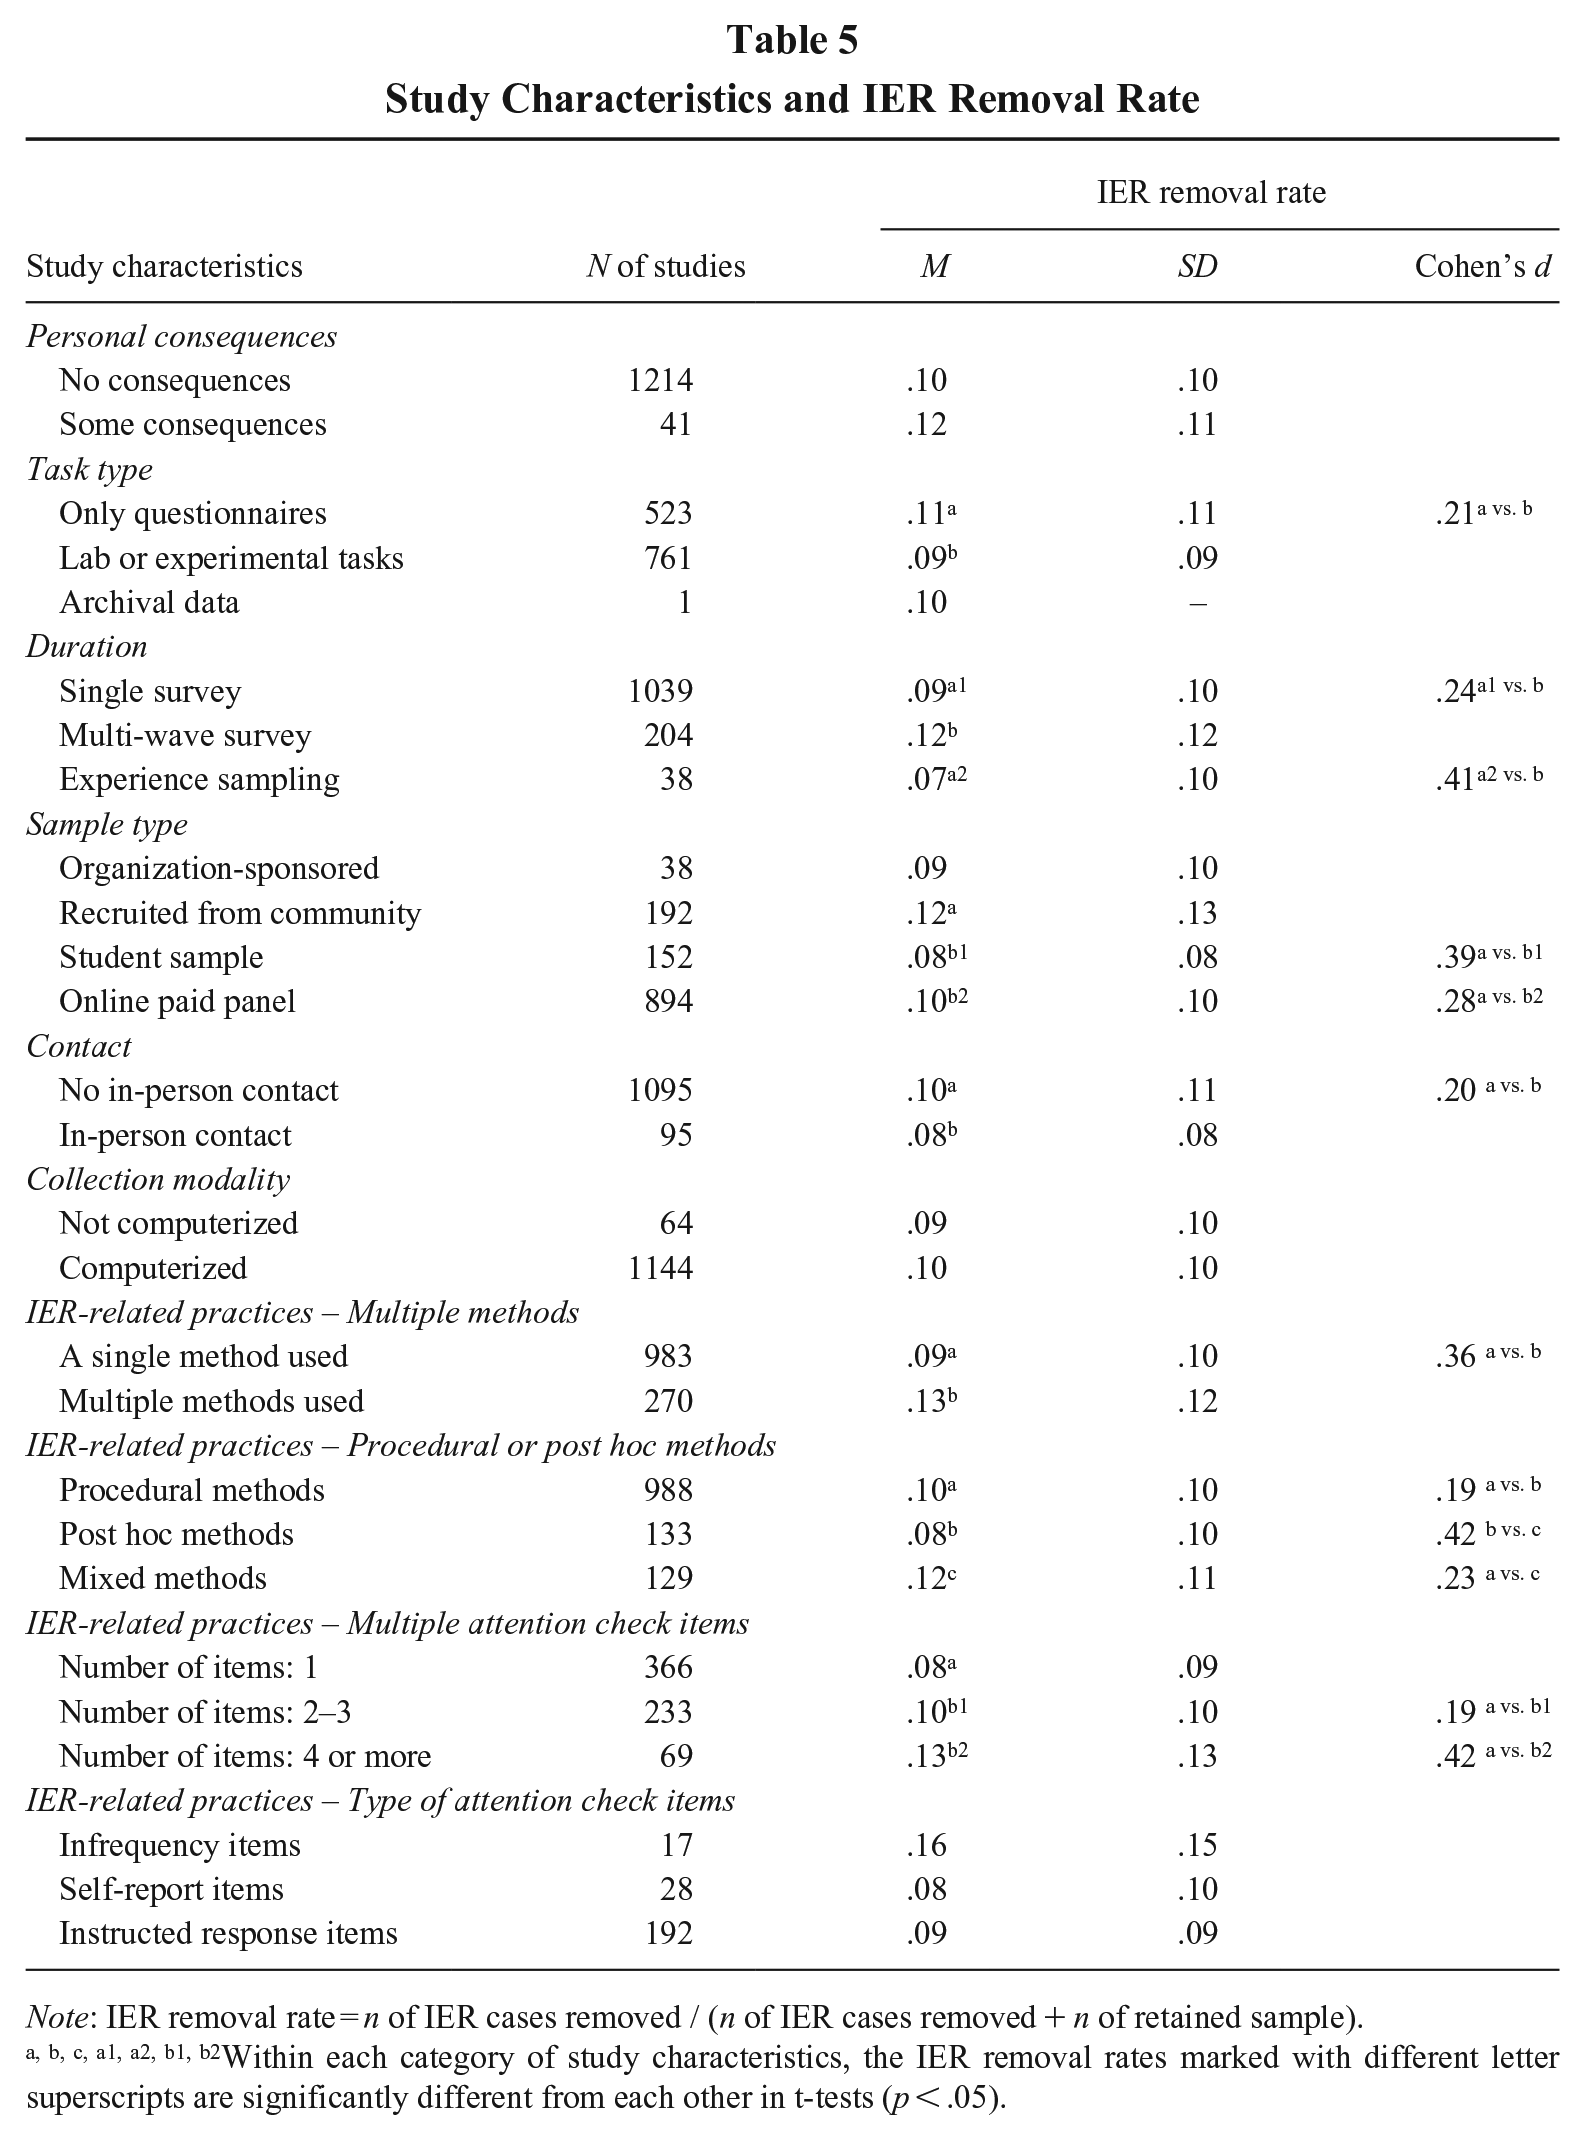
Note: IER removal rate = n of IER cases removed / (n of IER cases removed + n of retained sample). a, b, c, a1, a2, b1, b2Within each category of study characteristics, the IER removal rates marked with different letter superscripts are significantly different from each other in t-tests (p < .05).
Descriptive Statistics and Correlations
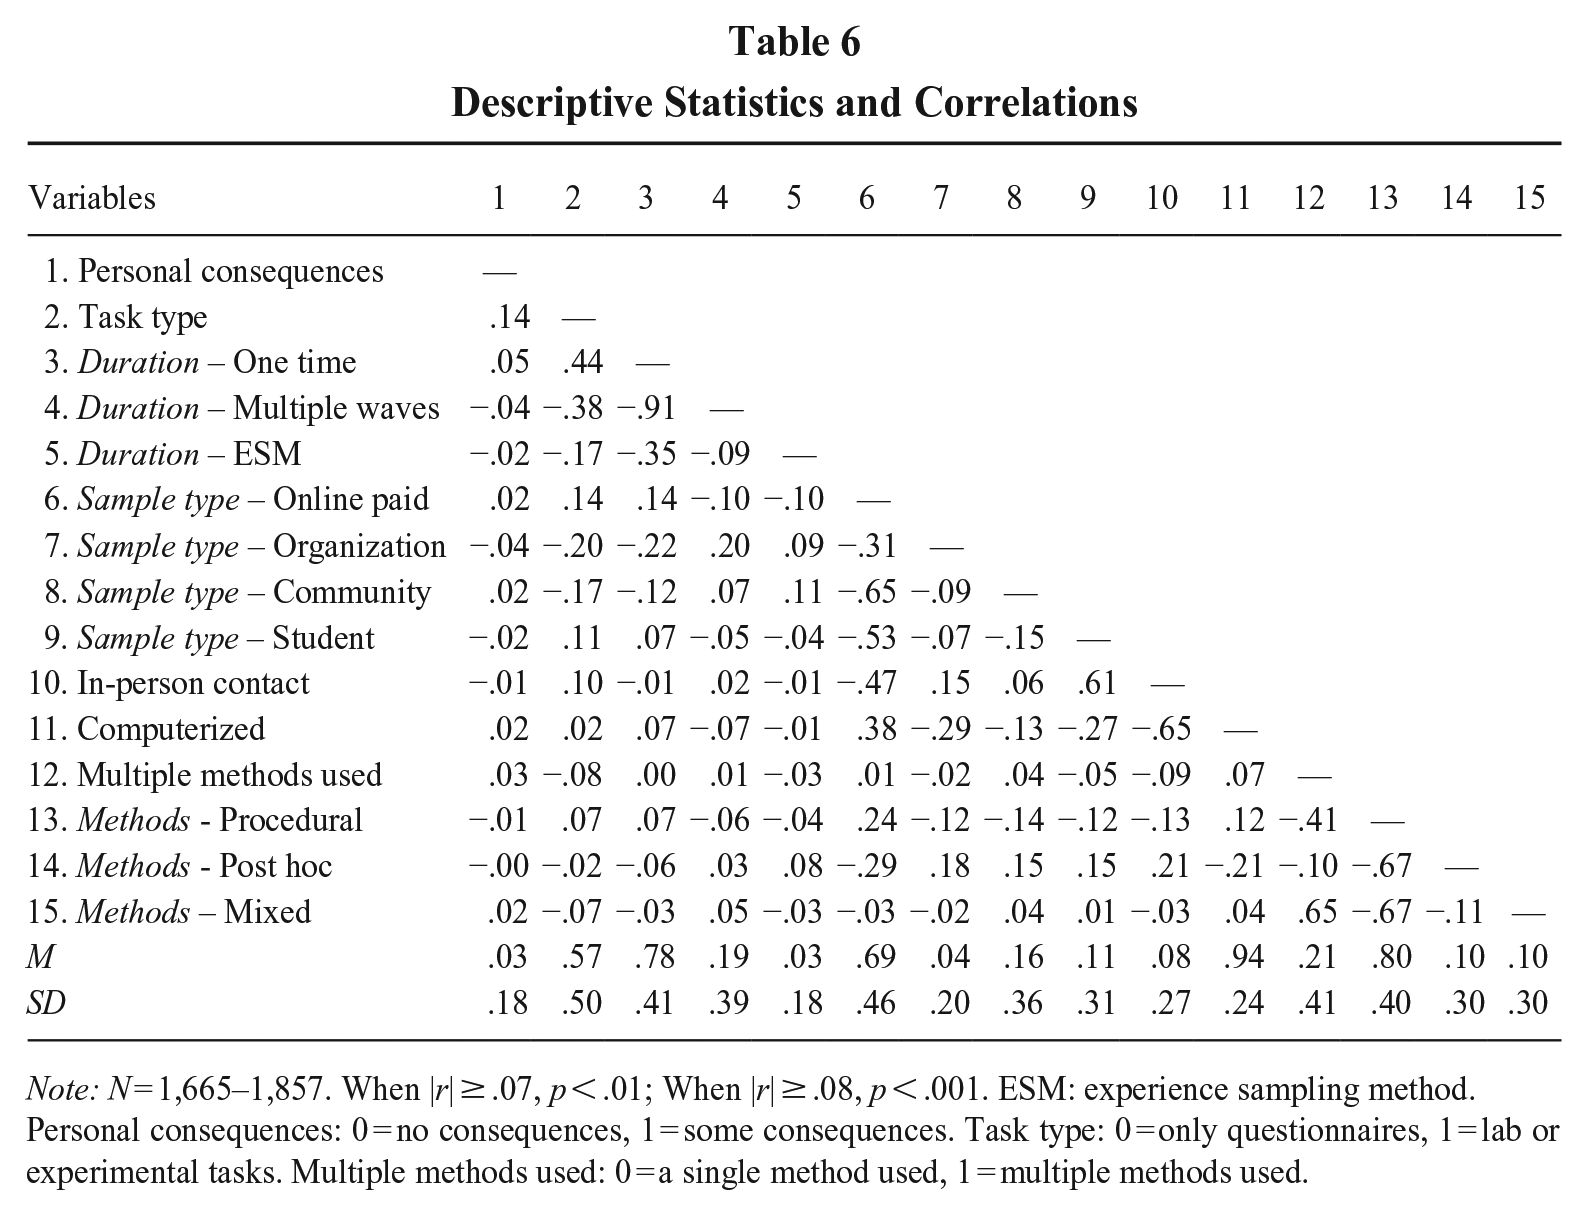
Note: N = 1,665–1,857. When |r| ≥ .07, p < .01; When |r| ≥ .08, p < .001. ESM: experience sampling method.
Personal consequences: 0 = no consequences, 1 = some consequences. Task type: 0 = only questionnaires, 1 = lab or experimental tasks. Multiple methods used: 0 = a single method used, 1 = multiple methods used.
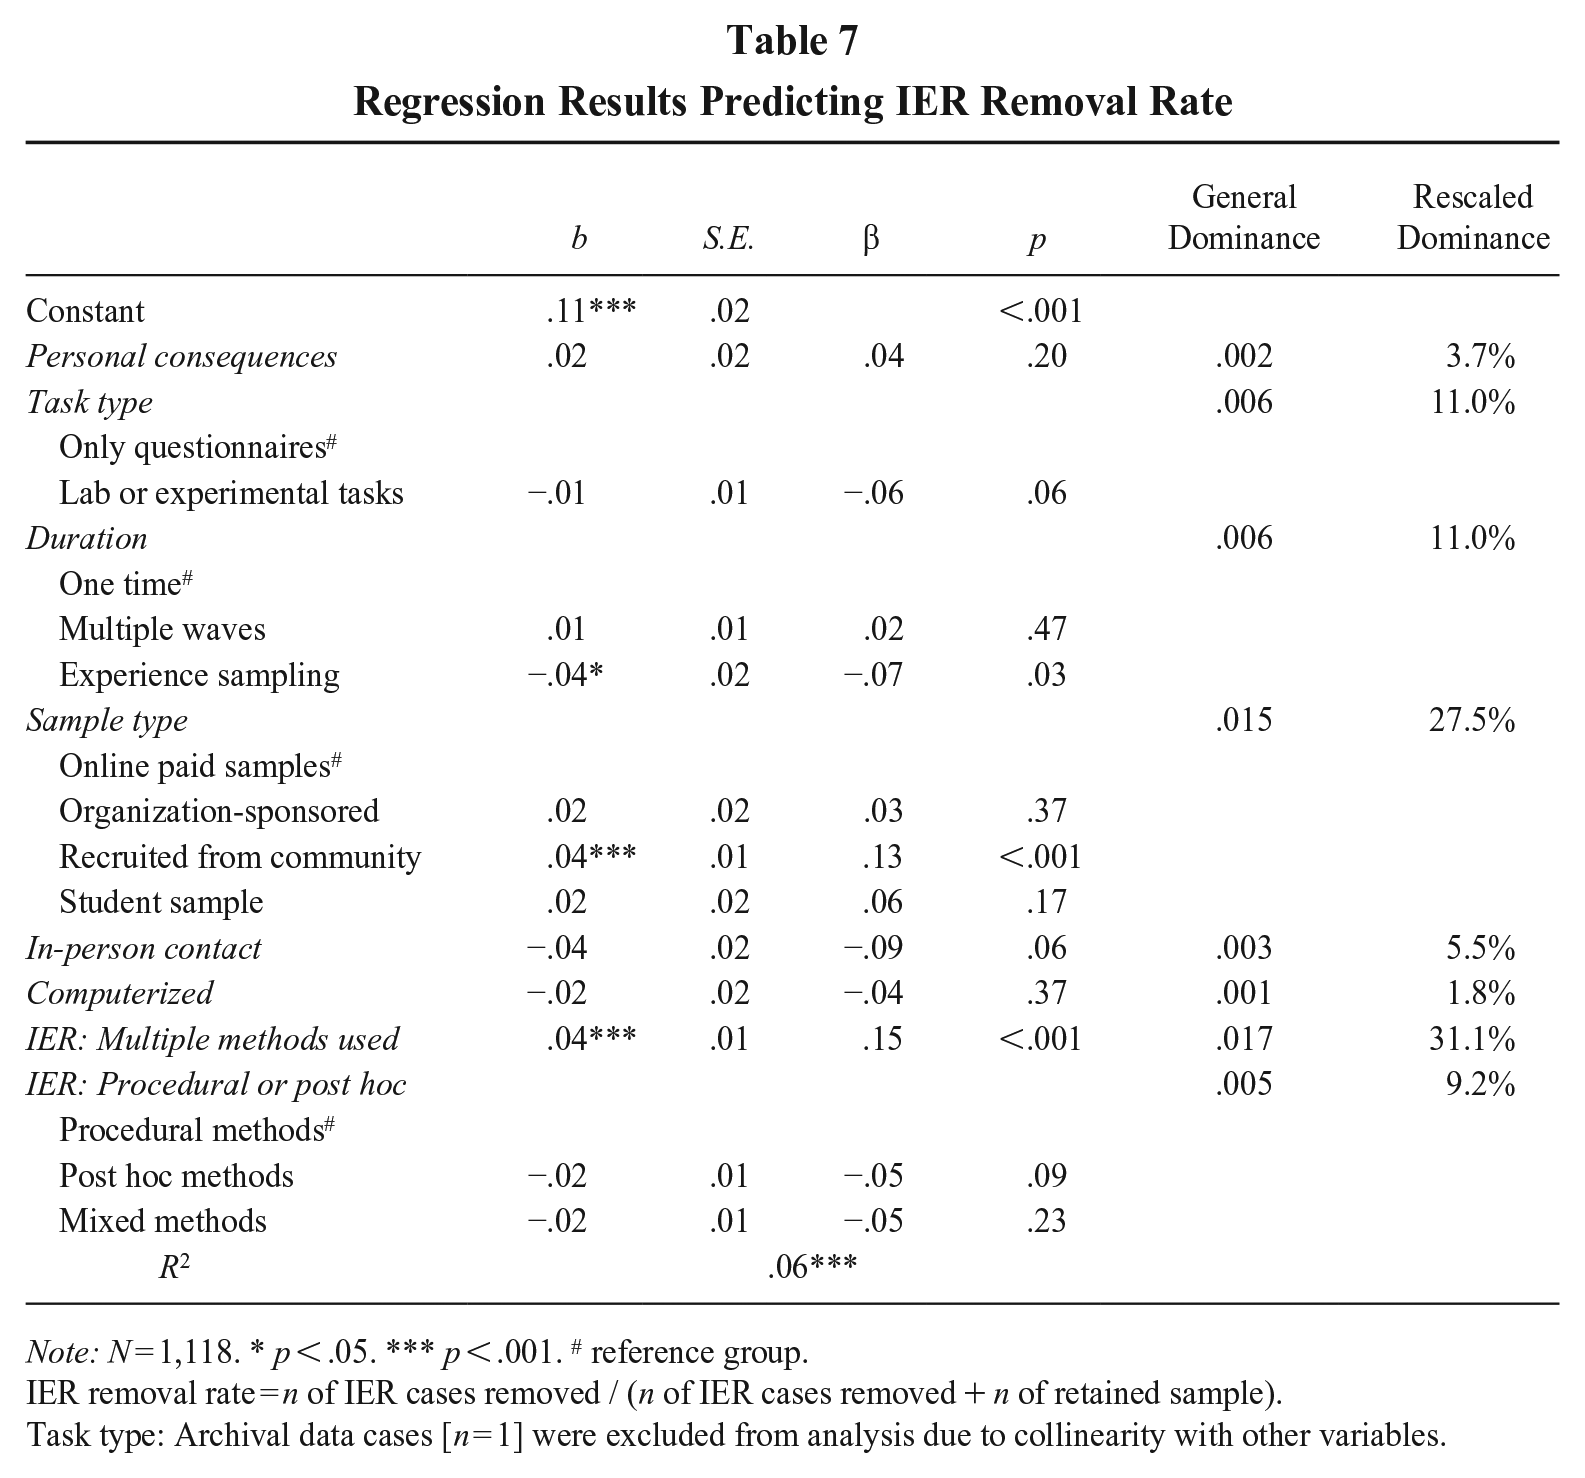
Next, we examined how study features and IER-related practices jointly predicted IER removal rate (see Table 7), restricting the analysis to IER-related practices with complete data. We found that only two features remained significantly associated with the removal rate: study duration and sample type. Specifically, using experience sampling was associated with a lower removal rate than the reference group of one-time survey (β = −.07, p < .05), while recruiting from the community was linked to a higher removal rate compared to the reference group of online paid samples (β = .13, p < .001). More importantly, IER-related practices significantly predicted IER removal rate. Studies that employed multiple methods to detect IER had a higher removal rate (β = .15, p < .001). This suggests that the rigor and thoroughness of IER detection practices, more so than study features, play a crucial role in determining the extent of data removal.
Regression Results Predicting IER Removal Rate
Note: N = 1,118. * p < .05. *** p < .001. # reference group.
IER removal rate = n of IER cases removed / (n of IER cases removed + n of retained sample).
Task type: Archival data cases [n = 1] were excluded from analysis due to collinearity with other variables.
We also examined the relative importance of the predictors using dominance analysis for linear regression (Azen & Budescu, 2003). The results (see Table 7) showed that using multiple methods was the most influential factor (31.1%), followed by sample type (27.5%). Both task type and duration accounted for 11.0%, while the use of procedural or post hoc methods accounted for 9.2% of the explained variance in IER removal rate. However, in-person contact (5.5%), personal consequences (3.7%), and computerized format (1.8%) were less influential.
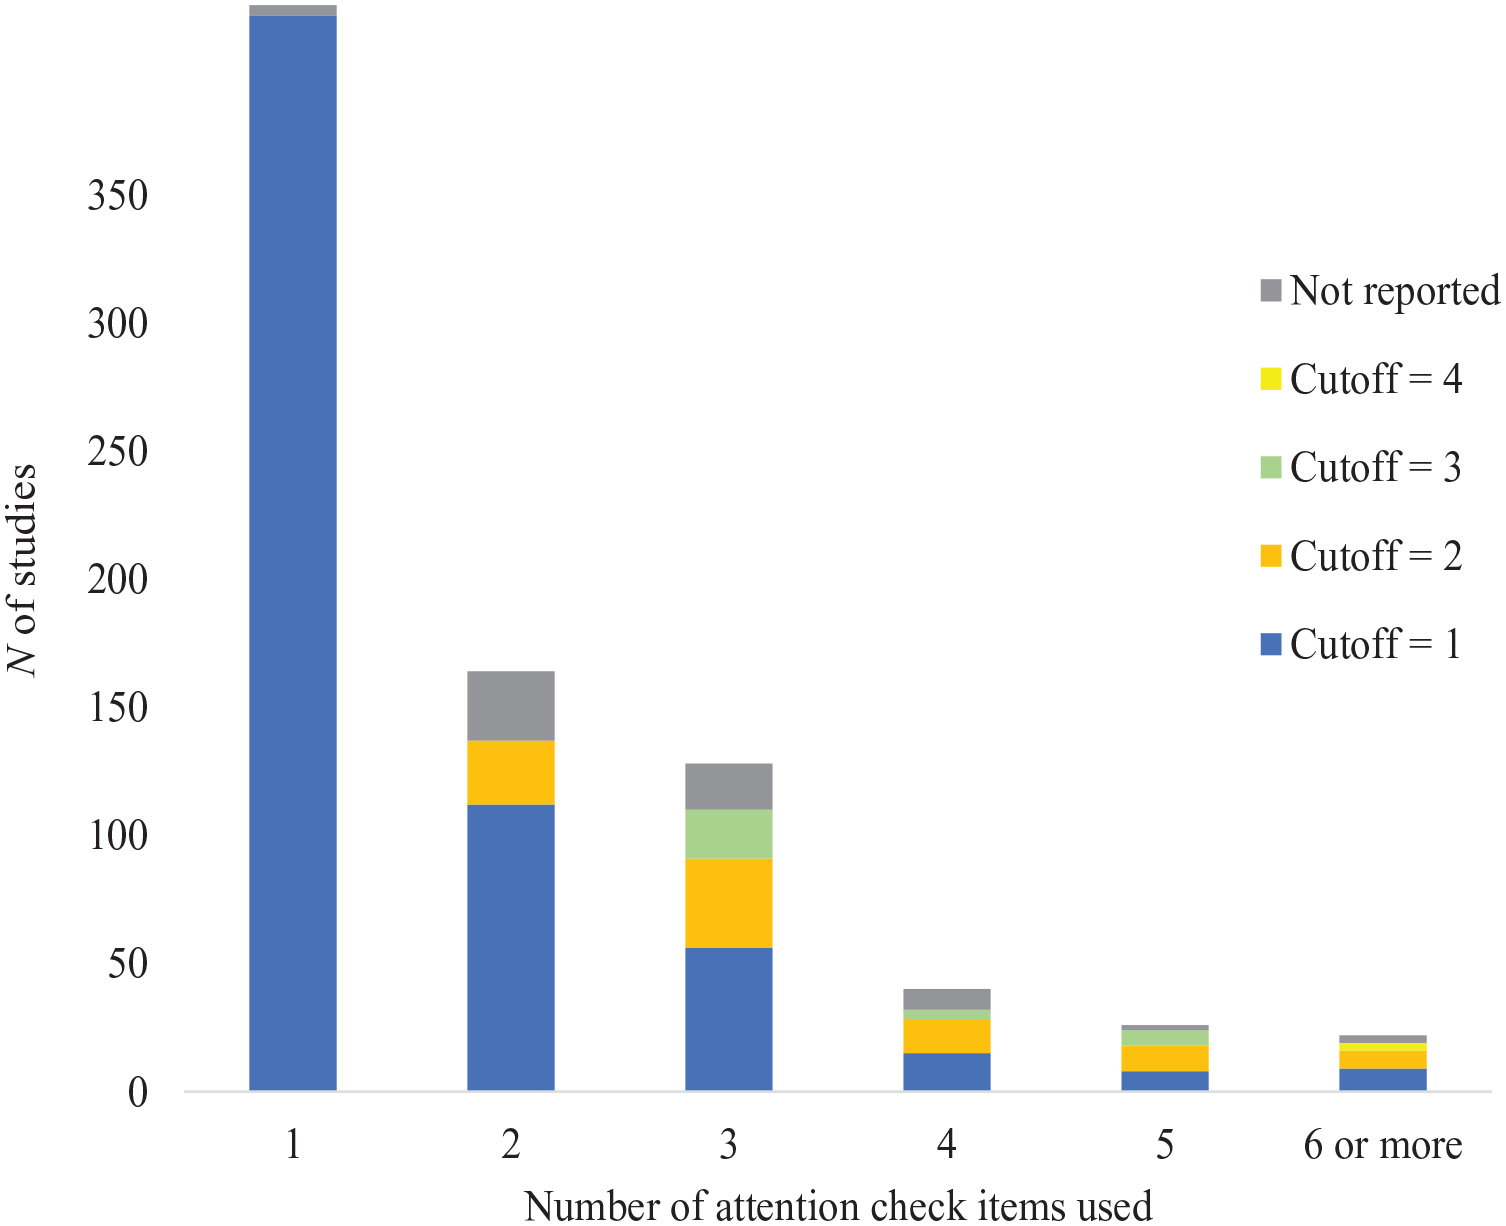
RQ3 also explored the cutoffs adopted to exclude IER cases from analyses. Because cutoffs depend on the methods of detection, we turned to attention check items for this analysis as they were the most popular (69.1%) IER screening approach among the studies in this review and provided a relatively standardized way of evaluating cutoffs. Specifically, we examined the subset of 742 studies that screened individuals with attention check items and reported their cutoffs. We report the number of attention check items and the respective cutoffs in Figure 1 (separate figures for different types of attention check items are included as online supplementary materials). The number of attention check items embedded ranged from 1 to 12 (M = 1.97, SD = 1.42), with a mode of 1. As shown in Figure 1, most of these studies (N of 620 out of 742; 83.6%)—including those with only one attention check item (N of 420; 56.6%)—removed participants when they missed a single attention check item. Although this practice removed anyone suspected of engaging in IER behavior, it risked removing attentive participants who misinterpreted those items (see Meade & Craig, 2012), given that these attention check items are not perfectly reliable. We will return to this point in the Discussion and Recommendation section.
Cutoffs Reported for Attention Check Items
Aside from attention check items, the reporting of cutoffs was quite sporadic, and we could not glean enough information to correctly code the cutoffs for the other approaches. For instance, in many cases, researchers using response time described identifying some respondents as completing a survey “too fast.” There were also situations where a cutoff was based on total completion time, which depended on the overall survey length that was not reported. Of the 307 studies that reported using response time, 29 cited Huang et al. (2012), and 24 of them specifically referenced the 2-second per item cutoff. Even then, it is unclear how the cutoff was applied (e.g., flagging a participant for failing page time on any page vs. applying the 2-second per item rule to the survey duration). Likewise, of the 25 studies that applied Mahalanobis distance to screen for IER, only 7 reported cutoffs (e.g., using 95% or 99% confidence interval for Mahalanobis D as cutoff). Finally, studies using the long string index for IER screening showed variation in detection criteria. The cutoffs for IER differed across studies, with some using thresholds of 5, 8, and 20 consecutive identical responses, while others removed responses that consistently selected the same option, such as all “1s,” “3s,” or “5s,” or identical responses throughout entire sections.
Researchers also employed IER detection methods during their data collection, terminating data collections for individuals who showed signs of IER behavior. For instance, Fu, Greco, Lennard, and Dimotakis (2021) “stopped the participation of 45 people because they (a) missed attention checks embedded in the survey for 3 days in a row or (b) carelessly responded to some qualitative questions” (p. 59). Loi, Kuhn, Sahaym, Butterfield, and Tripp (2020) mentioned that “we added attention checks to our surveys and did not invite participants to complete follow-up surveys if they failed an attention check” (p. 951).
RQ4: Current Practices and Best Practice Guidelines
RQ4 proposed a comparison between current practices and best practice recommendations. To compile best practice recommendations from the management and relevant literature, we conducted an extensive search for review articles relevant to IER. We also included empirical articles that examined the effectiveness of more than one IER approach. In total, we identified 7 reviews and 14 empirical articles (see Online Supplementary for the list). When coding the recommendations offered in these articles, we focused on reportable actions regarding screening and removal of IER cases and included those guidelines recommended by two or more articles. We also excluded guidelines that are almost universally accepted yet difficult to assess in published articles (e.g., keeping participants motivated and engaged). After identifying the guidelines, we assessed the subgroup of studies that each guideline was relevant to and coded the number of studies that met that guideline.
As the summary in Table 8 indicates, methodologists generally agreed on how screening methods should be applied. Twelve articles advocated for the combined use of different detection methods, while 13 articles called for the use of response time when possible. The adoption of these guidelines, however, remained low at 20.7% and 18.5%, respectively. Although seven sources recommended the inclusion of attention check items for lengthy surveys, we could not evaluate this guideline because journal articles rarely disclose the total length of studies. Finally, there were mixed recommendations regarding the use of the long string index. While four articles supported its use, two recent articles have raised concerns about its effectiveness. We found that 7.5% of studies employed the long string index to detect IER.
Review of Best Practice Recommendations for Dealing with IER
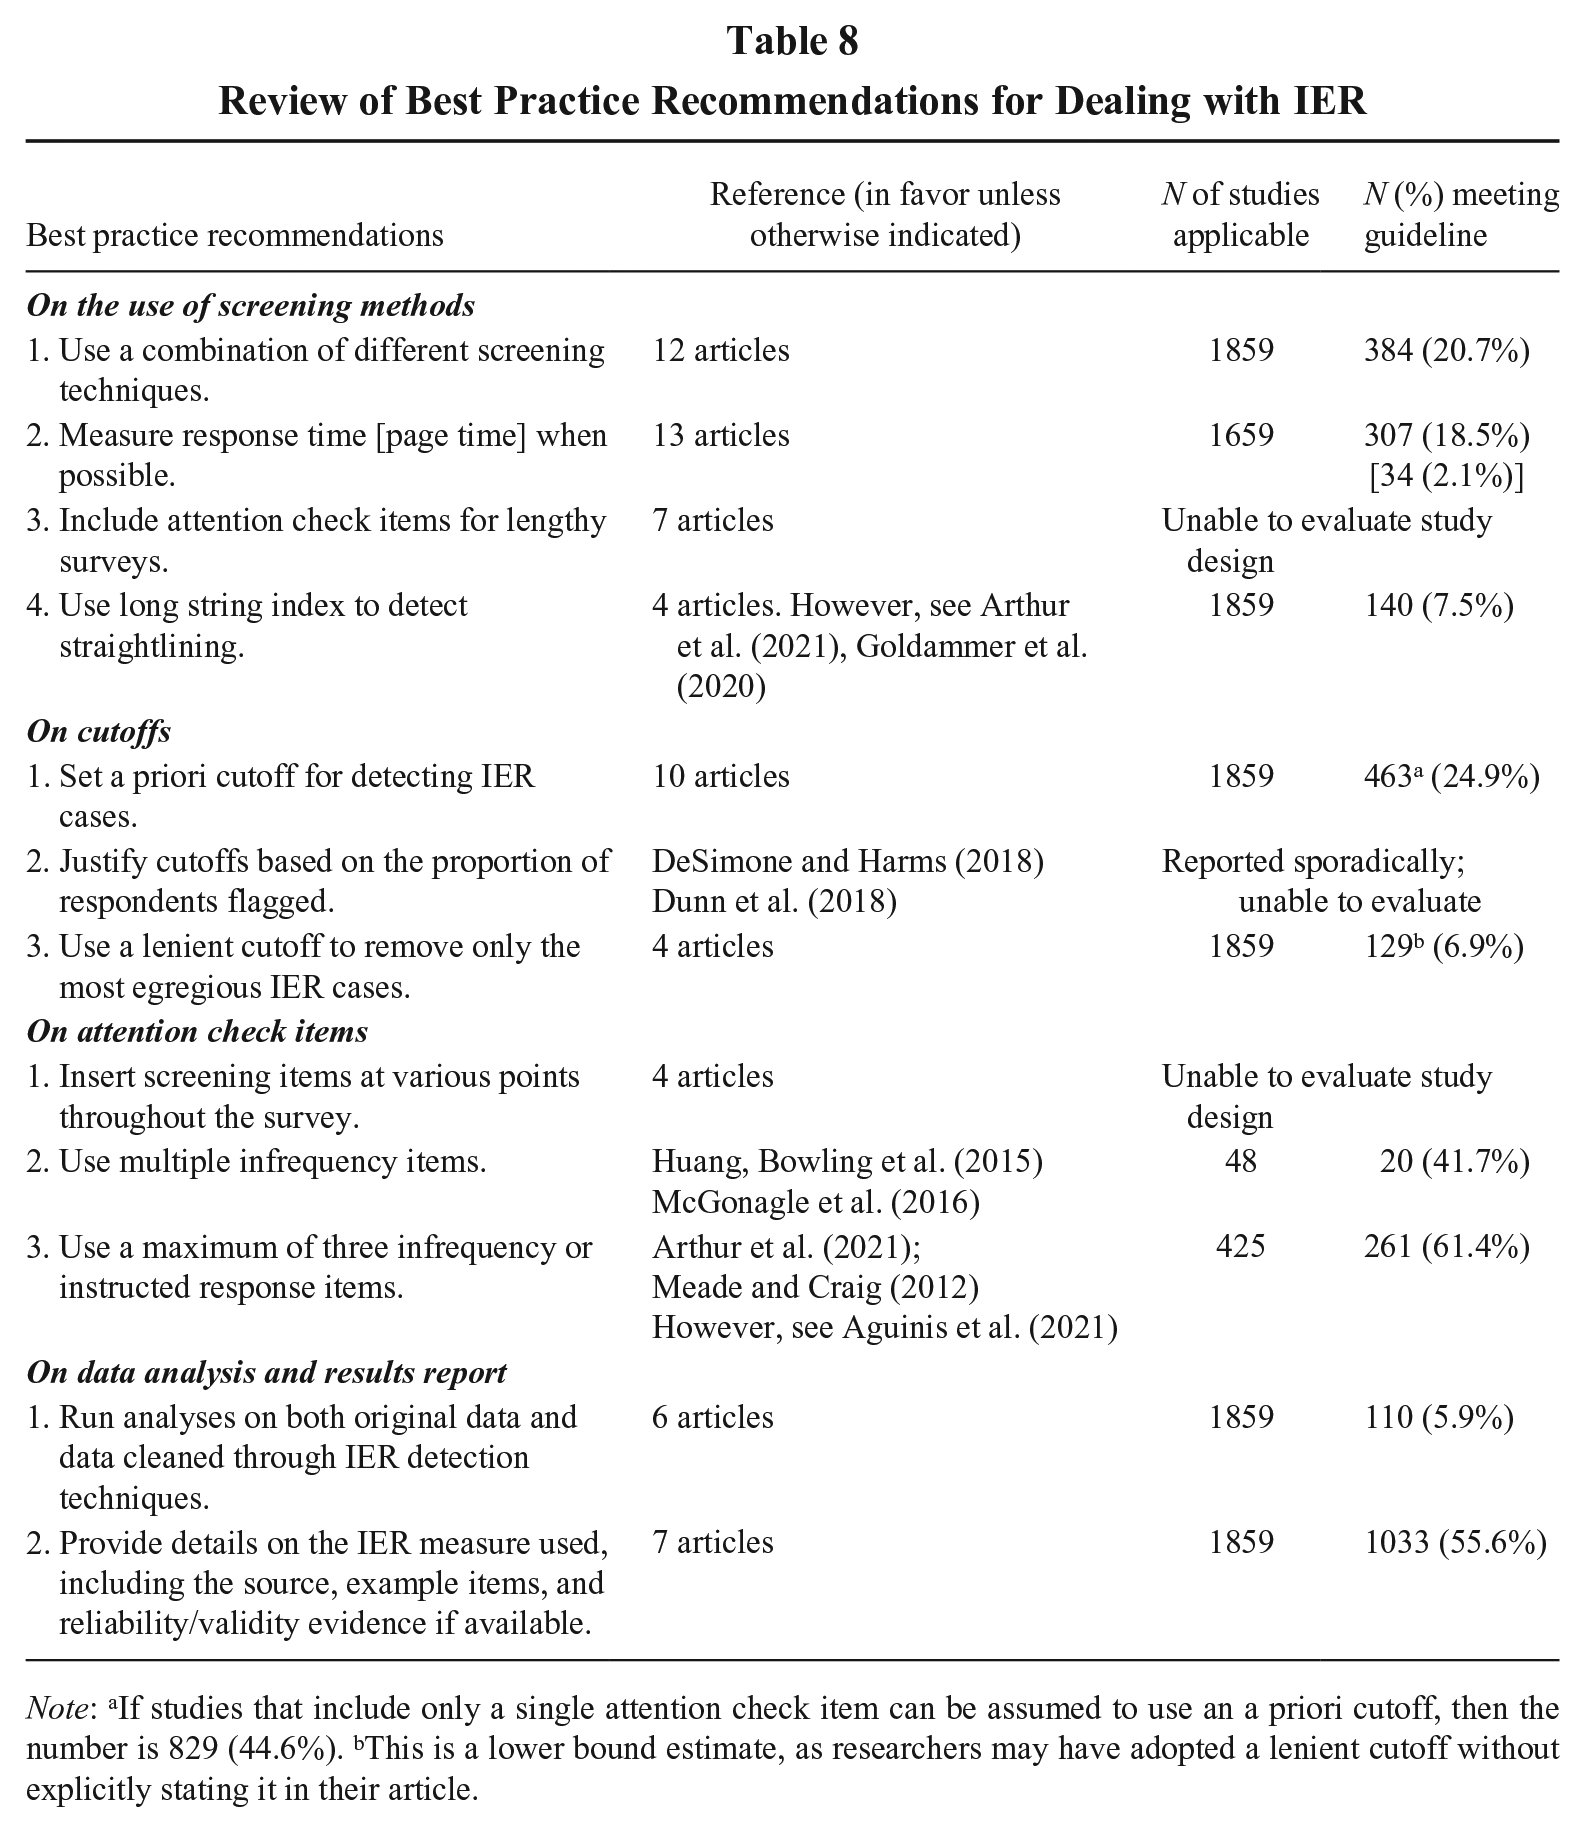
Note: aIf studies that include only a single attention check item can be assumed to use an a priori cutoff, then the number is 829 (44.6%). bThis is a lower bound estimate, as researchers may have adopted a lenient cutoff without explicitly stating it in their article.
Different approaches exist for setting cutoffs. The most commonly recommended option is to use a priori cutoffs, which were applied in 24.9% of studies. Another approach is to remove a fixed proportion of the sample; however, while authors typically reported the proportion of IER cases removed, few explicitly justified removal based on a pre-set threshold (e.g., 10%). As a result, we could not classify studies into this category. Finally, a lenient cutoff aimed at removing only the most egregious IER cases was followed in 6.9% of studies. Interestingly, almost half (48.3%) of the 1,284 studies that utilized attention check items adopted a strict approach, removing responses for failing just one attention check item.
When it comes to attention check items, methodologists recommended scattering them throughout a survey, but we could not obtain the relevant information to code current practices. Two other guidelines are somewhat contradictory: one called for the use of multiple infrequency items (41.7% of studies screening with infrequency items followed this), whereas the other advocated for a limit of three infrequency or instructed response items (61.4% of studies using attention check items did not exceed this limit).
Regarding data analysis and reporting, one common guideline is to conduct analyses on both the original dataset and the cleaned dataset. However, this recommendation may warrant revisiting. Given that IER can distort observed associations—either inflating or attenuating them (Huang, Liu, et al., 2015)—it is unclear what meaningful insights can be gained from analyzing a dataset contaminated by IER. Perhaps unsurprisingly, only 5.9% of studies adhered to this guideline. In contrast, the guideline to provide methodological details on the IER measure used is far more justifiable. 55.6% of studies followed this best practice by documenting the source, sample items, and relevant reliability and validity evidence.
Finally, to assess potential changes in IER-related practice over time, we examined IER screening percentage and removal rate across the years. As Figure 2 indicates, screening for IER has steadily increased since 2012, with a particularly notable rise in the past four to five years. In contrast, IER removal rate has stayed relatively stable, hovering around 10% of the samples in studies that screened for IER. The slight downward trend in IER removal rate may be attributed to the growing number of studies that now include IER screening—studies where IER was not previously a major concern are likely being screened in recent years.
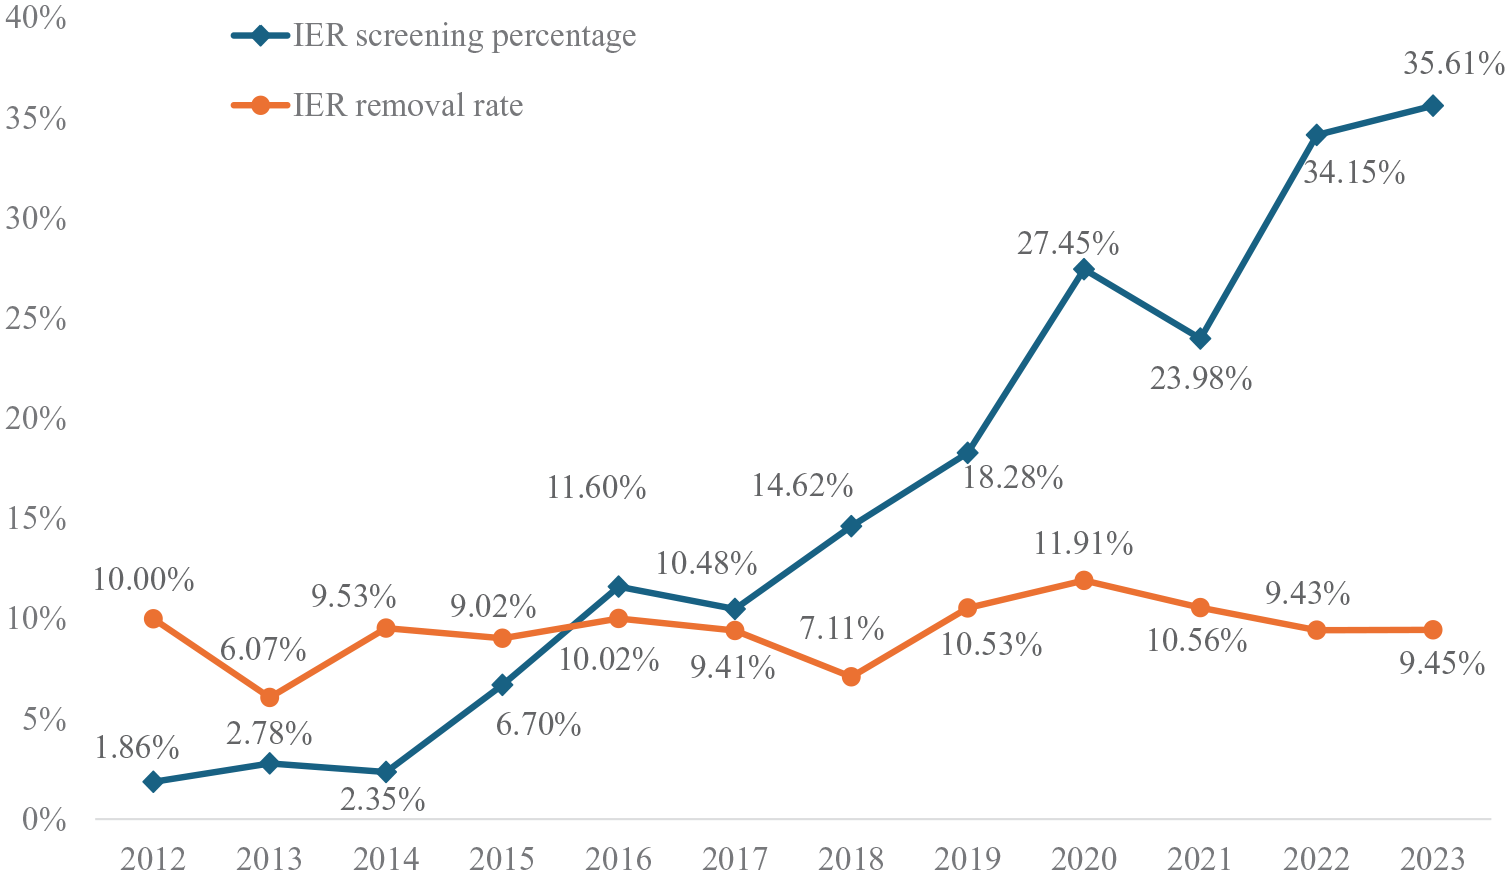
IER Screening Percentage and Removal Rate over Time (2012–2023)
RQ5: Impact of IER Removal
To address RQ5, we first attempted to code studies that ran analyses on both original and cleaned data (N = 110). However, inconsistencies in reporting made it impossible to systematically code these studies. To evaluate the impact of IER cases on key study results, we surveyed 998 corresponding authors (794 after removing bounced emails) from studies that screened for IER (IRB #STUDY00011874). Respondents answered three questions on whether the inclusion of IER cases improved, decreased, or had no effect on measure reliability, model fit, and support for key hypotheses. A fourth option, analogous to “Not Applicable,” allowed respondents to indicate if they did not know, remember, or run the analysis. Authors of multi-study papers were asked to select one study to report on. We received 186 responses (23.4% response rate). However, most responses were for the “Not Applicable” option and thus unusable for our analysis. We treated these responses as missing data and analyzed the remaining responses, reversing them to focus on the impact of IER removal.
Among the usable data, IER removal yielded higher reliability in 14 studies (29.2%), similar reliability in 28 studies (58.3%), and lower reliability in six studies (12.5%). For model fit, IER removal resulted in better model fit in 10 studies (27.0%), similar fit in 23 studies (62.2%), and worse fit in four studies (10.8%). Regarding hypothesis support, 54 studies (93.1%) found no change associated with IER removal, while two studies (3.4%) reported increased support, and two (3.4%) reported decreased support.
Although surveying researchers represents the most comprehensive attempt to understand the impact of IER removal, self-report from researchers may suffer from nonresponse bias, recall error, and social desirability bias. We performed two meta-analyses on target variables to understand the impact of IER removal on (a) reliability and (b) variable associations.
For reliability, we examined three widely used scales: in-role behavior and organizational citizenship behavior (OCB; Williams & Anderson, 1991) and counterproductive work behavior (CWB; Bennett & Robinson, 2000). Searching in the 17 journals between 2012 and 2023, we identified 479 articles citing Williams and Anderson (1991) and 246 citing Bennett and Robinson (2000). Studies were included if they (1) were empirical and quantitative, (2) used self-report data with the specified scales, and (3) reported Cronbach’s alpha and the number of items. This resulted in 67 samples (68 effect sizes) for in-role behavior, 36 samples (47 effect sizes) for OCB, and 93 samples (112 effect sizes) for CWB. One senior author and a research assistant independently coded scale reliabilities and the number of items, achieving 96% interrater agreement. Any discrepancies were resolved through discussion.
Following Greco, O’Boyle, Cockburn, and Yuan’s (2018) recommendations for reliability generalization, we conducted a meta-analysis with untransformed, variance-weighted alpha. We conducted a meta-regression analysis in R package “metafor” (Viechtbauer, 2015) to examine IER screening as a moderator, controlling for the number of items. We used the multilevel approach to account for the nested data structure, as some studies reported multiple dimensions of the same construct. As shown in Table 9, IER removal was associated with higher reliability for CWB (b = .04, Z = 2.05, p = .04), marginally lower reliability for in-role behavior (b = −.03, Z = 1.80, p = .07), and no effect on the reliability for OCB (b = .00, Z = 0.11, p = .91).
Meta-Analysis on the Impact of IER Screening on Scale Reliabilities
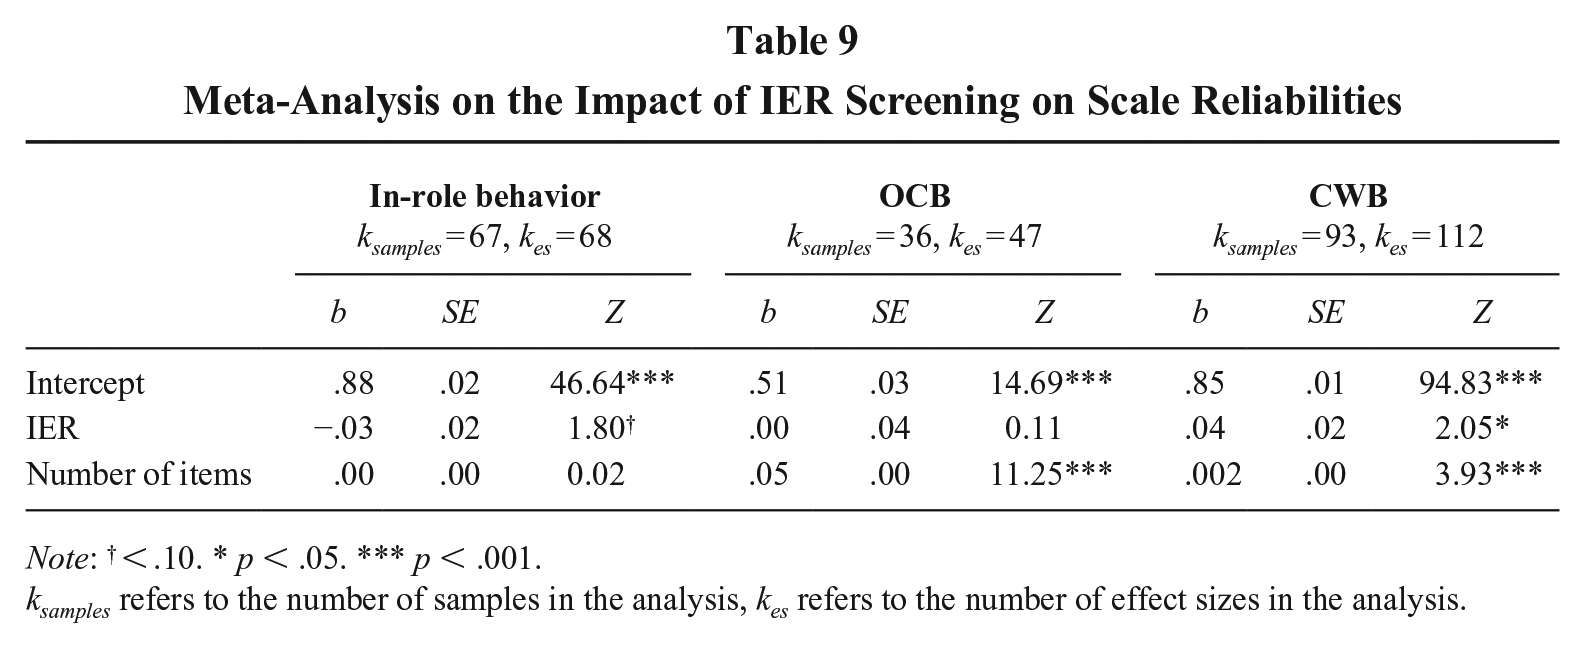
Note: † < .10. * p < .05. *** p < .001.
ksamples refers to the number of samples in the analysis, kes refers to the number of effect sizes in the analysis.
Another way to assess the impact of IER screening is to examine whether it changes observed associations between variables. As noted earlier, IER is expected to weaken associations when at least one variable’s mean is near the midpoint of the response scale and inflate correlations when both variables are further from the midpoint (Huang, Liu, et al., 2015). We examined job satisfaction and negative affectivity to test these effects. Job satisfaction generally averages above the midpoint but varies across studies. We expect IER to weaken its association with affective organizational commitment and work-family conflict. In contrast, negative affectivity tends to have a low mean. When correlated with strain and burnout—both typically below the midpoint—IER is expected to inflate these associations. Screening for IER should counteract these attenuation and inflation effects.
Searching within the 17 journals from 2012 to 2023, we initially identified 2,851 articles for job satisfaction and 1,309 for negative affectivity. Studies were included if they (1) were empirical and quantitative, (2) obtained self-report data at the individual level, and (3) reported effect sizes for the targeted relationships. Based on these criteria, we coded 81 studies for job satisfaction and 29 studies for negative affectivity. One senior author and a research assistant independently coded reliabilities and effect sizes, achieving 95% interrater agreement, with discrepancies resolved through discussion.
As shown in Table 10, IER screening resulted in a stronger, more negative association between job satisfaction and work-family conflict (b = −.19, Z = −2.58, p < .001), with similar results after correcting for unreliability. While results for organizational commitment were not significant, the positive coefficient (Model 1: b = .09, Z = 1.51, p = .13) suggests a potential strengthening effect of IER screening. As for negative affectivity, although not statistically significant, the negative coefficients for IER screening (strain: b = −.09, Z = −.77, p = .44; burnout: b = −.10, Z = −.96, p = .34) suggest that screening might have mitigated IER-induced inflation in these associations.
Meta-Analysis on the Impact of IER Screening on Bivariate Associations
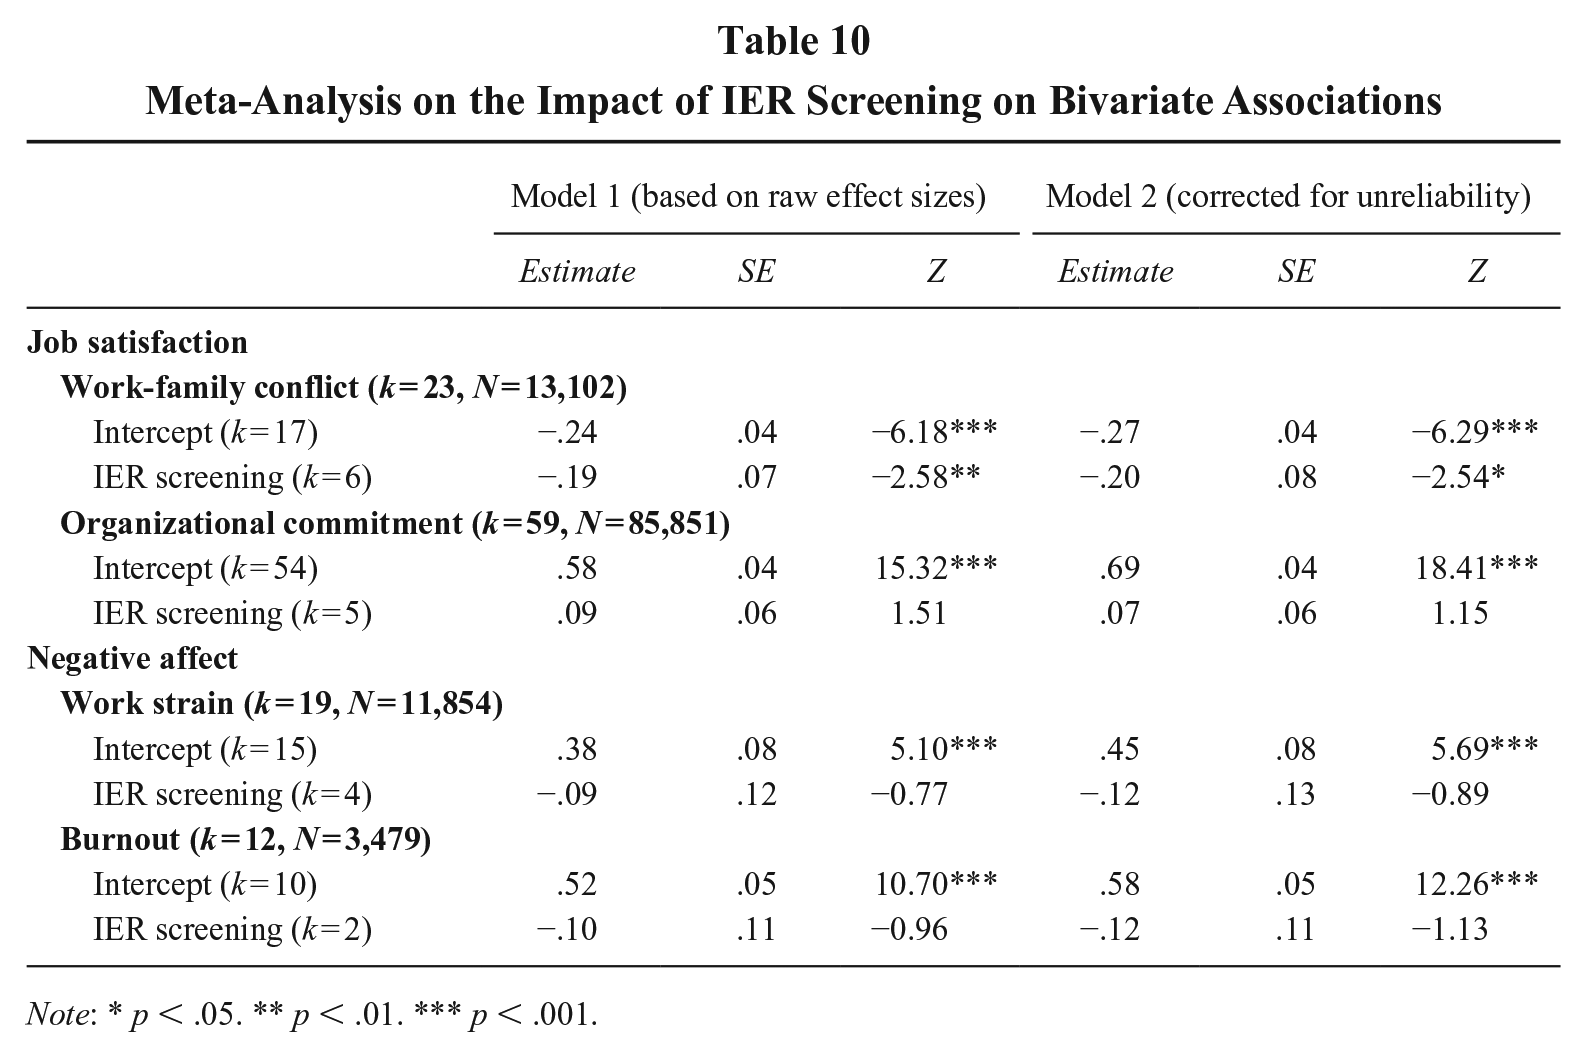
Note: * p < .05. ** p < .01. *** p < .001.
These results suggest that IER screening can meaningfully influence observed correlations, particularly for job satisfaction, where removing IER strengthened associations. Although results for negative affectivity were inconclusive, they aligned with expectations that IER screening would reduce inflated correlations.
Discussion and Recommendations
Our review above provides coverage of research practices on the detection of IER reported in leading journals in management sciences over the past decade. This is the first attempt that we are aware of to systematically review IER screening practices in leading journals in our field. In this section, we discuss the implications of our findings, offer practical recommendations for IER screening, and identify key research questions for methodologists.
Implications of Findings
The findings for RQ1 suggest that researchers’ decisions to screen for IER are influenced by study characteristics, including sample type, task type, duration, and data collection modality. At first glance, these findings might support the streetlight effect: researchers appear to search for IER more actively when it is easier or more convenient—such as in lab studies, when gathering computerized data, collecting data over multiple waves, or recruiting participants from online paid panels. This tendency might be explained by the broader array of tools available for detecting inattentiveness when utilizing experimental tasks and objective tests (e.g., manipulation checks, poor performance on objective tests) or when administering a study online (e.g., page time). However, a closer inspection of IER removal rate from RQ3 suggests otherwise: These study features had little impact, with the exception of sample type. Instead, it was the researchers’ IER-related practices, specifically employing multiple detection methods, that were associated with a higher removal rate of IER cases. These results suggest to management scholars that, when it comes to screening for IER in their data, “the harder you look, the more you find.”
Regarding study duration, multi-wave surveys were more likely to screen for IER than studies conducted in a single setting. This is particularly important, given that research has identified IER as a person-level confound that can persist over time in multi-wave and multi-source surveys (Bowling et al., 2016; Huang et al., 2024). Screening for IER in these types of studies is crucial.
Two other nonsignificant predictors of IER screening, personal consequences and in-person contact, merit further discussion. While both are continuous variables in nature, we coded them dichotomously due to practical constraints. For personal consequences, most studies categorized as having “some consequences” typically involved modest incentives, which do not equate to high-stakes settings such as hiring, promotion, or dismissal. In fact, one could argue that in these low-stakes contexts, researchers anticipated limited participant motivation and designed incentives to enhance engagement. We note that among the 319 studies with some consequences, we could identify 36 studies involving major consequences (e.g., affecting job outcomes), and only 2 of them (5.6%) reported screening for IER, removing 6% of cases. Given the small number of such cases, we opted not to create a separate category for major consequences. However, these findings tentatively suggest that researchers may have greater confidence in data validity in high-stakes contexts, where data quality also appeared higher. For in-person contact, primary studies often lacked sufficient detail to determine the extent of researcher-participant interaction, leading us to code this variable dichotomously. The lack of significant effects on IER screening might suggest that the opportunity to build rapport with participants in person did not substantially sway researchers’ confidence in data quality. This finding dovetails earlier research indicating that efforts to build rapport and generate goodwill through social exchange or social influence have not been particularly effective (Ward & Meade, 2018).
Turning to situations where researchers reported IER detection in their studies, our analysis for RQ2 revealed that the preponderance of studies utilized various forms of attention check items. The ease of use of various attention check items, especially instructed response items and infrequency items, makes them good candidates for screening the most egregious form of IER (Ward & Meade, 2023). At the same time, not all attention check items should be treated equally, as infrequency items led to the average removal of 16% of cases, relative to the 7% (instructional manipulation checks and self-report items) to 9% (instructed response items) removal rate from the other attention check items. In addition, we see a clear need to improve the reporting practices involving attention check items, because 40.3% of studies did not report the specific kind of attention check items they utilized. Given that these items are used to exclude some participants, better reporting would enhance transparency and facilitate future replication efforts.
A second insight regarding detection is that around one-fifth (20.7%) of studies utilized more than one detection approach. Our review uncovered an interesting pattern: Researchers who use attention check items tend to rely on them exclusively, whereas those who use other detection methods tend to combine them with one or more additional approaches. This pattern might reflect the relative ease of using attention check items: Researchers may embed them as a straightforward safeguard against IER, while other methods require time and effort to design and implement. Researchers might also place greater confidence in attention check items due to their clear-cut interpretation (“right” versus “wrong”), which can be less challenging to justify compared to other approaches.
Most surprisingly, our findings for RQ3 revealed considerable variability in how cutoffs were created, aside from the fact that the information is reported sporadically. Focusing on studies that utilized attention check items, we found that 48.3% screened out participants after missing just one attention check item. This approach is consistent with the argument made by Bagby, Gillis, and Rogers (1991: 286) that a single incorrect response to items “patently absurd in content” should justify flagging. However, psychometricians (e.g., Cronbach, 1949; Gorsuch, 1997; Nunnally, 1978) have long recognized that individual items are susceptible to measurement error. As such, “failing” a single attention check item could result from normal response behaviors, such as finding a statement confusing or humorous (Huang et al., 2012; Meade & Craig, 2012; Niessen, Meijer, & Tendeiro, 2016). For example, a meticulous person might self-report that they did not pay full attention despite carefully reading and responding; or a well-intentioned respondent might interpret an infrequency item idiosyncratically, selecting an option others would not endorse; or a first-time research survey taker might view an instruction to select a specific response option as a personality test rather than an attention check. Removing participants for missing a single attention check item could inadvertently exclude attentive participants and restrict the range of individual differences in the final sample. In other words, adopting such a stringent cutoff might cause the sample to deviate from the intended population of interest.
Meanwhile, the reliance on a single attention check item, which is the case for about half of the studies utilizing attention check items, raises concerns that a significant proportion of IER participants might pass the check purely by chance. That is, a participant responding completely at random would be expected to pass an instructed response item on a 5-point scale one-fifth of the time, and the expected pass rate on an infrequency item or self-report response item could be two or three times higher, depending on how many response options are considered correct. This suggests that relying on a single attention check item may not be sufficient to reliably detect IER.
Our findings on best practice recommendations from RQ4 revealed two challenges researchers face when designing a study: (a) some of the recommendations are not entirely compatible with others; and (b) some critical information is rarely reported in the literature. These challenges highlight the complexity of balancing methodological rigor with practical constraints. For instance, the need for multiple attention check items might conflict with the goal of maintaining participant engagement, leading to a potential trade-off between thorough IER detection and participant fatigue. Moreover, the lack of consistent reporting on key aspects such as the specific cutoff criteria or the exact methods used for IER detection makes it difficult for other researchers to replicate studies or assess the validity of the findings. Addressing these challenges will require greater transparency in reporting and careful consideration of how to implement best practices in a way that is both feasible and effective.
As for RQ5, despite challenges in assessing the impact, our triangulation efforts produced surprisingly consistent results across methods. IER removal generally improved reliability and model fit, though effects varied widely across measures and studies. The impact on bivariate associations appeared to depend on variable means. While IER screening strengthened the job satisfaction–work-family conflict link, effects on other relationships were not significant. Notably, researchers rarely reported changes in hypothesis support, suggesting that while IER affects measurement properties, its impact on substantive conclusions may be limited. We caution scholars not to take the presence or absence of changes in reliability, associations, or hypothesis support as the justification for IER removal. As we have noted above, the threat of IER on study results is oftentimes unpredictable, and the primary goal of screening is not to alter outcomes but to ensure data integrity and the rigor of statistical inferences.
Practical Recommendations
Considering the discussion on attention check items above, we recommend that researchers embed at least three attention check items at different places in their surveys, adding more items for longer surveys. This approach allows researchers to strike a balance between ensuring thorough IER detection and minimizing respondent fatigue. Given the inferior performance of instructed response items and self-report items (Huang et al., 2012), we encourage researchers to prioritize using well-validated infrequency items and instructional manipulation checks, while avoiding the use of instructed response and self-report items. Regardless of the type of attention check items used, researchers should consider informing participants of the presence of these items in advance, as such communication would result in more favorable reactions to the survey (Huang, Bowling, et al., 2015). We also propose the use of a lenient cutoff for IER, such as failing two out of three attention check items. Our position is consistent with earlier calls (e.g., Huang et al., 2012; Ward & Meade, 2023) to screen out the more egregious forms of IER, as they pose the greatest threat to research validity (Huang & DeSimone, 2021). However, this approach inherently means that some participants engaging in IER may not be detected and removed. We encourage researchers to justify the use of a stricter cutoff when warranted by their study context.
The limitations of attention check items make it important for researchers to consider adding other detection approaches feasible for the design of a given study. For studies conducted online, researchers may find page time as an unobtrusive supplemental detection tool. As Bowling et al. (2023) demonstrated, measuring response time on each page of a multi-page survey enabled a fine-grained assessment of IER behavior that would be obscured in overall survey time. Thus, page time can be particularly useful when IER occurs in part of a longer study. For instance, in an online vignette study, a respondent may answer self-referent survey items as expected but then speed through the vignette without cognitive processing. This IER behavior may go undetected by attention check items, but page time on the vignette will call into question the quality of their response. This is consistent with Ward and Meade’s (2023) recommendations for three levels of screening for IER (i.e., minimal, moderate, and extensive) that all include page time and attention check items as a priori screening approaches.
Our findings suggest that checking the response pattern was the most commonly used post hoc method to detect IER. Considering the potential limitations of the response pattern approach (Goldammer et al., 2020), researchers may consider the use of response inconsistency indicators and multivariate outlier detection as alternative post hoc methods, particularly for longer surveys and archival datasets with a large number of items.
Considering the varied ways in which IER screening practices are reported—or sometimes not reported—in the management literature, we call for a consistent and transparent reporting process in our field. Our recommendation considers the guidelines for Transparency and Openness Promotion (TOP) from OSF. At a minimum, researchers should describe the IER approaches they adopt and provide the necessary details about the study design that justify the use of these approaches. They should also describe and justify the cutoffs used for screening IER. The report should include the number and percentage of participants removed from the analysis. These details should be included in the methods section or published in online supplemental materials (Ward & Meade, 2023).
In Figure 3, we present a flowchart designed to assist with study design and to standardize IER reporting in our literature. The flowchart places the onus on researchers to provide additional explanations for decisions that deviate from common guidelines but may be appropriate for their specific study context. We encourage authors, reviewers, and editors to consult the flowchart as a tool to evaluate the appropriateness of a manuscript’s IER practices.
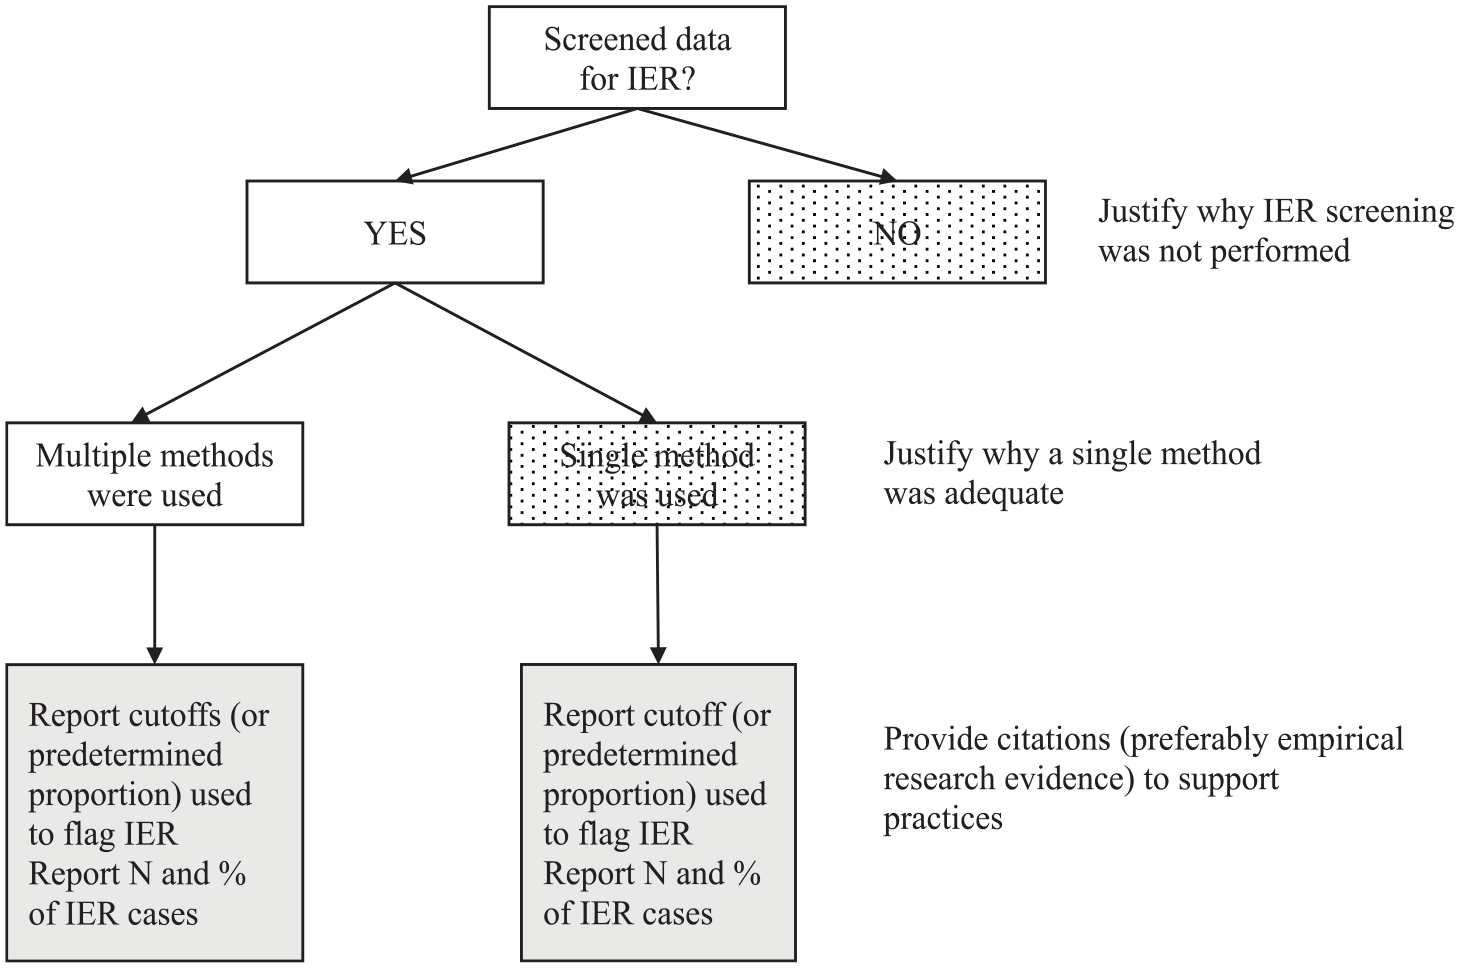
IER Design Submission Flowchart
Finally, we echo the earlier suggestion (Bowling et al., 2016; McGonagle et al., 2016) to not just incentivize study completion, but also incentivize attentive study completion. For instance, if employees feel obliged to complete a survey due to pressure from their organizations or supervisors, they may resort to completing the survey without much attention or effort. Incentivizing attentive responding while taking away the perceived pressure to merely respond can curb potential IER behavior from occurring.
Directions for Future Research
Our review helps identify areas where IER research can have an immediate impact on practice. First, our review points to the need for methodologists to resolve some of the inconsistencies in the guidelines offered in the literature. Despite the widely accepted recommendation to use different screening techniques, Bowling et al. (2023: 347) suggested that page time could be “effective as a stand-alone measure”. The recommended number of infrequency items varies, with some guidelines suggesting no more than three, while others indicate that more would be necessary depending on the survey context. The use of the long string index in research has become a topic of debate. A casual reader of the IER literature may find it challenging to navigate these conflicting guidelines. It is important to recognize that taking best practice recommendations at face value can lead to oversimplification, ignoring the nuances in the empirical work that informed those recommendations. Furthermore, given the rapid development of IER research in the past few years, some older guidelines may need to be refreshed and updated. Therefore, we call on methodologists to empirically address these inconsistencies and identify the specific study contexts where certain recommendations are more appropriate. Some of the key research questions may include: (a) when can page time suffice as a stand-alone measure of IER? (b) what is the optimal number of infrequency items to include per X number of survey items? and (c) under what circumstances can the long string index outperform intraindividual variability in detecting straightlining?
Second, our review underscores the need for methodologists to develop clearer guidelines for setting cutoffs across different detection indices. Researchers who use IER detection methods often have limited guidance on how to effectively remove IER cases. While most existing guidelines agree that an a priori cutoff is desirable, they offer little direction on how to establish the cutoffs. An alternative approach, removing IER cases based on a predetermined percentage (e.g., 10%) or a sample-specific cutoff (e.g., three standard deviations above the mean on intraindividual response variability), is far less optimal in our opinion because the base rate of IER can vary significantly from study to study. Although our review found that studies remove around 10% IER cases on average, 5 the reality is that IER occurrence rates differ, and using a predetermined percentage could lead to over-detection in some cases and under-detection in others. We believe that a uniform and replicable approach to determining cutoffs would greatly facilitate comparison across different studies. To achieve this, we call for empirical (e.g., Bowling et al., 2023), experimental (e.g., Huang et al., 2012), and simulation (e.g., Meade & Craig, 2012) studies to guide the development of appropriate cutoffs for each index.
Methodologists can also investigate the optimal use of detection mechanisms as a real-time intervention that reduces IER from occurring in the first place rather than screening individuals after data collection. Attention check items, page time, and response pattern can be utilized to remind participants to maintain response effort. For instance, when a participant fails an attention check item, speeds through a survey page, or produces a straight line of responses, the study website may display a warning for him/her to remain attentive throughout the survey. Analogous to mid-test warning to reduce faking (Li et al., 2022), the real-time monitoring and warning of IER behavior may be a promising avenue in future studies.
Another topic for methodologists to address is the nomological network surrounding IER behavior. Although initial research suggests that five-factor personality traits (Bowling et al., 2016; Huang et al., 2024), malevolent traits (e.g., psychopathy, Machiavellianism; see McKay, Garcia, Clapper, & Shultz, 2018) as well as implicit aggression (DeSimone et al., 2020) may be related to IER behavior, other potential predictors, such as impulsivity, attention control, and need for approval, have yet to be examined. Furthermore, like behaviors in general, IER is likely the outcome of trait-by-situation interaction (see Endler & Magnusson, 1976). This means that researchers need to understand how individual differences interact with situational features to produce IER. For instance, while warnings have been introduced as an intervention to reduce IER, it is still unknown whether the effectiveness of warnings depends on respondents’ individual differences, such as avoidance goal orientation. This area of research is crucial for designing more effective interventions.
To address the nomological network of IER behavior, researchers may first need to reconcile the different measurements of IER. While the underlying IER construct can be conceptualized as a continuum, the measurement of IER varies across indices. That is, each detection index tends to focus on specific aspects of IER behavior. For example, page time captures rapid responding, response pattern analysis typically targets straightlining, and infrequency items aim to identify a lack of cognitive processing on specific items. These indices are only expected to converge when some participants engage in egregious forms of IER. Otherwise, the correlation between indices may be modest or weak, as individuals who rush through a survey might not necessarily use a straightlining approach, and frequent careless responses detectable by attention check items may not always coincide with speeding through the survey. More methodological research is needed to understand the situations under which different IER indices converge and to provide a clearer picture of how to measure IER consistently across studies.
Finally, as the reporting of IER screening becomes more prevalent, scholars may begin to reassess some of the meta-analytic associations established in the literature. Huang, Liu, et al. (2015) demonstrated that IER can inflate or attenuate observed association between two substantive variables, depending on each variable’s mean on its response scale. Specifically, for variables with means far from the midpoint of the response scale, the inclusion of IER tends to inflate observed associations. Conversely, for variables with means closer to the midpoint, IER inclusion can attenuate the associations. Consider as an example the association between abusive supervision and CWB (Mackey, Frieder, Brees, & Martinko, 2017). Both variables typically have means below the midpoints of their response scales, meaning that if a study includes IER cases, the observed association between these two variables is likely inflated. Therefore, we can expect studies that excluded IER cases to find a weaker association between these two variables, compared to studies that do not screen for IER. Conversely, for variables with means near the midpoints of their response scales, the inclusion of IER would likely lead to attenuation, and studies that screen for IER would show stronger associations. By using IER screening as a moderator, researchers can expect meta-analytic estimates that are closer to the true population value. In addition, methodologists may explore the possibility of modeling IER screening as a study-level weight in meta-analyses, further refining the accuracy of these estimates.
Conclusion
Through an extensive review of IER practices reported in empirical studies published in key management journals, this paper illuminates the diverse approaches adopted to address IER in the literature, emphasizing the pivotal role of study characteristics such as sample type, task nature, and data collection methods in shaping IER screening practices. The findings highlight the complexity of detecting IER, especially in the context of evolving research methodologies and the growing reliance on computerized and online platforms. This comprehensive analysis highlights the critical need for standardized IER screening practices and calls for further research to refine and enhance the efficacy of these measures, thereby ensuring the integrity and reliability of research outcomes in management studies.
Footnotes
Appendix
Journals Included in This Review and Summary Statistics
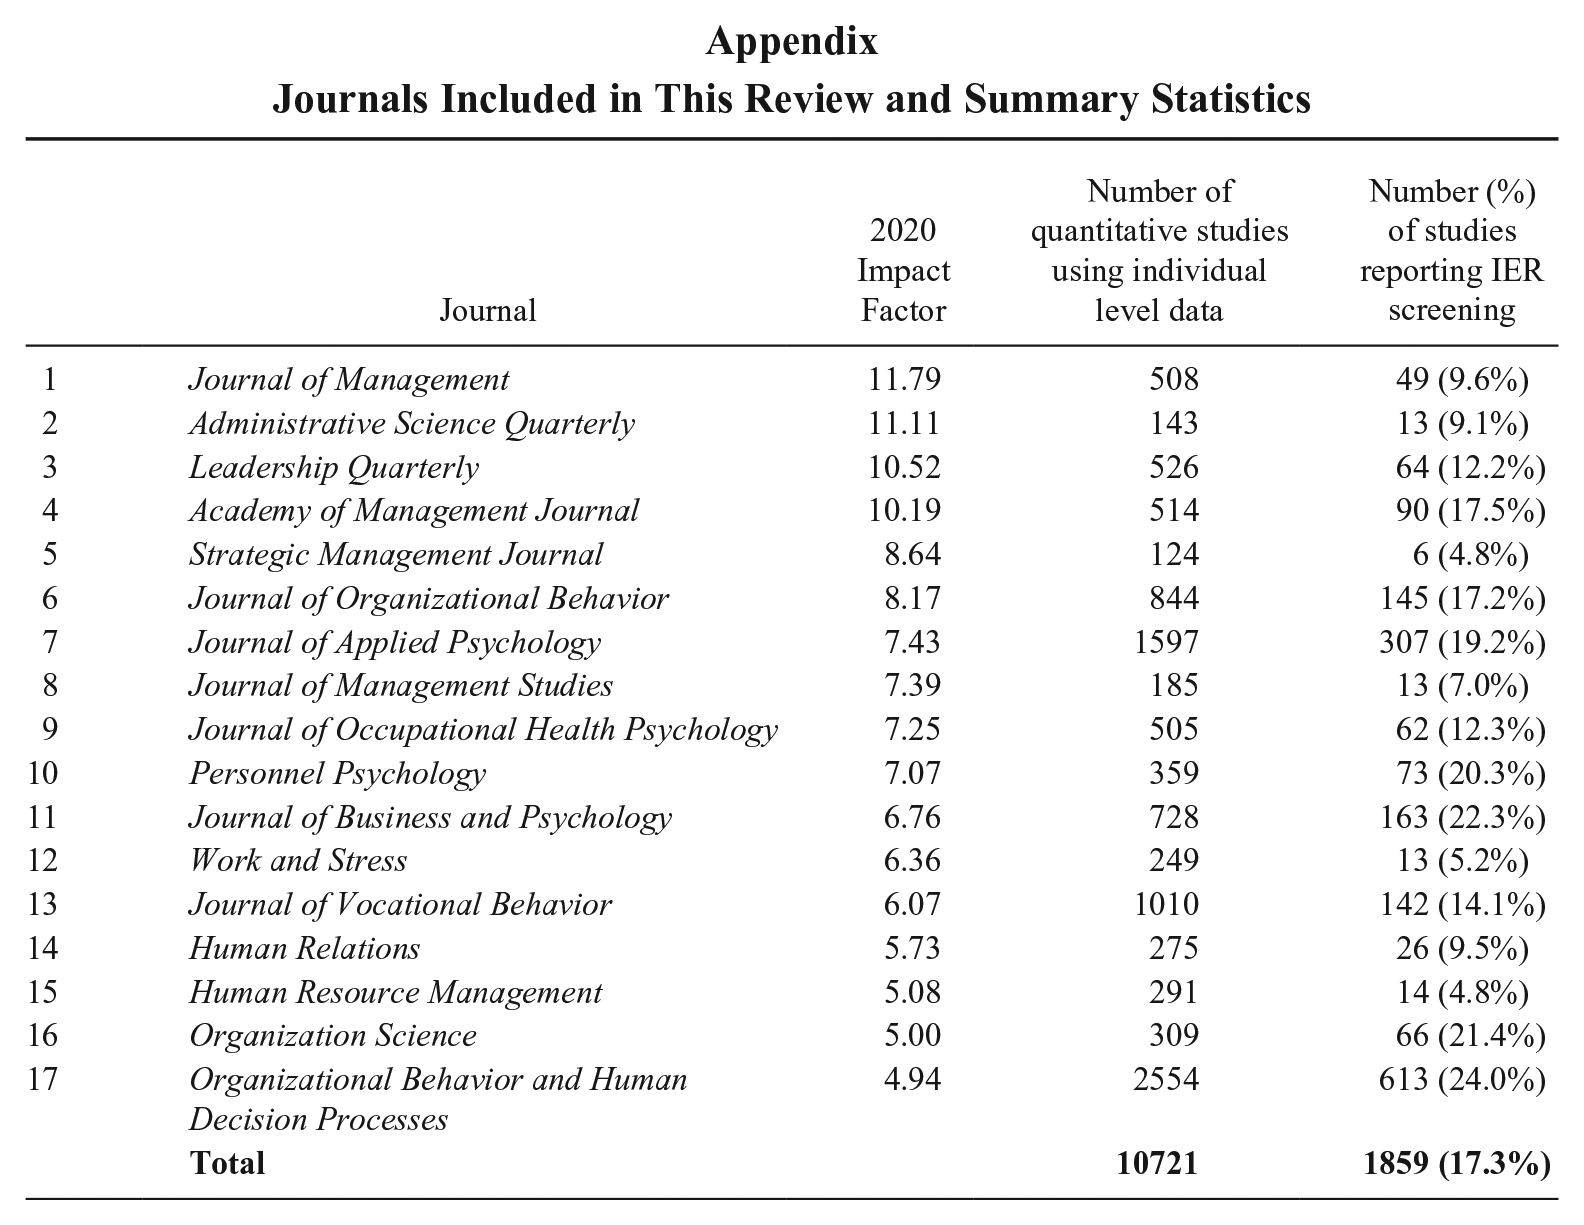
| Journal | 2020 Impact Factor | Number of quantitative studies |
Number (%) of studies reporting IER screening | |
|---|---|---|---|---|
| 1 | Journal of Management | 11.79 | 508 | 49 (9.6%) |
| 2 | Administrative Science Quarterly | 11.11 | 143 | 13 (9.1%) |
| 3 | Leadership Quarterly | 10.52 | 526 | 64 (12.2%) |
| 4 | Academy of Management Journal | 10.19 | 514 | 90 (17.5%) |
| 5 | Strategic Management Journal | 8.64 | 124 | 6 (4.8%) |
| 6 | Journal of Organizational Behavior | 8.17 | 844 | 145 (17.2%) |
| 7 | Journal of Applied Psychology | 7.43 | 1597 | 307 (19.2%) |
| 8 | Journal of Management Studies | 7.39 | 185 | 13 (7.0%) |
| 9 | Journal of Occupational Health Psychology | 7.25 | 505 | 62 (12.3%) |
| 10 | Personnel Psychology | 7.07 | 359 | 73 (20.3%) |
| 11 | Journal of Business and Psychology | 6.76 | 728 | 163 (22.3%) |
| 12 | Work and Stress | 6.36 | 249 | 13 (5.2%) |
| 13 | Journal of Vocational Behavior | 6.07 | 1010 | 142 (14.1%) |
| 14 | Human Relations | 5.73 | 275 | 26 (9.5%) |
| 15 | Human Resource Management | 5.08 | 291 | 14 (4.8%) |
| 16 | Organization Science | 5.00 | 309 | 66 (21.4%) |
| 17 | Organizational Behavior and Human Decision Processes | 4.94 | 2554 | 613 (24.0%) |
|
|
|
|
Acknowledgements
This research was supported by the Research Enrichment Fund from the School of Human Resources and Labor Relations at Michigan State University, awarded to Jason Huang, and by the National Natural Science Foundation of China (Grant No. 72202041), awarded to Dongyuan Wu.