
Abstract
While the property right theory has gained prominence in contemporary literature, there is a notable lack of empirical research into its relevance. This study delves into the implications of the property right theory concerning family-owned businesses and their impact on productivity. Specifically, we explore how family firms’ characteristics affect the benefits and hazards derived from the rights to utilize, appropriate, and transfer firm resources, influencing the production process and, more specifically, the levels and growth of a firm’s productivity. Based on an extensive dataset of European firms, our findings indicate that family-owned businesses tend to prioritize labor over capital in their production processes when compared with nonfamily firms. Moreover, the distinctive decisions regarding the production process lead to consistently lower levels of productivity in family firms. However, we also uncover that when family firms share with non–family members management and ownership control, they are less labor intensive and achieve higher productivity and productivity growth. This suggests that certain ownership and control structures can help family firms overcome the productivity gap with nonfamily firms. Overall, our findings support the ideas from recent developments in property rights theory, considering the unique characteristics of family-owned businesses. Our study contributes to strategy research on family firms and corporate governance.
The unique ownership and control structure in family firms grants the family owner-managers the authority, the rights, and the incentives to create value in a different manner than nonfamily firms. The question is whether these differences also bring advantages to family firms to produce more efficiently. Research comparing production processes and productivity in family and nonfamily firms reaches inconclusive and often noncomparable findings as well as lacks a clear theoretical foundation to explain differences. 1 These mixed empirical results may be due to various factors, including different approaches to studying the production process and productivity, focusing on different segments of the production process, and influences from diverse institutional contexts and from idiosyncratic firm characteristics not captured by small, single-country samples.
Our study seeks to advance theoretical insights and empirically test our predictions by addressing the quintessential strategic governance question of whether and how family firms use resources in the production process compared with nonfamily firms. We also analyze how the different combinations of ownership and managerial control within family firms impact firm productivity. How firms organize their production process and obtain increments of production with the same inputs is not only a relevant determinant of firms’ financial performance but a key element to explain firm economic growth as well as the growth of the national economies where these firms operate.
We draw on property rights theory (PRT; Foss, Klein, Lien, Zellweger, & Zegner, 2020; Kim & Mahoney, 2002, 2010) to build our arguments. PRT is an ideal conceptual framework, as it refers to the possession of residual rights of control that, in our context, are allocated to family owners. PRT defines ownership with three types of control that owners can exert: the right to use the resources, the appropriation right, and the right to transfer firm resources. The combination of the residual rights from these three types of control brings to the owners, according to Schulze and Zellweger (2021), the authority, the rights, and the incentives to facilitate the creation of economic value. PRT offers compelling arguments for predicting production process decisions, particularly in terms of the choice between the more intensive use of labor and capital. It also provides insights into the expected consequences of strategic decisions on firm productivity and the implications of concentrating control as opposed to sharing control over the utilization, appropriation, and transfer of the firm’s resources.
Research comparing financial performance between family and nonfamily firms, either using accounting (e.g., return on assets [ROA]) or financial market (e.g., Tobin’s Q) indicators are equally inconclusive. Instead of these measures, our study centers its attention on the production function and productivity. Factors of production, from the Coasian perspective, are taken not as physical objects but rather as a “circumscribed list of rights to perform certain actions” (Foss & Foss, 2022: 172). This approach takes companies as collections of assets where managers identify and define property rights, thereby increasing production value. Productivity measures capture the output generated above the standard output achieved by the typical utilization of inputs in the industry.
Family firms are characterized by being long-term oriented, thanks to their right to transfer resources to heirs, and are risk averse, focused on maintaining the wealth within the family (Gómez-Mejia, Haynes, Núñez-Nickel, Jacobson, & Moyano-Fuente, 2007). We combine these family traits to hypothesize the reliance of family firms on labor over capital. Ownership by large family owners does not pose the same hazards to employees as nonfamily firms when exercising their property rights over appropriation and transfer of firm resources. Their long-term orientation aims to transfer wealth and control to future generations, encouraging a commitment to rewarding employees for their investments in firm-specific human capital, granting them a competitive edge in labor management compared with nonfamily firms. Additionally, the family property right to use resources will limit their capital investments that may risk family control (e.g., larger debt or new shareholders), based on the documented family risk aversion. Given the higher relevance of capital over labor explaining firm productivity, conservative decisions on the production process with limited capital lead to lower expected levels of productivity and productivity growth compared with nonfamily firms.
Finally, within family firms, we predict that shared control with non–family members will drive differences in the production process and productivity. Specifically, we claim that family firms sharing control may alter the hazards derived from their property rights, where long-term orientation and risk aversion can be less constrictive, relying more on capital in their inputs combination and investing more in improvements of the production process, which generates higher productivity.
Productivity has proven to be a relevant competitive factor (Foster, Haltiwanger, & Syverson, 2008). It allows us to analyze the impact of different ownership, control, and management structures over the production process without the distortion of financial performance measures, which typically depend on other factors than decisions about the combination of inputs. For instance, firms with strong market power (i.e., monopolist) can achieve high levels of financial performance due to the prices and yet show low productivity due to an inefficient use of resources. Conversely, there is evidence that productivity is a relevant determinant of firm performance (Palia & Lichtenberg, 1999) and firm survival (Griliches & Regev, 1995). Clearly, understanding how to combine capital and labor resources in the production of goods and services in an efficient manner is relevant for organizations with a long-term focus, such as family-owned businesses whose main goal is to transfer the ownership and control rights of the business to future generations.
We test our hypotheses on a large sample of European firms where we incorporate novel econometric techniques (Garicano, Lelarge, & Van Reenen, 2016; Gopinath, Kalemli-Özcan, Karabarbounis, & Villegas-Sanchez, 2017) for isolating the contribution of the different inputs into the production process and measuring firm productivity. In addition, our large-scale sample (with close to 600,000 firm-year observations) accurately representing the population of companies in five European countries—France, Germany, Italy, Spain, and the United Kingdom—allows us to overcome the limitations of former studies relying on surveys with small observations or single-country studies (e.g., Barth, Gulbrandsen, and Schoøne [2005], with 438 firms, or Cucculelli, Mannarino, Pupo, and Ricotta [2014], with 2,920 firms). Thus, our findings can be generalized to different institutional environments and to firms with different characteristics.
Our empirical strategy consists of, first, analyzing whether there are differences between family and nonfamily firms in how they combine inputs of production (labor and capital) and, second, examining whether family firms exhibit distinct levels of productivity, specifically in terms of total factor productivity (TFP) and productivity growth, when compared with nonfamily firms. Finally, within our large sample of family firms, we also investigate how different combinations of ownership and control rights—that is, sharing both ownership and managerial control with non–family members and hence sharing the rights to use, appropriate, and transfer firm resources—has an impact on the production processes and productivity.
Our results show a higher (lower) relevance of labor (capital) in the production process of family firms compared with nonfamily firms, which provides direct evidence of a different use of inputs in the production process. We also uncover that productivity and productivity growth are lower in family firms compared with nonfamily firms. Within family firms, our findings indicate that firms where the family shares control rights with non–family members tend to use capital more intensively and obtain higher levels of productivity and productivity growth. Notably, the ownership and control rights “sharing” effect is further amplified when family members serve in leadership roles within the firm (as opposed to non–family members), such as the CEO role or the chair of the board of directors. Therefore, our findings show important avenues for the improvement of the production process and productivity within family firms.
Our study makes several conceptual and empirical contributions to research on strategy, corporate governance, and family business. First, we expand the boundaries of PRT, originally developed within the dyad owner-manager context, to the domain of different family ownership rights. We assess the effectiveness of the governance mechanisms proposed by Schulze and Zellweger (2021) in mitigating the negative effect of control hazards from the inherent self-incentivizing nature of property rights. Second, we contribute to the rich strategic literature on the production function and productivity (e.g., Agarwal & Gort, 2002) by offering an analysis of the relevance of different inputs in the production function as well as conducting the first simultaneous analysis of both the productivity level and the productivity growth. Third, we amplify the literature on TFP (e.g., Levinsohn & Petrin, 2003; Olley & Pakes, 1996) by showing significant differences in the productivity associated with the influence of owners on relevant decisions affecting the production process. Last, by leveraging PRT arguments and analyzing a representative large, cross-country sample, we make a significant contribution to the family business literature. Our work provides both theoretical fundamentals and empirical evidence that help resolve the inconclusive literature on family firm productivity.
Family Firms, Productivity, and Property Rights
The production function of a firm captures the relationship between the input resources it employs, such as labor and capital, and the resulting output. This relationship is shaped by the available inputs and opportunities to combine them, which dictates how efficiently labor and capital can be combined to generate output. The firm’s efficiency in utilizing these inputs during the production process is known as total factor productivity (TFP). Productivity gains (hence TFP gains) are the increases in firm production that do not require further labor or capital investments. Productivity gains can greatly enhance firm profitability by getting the most from existing resources. Firms achieve different levels of efficiency in their combination of inputs, which leads to disparities in productivity among them. These disparities depend on decisions regarding differences in the quality of inputs, technological innovation, the adoption of advanced equipment, and differences in management practices, among other factors (Syverson, 2011). Owners’ abilities (Foss et al., 2020), in addition to managerial talent (Bloom & Van Reenen, 2007), are relevant to the firms’ decision-making process—decisions affecting the production process and, ultimately, firms’ productivity.
PRT, and specifically the owner-management approach by Schulze and Zellweger (2021), allows us to conceptualize family firms’ decisions on the production process, based on the residual rights of control of the family owners, and their impact on productivity. The family owners’ rights of control refer to the rights to use firm’s resources, to appropriate them, and finally, to transfer them to future generations. The exercise of these rights can confer both benefits and hazards upon family firms and influence how family firms make production-related choices and in turn their levels of productivity.
Schulze and Zellweger (2021) identify benefits and hazards linked with each of the three property rights within owner-managed firms where owners need the collaboration of other agents—for example, employees—to implement their strategies for value creation. We expand their model to family firms. These rights are as follows: (a) The right to use resources empowers family-owners to determine the allocation and utilization of resources within the firm, including the selection of resources and the manner in which they are employed. However, this right also generates the hazard of reducing the reliability on owners who might use resources considering only their objectives, without incorporating the objectives of relevant nonfamily agents for value creation. (b) The right to appropriate benefits obtained from the resources generates incentives for the family-owners to invest in the firm, yet it also generates the hazard of owners’ egocentrism, reducing the incentives of other relevant nonfamily agents to invest in the firm (e.g., in firm-specific human capital). (c) The right to transfer resources triggers the benefit of the family-owner’s long-term commitment to the firm, which incentivizes nonfamily agents to invest in the firm, in assets such as human capital specific investments. The succession hazards are lower in family firms due to the lower concerns about firm continuity.
Our approach takes the two main characteristics of family firms, long-term orientation and risk aversion, which result in significant differences in the exercise of ownership rights. These differences may give rise to the hazards in decisions affecting the production process and overall productivity relative to how rights are exercised among nonfamily firms.
Salient Inputs in the Production Process
We argue that family ownership control over resources tends to rely less on capital investments and more on labor. The right of family owners to use firm resources allows them to strategically leverage their autonomy in pursuing their unique entrepreneurial attitudes (Bjørnskov & Foss, 2013; De Massis, Eddleston, & Rovelli, 2021). However, family owners’ use right might also lead to prioritizing self-interests, as shown in Connelly, Hoskisson, Tihanyi, and Certo (2010), and exercising discretionary appropriation rights by pursuing their objectives (Gómez-Mejia et al., 2007).
Moreover, the right to transfer resources to the next generation equips family firms with a long-term perspective focused on maintaining family control, which leads family firms to carry lower financial leverage, preferring internally generated resources compared with nonfamily firms (Anderson & Reeb, 2003; Masulis, Pham, & Zein, 2020; Michiels & Molly, 2017; Villalonga & Amit, 2006). In addition, we know that family firms are less willing to risk future cash flows with debt due to the lack of family wealth diversification (Fang, Memili, Chrisman, & Tang, 2021; Michiels & Molly, 2017). The family risk aversion tied to physical capital investments can trigger underinvestment, as discussed in prior studies (Agrawal & Nagarajan, 1990; Gómez-Mejía et al., 2007; Lins, Volpin, & Wagner, 2013; Zahra, 2005). In light of family firms’ long-term conservative behavior, driven by the desire to safeguard their socioemotional wealth for future generations, family firms are more likely to forgo entrepreneurial opportunities when compared with their nonfamily counterparts (De Massis et al., 2021). These arguments suggest that family firms are inclined to exhibit lower capital intensity relative to nonfamily firms.
Additionally, the long-term orientation, facilitated by the right to transfer the firm ownership to the heirs, limits the hazards of the right to appropriate the benefits generated, promoting reinvestment in the company to secure its survival and the legacy. This long-term orientation creates incentives for employees to make firm-specific investments—that is, in human capital—as these investments typically arise from informal agreements between employees and owners (Klein, Mahoney, McGahan, & Pitelis, 2012; Mahoney & Kor, 2015). This facilitates the management of labor in family firms. Indeed, empirical evidence uncovers that labor management practices of family firms generate a competitive advantage (Barney, 1991, 2021). Additionally, family firms benefit from fostering a stronger stewardship climate (Neubaum, Thomas, Dibrell, & Craig, 2017) and from promoting reciprocal altruism (Eddleston, Kellermanns, & Sarathy, 2008).
We argue that labor inputs in family firms tend to be cheaper and better motivated compared with those in nonfamily firms. In fact, there is evidence of lower labor costs due to lower compensation, limited employee training, and lower turnover policies in family firms (Neckebrouck, Schulze, & Zellweger, 2018) and higher levels of employee satisfaction, more motivation, and ultimately, better labor performance (Bammens, Notelaers, & Van Gils, 2015; Duran, Kammerlander, van Essen, & Zellweger, 2016). Given these arguments, we hypothesize that the contribution of labor to the output in family firms will be higher than capital investment, compared with nonfamily firms.
Hypothesis 1: Family firms use labor over capital more intensively compared with nonfamily firms.
Productivity in Comparative Perspective
We seek to understand how families exert their control rights in relevant aspects of the production process and whether this generates differences in productivity compared with nonfamily firms. Family owners’ right to use firm resources, within a framework lacking capital market oversight, grants them discretionary authority to pursue valuable strategic advantages. However, when capital markets or internal controls fail to impose constraints on the exercise of property rights, inefficiencies can emerge. In light of this trade-off, and considering the unique attributes of family firms (i.e., long-term orientation and risk aversion), their choices have the potential to yield productivity levels that diverge from those observed in nonfamily firms. The right to use resources allows family firms to focus on conservative strategies circumventing risky capital investments and modifications in the production process, consistent with their risk aversion. Entrepreneurial and managerial attitudes, innovation, and growth opportunities are affected by family firms’ conservative strategy approach. The integration of labor and capital within a given technological setting is what shapes a company’s production process.
In the integration of labor and capital for enhanced productivity and property rights assignment, contrasting dynamics unfold between family and nonfamily enterprises. On the side of labor, family firms exhibit a notable advantage in managing their labor force, fostering productivity through their inherent propensity toward familial cohesion. Conversely, when it comes to capital, family firms’ risk-averse nature translates into lower capital intensity, thereby constraining productivity compared with nonfamily counterparts. However, empirical findings support that productivity growth can be mainly attributed to the adoption of capital-intensive structures in the production process as opposed to labor contribution (Biesebroeck, 2003) and to investments in information technologies (Jorgenson, Ho, & Stiroh, 2008). We discuss how these two inputs contribute in a different way in both family and nonfamily firms to the production process and their expected impact on productivity.
In terms of labor, with the lower hazards for employees derived from the appropriation and transfer rights, family firms promote a climate of stewardship, reciprocal altruism, and employee-friendly policies that might contribute positively to firm productivity. When family firms effectively motivate employees and enhance their efforts compared with nonfamily firms, it might be reasonable to expect higher levels of production while keeping the workforce constant, leading to higher productivity. Applying these motivations to employee teams encourages their active engagement in informal innovation (Bammens et al., 2015), leading to the development of more efficient production methods and practices. Research suggests that appropriate human resources management practices (Kryscynski, Coff, & Campbell, 2021) could lead to human capital–based competitive advantage.
In terms of capital, the family firms’ risk aversion, and building upon the arguments outlined in Hypothesis 1, where we articulate why family firms are expected to use lower levels of capital intensity relative to nonfamily firms, there are several explanations for how productivity and productivity growth is attained. First, empirical findings show that entrepreneurial attitudes are less influential in family-owned relative to non-family-owned enterprises (De Massis et al., 2021). This results in a reduced propensity to capitalize on opportunities that could potentially lead to alterations in the production process. Improvements in production procedures, techniques, and the adoption of innovative technologies, such as machinery and information technology, can substantially enhance a firm’s overall production capacity. Second, additional evidence suggests that family-run businesses tend to innovate with technologies of relatively lower significance compared with nonfamily businesses (Block, Miller, Jaskiewicz, & Spiegel, 2013). The innovation strategy of family firms manifests in their tendency to focus on the development of products related to their existing competency domain, rather than venturing into entirely new products that fall outside their established expertise (Cucculelli, Breton-Miller, & Miller, 2016). Supporting this notion, research also indicates that innovation within family firms tends to be incremental rather than radical (Brinkerink, 2018; König, Kammerlander, & Enders, 2013). The prevailing assumption is that R&D investments have the capacity to generate increased innovations linked with productivity growth. In this regard, Bertrand and Schoar (2006) show that family firms often exhibit reluctance and inability to allocate resources to R&D. This is attributed to their strong desire for family control, nepotism, entrenchment, and the prevalence of altruistic motivations among family members.
Third, one notable explanation is that family firms, due to their risk aversion, are less likely to take advantage of the full potential of economies of scale and scope tied to large investments requiring external finance. The pursuit of noneconomic goals can dissuade external investors, subsequently resulting in lower firm growth (Schulze, Lubatkin, Dino, & Buchholtz, 2001), thereby impacting productivity expansion. Likewise, a family firm’s reluctance to embrace changes in the production process due to their risk-aversion disposition is anticipated to yield analogous effects on productivity.
In summary, although productivity may increase in family firms because of superior labor management practices, there is evidence suggesting that labor’s influence on enhancing productivity and productivity growth is less pronounced compared to capital (Syverson, 2011). On the basis of this evidence, family owners of family firms, when exercising their control rights of use, appropriation, and transfer of resources, achieve lower productivity and productivity growth compared with nonfamily firms. Consequently, we formulate the following hypothesis:
Hypothesis 2: Family firms’ productivity (and productivity growth) is expected to be lower compared with nonfamily firms.
Family Firms Sharing Ownership and Control With Non–Family Members
Schulze and Zellweger (2021) argue that property rights generate hazards of the owner-manager for value creation (e.g., egocentrism) and propose four governance mechanisms to control and mitigate such hazards, namely, (a) “commitments to social control,” (b) the “delegation of authority to managers,” (c) “submission to hierarchy of board structures,” and (d) the “partial transfer of ownership.” These mechanisms applied to family firms modify the hazards derived from the family owners’ property rights as they entail sharing their control with other non–family members. Sharing control rights might manifest in different mechanisms, such as ownership, leadership, or decision-making. In the context of families, sharing ownership with nonfamily balances their control rights, similarly when sharing firm leadership roles (i.e., chair and CEO positions) with non–family members and sharing firm decision-making in governing and management bodies with nonfamily directors and top managers. We expect that these mechanisms of sharing control rights will influence the way the production process takes place, both in the combination of inputs and in the way the production process generates output. Nevertheless, the reduction of family control will be contingent on the potential coalitions that can be formed among the members possessing formal control rights (Ben-Shahar, Carmeli, Sulganick, & Weiss, 2023).
Family firms sharing control rights with non–family members are expected to exhibit greater similarity to nonfamily firms in terms of their input combinations (labor and capital intensity) as well as in their productivity levels and growth. Within family firms, when family owners share control, the conservative strategies to keep family control and the competitive advantage of family firms in the management of labor derived from their long-term orientation are less pronounced. The nature of hazards affecting the relative relevance of inputs change; the right to use resources reduces the hazards of avoiding debt financing and the risk of high capital investments to secure family control. Similarly, the benefits derived from the appropriation and transfer rights are now lower compared with nonfamily firms. Therefore, we expect that family firms sharing control will be more capital intensive compared with those that do not share control. Similarly, within family firms, family owners who share control rights are less reluctant to make risky capital investments and modifications of the production process. This influence is expected to achieve higher levels of productivity and experience more significant productivity growth in comparison to those who do not share control rights.
Building on these arguments, we formulate the following hypotheses:
Hypothesis 3a: When families share ownership rights with nonfamily shareholders and share control rights with non–family members, family firms’ labor intensity over capital decreases.
Hypothesis 3b: When families share ownership rights with nonfamily shareholders and share control rights with non–family members, family firms’ productivity (and productivity growth) increases.
Data and Methodology
We use ownership, governance, and financial data from Orbis for firms in the five largest European economies (France, Germany, Italy, Spain, and the United Kingdom) from 2009 to 2019. Our sample initially includes approximately 12.5 million observations from 2.16 million firms, covering a significant portion of these countries’ firm populations. In comparison to Eurostat’s 2015 data, our sample represents 2.50%, 40.87%, 60.52%, 85.33%, and 89.5% of firms with 0 to 9, 10 to 19, 20 to 49, 50 to 249, and more than 250 employees, respectively. 2 To estimate the production functions, we use 3,889,155 observations corresponding to the firms that provide information of all the inputs, outputs, and intermediate inputs. Subsequently, the final number of observations used in our baseline specifications is reduced to 571,893 because we consider only firms that report information on the identity and percentage of shares held by shareholders as well as the identity of members of the management team in order to construct variables that measure the degree of “share control.”
Descriptive Statistics
Table 1 presents the definition of the variables used in the analysis grouped into categories and the main descriptive statistics of the 571,893 observations used in the main specifications. Of the observations, 20.8% are from French firms, 15.0% from German Firms, 36.3% from Italian firms, 25.0% from Spanish firms, and 2.9% from U.K. firms.
Definition of Variables and Descriptive Statistics
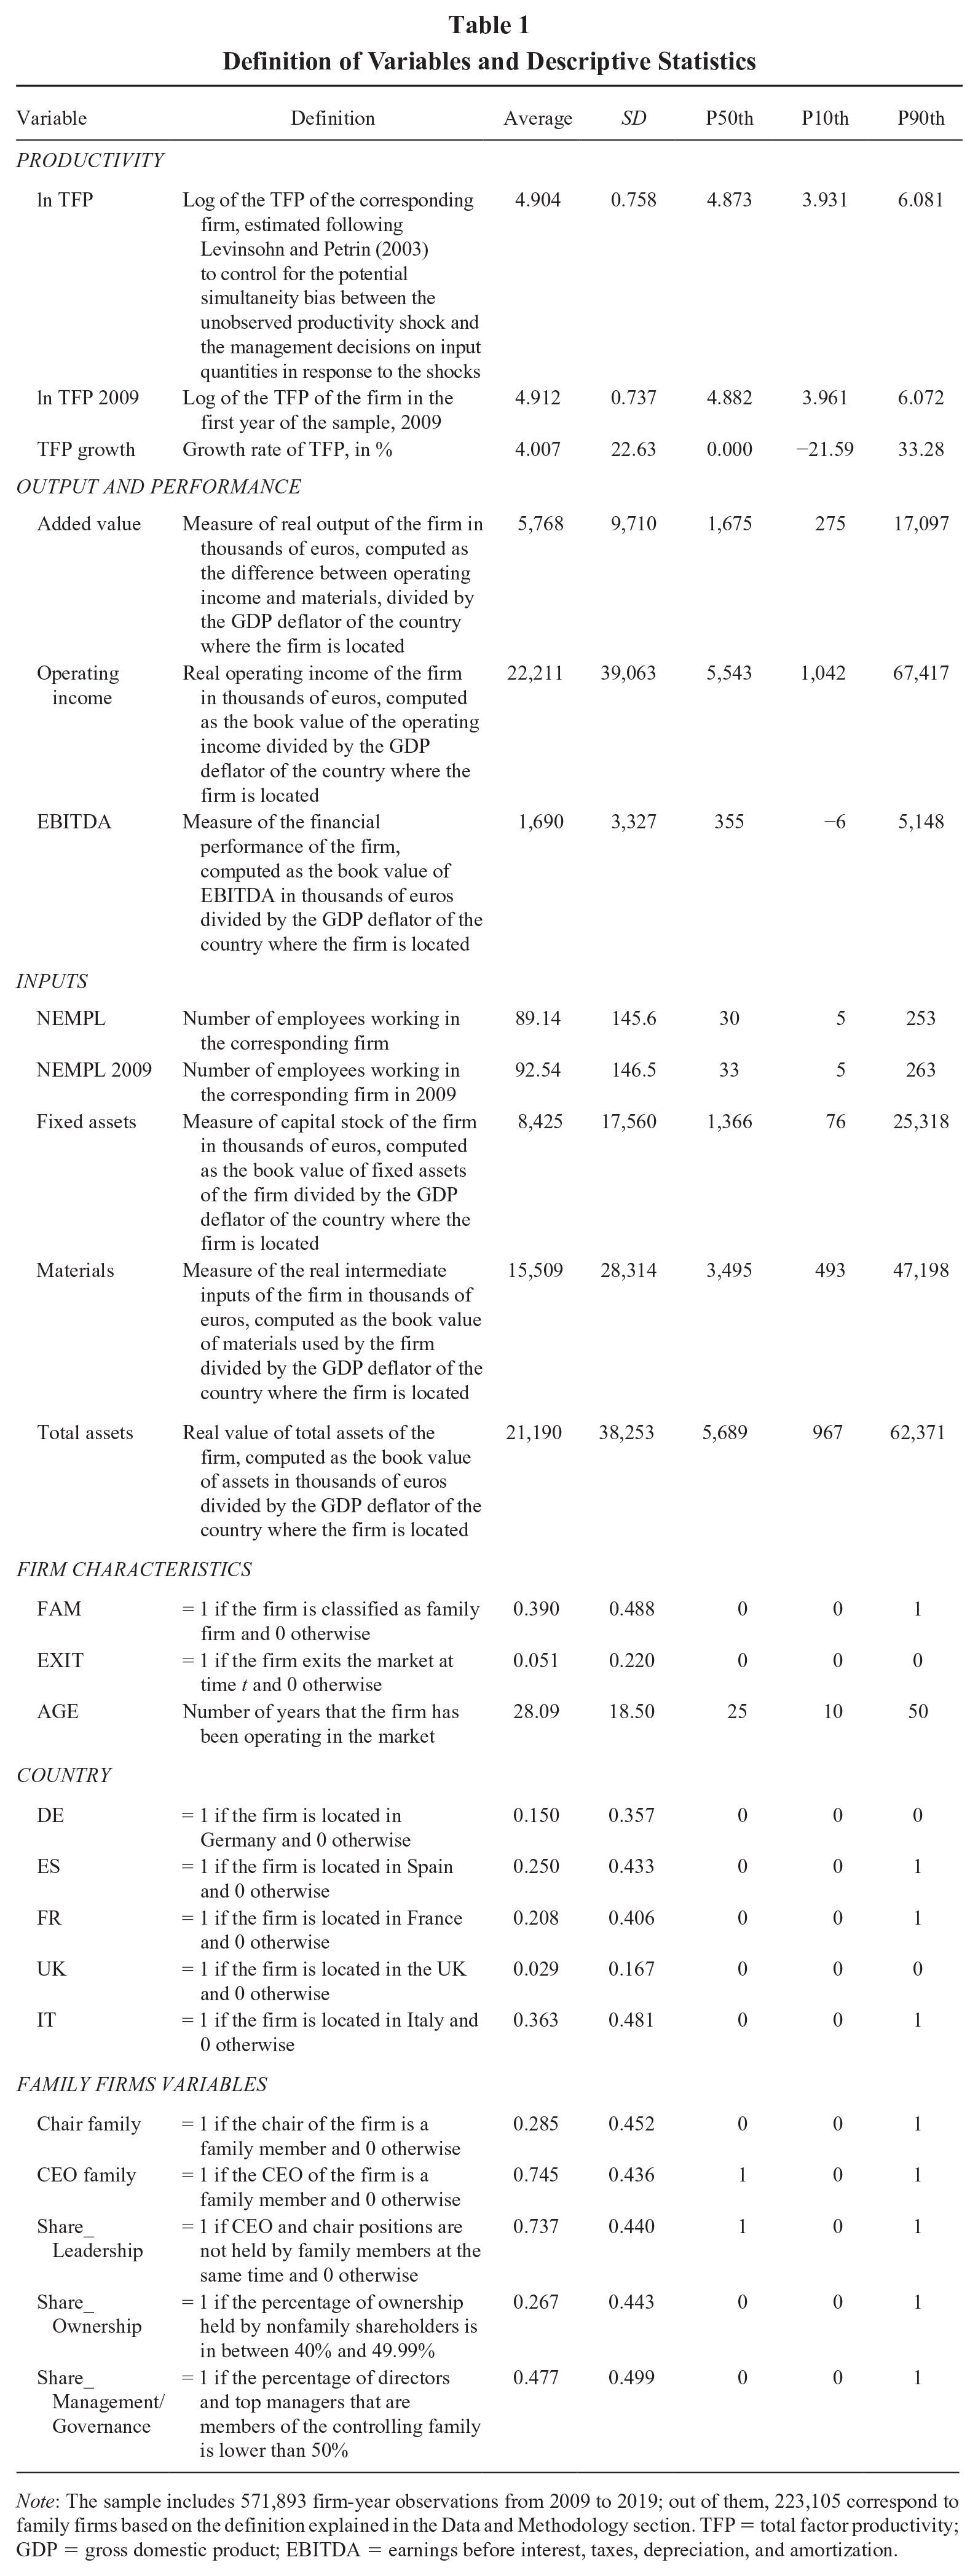
Note: The sample includes 571,893 firm-year observations from 2009 to 2019; out of them, 223,105 correspond to family firms based on the definition explained in the Data and Methodology section. TFP = total factor productivity; GDP = gross domestic product; EBITDA = earnings before interest, taxes, depreciation, and amortization.
Taking the median value as of the representative firm, there are 30 employees that produce output using a stock of capital of 45.5 thousand euros per employee and generating 55.8 thousand euros of added value per employee per year. As for firm characteristics, 39.0% are family firms, firms show an average age of 28.1 years, and 5.1% of firms exit the sample during the period of study.
Table 2 presents the average value by type of firm (i.e., family and nonfamily) and the variables of inputs and outputs. We observe that the difference of average values between family and nonfamily firms is statistically different from zero in all variables. Nonfamily firms are larger than family firms in terms of total assets, which is consistent with the expected smaller size of family firms because of their restrictions to grow. Nonfamily firms also deploy more input resources: They have an average of 120 employees compared with 40 in family firms and use 11.83 million euros of fixed assets (capital input) compared with the 3.10 million euros in family firms. As for the output, the operating income (added value) of family firms presents an average value of 8.60 (2.20) million euros compared with 30.63 (8.05) million euros of nonfamily firms. Table A1 in Appendix A shows the correlation matrix between variables, and Table B1 in Appendix B shows the relationship between productivity and firm performance.
Differences in Average Values of TFP, Inputs, and Outputs, by Type of Firm
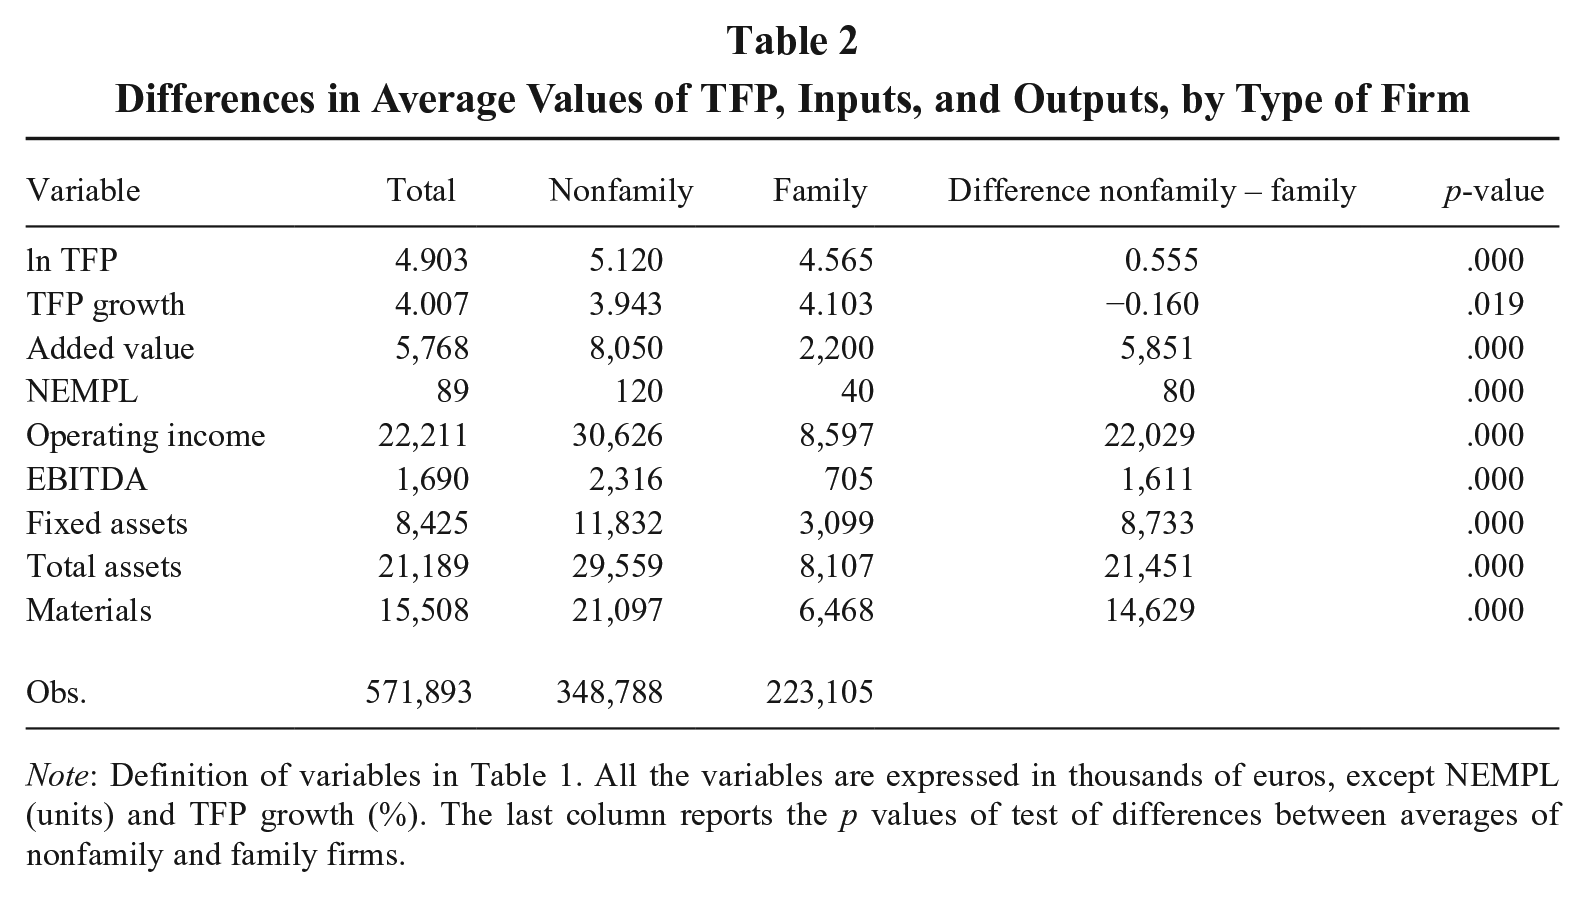
Note: Definition of variables in Table 1. All the variables are expressed in thousands of euros, except NEMPL (units) and TFP growth (%). The last column reports the p values of test of differences between averages of nonfamily and family firms.
Family and Nonfamily Firms
There have been different empirical approaches to identify family firms, most of them conditioned to the available data. Some definitions of family firms require only a small percentage of family ownership and control, such as 5% (Gomez-Mejia, Nuñez-Nickel, & Gutierrez, 2001), while many others require family ownership of 50% or more (Ang, Cole, & Lin, 2000). In our research design, we adopt a conservative empirical definition of family firms, following Steijvers and Voordeckers (2009). We define family firms as those where more than 50% of the firm is owned by a single family, adopting a narrower definition of family and nonfamily firms compared with previous literature. To satisfy the criterion of family firm, we stipulate that the GUO (global ultimate owner, i.e., the top entity in the ownership structure assumed to control the firm) and at least two shareholders must be classified by Orbis as “one or more named individuals or families,” share the same last name with the GUO of the firm, and jointly own more than 50% of the direct ownership. As for nonfamily firms, under this narrower definition, we include those firms whose GUO is not classified as an individual or a family (e.g., a corporation) and whose principal shareholder (direct ownership) has the same classification as the GUO (for instance, both GUO and main shareholder are classified as “corporate”). Observations that do not meet the criteria for family or nonfamily firms are not included in the baseline regressions.
Measurement of TFP
The firm-level TFP estimates are obtained applying the methodology posited in Levinsohn and Petrin (2003) to get unbiased estimates of the coefficients of the production function. This estimation technique seeks to overcome the correlation between the (variables) labor and capital inputs and the (unobserved) productivity. Firms that experience a significant positive productivity shock may respond by using more inputs. To the extent that this is true, ordinary least squares (OLS) estimates of production functions will yield biased parameter estimates and, by implication, biased estimates of productivity. Levinsohn and Petrin (2003) demonstrate, using data from Chilean manufacturing firms, that OLS estimations of the production function resulted in upward-biased coefficients for labor and downward-biased coefficients for capital. This was because labor responds to the transmitted productivity shock, while capital showed either no correlation or a significantly weaker correlation with the productivity. Levinsohn and Petrin (2003) methodology is based on the use of intermediary inputs in the estimation of the production function to overcome the correlation between labor and productivity. Appendix C includes a summary of the application of this methodology.
Let us assume that the production function of a firm follows the Cobb-Douglas:

where Yit is the added value of firm i in year t, Lit is the number of employees, Kit is the capital stock, and ait is the firm TFP. The coefficients α L , α K are the elasticities of output to the labor and capital input, respectively. For instance, if α L = 0.60, a 1% increase in labor would lead to approximately a 0.60% increase in total output. These parameters are informative of the technology that firm i applies to combine inputs in order to produce outputs. The higher the α L (α K ), the higher the contribution of labor (capital) to total output and the higher (lower) the optimal share of expenditures in labor (capital). 3 Once we have estimated the coefficients of the production function, it is straightforward to compute the estimates of the TFP of each firm at every time period as

Productivity, Productivity Growth, Inputs and Outputs
We follow Gopinath et al. (2017) in generating the variables used for estimating productivity, as they also utilize the Orbis database. From the annual accounts, we define the output measure in our study, Yit, as the value added, computed as the difference between operating revenue and materials. We capture the input labor, Lit, as the number of employees in the firm and capital, Kit, as the value of fixed assets (tangible and intangible) in thousands of euros. Intermediate inputs,
Equation (1) is estimated for different subgroups of firms in order to allow for different production functions (that is, different
Table 1 shows the descriptive statistics of the estimates of TFP and TFP growth obtained from the estimation of production functions. We observe that the TFP of firms in the sample present an average growth rate of 4%, though we observe a high dispersion in the distribution of the variable due to differences across firms and over time. From Table 2, we observe that nonfamily firms present higher values of TFP than family firms, in line with Hypothesis 2. The average TFP growth in family firms is higher than in nonfamily firms, which seems contrary to Hypothesis 2. But this may reflect variations in factors like size, age, and country. Thus, a multivariate analysis with proper controls is required to test Hypothesis 2.
Empirical Strategy and Variables
The empirical strategy relies on testing the hypotheses presented in the theory section through the results obtained from the estimation of empirical models. To test Hypothesis 1, which states that the contribution of labor is larger in family firms than in nonfamily firms, we use the estimates of the parameters of the production function
We also test Hypothesis 1 using labor intensity relative to capital, measured as the ratio of the number of employees to fixed assets, L/K. The reason is that when deriving the first-order conditions of the production problem, we find that the ratio of labor per unit of capital is proportional to the ratio of inputs elasticities to output, that is,
In order to test Hypothesis 2, we posit the following two empirical models:


where the dependent variables
The test of Hypothesis 2 relies on the estimation of coefficient β1 of Equation (3) and γ 1 in Equation (4); Hypothesis 2 will hold in the data if β1 < 0 and γ1 < 0, which indicates that family firms present lower TFP and TFP growth, once we control for other factors that may affect productivity and productivity growth.
The list of control variables included in
NEMPL it refers to the number of employees of the firm, used as a size indicator. Firm productivity can be influenced by size; for example, larger firms may have easier access to financial resources or benefit from economies of scale. In the estimation of (4), we replace NEMPL by the number of employees in 2009, NEMPL 2009 it , as a proxy of the initial size. This reduces potential concerns about reverse causality, provided that TFP growth affects the number of employees in posterior years.
TFP 2009 i is included in (4) to capture the initial level of productivity of the firm. We expect that the larger is the TFP reached by a firm, the lower will be its TFP growth (Huergo & Jaumandreu, 2004).
EXIT it identifies firms that exit the market. We can expect a negative sign of the coefficient of this variable because firms with lower productivity are less efficient with respect to their competitors, and eventually, they end up exiting the market.
AGE it is equal to the number of years that the firm has been operating in the market. We expect a positive sign of this variable when the dependent variable is TFP and a negative sign when the dependent variable is TFP growth, since older firms are likely to be more productive than younger firms, but to present lower TFP growth.
COUNTRY it is a vector that includes the dummy variables FR, DE, IT, ES, and UK that identify whether the firm is located in France, Germany, Italy, Spain, or the United Kingdom, respectively. It accounts for shared TFP and TFP growth differences among firms in the same country.
To test Hypotheses 3a and 3b, we operationalize three “share” variables to capture when the family shares control with other shareholders and members. To construct these variables, we classify shareholders, CEO, chair, board directors, and top managers positions as family members when they share the same last name as the primary family. The variable Share_Ownership identifies family firms in which the nonfamily shareholders own more than 40% of shares (and less than 50%). Alternative thresholds down to 10% are also considered for some specific analysis. The variable Share_ Leadership identifies whether the family holds the roles of CEO and chair. When one of both roles is held by non–family members, the variable takes value 1. The variable Share_Management/Governance takes value 1 when family members occupy less than 50% of directorships and top management positions.
Table 1 shows descriptive statistics of these variables. In family firms, 28.5% have a family member as the chair, and 74.5% have a family member as the CEO (Table 1). For 73.7% of the observations, family members hold only one or none of these positions. We also learn that the family members share ownership in 26.7% of the firm-year observations and share the management and governance of the firm with members not belonging to the family in 47.7% of the observations.
To specifically test Hypotheses 3a and 3b, we employ methodologies similar to those used for testing Hypothesis 1 and Hypothesis 2, respectively. To test Hypothesis 3a, we analyze the contribution of labor relative to capital, taking into account the share of control with others, as we did for Hypothesis 1. To test Hypothesis 3b, we also include the share of control in Models 3 and 4 as an explanatory variable of TFP and TFP growth of family firms, as in Hypothesis 2.
Results
As explained earlier, we test Hypothesis 1 using two approaches. First, we analyze whether the contribution of labor is higher in family firms than in nonfamily firms across economic sectors. Second, we test whether the ratio of intensity of labor to capital—measured as the natural log of the ratio of number of employees with respect to fixed assets—differs between family and nonfamily firms.
To perform the first test, we normalize coefficients
Contribution of Labor to Total Output, by Type of Firm

Note: Upper half of the table: Average values of the contribution of labor for each type of firm and the p values from the test of averages equal to zero. Lower half of the table: Number and percentage of economic sectors in which the contribution of labor is higher in family firms than in nonfamily firms.
Out of the 84 economic sectors for which we have enough observations to estimate the production function, we find that in 55 cases (65.48%), the contribution of labor to output is smaller in nonfamily firms than in family firms. If we examine the magnitude of the contribution of labor to total output with the coefficients of the production function, we obtain that the average value across sectors is 0.564 and 0.591 for nonfamily firms and family firms, respectively. The difference between average coefficients is significant with a p value of .003. This means that if all the inputs increase in the same proportion, 59.1% of the resulting output increase can be attributed to labor in family firms, which is around 3 percentage points higher than the labor contribution in nonfamily firms. This result confirms Hypothesis 1.
The results to test Hypothesis 1 using the alternative approach based on the ratio of labor to capital are shown on the right side of Table 3. Consistently with the conclusions for
The results for the analysis of Hypothesis 2 are shown in columns 1 and 2 in Table 4 with the results of the estimation of Model (3) for ln TFP as dependent variable. From column 1, we observe the coefficient of the variable FAM is negative (−0.326) and significant (p ~ .000). This implies that the level of productivity of family firms is lower than that of nonfamily firms (reference group), controlling for the rest of explanatory variables, whose coefficients present a sign and significance in line with the predictions. In economic terms, our results suggest that nonfamily firms might produce as much as 32.6% more than family firms using the same level of inputs. This result would support our Hypothesis 2.
Total Factor Productivity (TFP) and TFP Growth
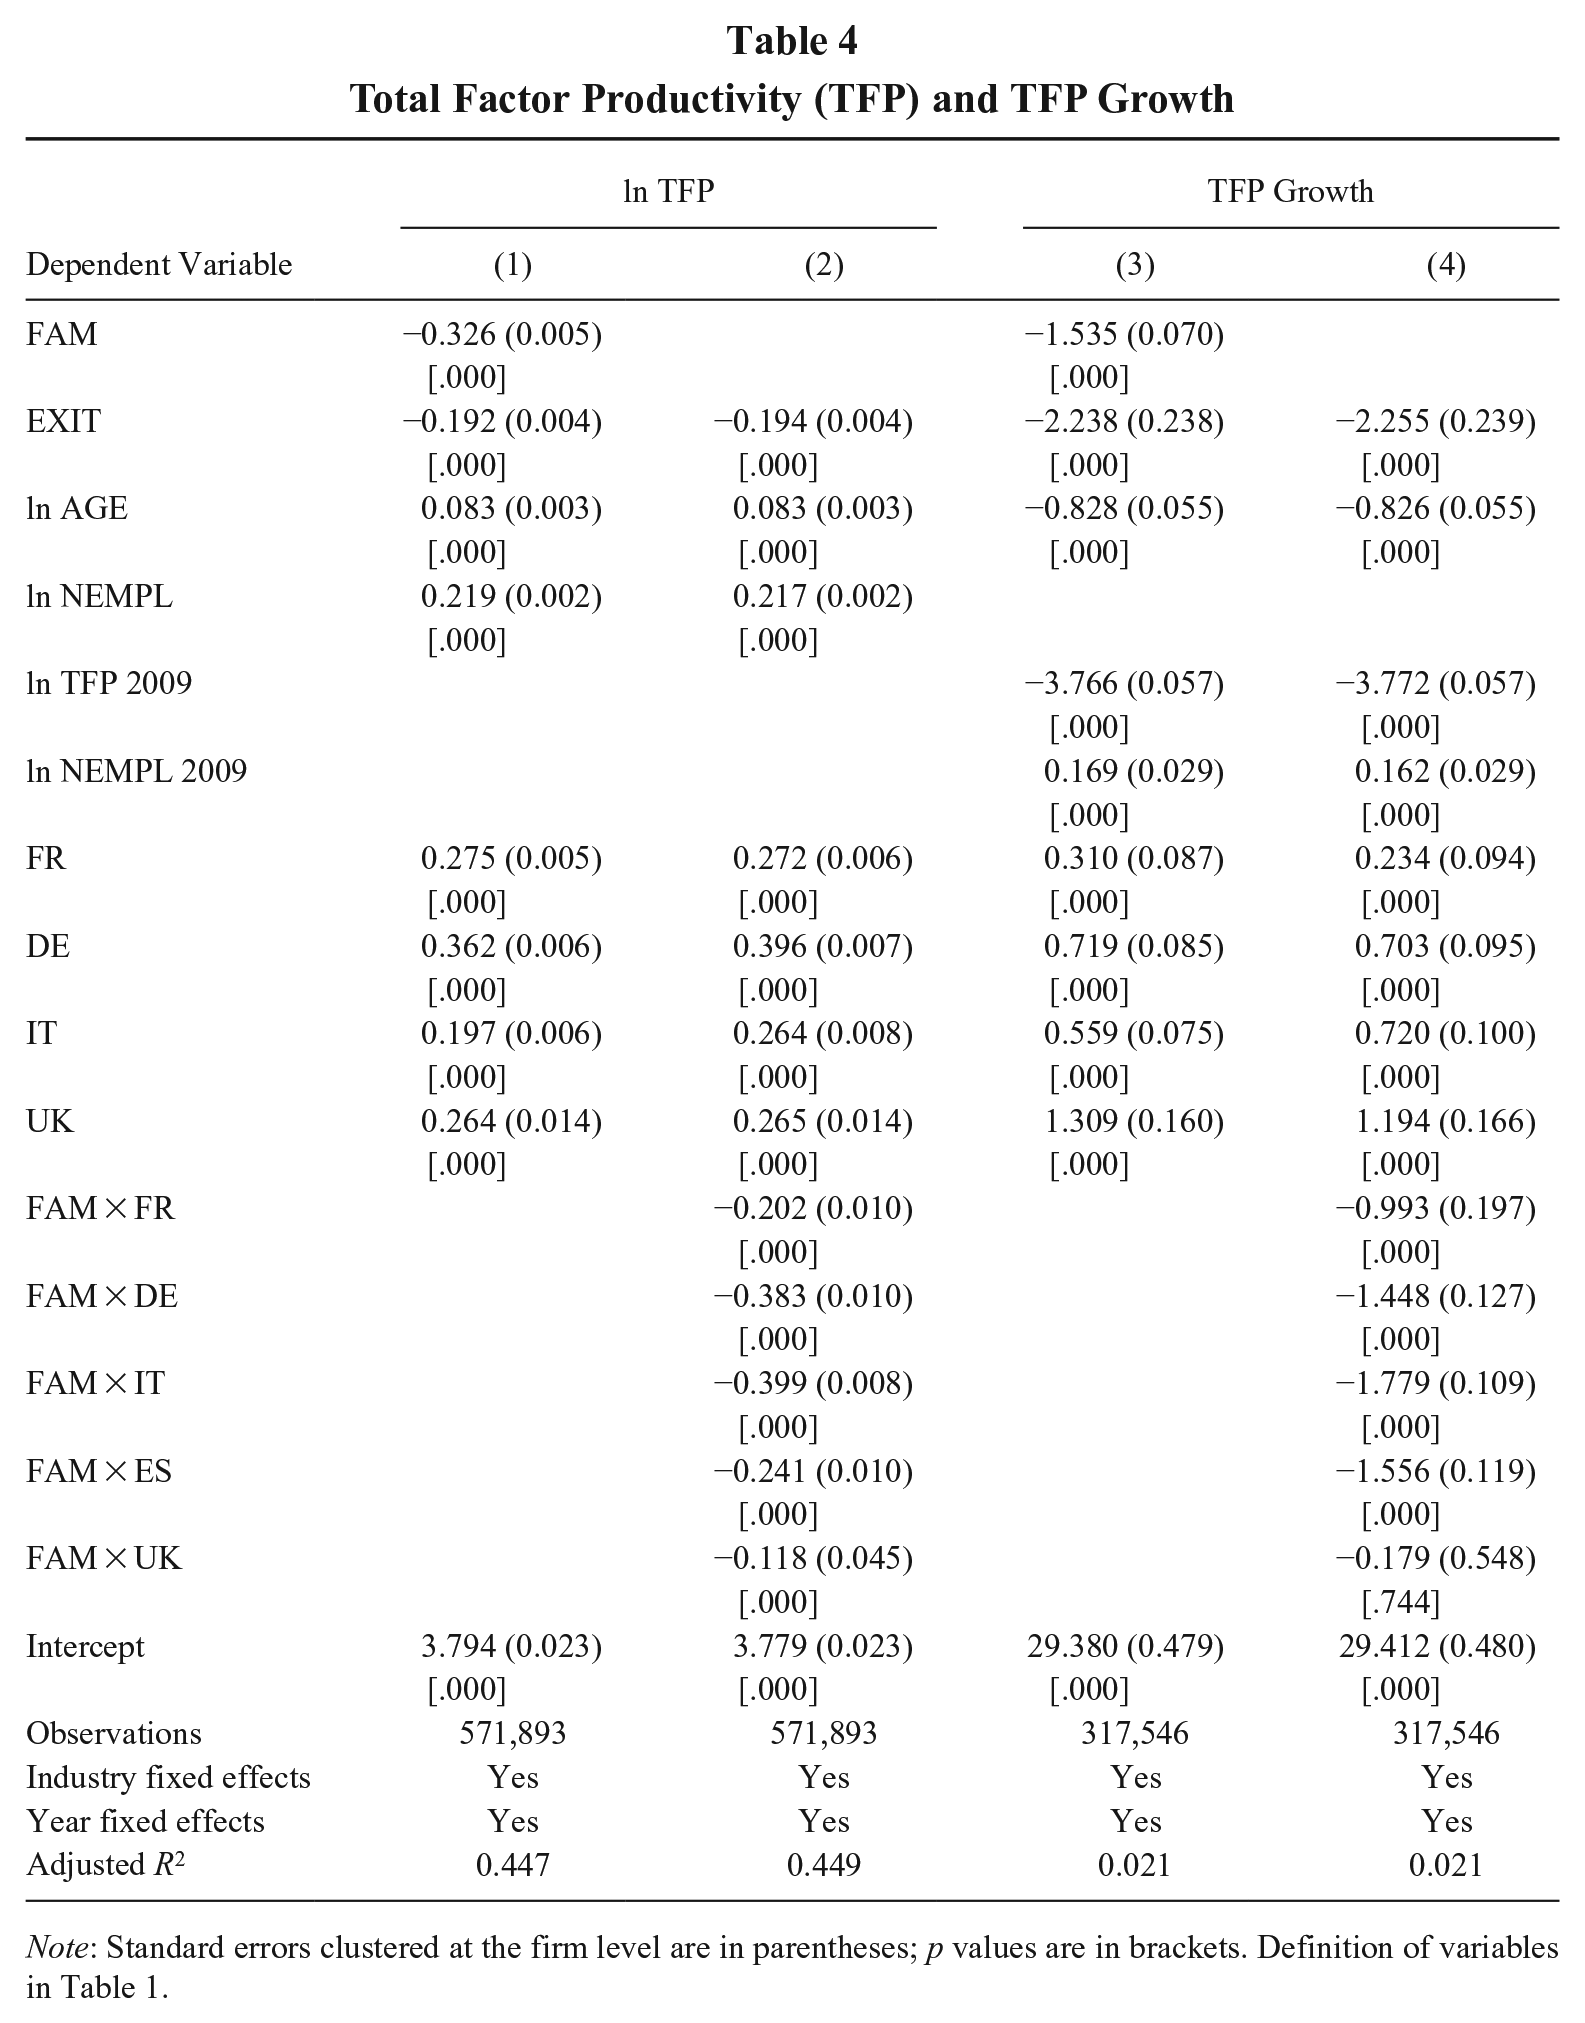
Note: Standard errors clustered at the firm level are in parentheses; p values are in brackets. Definition of variables in Table 1.
Table 4, column 2, displays the results of the model that incorporate interactions between the family firm variable and country dummies. In all countries, family firms exhibit lower TFP compared with nonfamily firms, aligning with the overall findings in column 1. This difference seems to be larger in Germany and Italy, with coefficients of DE and IT around –0.40, both significant (p ~ .000). In Spain and France, the difference between family and nonfamily is around half of that in Germany and Italy, and the United Kingdom presents the lowest difference between the two groups.
Column 3 in Table 4 presents the results of the baseline estimation of Model (4) of TFP_GROWTH. We find a significant negative coefficient for FAM (−1.535), indicating that, on average, family firms in the sample exhibit TFP growth 1.535 percentage points lower than nonfamily firms. This suggests no evidence of productivity convergence over time, with family firms showing consistently lower TFP growth rates compared with nonfamily firms, potentially widening the TFP gap between them. Column 4 in Table 4 presents the estimation allowing for different coefficients of the variable FAM for the five different countries. We observe that all the coefficients of the interactions of FAM with the country dummies remain negative and significant, except for the United Kingdom, which becomes not statistically significant. These results would be consistent with our Hypothesis 2.
We now turn to analyze Hypothesis 3a and Hypothesis 3b. Thus, we investigate whether the extent to which the family shares ownership and control with other shareholders and members explains differences in the production process and productivity within family firms. Given the recent developments in PRT (Schulze & Zellweger, 2021), we expect that when the family-owner of a family firm shares control, the long-term orientation and risk aversion of the family become less relevant.
A first approach to test Hypothesis 3a and Hypothesis 3b is to compare TFP and the ratio of labor over capital in three thresholds of the proxy variable Share_Ownership within family firms (see Table 5): (1) first, when the family shares less than 10% ownership with nonfamily owners; (2) second, those firms where the family shares more than 10% and less than 40% of ownership; and (3) third, where the family shares more than 40% and less than 49.9% of ownership. We observe that when ownership is shared more with non–family members, the labor-to-capital ratio decreases and productivity increases. The differences in the ratio of labor to capital and the TFP among these three groups of family firms are statistically significant, except for the labor to capital between groups (2) and (3). Interestingly, we uncover that what truly matters is sharing a minimum ownership stake, typically exceeding 10%. But if ownership is shared more extensively, significant differences are no longer observed. Overall, this evidence is consistent with Hypotheses 3a and 3b; the production process is less (more) labor (capital) intensive, and productivity is higher when the owner family shares control with non–family members.
Differences in Productivity and Capital per Worker, Depending on Sharing Ownership
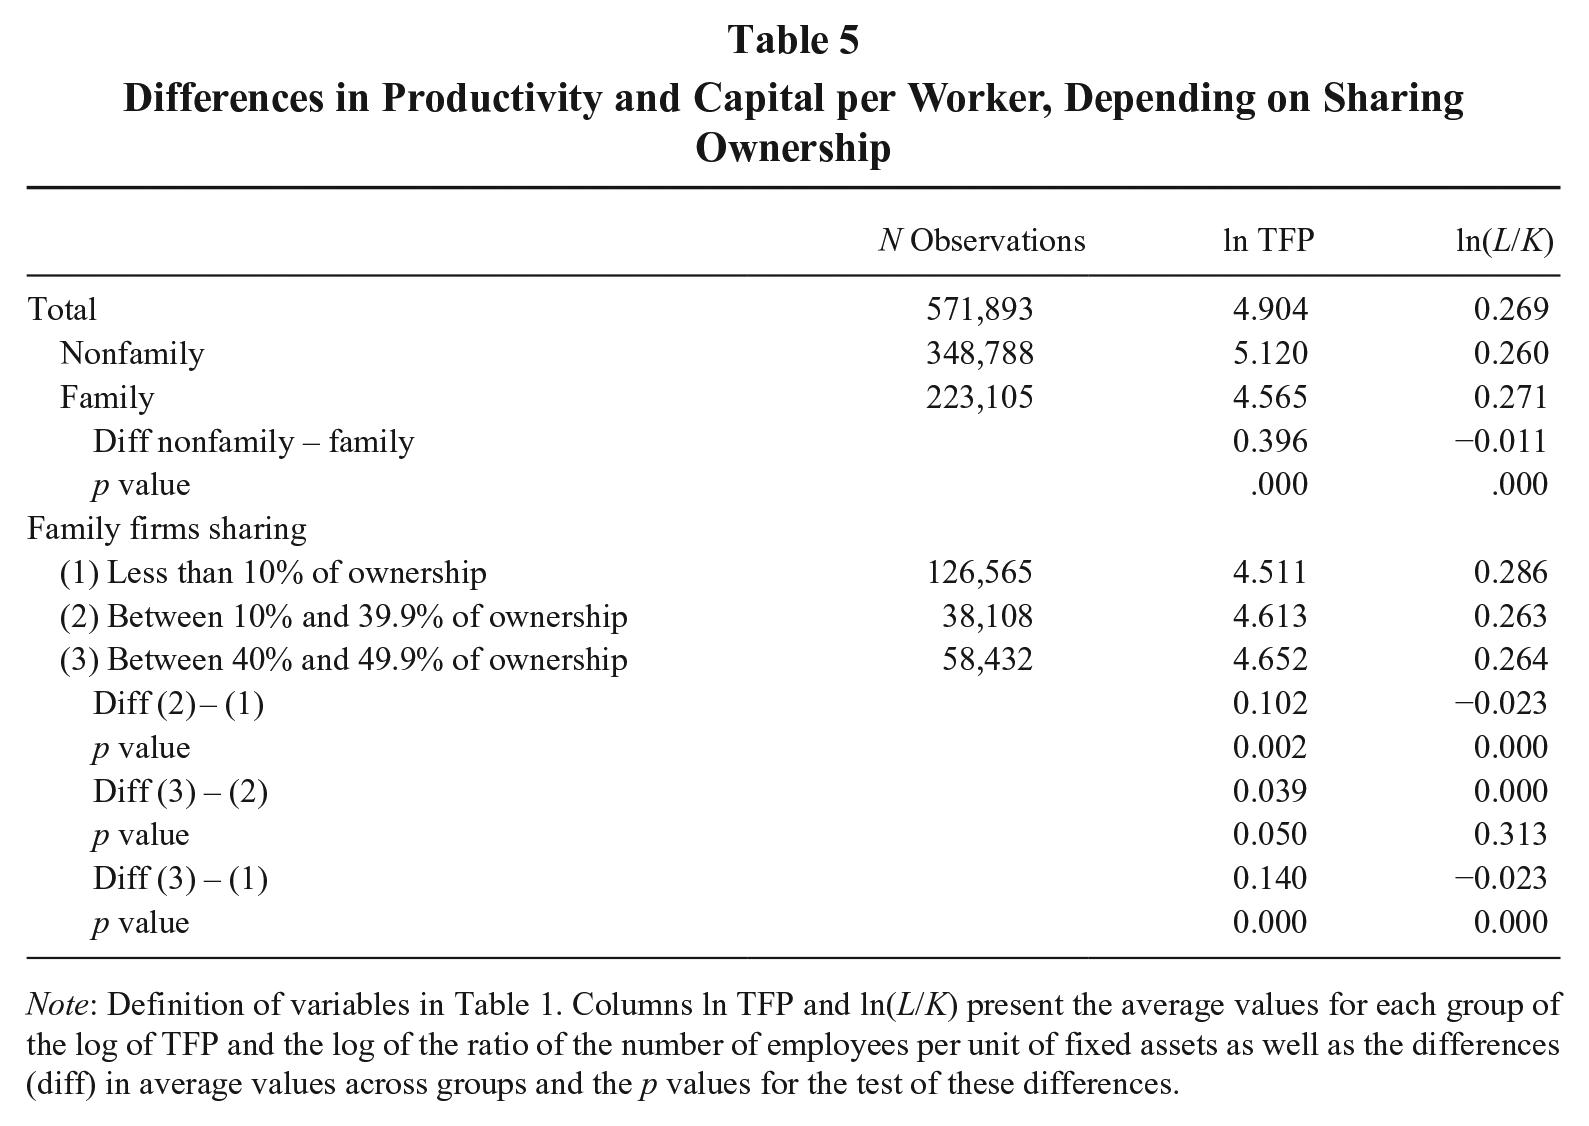
Note: Definition of variables in Table 1. Columns ln TFP and ln(L/K) present the average values for each group of the log of TFP and the log of the ratio of the number of employees per unit of fixed assets as well as the differences (diff) in average values across groups and the p values for the test of these differences.
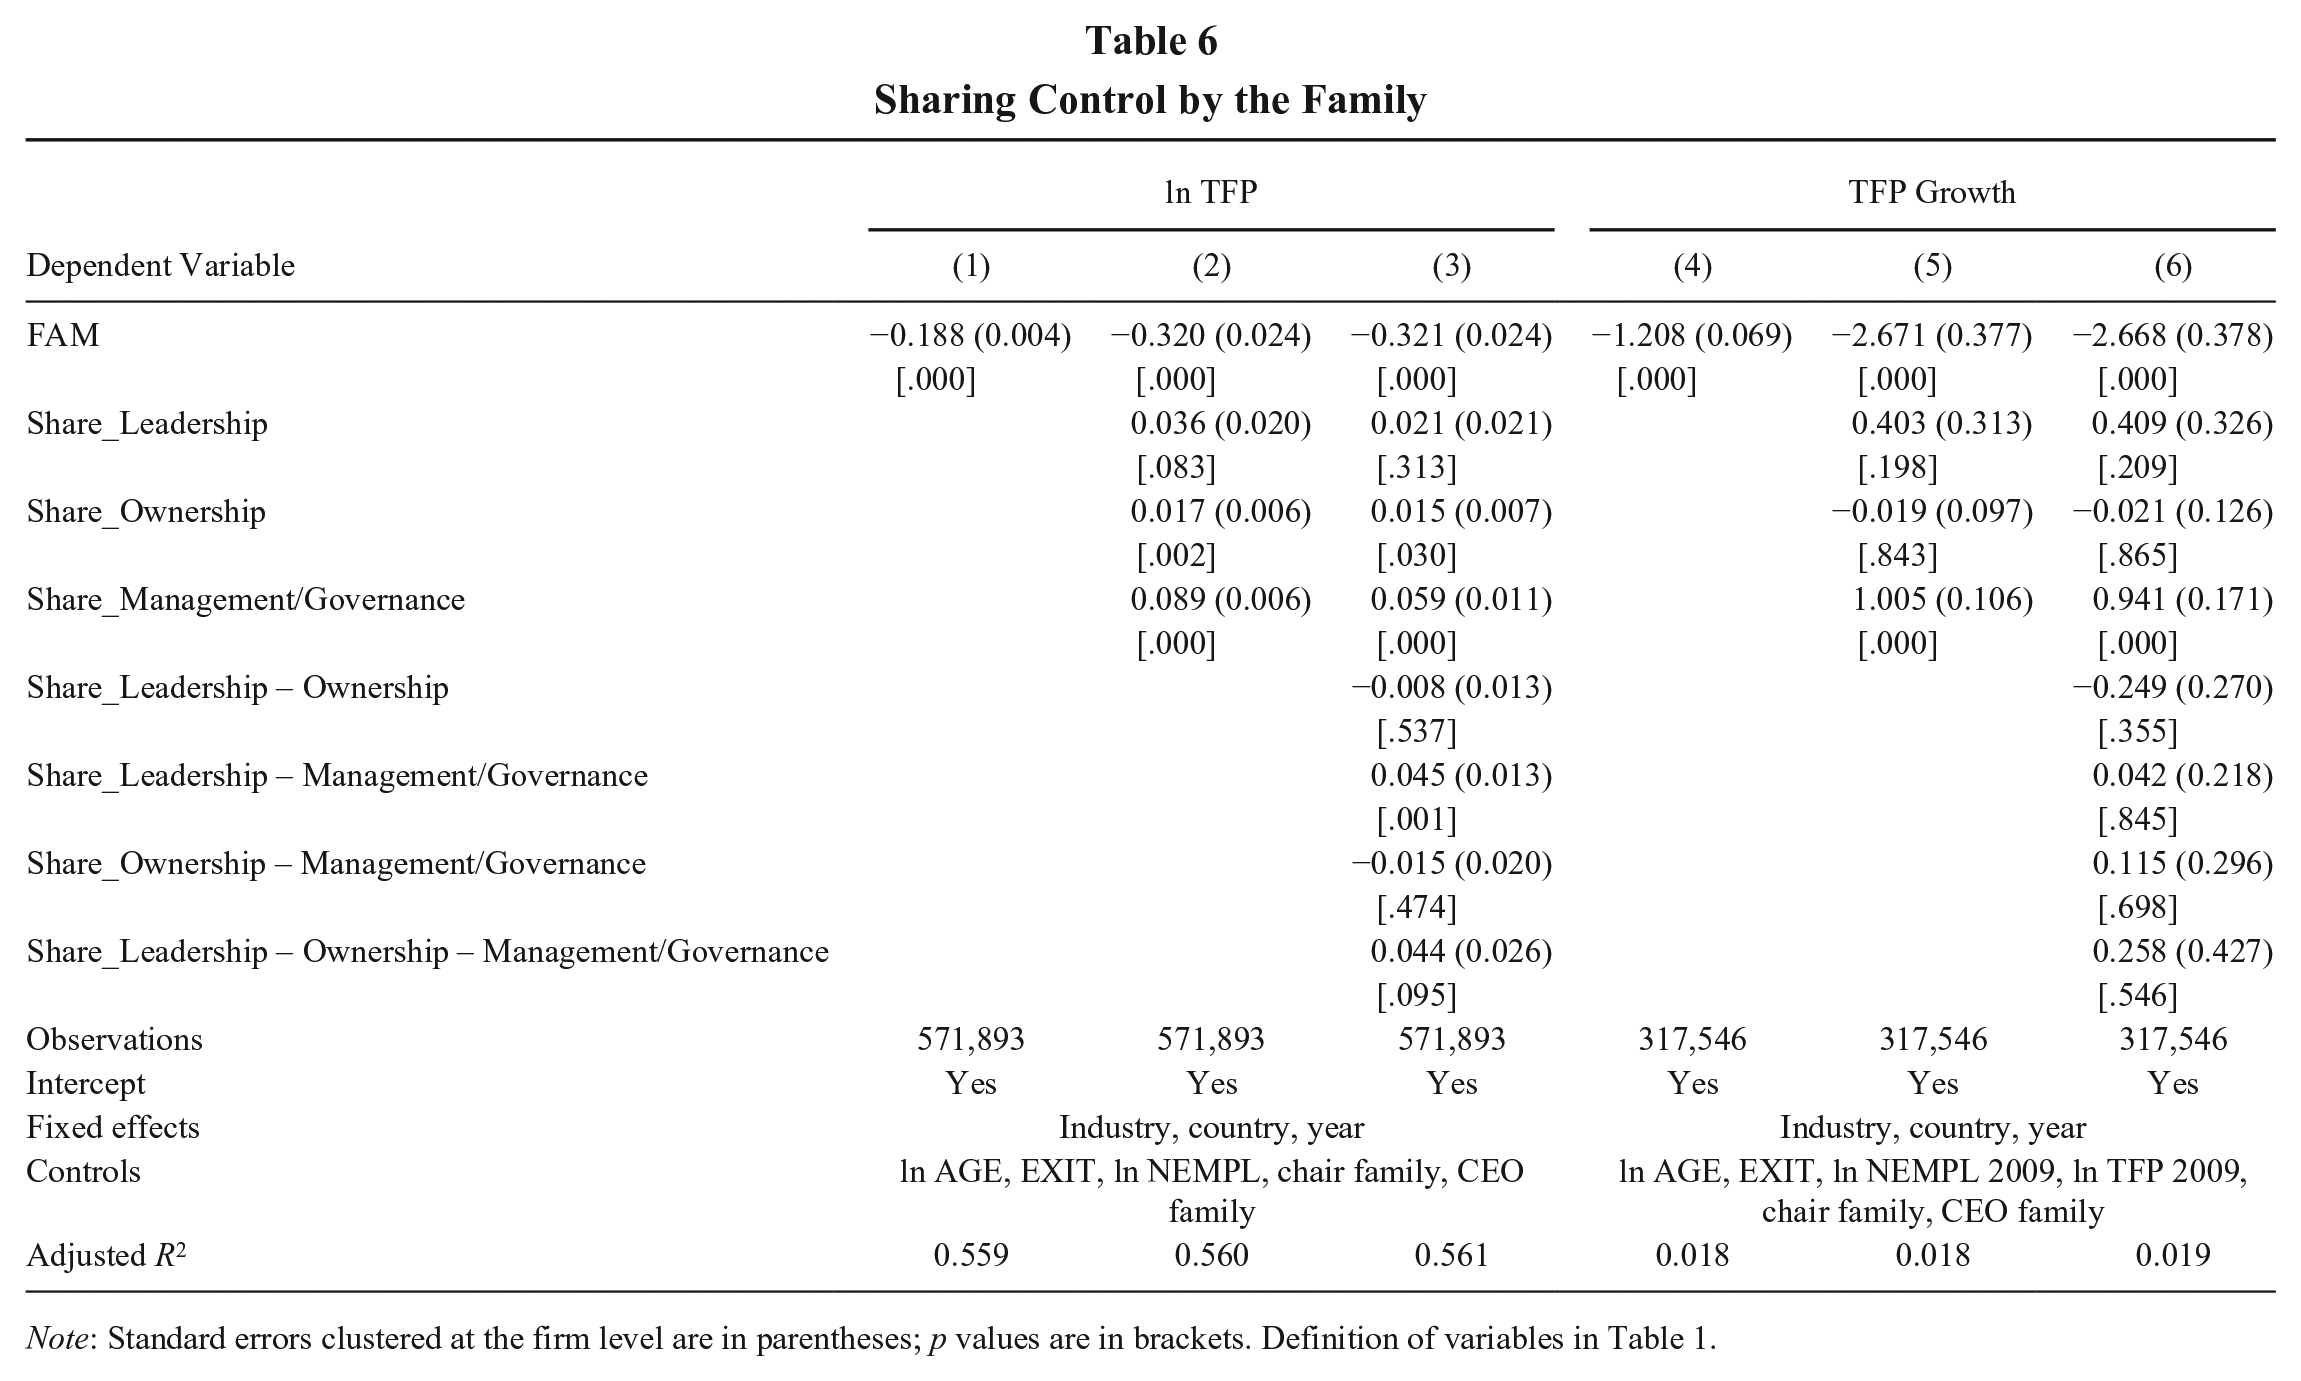
We now go deeper in the study of this subsample of firms and replicate the analysis of TFP in Table 4, considering different possibilities of families to share control (i.e., ownership, leadership, and management/governance) with non–family members. First, we present in column 1 of Table 6 the basic regression that does not include any sharing control variable and shows that the coefficient of FAM is −0.188, consistently with the negative value reported in column 1 of Table 4. Next, column 2 of Table 6 presents the results of the estimation of Model (3) including the vector of variables FAMILY_SHARE_CONTROL. We observe that the coefficient of the variables Share_Ownership and Share_Management/Governance is positive and statistically significant. This is evidence in favor of our Hypothesis 3b because family firms are more productive if the family shares ownership and roles in the governance and management bodies with others. The positive coefficient of Share_Leadership suggests that sharing leading positions would enhance productivity, though the coefficient is only weakly statistically significant. When we examine whether there is a distinct impact on productivity when these control mechanisms are implemented together, results in column 3 show that this simultaneous implementation significantly improves productivity.
Sharing Control by the Family
Note: Standard errors clustered at the firm level are in parentheses; p values are in brackets. Definition of variables in Table 1.
Overall, we find evidence supporting Hypothesis 3b that family firms sharing control with others yield higher productivity. Indeed, we can pinpoint family firms that share control but where the family holds a leadership position for which the difference in TFP compared with nonfamily firms decreases to −0.087 in column 2 (−0.063 in column 3), in contrast to the −0.188 observed in column 1. 5 Columns 4 to 6 in Table 6 show the results of the estimation of Model (4) for TFP growth. We find evidence supporting that TFP growth is larger in family firms that share control with other members, also supporting Hypothesis 3b, although the improvements in TFP growth are small. Indeed, sharing control might decrease the overall difference respect to nonfamily firms up to −1.16 in the model of column 5 instead of −1.208 in the model of column 4. 6 In sum, in family firms, sharing ownership and control rights outside the family alters the predicted salience of labor over capital in the production process as well as the overall productivity and productivity growth.
Robustness Tests
In this section, we present several robustness tests that we have performed so as to address specific alternative hypotheses that could explain our findings.
First, we consider whether the results obtained are contingent on the reduced sample and stricter definition of family and nonfamily firms based on the identification of shareholders and management team members. In the first robustness test, we examine whether the results obtained for Hypothesis 2 remain consistent when using the extended sample of 3,889,155 corresponding to the firms that provide information of all the inputs, outputs, and intermediate inputs. The results are presented in column 1 and column 2 of Table 7.
Robustness
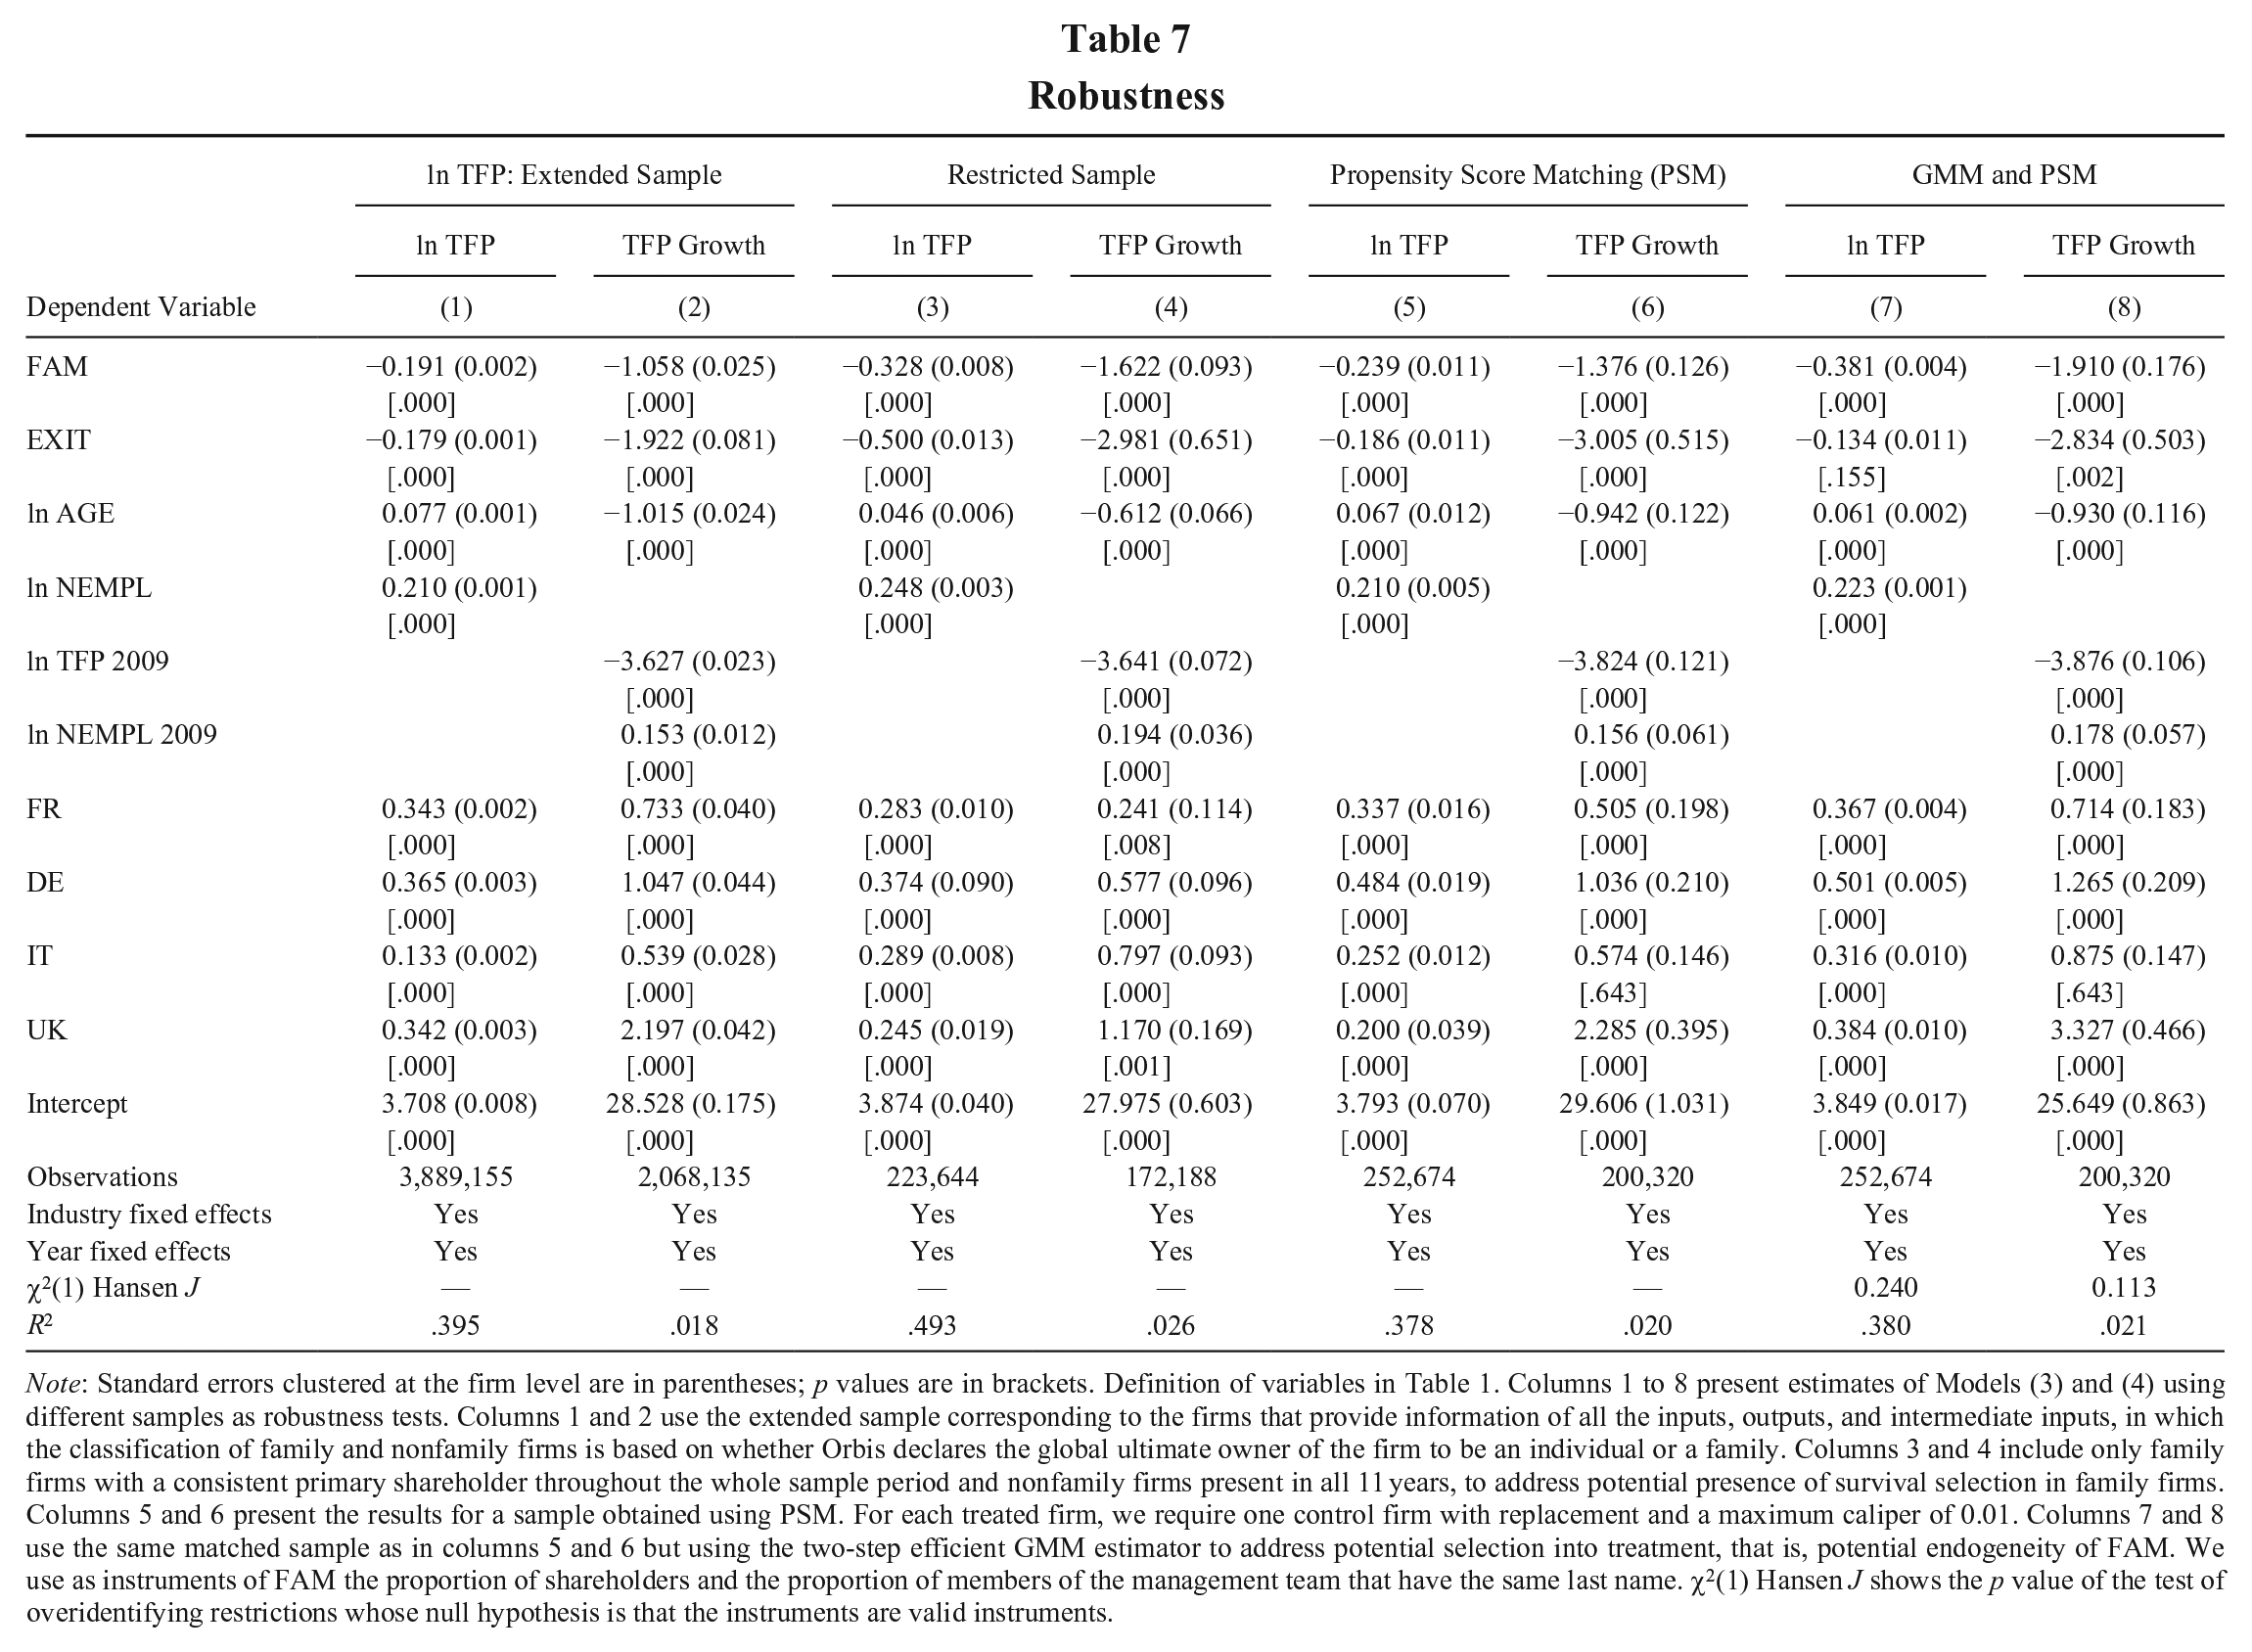
Note: Standard errors clustered at the firm level are in parentheses; p values are in brackets. Definition of variables in Table 1. Columns 1 to 8 present estimates of Models (3) and (4) using different samples as robustness tests. Columns 1 and 2 use the extended sample corresponding to the firms that provide information of all the inputs, outputs, and intermediate inputs, in which the classification of family and nonfamily firms is based on whether Orbis declares the global ultimate owner of the firm to be an individual or a family. Columns 3 and 4 include only family firms with a consistent primary shareholder throughout the whole sample period and nonfamily firms present in all 11 years, to address potential presence of survival selection in family firms. Columns 5 and 6 present the results for a sample obtained using PSM. For each treated firm, we require one control firm with replacement and a maximum caliper of 0.01. Columns 7 and 8 use the same matched sample as in columns 5 and 6 but using the two-step efficient GMM estimator to address potential selection into treatment, that is, potential endogeneity of FAM. We use as instruments of FAM the proportion of shareholders and the proportion of members of the management team that have the same last name. χ2(1) Hansen J shows the p value of the test of overidentifying restrictions whose null hypothesis is that the instruments are valid instruments.
We observe that the magnitude and sign of the coefficient estimates do not vary significantly in comparison to those presented in column 1 and column 2 of Table 4, and they remain statistically significant. We note that the coefficient FAM and its interactions with country dummies remain negative, corroborating that the TFP and TFP growth of family firms is lower than that of nonfamily firms using the extended sample.
Second, and related to the previous point, we investigate whether the results might be influenced by the presence of survival selection in family firms, particularly in situations where family firms may have a relative advantage or disadvantage, as identified by Franks, Mayer, Volpin, and Wagner (2012) in a sample of U.K. companies. Although the inclusion of industry dummies in all regressions partially addresses this concern, capturing differences in capital intensity between industries, we have attempted to create a subsample that is not affected by survival selection. More specifically, we begin with the sample used in the baseline regressions of Table 4, and we keep only those firms in which the same family holds more than 50% of direct ownership for each and every year within our 11-year sample. This approach eliminates the possibility of including firms in the sample that may transition from being family owned to nonfamily owned, focusing instead on firms that intentionally remain family firms. To ensure a homogeneous comparison, we include only those nonfamily firms that are present in all 11 years of our dataset, excluding firms that enter or exit. The results are presented in column 3 and column 4 of Table 7. As we observe that the signs and statistical significance of all coefficients remain unchanged, we may conclude that the results of the baseline regressions are not impacted by this issue.
Next, we address the potential concern that heterogeneity between family and nonfamily firms might explain the negative sign of the coefficient of FAM. To do so, we define a sample in which we paired each family firm with a nonfamily firm using propensity score matching. We limited the sample to family firms (treated) that maintained their primary shareholder unchanged throughout the sample period, as in columns 3 and 4 of Table 7. We conducted the matching based on the values of total assets, number of employees, age, and operating revenues in 2010. For each treated family firm, we selected one control firm (i.e., a nonfamily firm that remained throughout the entire sample) with replacement and a maximum caliper of 0.01. This process resulted in a matched sample of 12,703 family firms. The mean difference test between family and nonfamily firms (not displayed) indicates that there are no statistically significant differences between FAM and nonfamily firms at 5% for any of the variables used in the matching procedure. The estimation results using the propensity score matching sample are presented in columns 5 and 6 of Table 7. We observe that the results obtained in the baseline estimation remain unchanged.
Finally, we examine whether our findings could be explained by potential endogeneity whereby the decision to be or remain a family firm is not random and may involve unobserved variables. To account for selection into treatment, we use the sample in (5) and (6) to mitigate differences in observed variables between family and nonfamily firms and estimate a two-step GMM using instruments of the variable FAM, as suggested in Hill, Johnson, Greco, O’Boyle, and Walter (2021) when the treatment is not randomly assigned. The validity of this approach depends on whether instrumental variables meet two conditions (Hill et al., 2021). First is relevance, which implies that an instrumental variable is related to the endogenous variable (FAM). Second is exogeneity, which implies that the instrument is uncorrelated with the residual of Equations (3) and (4), meaning the only effect that the instrument has on TFP is through FAM. We posit as instruments the proportion of managers and the proportion of shareholders that share the same last name. 7 We could expect that these variables are positively correlated with FAM—since in family firms there are more shareholders and managers with the same last name—and uncorrelated with the residual of (3) and (4) because the fact of sharing the same last name only should affect TFP and TFP growth through the variable FAM. Results in column 7 and column 8 of Table 7 show that the coefficients of FAM remain negative and statistically significant in both ln TFP and TFP growth. The Hansen’s J test informs that there are no problems of overidentification, validating the exogeneity condition of the instruments. These results confirm that Hypothesis 2 holds in the data, even after accounting for selection into treatment.
Discussion and Conclusion
In a representative large sample of European firms, we examine the specific ways in which family ownership influences decision-making regarding the production process and, in turn, the resulting productivity levels of family-owned enterprises. We develop arguments to explain the productivity differences between family and nonfamily firms, drawing insights from PRT (Foss et al., 2020; Kim & Mahoney, 2002, 2010) and the idiosyncratic characteristics of family firms. PRT allocates decision rights to owners, and in the case of family firms characterized by majority ownership, these owners will be able to strongly influence the production process. In addition, we develop our conceptual framework informed by family business research that characterizes family firms with a long-term orientation and consistent risk aversion (Gómez-Mejia et al., 2007).
Our analysis suggests that property rights of resources are a driving force in the choices that family firms make. We argue that the right to transfer resources to the next generations facilitates the long-term orientation of family firms, which reduces the egocentrism and succession hazards of the rights of appropriation and transfer of resources, favoring the generation of incentives for employees to invest in firm-specific human capital, facilitating a comparative advantage of family firms in the management of labor. The right to use resources allows family firms to implement strategies for value creation pursuing conservative strategies to maintain control by the family. These differences in how family firms exercise their property rights lead family firms to use more labor (less capital) in their production process and to achieve lower productivity than comparable nonfamily firms. For example, the conservative strategy leads family firms to implement less relevant modifications of the production process and therefore to achieve comparatively modest productivity improvements. Although the advantages of family firms in the management of labor could generate productivity improvements, we argue that the overall effect on productivity is negative in comparative terms, since improvements in capital are more relevant than improvements in labor to explain improvements in productivity. The results of our empirical analysis are consistent with the expected differences in the production process and productivity between family and nonfamily firms.
Our in-depth empirical analyses of family firms confirm the mechanisms proposed in PRT (Schulze & Zellweger, 2021), where there is an effective modification of the control hazards generated by the rights to use, appropriate, and transfer resources in family firms. That is, the control sharing makes the long-term focus and the risk aversion less relevant. Consequently, the family firm–specific characteristics do not impose their limits in the capital investment or combining the inputs in the production process. Our results confirm that the relevance of labor in relation to capital decreases (and capital is used more intensively) in the production process and that productivity and productivity growth improve when family owners share control with other shareholders and leadership members. In particular, the benefits of sharing of property rights around ownership are further strengthened when the family is involved in the leadership positions of the firm. Complementing prior research on family firms, which highlights the favorable impact of family involvement (e.g., Zattoni, Gnan, & Huse, 2015), our study reveals that family firms in which the family maintains involvement but shares control with other shareholders and leadership members exhibit superior levels of productivity and productivity growth compared with other family-owned firms.
A noteworthy finding is that reaching a baseline level of shared control (around 10%, as specified in Table 5) triggers changes in input composition and the productivity improvements of family firms. Interestingly, once this minimum threshold is attained, whether shared control extends beyond or drops below 40% ownership, there are no relevant disparities in input composition and productivity. Therefore, our results reveal some discontinuity and nonlinearity in the benefits of sharing control for families as owners of family firms. Furthermore, recent developments in the theory on power and dominant coalitions in family firms (Ben-Shahar et al., 2023) reveal that there are differences between the real loss of power and the formal control shared with nonfamily members. These differences depend on the collaboration and coordination of family members. The maximum degree of power loss by the family owners of a family firm occurs when family members fail to coordinate or collaborate among them. The power lost aligns precisely with the formal shared control delegated to non–family members. These arguments, applied to our findings, assuming that there is some degree of coordination and collaboration among the family members in our sample, mean that on average the modifications in the production process and improvements in productivity are achieved with a lower amount of power lost in the firm. Even though we do not account directly for the degree of coordination and collaboration among the family members, the limited formal control shared with nonfamily members is probably mitigated by the presence of family coordination.
Our article contributes to several areas of management research. First, we advance PRT (Foss et al., 2020; Kim & Mahoney, 2002, 2010) by expanding its boundaries from owner-managed firms to family firms. Families as owners of family firms may exert a large influence on the decision-making process of family firms (Connelly et al., 2010) like owner-managers, reflecting the specific motivation of families as owners. Our analysis suggests that this ample right to use resources pursuing specific motivations is the origin of the relevant hazard for value creation from the management of the production process in family firms, more than the hazard of lower reliability of the owners considered in owner-managed firms (Schulze & Zellweger, 2021). Additionally, we provide the first empirical test of the effectiveness of the type of mechanisms proposed by Schulze and Zellweger (2021), which basically consists of sharing control with other agents, to offset the control hazards derived from the self-incentivizing nature of property rights in family firms. Second, we contribute to the strategic literature on productivity (e.g., Agarwal & Gort, 2002) by analyzing the relevance of production inputs and studying productivity level and productivity growth simultaneously. Third, we enlarge the literature on productivity (e.g., Levinsohn & Petrin, 2003; Olley & Pakes, 1996) by showing the relevance of different configurations of ownership and control of firms.
Last, we provide theoretical arguments and empirically shed light on the inconclusive and scarce literature on family firm productivity. The evidence from the limited number of existing research is inconclusive (e.g., Barbera & Moores, 2013; Barth et al., 2005; Cucculelli et al., 2014; Wall, 1998), probably due to the use of different approaches to study the production process (e.g., allowing for different mixtures of inputs in different groups of firms), even different definitions of productivity, and to limitations in their data that condition the empirical analysis (e.g., analysis with only small firms where families wholly own family firms). Our study overcomes sample data limitations using a large database with around 600,000 firm-year observations that is able to apply data-intensive empirical methodologies that guarantee consistent estimations free of biases in the estimated coefficients. Moreover, drawing on data from five different countries makes our findings more generalizable to different institutional environments (e.g., Barth et al., 2005; Cucculelli et al., 2014). Indeed, our analysis provides an explicit test and the theoretical foundation for unpacking why family firms where the family owners share control may even outperform nonfamily firms, as found in Anderson and Reeb (2003) analyzing U.S. listed firms.
Our analysis opens up interesting avenues of future research to improve our understanding of the relationship between different configurations of family control and the production process. First, our results suggest economic benefits for families as owners of family firms, in terms of higher productivity, when they share some control of the firm with non–family members. Future research could explore whether different sharing control mechanisms differ in their effectiveness, as suggested by our empirical analysis. Second, our analysis does not reveal whether the sharing control benefits outweigh other specific benefits that the family loses when it shares control with non–family members, even in terms of noneconomic objectives. Therefore, future research is needed to evaluate whether sharing control is overall positive for the specific interests of families as owners of family firms. Third, in our sample we do not observe the collaboration and coordination of family members when the family shares control with non–family members; therefore, we do not observe the real power lost by the family when it shares formal control. Further research could measure how much real power do families have to lose to achieve significant increments in productivity. Fourth, our results show a positive effect of the involvement of the family with the firm. Family firms sharing control, where family members hold leadership positions, show the highest levels of productivity and productivity growth. Maybe this is related to the quality of the resources provided by the family to the firm, that is, the competence of the owners (Foss et al., 2020), that we are not able to control for in our sample. Therefore, future research could analyze the effect on the production process and on productivity of the quality of the resources provided by the family (e.g., the quality of the human capital provided by family members involved in the leadership and management of the firm).
Fifth, it is worth acknowledging that the high representativeness of our very large sample of observations comes at the cost of using systematic mechanisms to identify family firms and family members and not being able to observe specific characteristics of family members (e.g., their education profiles). Besides, our classification strategy leaves out certain types of firms because they do not meet the criteria to be identified as family or nonfamily firms. For instance, our sample does not include nonfamily firms held by individuals who do not belong to the same family, for example, firms that have had a management buyout and that are held by one or several managers who are not family related. However, given the data available for this classification, we have opted to prioritize minimizing the error of mistakenly categorizing nonfamily firms as family firms rather than the risk of excluding possible nonfamily firms from the control group. Further research could overcome this type of drawback using advances in information technologies (e.g., web-scraping methods).
Family firms are key economic players (Masulis, Pham, & Zein, 2011), showing a widespread presence all around the globe. This makes this type of firm fundamental to explaining the evolution of the economy in many countries, and improvements in their productivity could have large global effects on economic growth. Therefore, it is relevant for regulators to understand how different ownership and control configurations affect the production process and productivity of family firms, especially to understand how family firms may be incentivized to adopt configurations to increase their productivity and performance. Our results suggest that policies incentivizing families to share a small degree of formal control could generate significant increments in productivity. Furthermore, given the findings in Ben-Shahar et al. (2023), this degree of formal control might imply losing small portions of real control of the firm by the family. This makes this type of mechanism more feasible since it could reduce the reluctance of families to adopt them. Our results are also relevant for family owners of family firms since as owners they would benefit from the improvements in productivity derived from adopting the appropriated control configurations that will facilitate improvements in firm performance, minimizing the real loss of power in their firms.
In sum, our study draws on PRT and research on family firms to shed some light into how family firms use their different inputs in the production process, why family firms tend to exhibit lower levels of productivity relative to nonfamily firms, and how the production process and the productivity of family firms change once ownership and control is shared. We test these ideas in a very large sample of European firms using sophisticated productivity analysis. We hope our study unpacks research in family firms, governance, and productivity.
Footnotes
Appendix A
We have performed an analysis of correlations across variables. The results presented in Table A1 show that the correlation between FAM and TFP is negative and significant, and it is positive with TFP growth, which is consistent with the differences in average values by type of firm shown in Table 2. As expected, AGE is positively related to TFP and negatively related to TFP growth. We also learn that EXIT and TFP are negatively correlated, consistent with the idea that firms that leave the market are the ones with lower productivity. Finally, FAM is negatively correlated with the number of employees, suggesting that family firms are in general smaller than nonfamily firms. Notice that all the correlations are significant (p ~ .000), but this result has to be taken with caution because even tiny correlations might become significant as the number of observations increases.
Appendix B
The evolution of productivity matters because it is closely linked to the efficiency and growth potential of firms. In this appendix, we study the relevance of productivity growth analyzing its relationship with a firm financial performance, measured as earnings before interest, taxes, depreciation, and amortization (EBITDA) over total assets. The significance of the relationship is estimated with a linear regression model where TFP growth is the key explanatory variable of the financial performance measure. We control for country, industry, and year fixed effects and compute robust standard errors clustered at firm level.
The results are shown in Table B1. Column 1 presents the estimation including observations of all the firms located in the five countries. The coefficient of TFP growth is significant (p ~ .000) and equal to 0.074. This means that firms showing increments in TFP show better financial performance. More concretely, an increase in TFP growth of 4.007% (i.e., average value in the sample) would entangle an increase in 0.297 percentage points in the ratio of EBITDA with respect to total assets. Columns 2 to 6 confirm the results for the subsamples of countries.
Appendix C
This appendix provides a summary of the application of the Levinsohn and Petrin (2003) methodology to estimate production functions. From Equation (1), we start with the assumption that TFP, denoted as ait, is the sum of two components, ω
it
and ε
it
, both unobserved measures for the econometrician. The component ω
it
is known to the firm and that impacts the firm’s decisions, whereas ε
it
is unobserved by the firm and does not impact the decisions of the firm. Since firms decide on their input levels based on their TFP, there exists a correlation between ω
it
and the input choices that produces biased estimates if it is not taken into account. The methodology in Levinsohn and Petrin posits an identification strategy that takes into account such correlation, based on the use of a variable
Acknowledgements
We acknowledge the financial support of the Spanish Ministry of Science and Innovation (MCIN/ AEI/10.13039/501100011033) Project PID2020-115982RB-C21. Alfredo Martín-Oliver also acknowledges the financial support of Fundación Ramón Areces. Rafel Crespi-Cladera acknowledges the support from Banca March Family Business Chair.