
Abstract
Prior theory suggests that incentive plans, such as piece-rate or commission plans, motivate good performance because employees anticipate that current performance will generate matching future incentive payments. In this article, we move beyond reward expectancy to argue that performance can also derive from employees’ reactive responses to received incentive payments. We propose a salience-based theory casting incentive payments as recurring temporal markers that periodically increase the salience of the incentive plan, to which employees respond by temporarily increasing incentivized and unincentivized performance. We introduce multivariate time-series methods to test our hypotheses in longitudinal data spanning 169 weeks (1,183 days), drawn from an online firm using an incentive plan for its customer-support employees. While we find no evidence that incentive payments affect the dynamics of incentivized performance, they do temporarily boost several unincentivized behaviors and outcomes. Combined with fieldwork, these findings support our proposed mechanism of “salience-induced reciprocity”—that is, the temporary reciprocity in response to a periodic increase in the salience of the incentive plan. This article contributes to a more complete understanding of performance and effort dynamics in incentive plans, offers new inroads into studying temporality in the functioning of human resources practices, and provides other future research avenues.
Keywords
Nonexecutive employees often work under some form of incentive plan (e.g., WorldatWork, 2016), which is one type of pay-for-performance system in which, apart from a base salary, employees periodically receive incentive payments for their performance on specified tasks, according to a transparent, preagreed formula. For example, sales representatives may earn a commission tied to their sales performance, and call center employees may be rewarded by the number of calls taken. There is continuing interest in understanding the performance effects of such incentive plans (Bloom & Van Reenen, 2011). Empirical studies have compared performance under incentive plans with that under flat or hourly wages, and the evidence implies that on average, performance tends to be higher under incentive plans (e.g., Banker, Lee, & Potter, 1996; Lazear, 2000; Locke, Feren, McCaleb, Shaw, & Denny, 1980; Shearer, 2004). The foremost explanation for such evidence has been that incentive plans, as soon as they are in place, permit the credible anticipation that current performance generates matching future rewards, and such reward expectancy can motivate employees to perform well (Lawler, 1973; Prendergast, 1999). 1
However, in its tendency to attribute the effectiveness of incentive plans to reward expectancy, prior work has directed less attention to the idea that performance may also derive from reactive responses to received rewards—that is, the actual incentive payments employees periodically take. Yet understanding how the receipt of incentive payments—a periodic event native to any incentive plan—influences performance is important on both theoretical and practical grounds. First, by moving beyond reward expectancy stemming from the mere existence of an incentive plan, a study of whether, why, and how received incentive payments influence subsequent performance contributes to a more complete theory of the performance effects of incentive plans. Second, and related, the intermittency with which employees receive incentive payments naturally raises questions about the temporal dynamics that characterize potential performance responses. Research theorizing and examining such temporality is needed because it can be highly actionable, for example, by offering implications to employers for when to expose employees to human resource (HR) interventions other than incentive payment, such as informal feedback or commitment-building activities.
Of course, a wider literature exists on the performance responses to received pay. For example, some work has focused on types of pay-for-performance systems other than incentive plans, such as discretionary bonus or stock option plans (e.g., Cappelli, Conyon, & Almeda, 2020; L. Kahn & Sherer, 1990; Nyberg, Pieper, & Trevor, 2016). In this work, explanations for why performance may respond to received rewards—for example, discretionary bonuses or profits from the sale of stock options—are typically traceable to ex ante uncertainty regarding how much a unit of individual performance will be (deemed) worth. Yet incentive plans do not yield such uncertainty, because from the moment of implementation, performance has a transparent, deterministic, and predictable link to incentive payments. A different strand of work has studied outcomes following the day on which salaries are paid, revealing few implications of payday for factors such as cognitive performance, decision-making quality, or organizational citizenship behaviors (e.g., Carvalho, Meier, & Wang, 2016; Steed, 2018). Yet incentive payments are distinct in deriving from a discretionary HR practice, and so they could elicit responses where ordinary salary payments might not. Overall, what seems missing is a theory of the dynamic performance consequences of received incentive payments that does not require ex ante uncertainty regarding the performance–reward relationship while at the same time accounting for the discretionary nature of an incentive plan.
Thus, the purpose of this article is to theorize and examine how periodic incentive payments influence the temporal dynamics of performance in an ongoing incentive plan. Drawing from prior research on salience and attention in management (Garg, Jiang, & Lepak, 2021; Ocasio, 2011), economics (DellaVigna, 2009; Englmaier, Roider, & Sunde, 2017), and psychology (Fiske & Taylor, 2013; Schacter, 1999; Tversky & Kahneman, 1974), we propose a salience-based theory that generates two hypotheses regarding the temporary effects of periodic incentive payments on incentivized and unincentivized performance. We test these hypotheses using multivariate time-series methods (Lütkepohl, 2005) applied to unique longitudinal data spanning 169 weeks (1,183 days), drawn from an online firm using an incentive plan for its customer-support employees. Across econometric analyses and fieldwork, our findings suggest that periodic incentive payments temporarily boost various kinds of unincentivized behaviors and outcomes, while we find no evidence that they affect the dynamics of incentivized performance. These patterns are broadly consistent with our proposed mechanism of salience-induced reciprocity—that is, the temporary reciprocity in response to a periodic increase in the salience of the incentive plan.
The theory and evidence in this article extend the understanding of performance and effort dynamics in incentive plans, and they offer new inroads into studying temporality in the functioning of HR practices. First, we contribute to a more complete theory of the performance effects of incentive plans, by arguing and showing that salience-induced responses to received incentive payments constitute an additional channel, distinct from reward expectancy, through which incentive plans can have their effects. In so doing, our study also introduces a novel mechanism—salience-induced reciprocity—plausibly underpinning the resultant performance dynamics. Second, while effort dynamics in incentive plans have been traced to time-varying incentive pressure or external interventions that make incentives salient, we show that distinct dynamics can also be traced to incentive payments, a routine component of any incentive plan. Finally, while time and temporal dynamics seem fundamental to understanding the functioning of HR practices, dynamics remain understudied in the HR literature. We extend this literature with a theory of temporal performance dynamics, and we introduce and implement multivariate time-series methods to examine such dynamics in longitudinal data on an incentive plan.
Incentive Plans and Performance
Employees are typically expected to expend effort in ways that improve outcomes of relevance to their employers. Yet the interests of employees and employers may not align, and effort can be difficult to observe and verify, so that a core managerial challenge is to ensure that employees are motivated to act in their employers’ interests (Holmström, 1979). Both economic and psychological theories have long suggested that tying employees’ pay to performance constitutes one viable way of increasing the alignment of interests between employees and their employers, and organizations indeed employ a wide variety of pay-for-performance systems (Gerhart, Rynes, & Fulmer, 2009). Here, our focus is on one such system, the incentive plan, through which an employer periodically gives employees incentive payments for their performance on clearly demarcated tasks, according to a preagreed, contractually specified formula. This contract supplies employees with incentives by transparently stipulating ex ante the specific amount at which the employer promises to later compensate each “unit” of task performance. Such units can be measures of both the quantity and quality of employees’ output (Lazear, 1986), and incentive payments can be a linear or nonlinear function of task performance (Prendergast, 1999). Two familiar examples of an incentive plan so defined are individual piece-rate and commission plans.
The Role of Reward Expectancy
Accumulated empirical evidence reveals that on average, performance tends to be higher under incentive plans compared with flat or hourly wages (Banker et al., 1996; Delaney & Huselid, 1996; C. Kahn, Silva, & Ziliak, 2001; Lavy, 2009; Lazear, 2000; Locke et al., 1980; Shearer, 2004; Stajkovic & Luthans, 1997). The primary theories in the pay-for-performance literature, agency theory and expectancy theory (Gerhart & Milkovich, 1990; Nyberg et al., 2016), would attribute this result to the reward expectancy created by incentives, which derive from the mere fact that an incentive plan and accompanying contract are in place. Specifically, insofar as incentives permit the credible expectation that current performance generates a matching future reward that outweighs the cost of effort, employees will be motivated to exert effort to perform well (Lawler, 1973; Prendergast, 1999). Thus, once an employer introduces an incentive plan, employees respond rationally, by adjusting their effort in a forward-looking manner, proportional to the level of expectancy for future rewards induced by the plan’s incentives. By implication, both theories predict that the effectiveness of incentive plans can be traced to employees’ credible expectation that sufficiently desirable rewards will follow.
Given its emphasis on the role of incentives and reward expectancy in shaping employees’ motivational states, available research on incentive plans has mostly abstracted away from the role of incentive payments. In pay-for-performance systems other than incentive plans, such as discretionary bonus or stock option plans (e.g., Cappelli et al., 2020; L. Kahn & Sherer, 1990; Nyberg et al., 2016; Park & Sturman, 2016), employees face uncertainty regarding how much a unit of individual performance will eventually be (deemed) worth. Yet in incentive plans, the contract transparently links performance to incentive payments in a deterministic and predictable way, so that a clear line of sight exists between performance and expected pay. Consequently, the (implicit) assumption has been that incentive payments will periodically occur, though with the primary purpose of settling the outstanding balance between prior employee performance and the pledged compensation owed in return by the employer.
At first blush, this assumption justifies the familiar focus on incentives and reward expectancy, and the abstraction away from incentive payments and their possible consequences. After all, since incentive payments are always commensurate with preagreed incentives, it stands to reason that an incentive payment will not leave employees with residual feelings of surprise, obligation, or inequity. So construed, in an ongoing incentive plan, incentives drive performance through employees’ reward expectancy, while periodic incentive payments should not themselves generate temporary changes in subsequent performance. 2 This implication, emerging directly from the prevailing theory of incentive plans, constitutes the null hypothesis against which next we propose a salience-based theory of incentive payments and their effects on performance dynamics.
The Role of Received Incentive Payments
Agency and expectancy theories accord employees the forward-looking ability to anticipate the benefits of their actions in light of a given incentive contract. We do not doubt that such a proactive logic can play a role in explaining the performance of an incentive plan. Yet, by focusing on incentives and the concomitant expectancy of future incentive payments as the source of employee motivation, these theories underemphasize the possibility that the eventual receipt of payment may have performance consequences of its own. Indeed, much like behavior can be proactively strategic and so driven by expected outcomes, as agency and expectancy theories assume, it can also be reactively responsive and so driven experientially by relevant stimuli. We argue that periodic incentive payments plausibly constitute such stimuli and elucidate how employees’ reactive responses to incentive payments can affect performance dynamics.
Any incentive plan has at least two related components, as it encompasses incentives and incentive payments. For as long as an incentive plan is in use, incentives exist in a preagreed form and so are present continuously. In contrast, incentive payments are, by their very nature, time variant because they are discrete, discontinuous compensation events that occur only periodically. In line with this observation, we conceptualize an incentive payment as a recurring temporal marker, meaning it is a recurring event that stands out to employees among other moments in time when no such payment occurs.
In their rather rational depiction of employee decision making, both agency and expectancy theories assume that at any point in time, employees pay full attention to the current and future expected costs and benefits when making decisions regarding the supply of effort (Lawler, 1973; Prendergast, 1999; Wabha & House, 1974). Yet, the fact that attention is a limited resource (Kahneman, 1973) raises the possibility that an incentive payment, in its role as a recurring temporal marker, can periodically bring such costs and benefits into sharper focus, much like the receipt of an electricity bill would periodically bring into sharper focus the marginal cost of electricity consumption (Gilbert & Graff Zivin, 2014). Thus, incentive payments may serve more than their primary purpose of rewarding prior performance; they may also constitute stimuli that periodically make the incentive plan more salient to employees.
Various studies underline the idea that the salience of organizational practices can vary, so that one might stand out and draw more attention. For example, Bowen and Ostroff (2004) suggested that practices may differ in how visible they are to employees, and Garg et al. (2021: 519) introduced the related notion of HR salience, meaning “the prominence of an HR practice in an employee’s cognitive field relative to other HR practices.” The salience of a practice may also vary over time, so that it stands out to different degrees at different points in time. While salience may increase when material changes to a practice are introduced (e.g., Jayaraman, Ray, & de Véricourt, 2016), variations in salience can also occur when the inner workings of a practice remain identical. For example, Englmaier et al. (2017), who studied an incentive plan at a large agricultural producer, argued that the incentive plan became more salient once employees received an unobtrusive note regarding the piece rate at the beginning of a shift, even though the note supplied no new material information and left the incentive plan unchanged. Thus, following our conception of incentive payments as recurring temporal markers, we propose that an incentive plan will be more salient to employees at and for some time after the moment at which they receive an incentive payment, even though the plan’s incentives remain unchanged.
The salience of an organizational practice is important because it makes a practice stand out. Thus, it directs employee attention and affects the degree to which information regarding that practice will be accessed and cognitively processed (DellaVigna, 2009; Fiske & Taylor, 2013; Garg et al., 2021; Ocasio, 2011). By implication, the salience of a practice can determine how employees respond to that practice. In our context, how then might employees respond if incentive payments periodically make the incentive plan more salient? On the view that an employment relationship has both an economic and a social dimension (Baron & Kreps, 2013; Shore & Barksdale, 1998; Tsui, Pearce, Porter, & Tripoli, 1997), we propose that employee responses may involve both incentivized and unincentivized outcomes through two distinct mechanisms that we call, respectively, salience-induced refocusing and salience-induced reciprocity.
Salience-induced refocusing
The intermittency of incentive payments drives a temporal wedge between employee performance and payment. This disconnect implies that employees may not always pay full attention to the marginal net benefit of task performance when they make decisions regarding the supply of effort. Thus, insofar as an incentive payment enhances the salience of the incentive plan, more attention may be drawn narrowly to behaviors prioritized in the incentive contract, so that the incentive payment simply reminds employees of the incentivized tasks. This way, like the unobtrusive reminder regarding the piece rate in Englmaier et al. (2017), the incentive payment leads employees to refocus their attention on, and become more responsive to, the incentives they face. By implication, the motivation to reinforce incentivized behaviors increases, so that employees’ performance on incentivized tasks improves. This first mechanism, salience-induced refocusing, operates insofar as a periodic incentive payment temporarily draws more employee attention to the economic dimension of their employment relationship.
These arguments imply that incentive payments, as recurring temporal markers, increase the salience of preagreed incentives at and for some time after the payment receipt, which periodically increases performance on incentivized tasks. Due to the discrete, discontinuous nature of incentive payments; the transience of human memory; and concomitant lapses in attention (Schacter, 1999; Tversky & Kahneman, 1974), we argue that a boost in incentivized task performance associated with the stimulus provided by an incentive payment will be temporary, so that performance always eventually reverts to the prepayment level.
Hypothesis 1: In an ongoing incentive plan, incentivized performance increases following an incentive payment and then reverts to the prepayment level.
Salience-induced reciprocity
While enhanced salience of the incentive plan may draw employee attention narrowly to the incentives they face, it may also increase attention broadly to the fact that the employer offers an incentive plan as an HR practice. Because an incentive plan gives employees some control over their income, the practice may be perceived as a benefit offered by the employer (Akerlof, 1982), which can elicit various positive reactions. For example, several studies have shown that employees working under an incentive plan (or similar) report higher levels of job satisfaction (Artz, 2008; Green & Heywood, 2008) and a greater commitment to and trust in their employer (Ogbonnaya, Daniels, & Nielsen, 2017; Shaw, Dineen, Fang, & Vellella, 2009; Shore & Barksdale, 1998). To the extent that an incentive payment periodically reinvigorates such positive perceptions and affect, employees may offer an in-kind response and reciprocate by exerting more effort to fulfill perceived reciprocal obligations toward their employer (Tsui et al., 1997).
Under salience-induced refocusing, employees pay more attention to incentivized tasks and, thus, the economic and more explicit dimension of the employment relationship. Instead, increased attention to the incentive plan as a perceived benefit emphasizes the implicit contract, which comprises the broader social dimension of the employment relationship (Rousseau, 1989). Within this social dimension, shorter-term economic motives can take a back seat to other considerations, such as the good will, loyalty, and commitment an employee may portray in response to benefits offered by the employer and, possibly, in anticipation of the recognition this may in return confer onto the employee (Cropanzano & Mitchell, 2005). Thus, given the more diffuse nature of the social dimension, employees’ responses to the enhanced salience of the “incentive plan as benefit” could extend beyond incentivized behaviors, to other behaviors valued by the employer (Coyle-Shapiro & Conway, 2005; Tsui et al., 1997). For example, employees may attend to the broader needs of the organization and improve performance on unincentivized tasks if they know them to be important for the performance of the organization, even if such unincentivized tasks generate no immediate returns to employees (Hom et al., 2009). This second mechanism, salience-induced reciprocity, operates insofar as a periodic incentive payment temporarily draws more employee attention to the social dimension of their employment relationship.
Under salience-induced reciprocity, incentive payments, as recurring temporal markers, temporarily heighten the salience of the “incentive plan as benefit,” which periodically increases performance on unincentivized tasks. Nevertheless, as under salience-induced refocusing, the discrete, discontinuous nature of incentive payments; the transience of human memory; and concomitant lapses in attention (Schacter, 1999; Tversky & Kahneman, 1974) lead us to expect that such a periodic boost in performance beyond incentivized tasks will also be temporary, so that in the end, performance always returns to the prepayment level.
Hypothesis 2: In an ongoing incentive plan, unincentivized performance increases following an incentive payment and then reverts to the prepayment level.
Summary of predicted dynamics
Figure 1 illustrates, in stylized form, the temporal dynamics implied by our hypotheses. The figure shows time on the horizontal axis and performance on the vertical axis. Performance trend, represented by a solid gray line, runs the length of the figure, representing how performance develops over time once the incentive plan is ongoing. This trend can have its own dynamics (e.g., due to seasonality), yet we show it as a horizontal line, so that the broken line, illustrating our hypotheses, shows deviations from the performance trend due to incentive payments. In the figure, an incentive payment increases performance, which subsequently declines until the next incentive payment stimulates another temporary increase in performance, and so on.
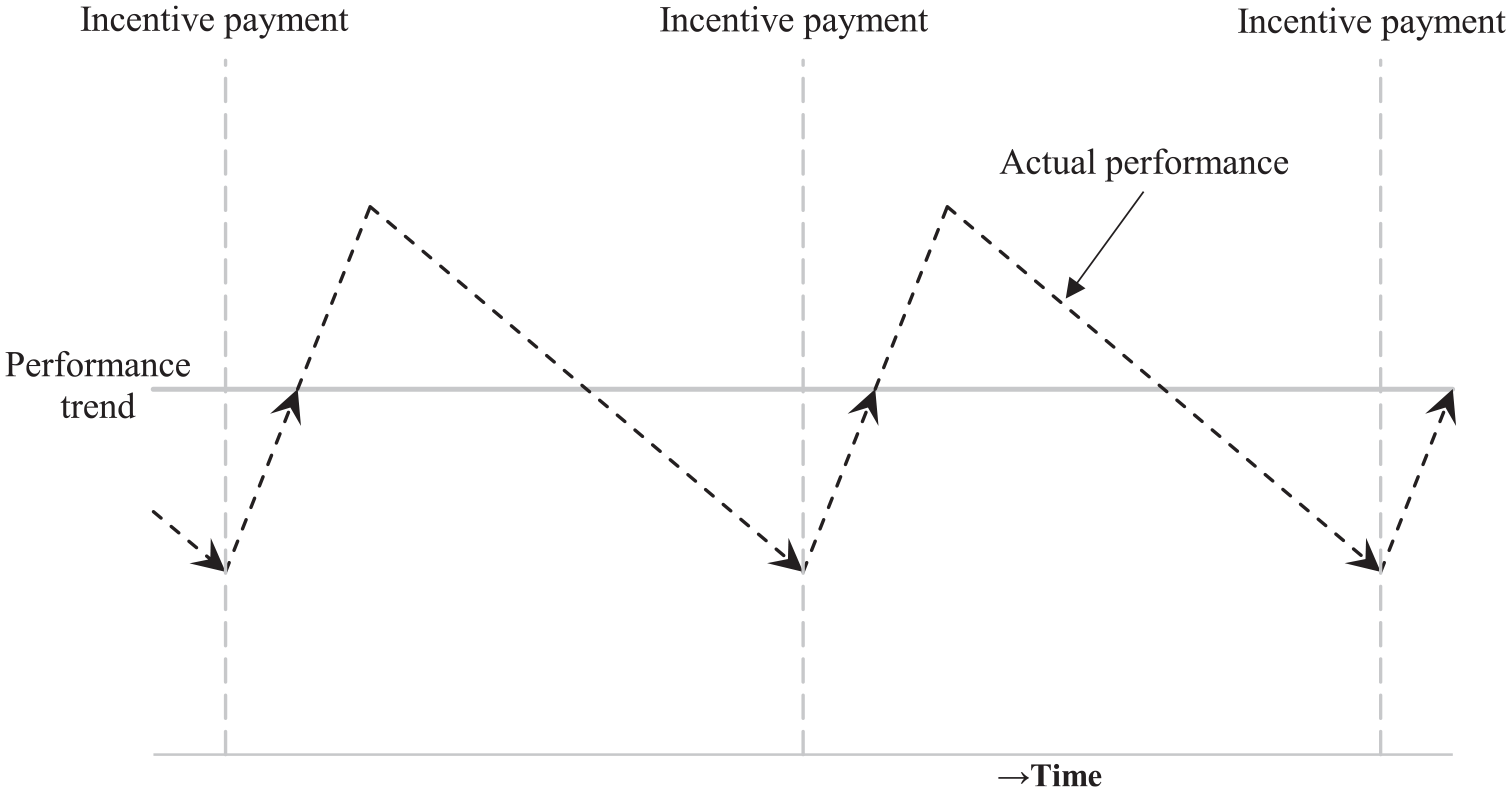
Hypothesized Performance Dynamics in Stylized Form
Duration of performance responses
The duration of the temporary increase in performance following an incentive payment may vary across outcomes, for example, depending on the extent to which they are under employees’ immediate control. In general, employee responses to an incentive payment likely follow the payment fairly readily on behaviors over which they have more control (e.g., picking fruit or answering a phone call). And such responses would wear off before the next payment arrives, provided that the payment interval is large relative to the time it takes to complete a “unit” of task performance. On outcomes outside of employees’ immediate control (e.g., sales performance), the incentive-payment effect on performance dynamics might (but need not) be delayed and last longer. Such possible heterogeneity in response duration constitutes an open empirical question, and we revisit this issue after presenting our empirical results.
Method
Setting and Sample
Our empirical study examines how incentive payments for a firm’s customer-support employees affect performance dynamics. Customer-support employees are critically important because often they are the only point of contact between a firm and its customers, certainly now that many firms predominantly use the internet to offer their products and/or services. This category of online firms represents a sizeable and growing share of the revenues in many industries. In U.K. retail, for example, more than 85% of online sales and over 40% of all sales in early 2019 derived from businesses without a permanent physical presence (Office for National Statistics, 2019). Typically, current or prospective customers engage with an online firm’s website, through which they can choose to interact with customer-support employees via media such as phone, email, or online chat. Fast responses and high service quality are crucial to such firms (e.g., Oldroyd, McElheran, & Elkington, 2011), and so, apart from their base salaries, customer-support employees often are subject to output-based incentives and individual incentive payments (Batt, 2002).
Here, we perform a quantitative analysis of a single firm, consistent with prior empirical studies on the consequences of incentive plans (e.g., Asch, 1990; Banker et al., 1996; Larkin, 2014; Lazear, 2000). We collected data from WebCo (a pseudonym), a private Greek online firm offering web hosting and domain name registration services to over 60,000 customers across more than 100 countries. Accredited by the Internet Corporation for Assigned Names and Numbers, WebCo is one of the leading domain name registrars in Greece, employing between 20 and 35 individuals during our sampling window. Because around 95% of all European firms in this industry (NACE category J63.1) employed fewer than 10, and 99% fewer than 50, employees (Eurostat, 2014), WebCo is large among its peers. The firm received several customer service awards, including Team of the Year for customer support, and was voted among the best workplaces in Greece.
We interacted extensively with WebCo’s management and personnel and negotiated access to weekly data on phone calls, emails, and chats; customer feedback; incentive payments; demand drivers; and sales performance spanning well over 3 years. The resulting firm-level data set for our empirical analysis spans 169 weeks (i.e., 39 months or 13 quarters), from January 3, 2011, to March 30, 2014. This sampling period covers a time when WebCo’s incentive plan was ongoing, employees believed that their individual performance would continue to be observed and rewarded in line with the incentive contract, and the nature and content of customer-support tasks were stable. We present our main analyses using weekly data (N = 169), which is the most granular aggregation at which we have complete data for all key variables. Weekly aggregation is appropriate because this is between 4 and 5 times the frequency at which incentive payments are calculated and settled, thus allowing us to trace dynamics between payments (Colicev & Pauwels, in press).
WebCo constitutes an empirical site particularly well suited for our purposes. Key constructs are consistently and longitudinally observable, and the bounded scope of WebCo’s activities ensures that the link between incentive payments and performance can plausibly be inferred from available data. Also, WebCo’s customer-support employees are subject to linear and stable incentives, which generates a time-invariant incentive pressure. By design, this eliminates as a confounding force the intertemporal effort reallocation and concomitant performance dynamics often observed under time-varying incentives, such as when firms reward employees only once they reach a quota (e.g., Asch, 1990), or when incentives change across evaluation periods (e.g., Brahm & Poblete, 2018). Next, incentive payments are based on explicit criteria directly tied to individual performance, and employees have continual access to their performance data, so they have an accurate sense of the magnitude of upcoming incentive payments. Thus, responses to incentive payments are attributable to the act of payment rather than the revelation of recent performance, which by design rules out reinforcement learning due to incentive payment. Finally, while incentive payments were calculated by calendar month, for idiosyncratic reasons, the payments occurred at irregular intervals of 3 to 7 weeks. This feature is crucial for us to be able to separate incentive-payment effects from the monthly evaluation cycle.
The time-series nature of our data offers additional advantages. First, the longitudinal analysis of one firm as it progresses through time exclusively exploits temporal variation in each variable and uses the firm as its own control, and so it holds constant time-invariant firm characteristics, such as the firm’s baseline reputation in the market, industry, geographic location, and organizational culture. Second, our longitudinal data set affords the use of time-series methods designed to examine temporal dynamics, our core focus.
Dependent Variables
Customer support at WebCo consists of a set of employees answering queries by current or prospective customers, all who themselves initiate contact with the firm. Thus, WebCo measured the performance of customer-support employees based on the quantity of answered phone calls and the quantity and perceived quality of answered emails and chats. Due to challenges in linking interactions with customer support to eventual orders (which customers placed on WebCo’s website), sales performance was not incentivized. However, by offering advice regarding what and how to order, customer-support employees played a crucial role in the sales process: They were tasked with giving customized assistance regarding suitable products and their features while also clarifying the order process where necessary. Thus, whether a customer seeking out interaction with WebCo through phone, email, or chat eventually placed an order, as well as the nature of that order, depended critically on the effort of a customer-support employee during that interaction. The HR manager emphasized this connection when explaining why the incentive plan was adopted in the first place: “We were . . . expecting better quality in customer service, which . . . leads to an . . . increase in sales.” As such, we measure performance as the weekly performance of customer-support employees on the specific tasks incentivized through the incentive plan (Hypothesis 1) and unincentivized weekly sales performance (Hypothesis 2).
Task performance
WebCo counted the number of phone calls attended, and we drew aggregated weekly numbers from the firm’s telephone records. Mindful of the fact that a count of attended calls represents a mere quantity measure, the management briefed the customer-support employees on the importance of (unmeasured) call quality for sales performance. While employees were told that phone calls might be monitored at any time, the firm did not systematically collect information on the contents of individual phone calls. Consistent with WebCo’s measurement, we capture employee effectiveness in dealing with emails and chats by counting the respective weekly numbers of answered emails and chats. The firm used emoticons to gauge customer feedback and rewarded employees for each received “smiley face.” Thus we, too, count positive feedback as the respective weekly numbers of email and chat encounters receiving a smiley face from customers.
We combine these five measures into one task performance variable, weekly task performance (TP t ), which is the first principal factor of the five measures, thus accounting for differences in the base rates of phone, email, and chat interactions. The index has a McDonald’s (1999) ω equal to 0.86, suggesting satisfactory reliability. We aggregate across employees because they work independently, and support requests keep up with the available capacity to respond. Thus, one employee’s effort does not reduce the rate at which another can earn incentive payments, so that aggregation generates a valid and readily interpretable task performance measure.
Sales performance
We measure sales performance using sales data drawn from WebCo’s financial records. Specifically, the variable sales revenues (S t ) captures weekly revenues in constant (January 2011) euros. In additional analyses, we substitute sales revenues with, respectively, the number of products and sales revenues per product. Number of products is the number of domains sold in a given week, and sales revenues per product is the average revenue per sold domain in a week, in constant (January 2011) euros. These measures help disentangle whether potential sales responses are due to changes in product quantity or revenues per product.
Independent Variable
Consistent with Prendergast (1999: 13), incentive payments at WebCo were a linear combination of the five performance measures that constitute task performance, with each of five measures carrying its own weight (i.e., its own “piece rate”). 3 We use data from financial records to measure incentive payment (IP t ) as the amount of incentive payment in a given week, expressed in constant (January 2011) euros. WebCo settled incentive payments retrospectively and at the same time for all customer-support employees, and payment occurred at intervals of 3 to 7 weeks. Payment intervals were asynchronous to the monthly calendar cycle, and payment followed task performance with a small but variable delay. For example, incentive payments related to task performance in February 2012 were settled on March 8, 2012, while those related to May 2012 were settled on June 29, 2012. This idiosyncratic feature of the incentive plan contributes toward identifying the dynamic response of performance to incentive payments. We attribute incentive payments to weeks in which payment found place and set incentive payment to zero in the other weeks. Incentive payments averaged around 10% of employees’ monthly base salaries, which passes the 5% to 7% threshold above which employees are more likely to perceive a pay change as meaningful (Mitra, Tenhiälä, & Shaw, 2016; Worley, Bowen, & Lawler, 1992).
Control Variables
Apart from the theory-testing variables, our analysis also includes several control variables. Due to the Great Recession, many businesses opened or moved online to limit fixed costs and so required domain name and web-hosting services. Thus, WebCo offered good job security, which resulted in a virtually unchanged set of customer-support employees: One person was added mid-2011, yet no one exited customer support in 2011 to 2014. Expansion (ED t ) is a dummy set to 1 in and after the week in which one member was added to customer support.
At WebCo, both task and sales performance directly depend on demand, and so we account for a rich set of demand drivers. The market-oriented activities that online firms use to influence demand typically cover both paid channels, such as search advertising (Wiesel, Pauwels, & Arts, 2011), and channels the firm “owns,” such as accounts in social media platforms, like Twitter (Gong, Zhang, Zhao, & Jiang, 2017). WebCo engaged in search advertising through Google AdWords and in social media activity through Twitter. Using data from WebCo’s financial records and Google AdWords account, we measure AdWords (AW t ) as the weekly amount of money committed to Google AdWords, expressed in constant (January 2011) euros. We use Twitter archives to measure tweets (T t ) as the firm’s weekly number of tweets on Twitter.
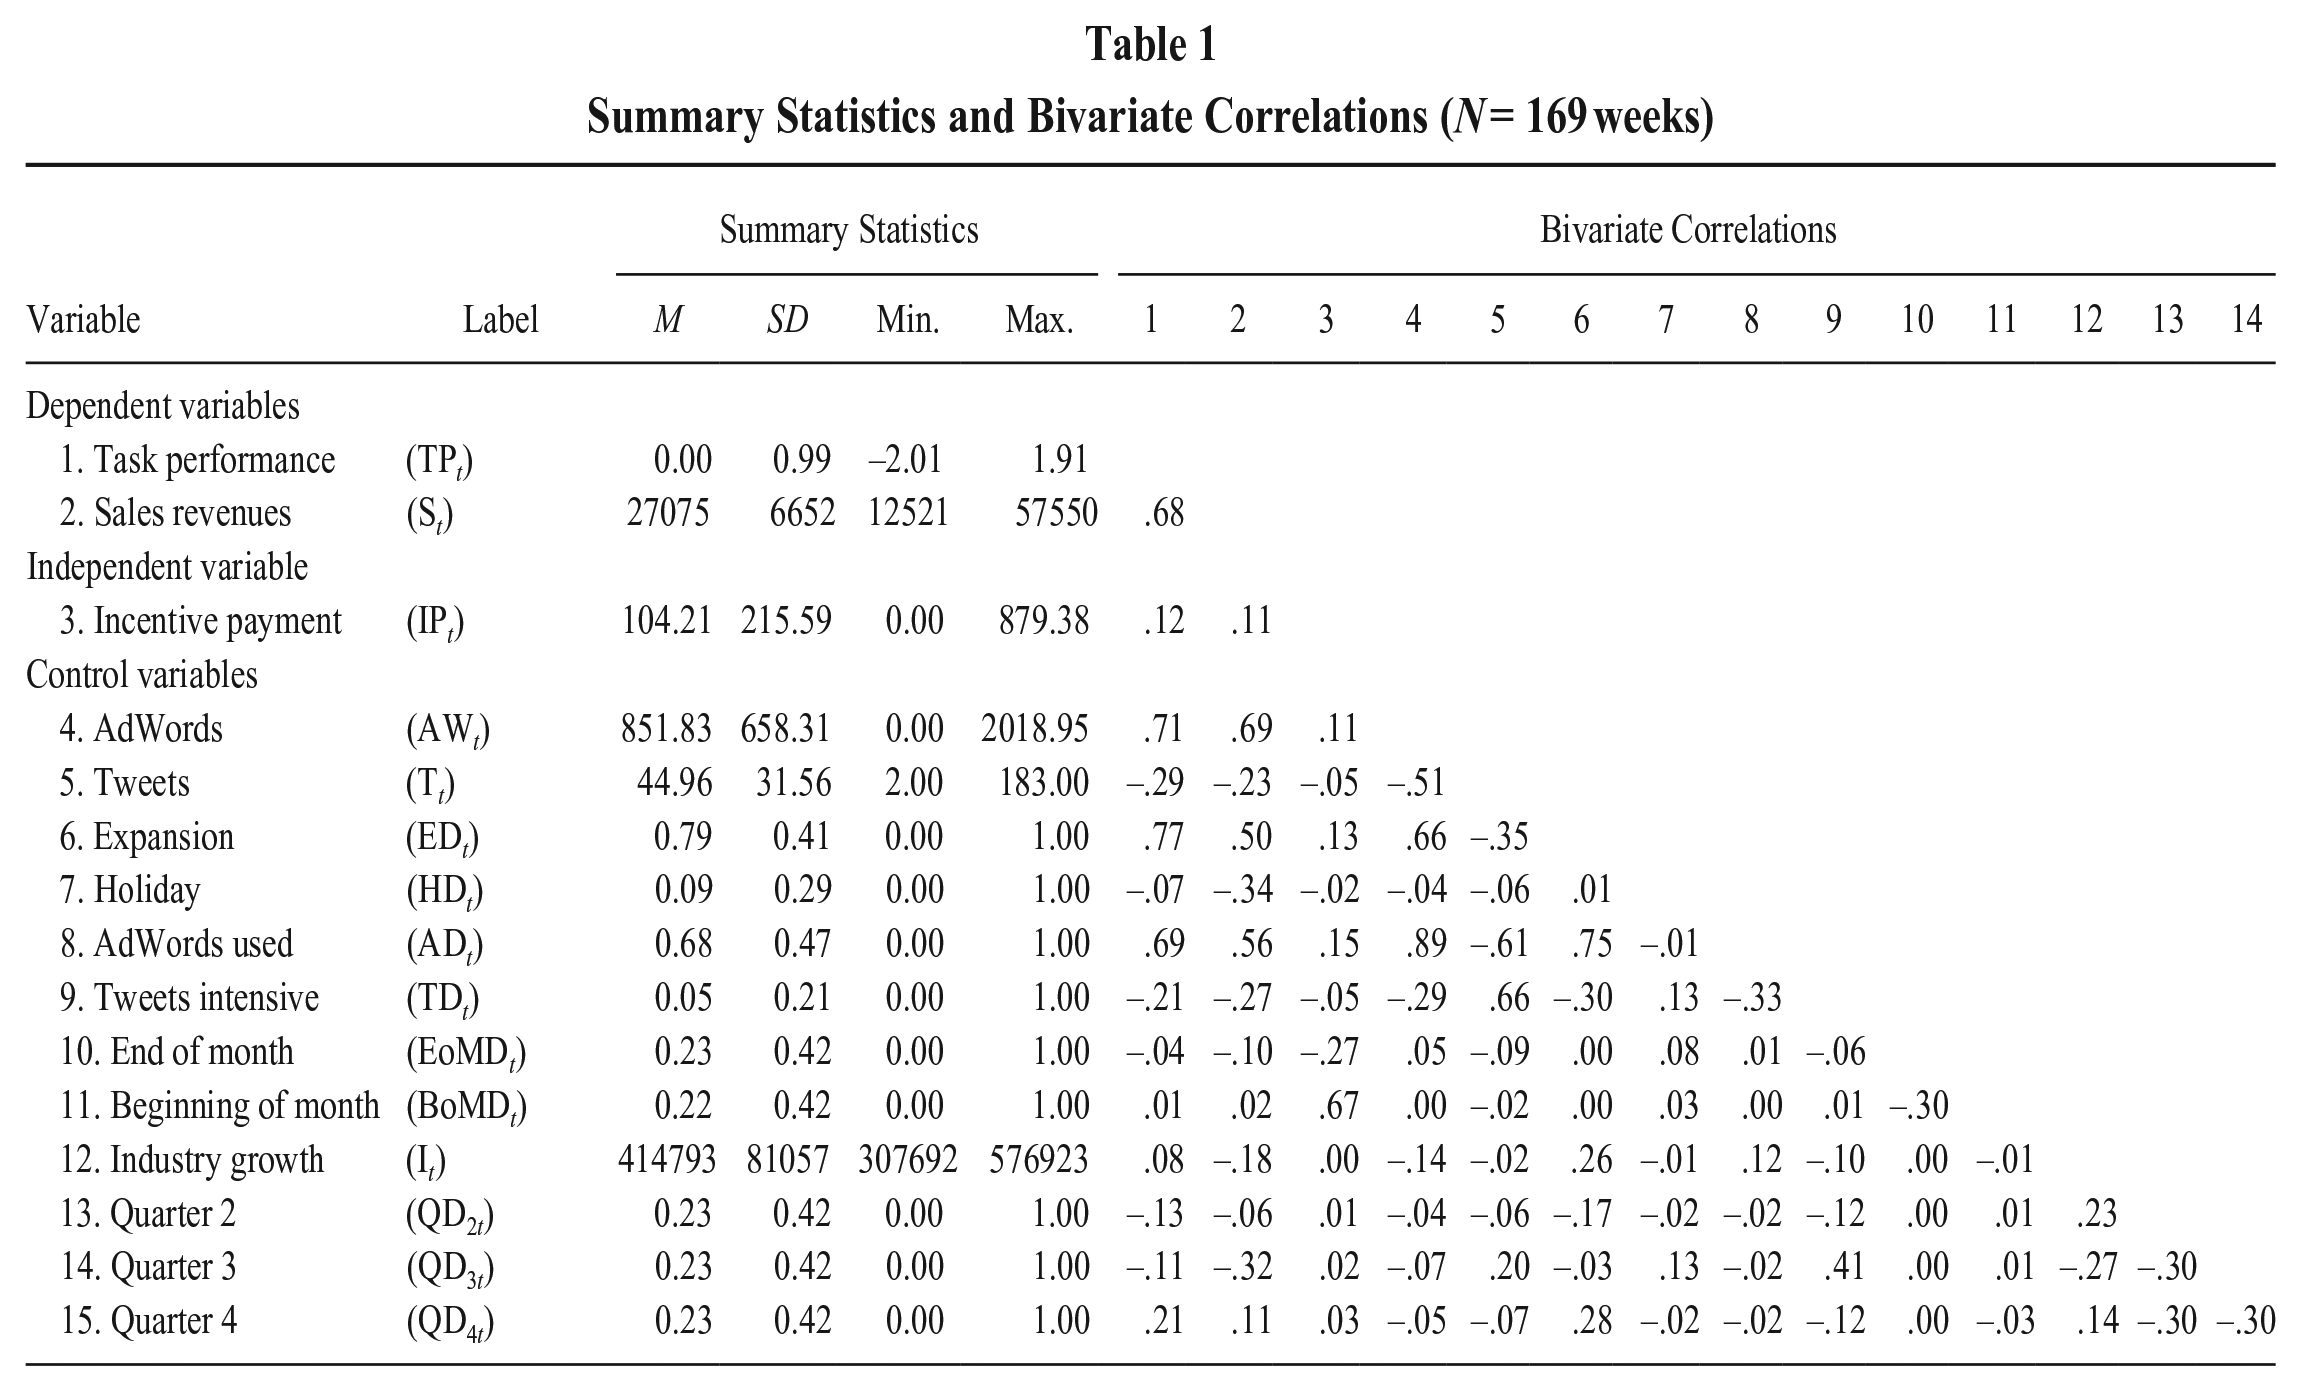
While demand depends on factors under a firm’s direct control, it also depends on external forces. Holiday (HD t ) is a dummy capturing whether a given week is part of the 2 weeks of public holidays in August, the weeks of Christmas and New Year’s, or the week following Easter Sunday. To account for turn-of-the-month effects, end of month (EoMD t ) and beginning of month (BoMD t ) are dummies for whether a given week is, respectively, the last full week or first week of the calendar month. Industry growth (I t ) captures the worldwide number of new domain name registrations in a given week, to account for expansion of the domain name market. We collected data on new domain name registrations from Verisign’s quarterly domain name industry briefs (Verisign, n.d.) and attribute quarterly numbers to weeks in equal proportions. Finally, we control for seasonal demand effects with a vector of quarterly dummies (QD qt ) for Quarter 2 (April to June), Quarter 3 (July to September), and Quarter 4 (October to December). Table 1 shows summary statistics and bivariate correlations for all variables in raw form (i.e., prior to detrending).
Summary Statistics and Bivariate Correlations (N = 169 weeks)
Modeling Approach
Our goal is to identify the impact of incentive payments on the dynamics of performance, which generates several modeling requirements. First, the model must allow for both immediate and delayed effects of incentive payments on performance. Second, it should allow for a dynamic counterfactual capturing how performance would have developed had incentive payment not occurred. Finally, the model must account for the fact that not just performance, but also incentive payment and other variables, can be endogenous, meaning they may be explained by their own past or the past of other variables. Such endogeneity may be due to factors like reverse causation (e.g., past performance affecting current incentive payments through its effect on employee morale), inertia (e.g., anchoring current advertising expenditures in last week’s expenditures), or resourcing trade-offs (e.g., reducing advertising expenditures when incentive payments are settled).
Based on these requirements, we use a vector autoregression (VAR) modeling approach (Colicev & Pauwels, in press; Lütkepohl, 2005). This multivariate time-series approach is well established in adjacent literatures, including macroeconomics (e.g., Sims, 1980) and marketing science (e.g., Dekimpe & Hanssens, 1995; Wiesel et al., 2011) and ideally suited for our focus on incentive payments and performance dynamics: It allows for both immediate and delayed performance effects, it supplies a dynamic counterfactual performance baseline, and it allows us to model time-series endogeneity. Our implementation of this modeling approach has four steps:
A VAR model requires an a priori decision on which variables will be treated as endogenous, and so modeled as longitudinally interdependent with other variables, and which variables will instead be assumed exogenous.
VAR is based on linear regression and requires that the variables chosen as endogenous in Step 1 are stationary, meaning they must fluctuate around a fixed mean. Stationarity is essential to avoid spurious regression results (Granger & Newbold, 1974). Thus, we perform unit-root tests on the endogenous variables to assess whether each is stationary or evolving, which will determine whether transformations are necessary to achieve stationarity prior to model estimation in Step 3. For example, if a unit-root test reveals that a variable fluctuates around a trending mean, then we must detrend that variable before estimation.
Using linear regression, we estimate the VAR model of dynamic relations among the endogenous variables while accounting for all exogenous variables.
Based on the estimated VAR model, we subsequently evaluate our hypotheses by quantifying the direction, dynamics, and precision of immediate and delayed changes in performance attributable to a periodic incentive payment.
We cover Steps 1 to 3 directly in the following, after which we introduce the methodology for Step 4. We present the implementation of Step 4, hypotheses testing, in the Results section.
Step 1: Choosing endogenous and exogenous variables
Task performance and sales revenues are our two main dependent variables, and so we naturally treat them as endogenous. Yet, VAR also allows variables traditionally labeled as “independent” and “control” variables to be modeled statistically as endogenous. We selected endogenous and exogenous variables based on several considerations. First, all external demand drivers (holiday, end of month, beginning of month, industry growth, and the quarter dummies) by nature are exogenous. Second, because expansion changes only once, it is deterministic from a time-series perspective, and so we treat it as exogenous. Third, we treat incentive payment, our key predictor, as endogenous because it is a delayed function of past task performance, which is itself endogenous. Finally, the two remaining variables, AdWords and tweets, are demand drivers under WebCo’s direct control, and investments in either may depend, for example, on past investments, incentive payments, or recent performance. Thus, we treat them as endogenous.
Step 2: Unit-root tests
We perform unit-root tests to assess whether each of the five endogenous variables (i.e., task performance, sales revenues, incentive payment, AdWords, and tweets) are stationary or evolving. A stationary variable is said to have no unit root, while an evolving variable has a unit root, implying it does not revert to a fixed or trending mean. Table 2 shows test statistics for the standard augmented Dickey-Fuller (ADF) test that accounts for an intercept and a deterministic trend. The tests reject the unit-root null hypothesis for all variables, and in virtually all cases, small p values suggest we can reject the null of no deterministic trend. One inference from these tests is that the two performance outcomes, task performance and sales revenues, are stationary around a linear trend, and so both always revert to their trending means, so that any performance dynamics attributable to incentive payments will be temporary.
Augmented Dickey-Fuller Unit-Root Tests (N = 169 weeks)
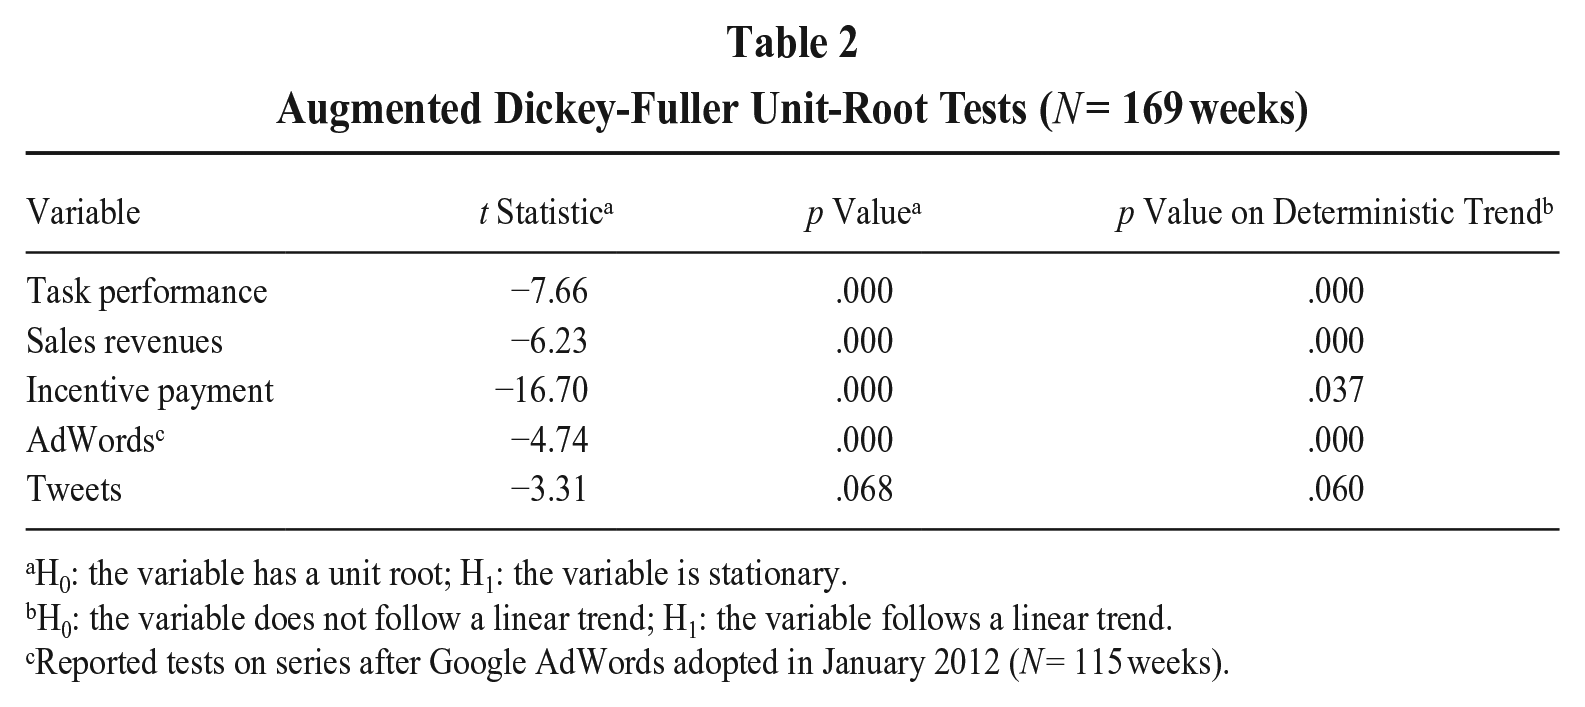
H0: the variable has a unit root; H1: the variable is stationary.
H0: the variable does not follow a linear trend; H1: the variable follows a linear trend.
Reported tests on series after Google AdWords adopted in January 2012 (N = 115 weeks).
Three issues require further explanation. First, the unit-root test for AdWords concerns the period starting January 2012, when WebCo adopted AdWords. In the VAR model (Step 3), we account for this one-off increase in AdWords through AdWords used (AD t ), a dummy capturing whether, in each week, the firm uses Google AdWords.
Second, in Table 2, tweets is not as inconsistent with the unit-root null hypothesis as the other variables (p = .068). This might be because the time series for tweets shows an 8-week period of more intense activity in 2011, during which WebCo posted an average of roughly 138 tweets per week, compared with about 40 per week throughout the remainder of the sampling window. Such a temporary shift of the mean could errantly suggest a variable is evolving (Perron, 1989). Thus, we retested for a unit root in tweets using a variation of the ADF test accounting for the sudden increase and subsequent drop in the level of tweets between end of July and mid-September 2011 (Clemente, Montañés, & Reyes, 1998), which resulted in a t statistic of −5.672 (.025 < p < .05; Clemente et al., 1998, provide the relevant critical values). Thus, tweets is stationary provided we account for the temporary shift in its mean. In the VAR model (Step 3), we achieve this by adjusting for tweets intensive (TD t ), a dummy capturing whether a week is fallen in the short period of relatively intensive Twitter activity.
Third and finally, all five endogenous variables are stationary around a deterministically trending mean, and so we enter them in detrended levels into the VAR model. Specifically, we remove the effect of a deterministic, linear trend t from each of the endogenous variables Yi, so that their detrended levels are simply the respective residuals yi, t of Yi, t = c0 + c1t + yi, t .
Step 3: VAR model
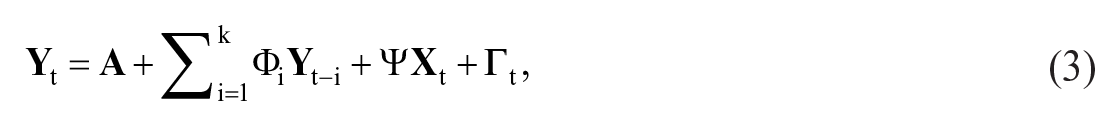
The unit-root tests suggest we can specify a VAR model with five endogenous variables all entering in detrended levels. The VAR model is as follows:

where μ are intercepts; the variables are as defined earlier; t indexes weeks; β, γ, and δ are the parameters to be estimated; the variance-covariance matrix of the residuals
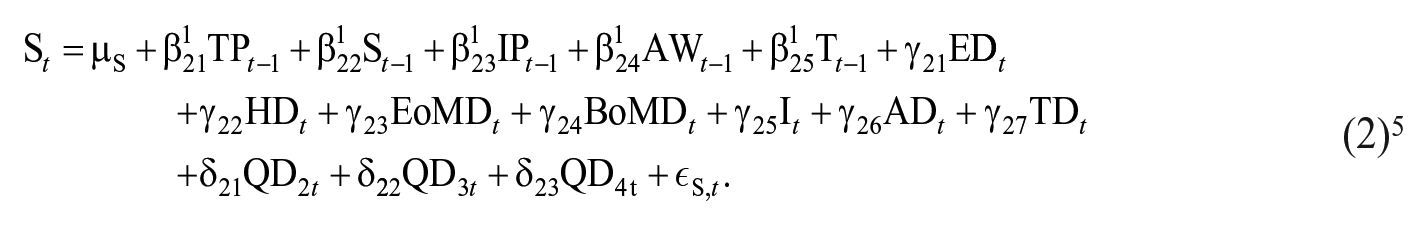
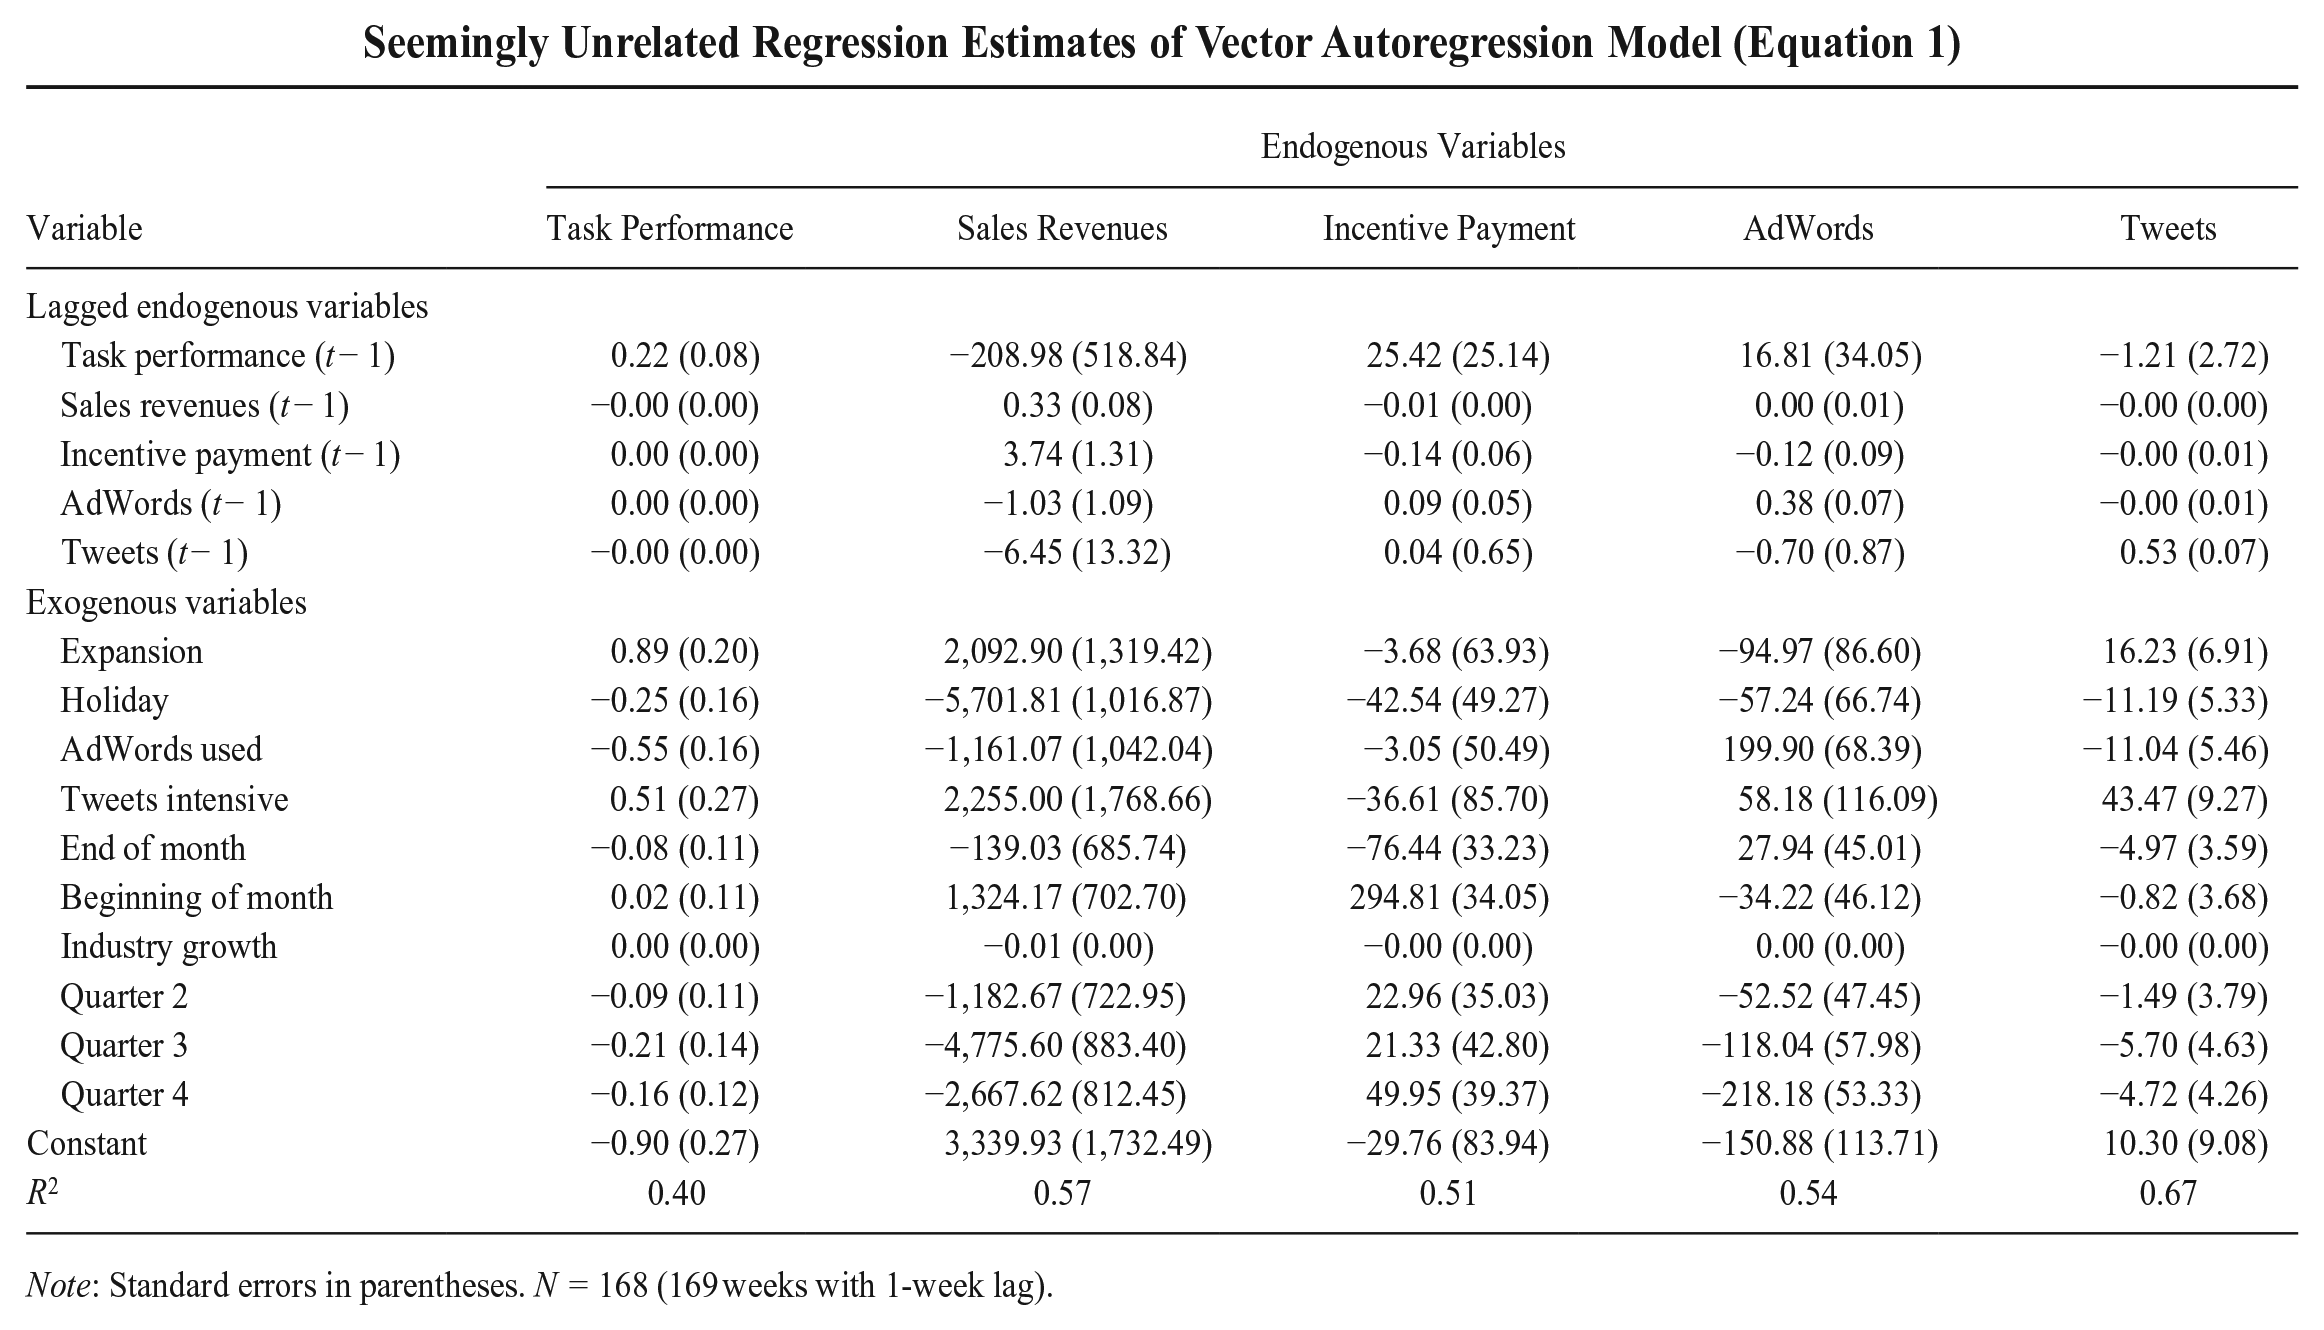
The system in Equation (1) implies similar equations for the other four endogenous variables. Therefore, temporal variance in each endogenous variable is a function of the variable’s own lagged value, the lagged values of all other endogenous variables, a vector of exogenous variables, and an error term, and so the VAR model captures the full dynamic system of relations among the variables. We estimate the system in Equation (1) using conventional seemingly unrelated regression, and Appendix A shows the point estimates.
Step 4: Hypotheses testing
The full dynamic performance effects of incentive payments cannot be inferred from single coefficients in the regressions comprising the VAR model (e.g., Lütkepohl, 2005). Instead, we follow the prevailing approach in the time-series literature and use generalized impulse response functions (GIRFs) to establish the direction, dynamics, and precision of the incentive-payment effects on performance (Pesaran & Shin, 1998). A GIRF isolates the differential impact of an exogenous “impulse” (e.g., a one-standard-deviation increase) in a predictor on an outcome variable. Based on the VAR coefficients from Step 3, two predictions are calculated for each of the two dependent variables: One is based on the information set without the impulse in the hypothesis-testing variable, and the other accounts for the impulse. The difference between these two predictions then supplies the GIRF—that is, the incremental, week-to-week effect on the outcome due to a simulated impulse in the predictor.
To test our specific hypotheses, we focus on the effect of incentive payments on task and sales performance. For each week for which a prediction is generated, the GIRF enumerates how an impulse in incentive payment affects these performance outcomes compared with their dynamic counterfactual performance baselines. If the GIRFs show that performance changes following an impulse in incentive payment, then performance is reactively responsive to the payment, implying that the payment may be viewed as contributing to performance (Lütkepohl, 2005).
To account for uncertainty surrounding the point estimates for the weekly impulse responses, we derive response standard errors through Monte Carlo simulations with 1,000 iterations. We apply two-standard-error bounds to the point estimates, following the VAR literature (e.g., Sims & Zha, 1999) as well as standard practice in VAR applications in economics and finance (e.g., Bloom, 2009; Kelly & Jiang, 2014) and marketing science (e.g., Wiesel et al., 2011). When graphing the GIRFs, the horizontal axis captures the dynamic counterfactual performance baseline absent the impulse in incentive payment. Thus, we consider the estimated values of the weekly impulse responses to be progressively less consistent with the null hypothesis the further this horizontal axis falls outside the error bounds surrounding the impulse responses.
Results
Descriptive Evidence
Figure 2 shows average weekly performance surrounding the weeks in which incentive payments took place, aggregated across the 169-week sampling window. The horizontal axis depicts the time from 2 weeks before to 2 weeks after the incentive payment, and the vertical axis depicts average weekly performance. To permit a comparison between the two performance outcomes, we normalized both performance lines around the respective average task or sales performance during t − 2 to t + 2, and we show deviations from the average in standard deviations.
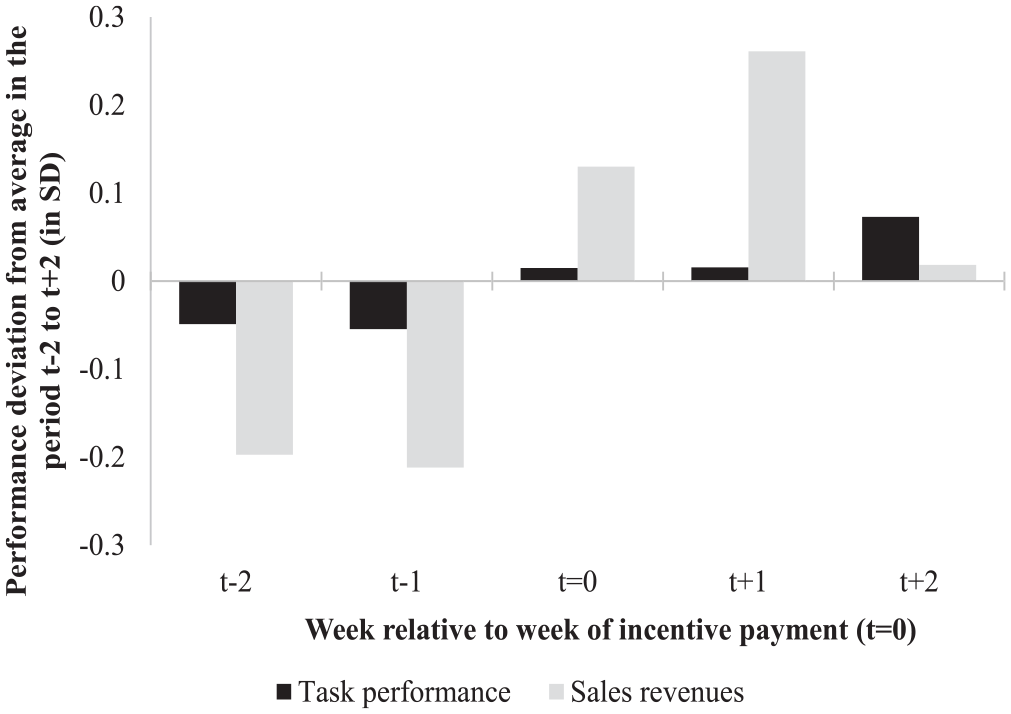
Performance Around Week of Incentive Payment (Averaged Across 169 Weeks)
The figure shows that task performance increases only marginally, while sales revenues shows a clear pattern and is relatively lower before the incentive payment yet increases and then decreases in the weeks that follow the payment. These simple averages suggest a pattern for task performance that is more consistent with the null hypothesis rather than Hypothesis 1, while sales revenues behaves in ways inconsistent with the null yet consistent with Hypothesis 2. As per modeling Step 4, we next turn to a multivariate assessment of our two hypotheses, where for inference we rely on GIRFs derived from the empirical estimates of Equation (1).
Hypotheses Tests
Task performance
To test Hypothesis 1, Figure 3 shows the GIRF capturing the response of task performance (in standard deviations) to a simulated one-standard-deviation impulse in incentive payment. The horizontal axis, representing the counterfactual performance baseline, consistently lies well within the error bounds of the performance response, and so we find no evidence of meaningful changes in task performance attributable to the incentive payment. Separately, a Granger (1969) causality test did not reveal that incentive payment contains unique information about subsequent task performance, χ2(1) = 0.11, p = .740, and so we find no evidence suggesting predictive causality from incentive payment to task performance.
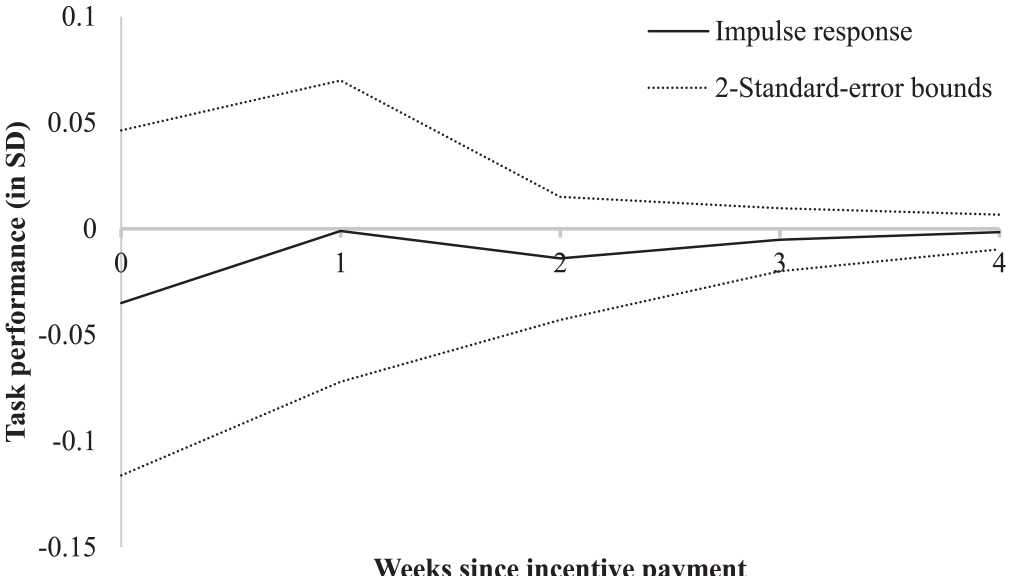
Response of Task Performance in Weeks 0 to 4 to One-Standard-Deviation Impulse in Incentive Payment in Week 0
We also examined VAR specifications disaggregating task performance into (a) a quantity (numbers of calls, emails, and chats) and a quality (emails and chats with positive customer feedback) component and, more granularly, (b) its five constituent measures. Both these supplementary analyses allow for possible multitasking trade-offs, which could lead to the substitution of effort between quantity and quality narrowly or among the five tasks broadly (Holmström & Milgrom, 1991). Yet even when directly modeling such possible trade-offs, no systematic differences existed in how disaggregated measures of task performance responded to the incentive payment. For each, we consistently found a null effect like that shown in Figure 3 (see Figures B1 and B2, respectively, in Appendix B). 6
At WebCo, customer-support employees work independently, and the demand for customer support is abundant, so that one employee’s effort is independent of the potential effort and incentive payments of others. Thus, the effect in Figure 3 does not reflect demand constraints, which would force one employee’s increased task performance to be associated with a reduction in another’s. However, heterogeneity may exist in how employees respond to the receipt of an incentive payment, which could occur in offsetting ways that accumulate to the null effect shown in Figure 3. We managed to obtain some individual-level data, which suggested time-invariant differences in the level of task performance while not suggesting evidence of systematic individual heterogeneity in the performance response to incentive payments.
Finally, we explored whether task performance revealed more granular dynamic responses to incentive payment in the days after payment. Specifically, using the sample of all 1,183 days (i.e., 169 weeks × 7 days), we fitted a VAR model of the form
where
Sales revenues
To test Hypothesis 2, Figure 4 shows the GIRF capturing the response of sales revenues (in standard deviations) to a simulated one-standard-deviation impulse in incentive payment. The figure shows that an impulse in incentive payment has an immediate (i.e., same-week) effect on sales revenues yet also subsequently improves performance in the following week, after which the impulse response wears out, so that performance becomes gradually indistinguishable from its baseline. Also, a test for Granger causality revealed that incentive payment contains unique information about subsequent sales revenues, χ2(1) = 8.12, p = .004, which means that predictive causality exists from incentive payment to sales revenues. Finally, variance in incentive payment explains 5.2% of the time-series variance in sales revenues, which is over 40% of the variance in sales revenues not explained by its own past. 7 Thus, while we did not find an effect of incentive payment on incentivized performance, we do find a temporary and positive effect on unincentivized sales performance, which is consistent with Hypothesis 2.
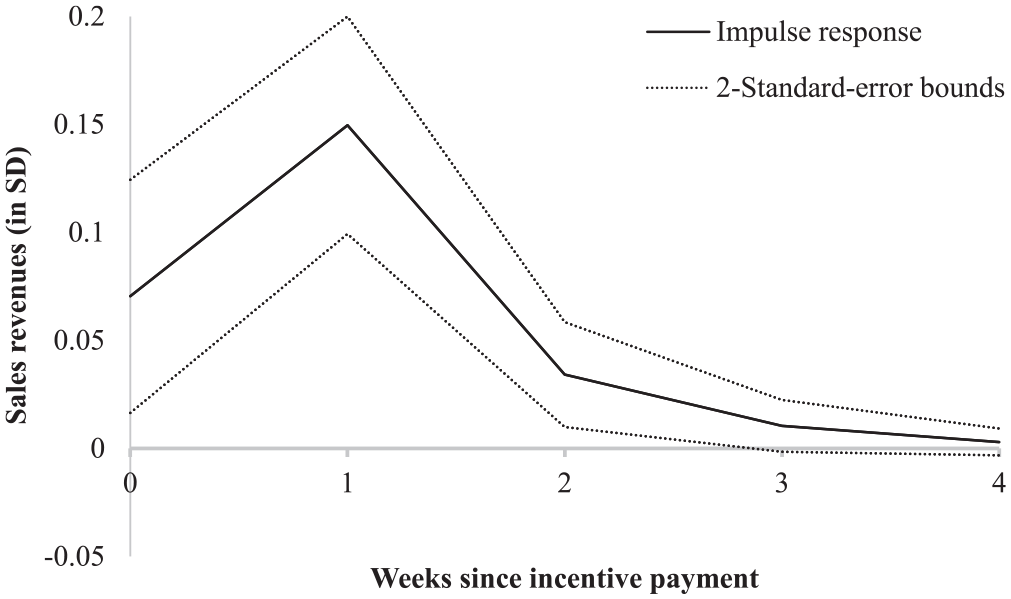
Response of Sales Revenues in Weeks 0 to 4 to One-Standard-Deviation Impulse in Incentive Payment in Week 0
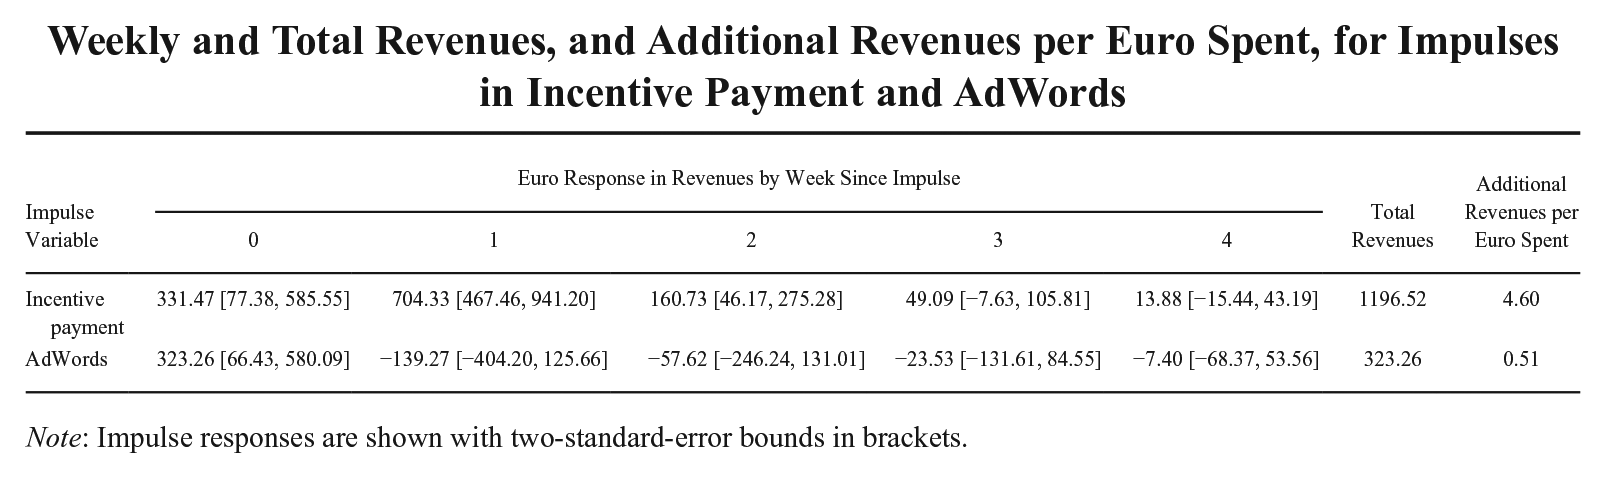
What percentage of sales revenues is attributable to employees’ reactive responses to incentive payments? A back-of-the-envelope calculation suggests that incentive payments contribute about 1.8% to total sales, which is the amount of euros spent on incentive payments multiplied by €4.60, representing the additional revenue per euro spent on such payments, divided by aggregate sales revenues. A similar calculation for Google AdWords, which contributes an estimated revenue of €0.51 per euro spent, reveals this percentage to be 1.6% of total sales. 8 AdWords is a particularly useful comparison because online firms, like ours, view search advertising as an essential and effective tool to enhance revenues. Thus, the aggregate contribution of incentive payments to sales revenues is meaningful because it is comparable to that of search advertising, even though AdWords spending occurs weekly, while incentive payments occur only once every 3 to 7 weeks.
Alternative Model Specifications
Before probing the mechanism underpinning the sales response (Figure 4), we assessed robustness in three different specifications of Equation (1). First, we omitted AdWords and tweets as endogenous demand drivers. Second, we extended the lag length k to 2 weeks, which allowed direct effects to carry across multiple weeks. This might occur if employees delay their response to the incentive payment or if customers wait longer before making a purchase decision. Third, we incorporated the dispersion of incentive payments across employees (i.e., max. – min.) as a sixth endogenous variable. Payment dispersion may affect employee envy and morale through social comparison and could confound the incentive-payment effect (e.g., Nickerson & Zenger, 2008; Shaw, 2014). Across the three specifications, our inferences regarding the effects of incentive payment on the dynamics of task performance and sales revenues remain fully intact.
Probing the Mechanism Underlying the Sales Revenues Effect
To examine in more detail the dynamic sales response to an incentive payment (Figure 4), we exchanged sales revenues for the number of products and sales revenues per product and twice reestimated the VAR model in Equation (1). Figure 5 shows the resulting GIRFs for these alternative measures (in standard deviations) with respect to a one-standard-deviation impulse in incentive payment. The figure shows that the number of products increases in the week following incentive payment, although the increase is short-lived. Sales revenues per product increases in the week in which the incentive payment is settled, it increases further afterward, and returns more slowly to its baseline than number of products. Thus, the sales effect of an incentive payment seems due mostly to a temporary increase in revenues per product, suggesting that the payment influences interactions with customers in ways that cannot be traced to the five incentivized tasks.
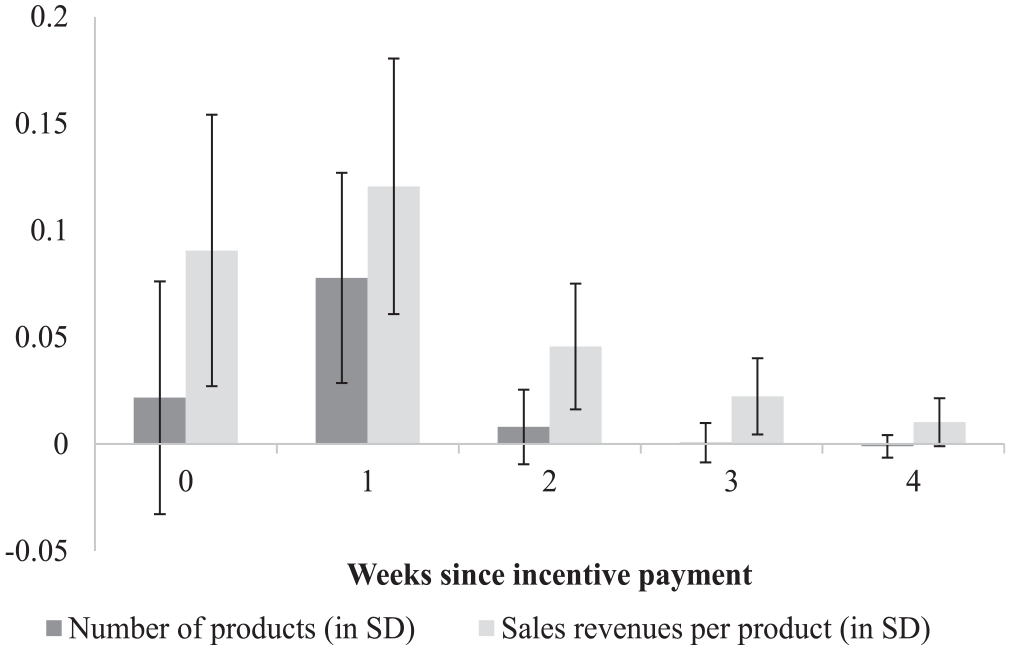
Responses of Number of Products and Sales Revenues per Product in Weeks 0 to 4 to One-Standard-Deviation Impulse in Incentive Payment in Week 0
On average, customer phone calls arrived at almost 20 times the frequency of emails and over 90 times the frequency of chats. Thus, based on volume as well as insights derived from our interviews with management and personnel, phone was likely an important medium through which the temporary increase occurred in revenues per product and thus aggregate sales revenues. Such sales effects were not incentivized, yet customer-support employees were briefed and so aware that management deemed call quality important for sales, that such quality was not directly incentivized, yet that calls might be monitored at any time. Combined with the fact that employees at WebCo care about their employer’s esteem, the more informal incentive pressure surrounding call quality plausibly generated a response to incentive payment on that aspect of the set of tasks performed by the customer-support employees.
While we do not have data directly capturing call content and quality, according to the HR and sales managers as well as the customer-support employees, call duration is the closest available proxy, and it was understood that even slight changes in call duration could go a long way. 9 To assess this channel more systematically, we obtained daily information on average call duration. Using the sample of all 1,183 days, we reestimated Equation (3) after substituting average call duration for task performance, where average call duration is the average call duration in seconds, and we included lags up to 4 days based on an evaluation of information criteria.
The solid line in Figure 6 shows the GIRF capturing the daily response of average call duration (in standard deviations) to an incentive payment. The figure shows a systematic increase and subsequent decrease in average call duration—a sizeable temporary burst readily following the incentive payment. 10 A Granger causality test reinforced that predictive causality exists from incentive payment to average call duration, χ2(4) = 13.25, p = .010, meaning that incentive payment explains variation in subsequent call duration that is not explained by lagged call duration or any of the other predictors.
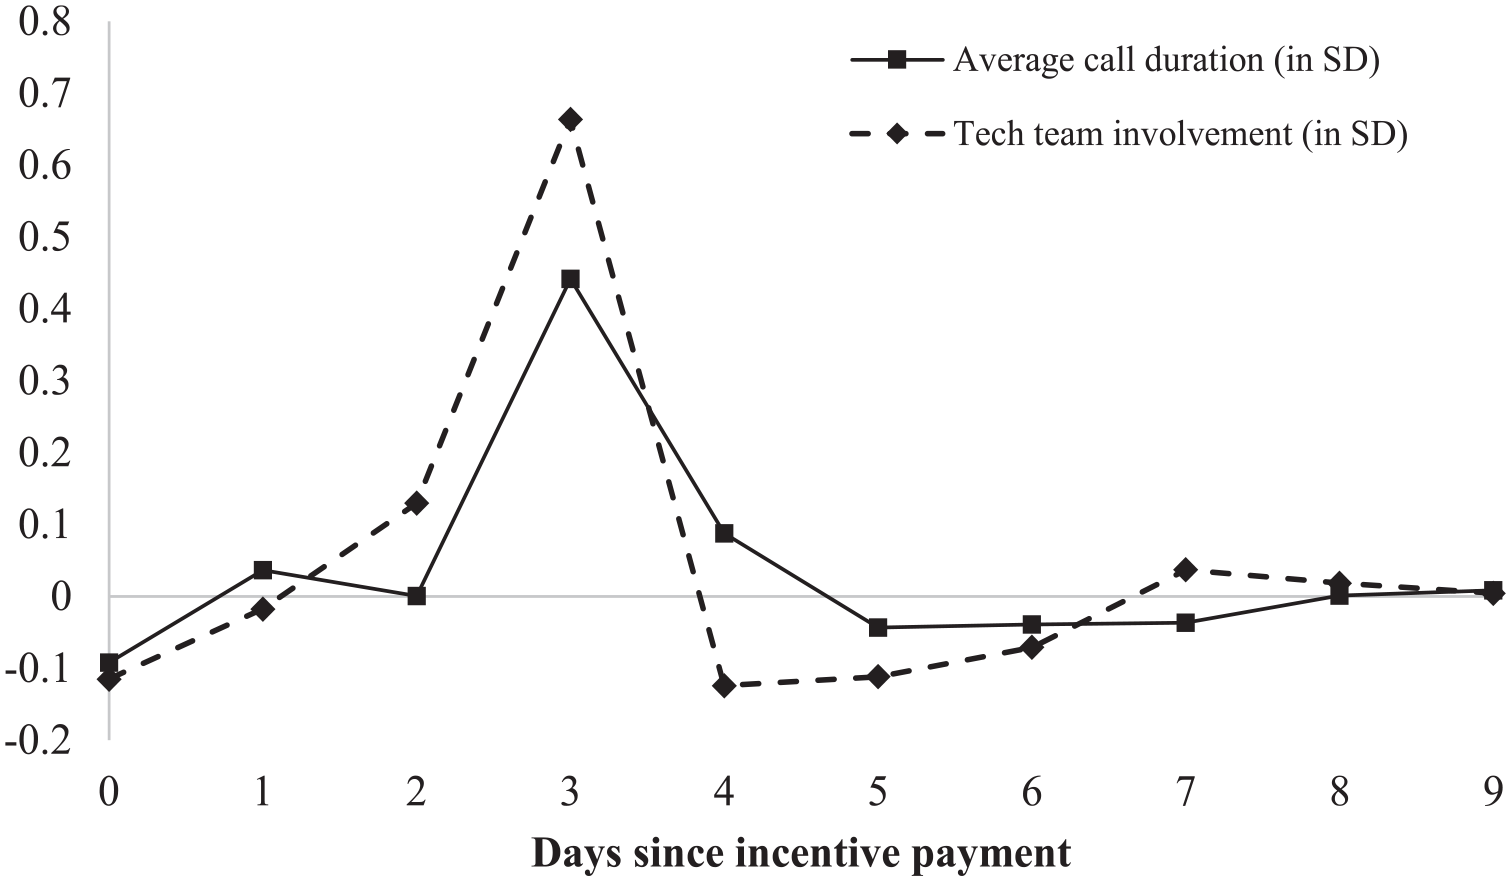
Responses of Average Call Duration and Tech Team Involvement on Days 0 to 9 to Incentive Payment on Day 0
Consistent with the theory underpinning Hypothesis 2, our fieldwork reflects that the receipt of an incentive payment reminded employees not of the incentives so much as it increased attention to the fact that the employer offered the incentive plan as a benefit—or as one employee put it, “the initiative to provide something more . . . [the feeling that] your employer wants to give something back to you for the good job you’re doing. This is something . . . incentivizing for me.” Moreover, when asked why particularly unincentivized outcomes responded to the incentive payment, a different employee noted, “I am a team player, a ‘family’ member . . . [and] I am going to prove it to you guys, I am going to give more effort. . . . It [is] mostly to help out the company.” What also surfaced was a hesitation to focus too overtly on incentivized tasks to the possible detriment of unincentivized tasks, not out of fear but to avoid letting down the employer: Our team wasn’t comprised of members that were doing it (improving the call experience) . . . not to lose their job or anything like that. I don’t think we ever had somebody on board that would have that kind of mentality. . . It’s about . . . I do not want to look bad to my employer.
Employees also referred to the greater emphasis they would temporarily place on probing customer needs and appropriate solutions, for example, when noting, “[We] are more eager to [give] a better service to the client and try harder to find what suits the [client] and what [are] actually their needs, and try to investigate more . . . try to provide the correct solution.” This insight led us to collect and hand-code other daily data on whether the firm’s tech team was involved in confirming appropriate customer solutions. Using these data, which were available from October 2011 to June 2013 (N = 647 days; ~92 weeks), we again reestimated Equation (3) after substituting tech team involvement for task performance, where tech team involvement is the number of times the tech team helped confirm customer solutions, and including lags up to 3 days.
The broken line in Figure 6 shows the GIRF capturing the daily response of tech team involvement (in standard deviations) to an incentive payment. The figure shows a systematic increase and subsequent decrease in tech team involvement—a sizeable temporary burst readily following the incentive payment that closely resembles the response of average call duration. Here, too, a Granger causality test underlined that predictive causality exists from incentive payment to tech team involvement, χ2(3) = 10.27, p = .016, implying that incentive payment explains variation in subsequent tech team involvement that is not explained by lagged tech team involvement or any of the other predictors.
Finally, we can now compare Figure 6 with Figures 4 and 5. Evidently, responses on intermediate outcomes—that is, the duration of calls and involvement of the tech team—wear off more quickly than responses on dimensions of sales performance, the latter of which are outside of employees’ immediate control. For example, after an interaction with customer support, customers can take time to deliberate before placing an order, and this period may vary across customers, so that sales performance on average lags the active involvement of customer-support employees. Thus, one might plausibly infer that employees’ degree of control over outcomes matters for the duration of temporary performance responses.
Summary of the Evidence
The empirical estimates and fieldwork together suggest that the employees, as a temporary response following the periodic receipt of an incentive payment, place greater emphasis on unincentivized aspects of their work. This pattern is evident in unincentivized sales revenues and revenues per product but also in call duration and tech team involvement, two similarly unincentivized, intermediate outcomes that employees knew to be of importance to their employer. Consistent with this presumed importance, when aggregated to the weekly level, average call duration and tech team involvement are meaningful predictors of sales revenues and sales revenues per product, even when adjusting for a lagged dependent variable and seasonality (see Appendix E). Combined with the null effect on incentivized performance, the collective findings are consistent with our proposed mechanism of salience-induced reciprocity—that is, the temporary reciprocity in response to a periodic increase in the salience of the incentive plan. Therefore, we interpret the suite of evidence as inconsistent with Hypothesis 1 yet consistent with Hypothesis 2.
Discussion
This article was motivated by the desire to better understand the performance effects of incentive plans. Inspired by agency and expectancy theories, the familiar focus in this literature has been on reward expectancy, deriving from the mere presence of an incentive plan and accompanying contract, and its role in shaping employees’ motivational states (Lawler, 1973; Prendergast, 1999). Moving beyond reward expectancy, we draw on research from across management, economics, and psychology to propose a salience-based theory that elucidates why and how the effectiveness of incentive plans can also derive from employees’ reactive responses to received incentive payments. We apply multivariate time-series methods to longitudinal data on an ongoing incentive plan, which, by design, keeps constant the reward expectancy stemming from the mere presence of the plan. Our findings show that periodic incentive payments temporarily boost various kinds of unincentivized behaviors and outcomes in economically meaningful ways, without traceably affecting the dynamics of incentivized performance.
First and foremost, by theorizing and documenting the influence of periodic incentive payments on the temporal dynamics of performance, we contribute to a more complete theory of the performance effects of incentive plans. Of course, the mere presence of an incentive plan can shape performance through employees’ reward expectancy, and our study does not challenge or overturn the existence of this familiar explanatory channel. Rather, our contribution lies in proposing and showing that recurring, salience-induced responses to received rewards can constitute an additional and distinct channel. Indeed, our findings highlight that enhanced performance under an incentive plan can accumulate from across recurring, temporary performance boosts attributable to employees’ reactive responses to periodic incentive payments. Thus, combining the familiar logic of reward expectancy with our salience-based logic, performance under an incentive plan can now plausibly be cast as the culmination of both proactive and reactive influences. Also, beyond establishing that meaningful reactive responses occur to received incentive payments, we contribute insight on the mechanism responsible for such dynamics. Specifically, because the receipt of an incentive payment increased attention to the “incentive plan as benefit” and subsequent dynamics overwhelmingly occurred on unincentivized behaviors and outcomes, our study suggests a central role for salience-induced reciprocity as a causal driver of the resulting ebb and flow in performance.
Second, our theory and evidence on the dynamic performance effects of incentive payments inform the broader understanding of effort dynamics in incentive plans. Some prior work points to time-varying incentives as a source of such dynamics by revealing that employees may strategically reallocate effort over time, which can be dysfunctional and harm organizational outcomes (e.g., Asch, 1990; Brahm & Poblete, 2018; Larkin, 2014; Oyer, 1998). Other work suggests that effort dynamics may be traceable to external interventions that make incentives salient—for example, an unobtrusive note regarding the piece rate at the beginning of a shift (Englmaier et al., 2017). In our empirical context, incentive pressure is stable within and across evaluation periods, which rules out strategic gaming, while no external interventions occurred. Thus, we extend prior work by showing that distinct performance dynamics may also occur in response to the periodic receipt of incentive payments—a routine event internal to any incentive plan—and that such dynamics may be beneficial rather than harmful to organizational outcomes.
Together, these two contributions foreshadow some new ways for employers to influence the contributions that employees and HR interventions make to organizational outcomes. For example, employers keen to maintain a consistent level of motivation in their workforce can benefit from an awareness of the temporal dynamics we uncovered, which they can use to determine the optimal timing of alternative motivators, such as informal feedback or commitment-building activities. This way, employers might choose to administer other motivators during the trough of the employee response to a periodic incentive payment. Also, to elicit salience-induced reciprocity and, thus, to see temporary responses to periodic incentive payments on unincentivized yet consequential aspects of employees’ work, employers may invest in cultivating the social dimension of the employment relationship or screen potential employees for their prosocial dispositions.
Finally, beyond contributing to the understanding of performance and effort dynamics in incentive plans, this article also contributes to the HR literature, in which performance dynamics remain underexplored as a topic of conceptual and empirical consequence. Scholars have progressively identified time and temporal dynamics as fundamental for understanding the functioning of compensation (Conroy et al., 2015) and other HR practices (Aguinis & Bakker, 2021; Jackson, Schuler, & Jiang, 2014). Particularly relevant to our study, for example, a group of compensation scholars recently suggested that a “pressing research need” is to study “the dynamics of responses to pay forms over time” (Conroy et al., 2015: 213). Nevertheless, longitudinal studies remain scarce or based on short time series (Bainbridge, Sanders, Cogin, & Lin, 2017; Jiang, Lepak, Hu, & Baer, 2012), while time often is a mere methodological device to assess cause and effect rather than a topic receiving conceptual attention. We contribute to this literature with a theory of temporal performance dynamics and introduce multivariate time-series methods for examining such dynamics in longitudinal data, which we implement in the context of an incentive plan.
By directly engaging with temporal dynamics, the methods we introduced can be applied to other HR practices in which time-varying responses, reverse causation, inertia, and resourcing trade-offs play a role. For example, they might inform questions regarding the temporality of recurring informal feedback, appraisals, or a variety of training and development interventions (e.g., Cappelli & Tavis, 2016). Do such interventions produce performance dynamics? If so, then how long does it take for performance effects to emerge, and how long do they last? How would such interventions dynamically affect other outcomes, such as job satisfaction or organizational commitment? And how would different interventions interact with one another and with relevant outcomes over time, as part of a broader HR system? These are just some of the new avenues that multivariate time-series methods can open up, which can help expand the understanding of how HR practices function and, ultimately, improve managerial practice.
Other exciting areas for future inquiry exist that can address some of this study’s limitations, probe its scope conditions, and extend our research. First, our analyses and fieldwork delve into a suitable yet specific empirical site to identify the temporary responses to periodic incentive payments and establish a possible underlying mechanism. Because our theory does not rely on idiosyncratic features of this empirical context, future studies could examine the extent to which our framework holds in other firms and industries. In doing so, scholars must identify contextually important (intermediate) outcomes that might be different from ours, and fieldwork will be important alongside econometric evidence to interpret the causal chain from payment through relevant intermediate outcomes to performance. Second, employee performance in our context is malleable and products relatively inexpensive, so that performance can respond readily to incentive payments. While this characterizes a wide range of settings and product markets, the ensuing performance dynamics may depend on task complexity, the degree of control over outcomes, or the importance of customer deliberation. Third, even though their employment relationship is contractual to begin with, employees at WebCo do value informal, social approval by the employer. The relative strength of salience-induced refocusing, for which we found no support, and salience-induced reciprocity may vary depending on the degree to which an employer’s esteem matters to employees. There seems to be value in future research more thoroughly probing the boundary conditions of these two distinct mechanisms.
Fourth, in our estimates, the incentive-payment effects on performance dynamics are causal according to Granger’s (1969) classic definition. Yet our reduced-form evidence does not readily permit statements about performance dynamics if payment intervals were different. We speculate that less frequent payments may draw more attention, yet they may also lose their value if the temporal wedge between performance and reward is too long. The net effects of countervailing implications such as these constitute an open question, and future research could examine how different payment frequencies affect performance dynamics. Fifth, one might look more closely at whether and how payment amounts matter for the nature of employees’ reactive responses to receiving an incentive payment. For example, prior work on “just noticeable differences” in pay (e.g., Mitra et al., 2016; Worley et al., 1992) would foreshadow that pay changes exceeding 5% to 7% might be needed to draw attention and elicit meaningful behavioral or affective reactions. Yet an upper threshold can exist, too, beyond which reactions may be decreasingly consequential (Shaw, 2018). We believe it would be valuable to know whether variations in payment amount affect employees’ temporary responses to the receipt of incentive payments and consistent with which functional form—for example, a linear, step, or concave function—such responses emerge.
Finally, opportunities exist to examine our salience-based mechanisms in pay-for-performance systems other than incentive plans, such as discretionary bonus or stock option plans (e.g., Cappelli et al., 2020; Nyberg et al., 2016) or collective bonus pools (e.g., Nyberg, Maltarich, Abdulsalam, Essman, & Cragun, 2018). In some such alternative systems, received rewards have been argued to affect subsequent performance because they resolve ex ante uncertainty regarding how much the prior performance of individual employees would be (deemed) worth. Our salience-based theory is distinct because it explains how responses to received rewards can occur even absent ex ante uncertainty regarding the performance–reward relationship. In the spirit of emerging scholarship probing the mechanisms underlying the effectiveness of various pay-for-performance systems (e.g., Benson & Sajjadiani, 2018; Cappelli et al., 2020), we encourage studies of systems other than incentive plans that examine the explanatory power of a salience-based theory alongside more established mechanisms.
Footnotes
Appendix A
Seemingly Unrelated Regression Estimates of Vector Autoregression Model (Equation 1)
| Variable | Endogenous Variables | ||||
|---|---|---|---|---|---|
| Task Performance | Sales Revenues | Incentive Payment | AdWords | Tweets | |
| Lagged endogenous variables | |||||
| Task performance (t − 1) | 0.22 (0.08) | −208.98 (518.84) | 25.42 (25.14) | 16.81 (34.05) | −1.21 (2.72) |
| Sales revenues (t − 1) | −0.00 (0.00) | 0.33 (0.08) | −0.01 (0.00) | 0.00 (0.01) | −0.00 (0.00) |
| Incentive payment (t − 1) | 0.00 (0.00) | 3.74 (1.31) | −0.14 (0.06) | −0.12 (0.09) | −0.00 (0.01) |
| AdWords (t − 1) | 0.00 (0.00) | −1.03 (1.09) | 0.09 (0.05) | 0.38 (0.07) | −0.00 (0.01) |
| Tweets (t − 1) | −0.00 (0.00) | −6.45 (13.32) | 0.04 (0.65) | −0.70 (0.87) | 0.53 (0.07) |
| Exogenous variables | |||||
| Expansion | 0.89 (0.20) | 2,092.90 (1,319.42) | −3.68 (63.93) | −94.97 (86.60) | 16.23 (6.91) |
| Holiday | −0.25 (0.16) | −5,701.81 (1,016.87) | −42.54 (49.27) | −57.24 (66.74) | −11.19 (5.33) |
| AdWords used | −0.55 (0.16) | −1,161.07 (1,042.04) | −3.05 (50.49) | 199.90 (68.39) | −11.04 (5.46) |
| Tweets intensive | 0.51 (0.27) | 2,255.00 (1,768.66) | −36.61 (85.70) | 58.18 (116.09) | 43.47 (9.27) |
| End of month | −0.08 (0.11) | −139.03 (685.74) | −76.44 (33.23) | 27.94 (45.01) | −4.97 (3.59) |
| Beginning of month | 0.02 (0.11) | 1,324.17 (702.70) | 294.81 (34.05) | −34.22 (46.12) | −0.82 (3.68) |
| Industry growth | 0.00 (0.00) | −0.01 (0.00) | −0.00 (0.00) | 0.00 (0.00) | −0.00 (0.00) |
| Quarter 2 | −0.09 (0.11) | −1,182.67 (722.95) | 22.96 (35.03) | −52.52 (47.45) | −1.49 (3.79) |
| Quarter 3 | −0.21 (0.14) | −4,775.60 (883.40) | 21.33 (42.80) | −118.04 (57.98) | −5.70 (4.63) |
| Quarter 4 | −0.16 (0.12) | −2,667.62 (812.45) | 49.95 (39.37) | −218.18 (53.33) | −4.72 (4.26) |
| Constant | −0.90 (0.27) | 3,339.93 (1,732.49) | −29.76 (83.94) | −150.88 (113.71) | 10.30 (9.08) |
| R 2 | 0.40 | 0.57 | 0.51 | 0.54 | 0.67 |
Note: Standard errors in parentheses. N = 168 (169 weeks with 1-week lag).
Appendix B
Appendix C
Appendix D
Weekly and Total Revenues, and Additional Revenues per Euro Spent, for Impulses in Incentive Payment and AdWords
| Impulse Variable | Euro Response in Revenues by Week Since Impulse | Total Revenues | Additional Revenues per Euro Spent | ||||
|---|---|---|---|---|---|---|---|
| 0 | 1 | 2 | 3 | 4 | |||
| Incentive payment | 331.47 [77.38, 585.55] | 704.33 [467.46, 941.20] | 160.73 [46.17, 275.28] | 49.09 [−7.63, 105.81] | 13.88 [−15.44, 43.19] | 1196.52 | 4.60 |
| AdWords | 323.26 [66.43, 580.09] | −139.27 [−404.20, 125.66] | −57.62 [−246.24, 131.01] | −23.53 [−131.61, 84.55] | −7.40 [−68.37, 53.56] | 323.26 | 0.51 |
Note: Impulse responses are shown with two-standard-error bounds in brackets.
Appendix E
Ordinary Least Squares Estimates of Sales Revenues (per Product) as a Function of Average Call Duration and Tech Team Involvement
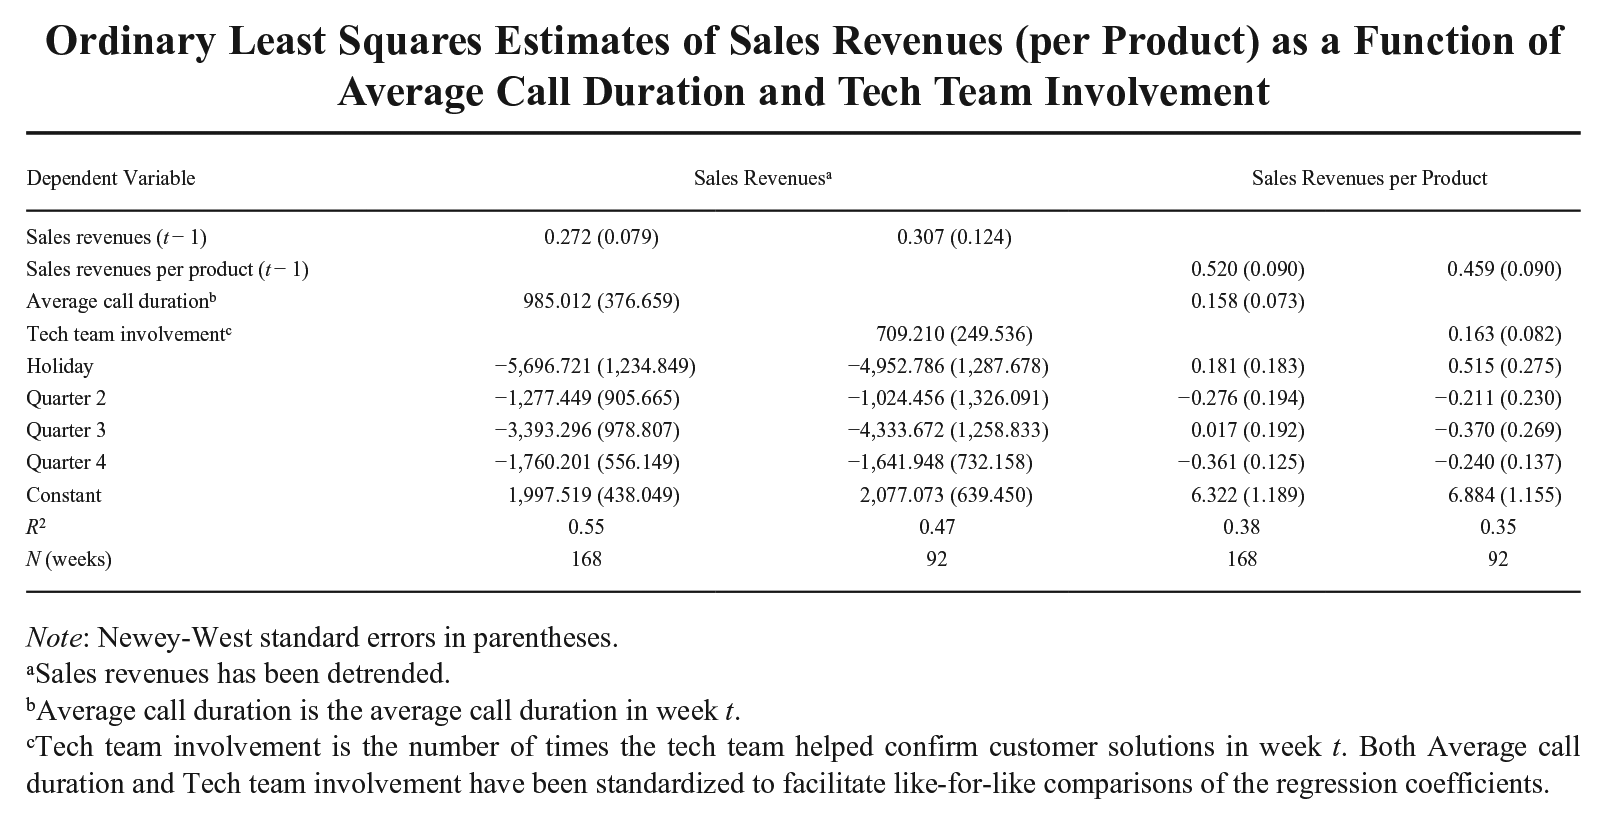
| Dependent Variable | Sales Revenues a | Sales Revenues per Product | ||
|---|---|---|---|---|
| Sales revenues (t − 1) | 0.272 (0.079) | 0.307 (0.124) | ||
| Sales revenues per product (t − 1) | 0.520 (0.090) | 0.459 (0.090) | ||
| Average call duration b | 985.012 (376.659) | 0.158 (0.073) | ||
| Tech team involvement c | 709.210 (249.536) | 0.163 (0.082) | ||
| Holiday | −5,696.721 (1,234.849) | −4,952.786 (1,287.678) | 0.181 (0.183) | 0.515 (0.275) |
| Quarter 2 | −1,277.449 (905.665) | −1,024.456 (1,326.091) | −0.276 (0.194) | −0.211 (0.230) |
| Quarter 3 | −3,393.296 (978.807) | −4,333.672 (1,258.833) | 0.017 (0.192) | −0.370 (0.269) |
| Quarter 4 | −1,760.201 (556.149) | −1,641.948 (732.158) | −0.361 (0.125) | −0.240 (0.137) |
| Constant | 1,997.519 (438.049) | 2,077.073 (639.450) | 6.322 (1.189) | 6.884 (1.155) |
| R 2 | 0.55 | 0.47 | 0.38 | 0.35 |
| N (weeks) | 168 | 92 | 168 | 92 |
Note: Newey-West standard errors in parentheses.
Sales revenues has been detrended.
Average call duration is the average call duration in week t.
Tech team involvement is the number of times the tech team helped confirm customer solutions in week t. Both Average call duration and Tech team involvement have been standardized to facilitate like-for-like comparisons of the regression coefficients.
Acknowledgements
We are indebted to the management and employees at the case firm for granting access to proprietary data and for generously facilitating this research project. Associate editor Aaron Hill and the anonymous reviewers provided excellent guidance. We also wish to acknowledge Lamar Pierce for encouragement and Nick Bacon, Santi Furnari, Olenka Kacperczyk, JR Keller, Jaime Ortega, Paolo Volpin, Gokhan Yildirim, and participants in the 2017 Madrid Work and Organizations Workshop at IE Business School, the 2018 Academy of Management Annual Meeting in Chicago, and SMS Virtual 2020 for helpful comments and suggestions. During part of the research for this article, Argyro Avgoustaki was a Visiting Scholar at the Department of Management Science at Lancaster University Management School, and both authors were Visiting Scholars at the Departamento de Economía de la Empresa at Universidad Carlos III de Madrid. We thank Eduardo Melero, Jaime Ortega, Neus Palomeras, and Gokhan Yildirim for their hospitality. This article is part of a project supported by a grant from the Spanish Ministry of Economics and Competitiveness (ECO2015-69615-R) and a grant from ESCP Business School is gratefully acknowledged.