
Abstract
Background: Very low birth weight (VLBW) infants remain at risk for postnatal growth restriction. Clinicians may have difficulty identifying growth patterns resulting from nutrition interventions, impeding prompt management changes intended to increase growth velocity. This study aimed to quantify the association between growth and nutrition intake through 7-day moving averages (SDMAs). Methods: The first 6 weeks of daily nutrition intake and growth measurements were collected from VLBW infants admitted to a level 4 neonatal intensive care unit (2011–2014). The association between SDMA for energy and macronutrients and subsequent 7-day growth velocities for weight, length, and head circumference were determined using mixed effects linear regression. Analyses were adjusted for fluid intake, infant characteristics, and comorbid conditions. Results: Detailed enteral and parenteral caloric provisions were ascertained for 115 infants (n = 4643 patient-days). Each 10-kcal/kg/d increase over 7 days was independently associated with increased weight (1.7 g/kg/d), length (0.4 mm/wk), and head circumference (0.9 mm/wk; P < .001, for weight and head circumference; P = .041 for length). Each 1 g/kg/d macronutrient increase was also associated with increased weight (protein, P = .027; at and carbohydrates, P < .001), increased length (fat, P = .032), and increased head circumference (fat and carbohydrates, P < .001). Conclusions: The SDMA identifies clinically meaningful associations among total energy, macronutrient dosing, and growth in VLBW infants. Whether SDMA is a clinically useful tool for providing clinicians with prompt feedback to improve growth warrants further attention.
Keywords
Clinical Relevance Statement
Associations between growth and nutrition intake during the immediately preceding 7 days, adjusting for fluid volume intake, is described with an instrument that holds potential for use in clinical practice. These associations may help clinicians in the neonatal intensive care unit measure real-time infant growth resulting from recent nutrition interventions. The clinical application of such measurements is expected to facilitate clinical decision making when balancing the delivery of optimal nutrition with the need to restrict fluid administration in preterm infants.
Background
Increased energy and nutrient intake are associated with a reduced risk of bronchopulmonary dysplasia, retinopathy of prematurity, and improved neurodevelopmental outcomes.1-3 Nevertheless, half of very low birth weight (VLBW) infants are discharged from the neonatal intensive care unit (NICU) with a weight <10th percentile.4,5 This is attributable to postnatal diuresis, as well as a gap between actual and recommended nutrition intake beginning in the first weeks of life.6-8
Determining whether sufficient nutrition has been provided to achieve appropriate growth is challenging. The estimation of energy and macronutrient intake is straightforward yet more time-consuming than the calculation of fluid volume intake. Unless automated by an electronic health record (EHR), these values may not be readily available to the clinician with limited time and competing clinical priorities. Furthermore, changes in weight, perceived as edema rather than true growth, may prompt fluid restriction, 9 which may lead to decreased nutrition intake. 10 While studies have demonstrated the association between growth and nutrition intake,11-13 few have examined such associations from the vantage of the rounding clinician: What did the infants receive during the most recent days to weeks, and how did they grow?
Evaluating ongoing associations between nutrition intake and growth is critical to providing high-quality care to VLBW infants in the first weeks. This study quantifies a new association between weekly growth and weekly nutrition and fluid intake in VLBW infants with moving averages. 14 Moving averages, used in finance and more recently in healthcare, smooth data volatility.15,16 We hypothesize that moving averages describing energy intake are associated with moving averages of infant weight gain as well as changes in length and head circumference. Such short-term associations may assist clinicians in measuring infant growth in the preceding week relative to provided nutrition, making for a clinically applicable instrument.
Methods
This retrospective cohort analysis was approved by the Institutional Review Boards of the Ann & Robert H. Lurie Children’s Hospital of Chicago and Northwestern University Feinberg School of Medicine.
Cohort Selection
All VLBW infants born from January 1, 2011, to December 31, 2014, and admitted to the Ann & Robert H. Lurie Children’s Hospital of Chicago NICU were identified from the Children’s Hospital Neonatal Database. 17 To ensure a homogeneous sample, infants were included if admitted prior to day 7 of life and discharged no earlier than day 28. Infants with congenital anomalies (eg, gastrointestinal anomalies, complex heart disease) or chromosomal abnormalities were omitted because these conditions may have resulted in additional impediments to nutrition intake and growth.
Data Collection
Nutrition and fluid intake data were manually abstracted from the EHR (Epic Systems Corporation, Verona, WI) for each infant at the patient-day level. The following variables were collected for each 24-hour calendar day for the first 42 days of life: total fluid volume, enteral nutrition (EN) intake (human milk or formula volume, fortifier type, and concentration per ounce), and parenteral macronutrient intake and volume. Intravenous (IV) medications administered as continuous drips were included if the carrier fluid contained dextrose (eg, dopamine in 5% dextrose). Actual intake for nutrients and fluid volume, not estimated or ordered, were abstracted to the nearest tenth of a milliliter.
The 6-week time frame was chosen because most infants would have transitioned from parenteral to EN by this time. Standard practice for VLBW infants during the observed period included initiation of parenteral protein and dextrose solution immediately upon admission. IV lipids and enteral feedings were initiated at the clinician’s discretion though usually within 2–3 days of admission. Infant feedings were advanced by 20 mL/kg/d as tolerated until a goal of 150–160 mL/kg/d of enteral feedings.
Daily weight and weekly length and head circumference measurements were obtained from the Lurie Children’s Hospital clinical database warehouse, BioInformatics Suites (Transmed, Cupertino, CA). Growth measurements were routinely recorded during the evening shift; therefore, the date-time measurement was converted to the date of nearest midnight to avoid loss of data (eg, a calendar date with weights recorded at 12:15
Quality assurance was performed by independent repeat abstraction of 20 of the 115 (17.3%) eligible patient records. Data were also checked for possible transcription errors. Large or negative differences between recorded total fluid and the sum of delivered fluids prompted review of a record. Outliers in total energy and growth measurements, noted by plotting values for each subject along age, prompted review of records. All identified outliers or possible transcription errors were reviewed and resolved by 2 investigators (G.H.F. and KM).
Comorbid conditions were obtained from the Children’s Hospital Neonatal Database: small for gestational age (birth weight <10th percentile), 18 intubation at 28 days, presence or absence of patent ductus arteriosus (PDA), and necrotizing enterocolitis or spontaneous intestinal perforation (NEC/SIP) within the observed period. Intubation at 28 days was selected as a surrogate for lung disease, rather than severity of bronchopulmonary dysplasia, because the latter was determined for most infants after the observed period. These conditions were fixed at the patient level. PDA was considered present if an echo demonstrated a ductus with left-to-right or bidirectional ductal flow. NEC/SIP were determined at the time of surgery, at autopsy, or with the presence of clinical signs (bilious residuals/emesis, abdominal distention, or bloody stools) and radiographic findings (pneumatosis intestinalis, portal venous gas, or pneumoperitoneum) during the observed period. 19
Nutrition Intake and Growth Calculations
Energy and macronutrient calculations assumed that unfortified mature human milk contained an average of 67.6 kcal/dL and 1.03, 4.38, and 6.89 g/dL of protein, fat, and carbohydrates, respectively.20,21 Enteral energy and macronutrient levels for fortified human milk and formula were based on published reference values.7,22 Parenteral protein, fat, and carbohydrates were converted to energy based on 4, 10, and 3.4 kcal/g, respectively. 23 Combined enteral and parenteral values were divided by the daily weight to derive total daily energy, protein, fat, and carbohydrate intake.
The 7-day moving average (SDMA) for nutrients was calculated with the simple moving average of energy, protein, fat, carbohydrates, or fluid intake in the preceding week. 14 The SDMA was calculated only with complete nutrition data for all averaged days. For example, the first SDMA for energy in an infant admitted on day 7 would be day 15, calculated with data from days 8 to 14. Data on day 7, the day of admission, would be incomplete and therefore excluded. The SDMA for energy, macronutrients, and fluid were reported in kcal/kg/d, g/kg/d, and mL/kg/d, respectively. Multivariable analyses of SDMA for energy and fluid were conducted in units of 10 to facilitate interpretation.
Growth velocity for weight (g/kg/d) was calculated with daily weight and the exponential method. 24 The growth velocity for length and head circumference was calculated with linear change per week (mm/wk). 25 These values were calculated from the day of birth until the 42nd day or day of discharge, if earlier. The 7-day growth velocity (SDGV) was calculated per the change in weight, length, or head circumference over the past week. For example, the reported weight SDGV on day 15 would correspond to the exponential growth velocity from midnight of day 8 to midnight of day 15. Weight SDGV was calculated every day, while length and head circumference SDGVs were calculated with weekly measurements.
Analyses
Infant characteristics and cumulative growth velocities were quantified and reported by presence or absence of any comorbid condition. Infant characteristics included gestational age, receipt of antenatal steroids prior to delivery, birth weight, sex, and age at admission and discharge. Analyses were performed with χ2 or Wilcoxon rank sum test where appropriate. All testing was based on a 2-sided α with statistical significance defined as P < .05.
The median and interquartile range were calculated for all SDMA and SDGV variables and graphed by age. Change in each variable over time was determined with mixed effects linear regression, which accounted for the inherent autocorrelation among observations due to repeated measures with random effects. 26 Slopes for all SDMA variables and weight SDGV were determined from day 8 to 14, which were calculated from nutrition and growth data in the first week, a period of diuresis and decreased energy intake, and from day 15 to 42 with the subsequent data.6,27 Slopes for length and head circumference SDGVs were calculated from day 8 to 42.
Bivariable mixed effects linear regression was performed between each SDMA variable (exposure) and weight SDGV (outcome). Afterward, 2 multivariable adjusted models of weight SDGV were performed with the following exposures: (1) SDMA of energy and (2) SDMA of protein, fat, and carbohydrates with significant bivariable association. Each model adjusted for comorbid conditions, significant infant characteristics, and fluid intake. Stepwise backward selection was employed with a model entry criterion of P < .20 to determine a final multivariable model with covariates. Gestational age was excluded from the final model to avoid collinearity with birth weight. The same process was repeated for length and head circumference SDGVs with the addition of severe intraventricular hemorrhage (grade 3 or 4) to all head circumference models. 28 Collinearity diagnostics were performed with variance inflation factors for all variables entered into the model.29,30
Sensitivity Analyses
SDMA for fluid was removed from any final model where it was retained to ensure that the association between nutrition and growth was not affected by potential collinearity. In another sensitivity analysis, any weight SDGV calculated from a carried-over daily weight was removed from the final models. Finally, weight loss in the first week of life represents expected postnatal diuresis; therefore, the final multivariable models were run excluding exposures and outcomes from the first week (ie, SDMA and SDGV from days 8 to 14 were excluded).
Results
Cohort Description
A total of 115 neonates were eligible, resulting in 4643 patient-day observations of nutrition and fluid intake and growth. Infant characteristics and growth velocities are described in Table 1. Two-thirds of infants were admitted to the NICU on their birthdates (day 0), while 82% were admitted by the end of day 1. Sixty-two percent of infants had at least 1 comorbidity, including PDA (48%), NEC/SIP (18%), intubation on day 28 (35%), and small-for-gestational-age status (11%). Of the 21 infants with NEC/SIP, 11 were transferred to Lurie Children’s Hospital with the diagnosis. Infants with comorbid conditions were born earlier and smaller and had longer lengths of stay when compared to infants without comorbid conditions (Table 1). Differences in growth velocity were not apparent until discharge.
Infant Characteristics and Growth Velocities. a
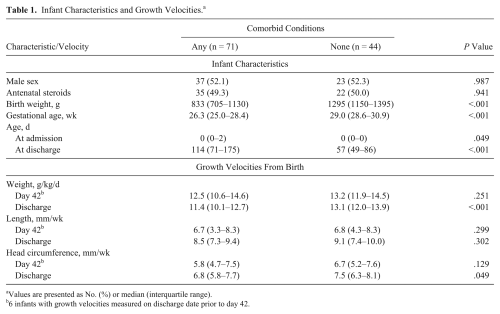
Values are presented as No. (%) or median (interquartile range).
6 infants with growth velocities measured on discharge date prior to day 42.
Description of SDMA and SDGV Variables
Medians and interquartile ranges for all SDMA variables and weight SDGV are displayed in Figure 1; length and head circumference SDGVs are displayed in Supplementary Figures S1–S2. Medians and interquartile ranges for all SDMA and SDGV variables are described in Supplementary Tables S1–S3. Between days 8 and 14, SDMA increased 3.9 kcal/kg/d (95% CI, 3.7–4.1) for energy and 1.5 mL/kg/d (95% CI, 1.2–1.8) for fluid. Between days 15 and 42, SDMA increased 0.4 kcal/kg/d (95% CI, 0.4–0.5) for energy, while SDMA for fluid did not change. SDMA for protein remained stable throughout the entire observed period, while SDMA for fat increased 0.3 g/kg/d (95% CI, 0.3–0.4) between days 8 and 14 and 0.1 g/kg/d (95% CI, 0.04–0.1) between days 15 and 42. SDMA for carbohydrates increased 0.2 g/kg/d (95% CI, 0.2–0.2) between days 8 and 14 but did not change between days 15 and 42.
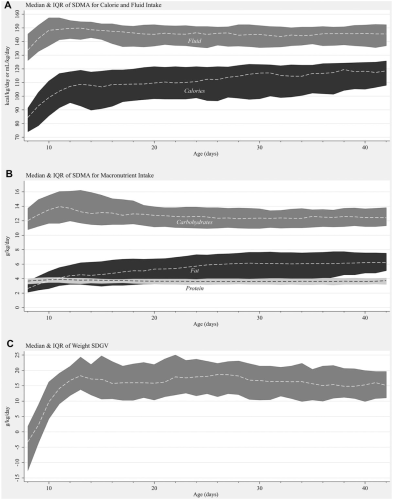
Median and interquartile range (IQR): (A) 7-day moving average (SDMA) for energy and fluid, (B) 7-day moving average for macronutrients, and (C) weight 7-day growth velocity (SDGV).
Between days 8 and 14, weight SDGV increased 3.4 g/kg/d (95% CI, 3.0–3.7) for each day but decreased 0.1 g/kg/d (95% CI, −0.15 to −0.07) between days 15 and 42. Length and head circumference SDGVs both increased 1.1 mm/wk for each week (95% CIs: for length, 0.5–1.6; for head circumference, 0.7–1.5).
Association Between SDGV and SDMA
Bivariable analyses demonstrated that the SDMAs for energy, protein, fat, carbohydrates, and fluid intake were individually associated with the SDGV in weight. Energy and fat were individually associated length SDGV. Energy, fat, and carbohydrates were associated with head circumference SDGV.
The multivariable associations between weight SDGV and SDMA for energy and macronutrients are reported in Table 2. The β coefficients in the final multivariable model are listed and represent the associated change in weight growth velocity averaged over a week (in g/kg/d). For example, each 10-kcal/kg/d increase in energy intake was associated with an increase in growth velocity by 1.7 g/kg/d when adjusting for fluid volume intake, comorbid conditions, and infant characteristics. In both models, PDA and increasing birth weight were inversely associated with weight SDGV, while NEC/SIP and intubation were directly associated with weight SDGV. Male sex was directly associated with SDGV in the caloric model. Neither model demonstrated an association between SDMA for fluid and SDGV.
Multivariable Models for Weight 7-Day Growth Velocity.
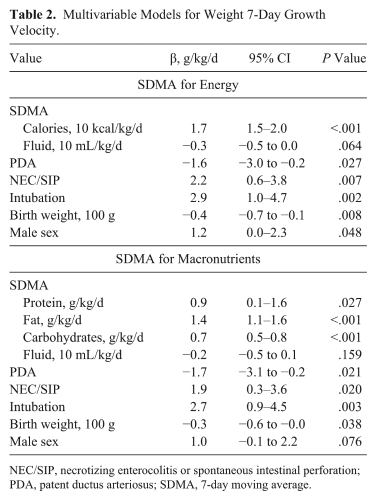
NEC/SIP, necrotizing enterocolitis or spontaneous intestinal perforation; PDA, patent ductus arteriosus; SDMA, 7-day moving average.
The multivariable models for length and head circumference SDGVs are shown in Table 3. The β coefficients listed represent the associated change in length and head circumference over a week (in mm/wk). For example, each 10-kcal/kg/d increase in energy intake was associated with an increase in head circumference by 0.9 mm/wk after adjusting for fluid volume intake, severe intraventricular hemorrhage, and birth weight. SDMA for energy was significantly associated with length SDGV. Male sex was the only covariate retained in the final model and was not significant. Regarding macronutrients, SDMA for fat was associated with length SDGV, and no covariates were retained in the final model. SDMA for energy was significantly associated with head circumference SDGV. SDMAs for fat and carbohydrates were associated with head circumference SDGV. In both models, head circumference SDGV was directly associated with severe intraventricular hemorrhage and inversely associated with birth weight. Collinearity diagnostics did not demonstrate strong correlation between model predictors.
Multivariable Models for Length and Head Circumference SDGV.
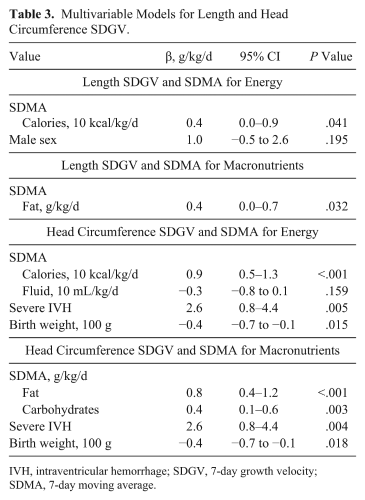
IVH, intraventricular hemorrhage; SDGV, 7-day growth velocity; SDMA, 7-day moving average.
Sensitivity Analyses
When SDMA for fluid was removed from the final models, the association between SDMA for protein and weight SDGV was no longer significant (the remaining associations were similar in value and significance). This suggests little collinearity between fluid and nutrition intake. Removing weight SDGV values derived from carried-over weights (2.4% of patient-days) had the same effect. When weight changes resulting from postnatal diuresis were accounted for, SDMAs for energy and protein remained significantly associated with weight SDGV after removal of data from the first week (data not shown).
Discussion
The SDMA for energy is associated with the weight SDGV. We believe that this association is real because (1) SDMA for energy was also associated with length and head circumference SDGVs and (2) the association persisted despite adjusting for fluid volume intake, comorbid conditions, and infant characteristics. SDMA for macronutrients was also associated with growth, especially in weight and head circumference.
This study was designed to investigate SDMA and SDGV as potentially useful metrics for clinicians to assess the relationship between nutrition and growth in VLBW infants. Prior studies have primarily reported on the association between nutrition intake and growth at the time of discharge or over intervals of several weeks11,12; however, clinicians in the NICU have few easily accessible metrics to guide nutrition adjustments to change growth trajectories. Clinicians often struggle to interpret changes in growth parameters over a short period. For example, does a large change in weight represent edema rather than growth? What, if any, increase in energy delivery would improve growth velocity? The SDMA, SDGV, and their associations demonstrate that average changes in growth parameters over a 1-week period are related to energy and nutrient intake and concurrent disease status but not fluid intake. Their association helps clinicians understand that an infant with a growth velocity of 13.3 g/kg/d will need, on average, an additional 10 kcal/kg/d to achieve a growth velocity of 15 g/kg/d. A clearer understanding of what the infant received and how the infant responded in growth may create a “closed-loop system” of information, thus helping clinicians adjust nutrition to optimize growth.4,5,31 Furthermore, the findings from this study suggest that the association between nutrition intake and growth are established well before discharge from the NICU and can be monitored in shorter intervals.
Nevertheless, many infants still received less than the recommended energy intake of 120 kcal/kg/d.6,7 Growth velocities from birth to discharge were comparable to those previously reported but may have been higher with greater energy intake. 5 We speculate that infants in this cohort may not have received the recommended energy intake because clinicians targeted fluid intake rather than energy intake. While SDMA for energy increased throughout the observed period, SDMA for fluid did not change between days 15 and 42. Although fluid intake data were automatically generated by the EHR, energy and macronutrient intake data were not generated. Clinicians may have had to manually calculate these values, which can be time-consuming. Data collection alone took between 2 and 3 minutes per patient-day, not including calculations. If only fluid data are readily available, then clinicians may not readily appreciate how fluid management (eg, fluid restriction) affects energy intake.
There are limitations to the analyses. This study is a retrospective analysis of VLBW infants at a single-center regional NICU. Therefore, results may not be generalizable to other infant populations or institutions, although inclusion was limited to infants admitted by day 7 to mitigate potential heterogeneity. Calculations of EN assumed that the energy and macronutrient content of human milk were constant, although these values vary among individuals and over time. 32 Growth measurements, especially head circumference and length, are susceptible to measurement errors, including lack of reproducibility, but we do not believe that there was any systematic bias in these measurements. Finally, identified comorbid conditions, set to the patient, were static for the entire observed period, while these conditions are typically more dynamic.
The strength of this study lies in the detail of data collection. Energy and macronutrient intake are calculated daily from all recorded sources, including IV drip medications, for the first 6 weeks of life. The data were validated to ensure high accuracy and reliability. The analyses kept exposure and outcomes in their natural continuous form, as opposed to dichotomous values. Finally, the analyses adjusted for fluid but ensured that this adjustment did not create collinearity with nutrition.
Future investigations should explore how clinicians collect and manage data regarding growth and nutrition, and whether existing EHR systems may bias clinicians toward more focus on fluid intake rather than energy intake. If fluid intake takes priority over nutrition intake during clinical decision making, then EHR systems may need capacity to automate estimation of energy and macronutrient intake. However, more research is needed to better understand which data and format clinicians need in order to provide optimal nutrition and achieve better growth.
Footnotes
Acknowledgements
We thank Patrice Swiontek, RDN, CSP, LDN, for her assistance with enteral macronutrient calculations.
Financial disclosure:
None declared.
Conflicts of interest:
H.L. Palac is now an employee of AbbVie, Inc. Analyses for this paper were performed when she was employed by Northwestern University. The remaining authors declare no conflicts of interest.
Statement of Authorship
G. H. Falciglia, K. Murthy, and D. T. Robinson equally contributed to the conception of the research; G. H. Falciglia, K. Murthy, D. T. Robinson, J. Holl, and D. Woods contributed to the design of the research; G. H. Falciglia, Y. Oumarbaeva, and P. Yadavalli contributed to the acquisition of the data; G. H. Falciglia, K. Murthy, J. Holl, H. L. Palac, and D. T. Robinson contributed to the analysis and interpretation of the data; and G. H. Falciglia drafted the manuscript. All authors critically revised the manuscript, agree to be fully accountable for ensuring the integrity and accuracy of the work, and read and approved the final manuscript.