
Abstract
Background: Intestinal failure–associated liver disease is a frequent complication in patients with chronic intestinal failure (CIF), with steatosis as a dominant feature in adults. Proton magnetic resonance spectroscopy (1H-MRS) is a noninvasive method to quantify liver fat content (LFC). In this study, LFC was assessed with 1H-MRS, taking into account the possible accumulation of paramagnetic components of home parenteral nutrition (HPN) that may disturb these measurements. Methods: LFC was measured in 15 adult CIF patients who had been receiving HPN for >6 months. 1H-MR spectra were obtained with a 3 Tesla magnetic resonance (MR) system, with a method correcting for the presence of paramagnetic ions. Patients with low (<5%) versus high (≥5%, steatosis) LFC were compared with nonparametric statistical tests. Results: 1H-MRS analysis revealed steatosis in 5 patients (median, 10.3%), while 10 patients had normal LFC (median, 0.9%). In all patients, the 1H-MRS results indicated the presence of various amounts of paramagnetic constituents in the liver. Patients with steatosis had higher alanine aminotransferase values than patients without steatosis (median, 60 vs 28 U/L). Unexpectedly, in the steatosis group, the frequency of HPN use was lower, with significant lower total HPN and carbohydrate calories. In 1 patient, MR spectra were of inferior quality, with broadened resonances after infusion with a ferric compound. Conclusion: 1H-MRS enables reliable noninvasive assessment of LFC in patients receiving long-term HPN, if correcting for possible accumulation of paramagnetic components in the liver. However, LFC determination by 1H-MRS is not recommended after a recent ferric compound infusion.
Keywords
Clinical Relevancy
Patients with chronic intestinal failure may develop intestinal failure–associated liver disease (IFALD) as a result of several factors relating to chronic intestinal failure, including but not limited to parenteral nutrition administration.
Liver biopsy is the reference standard to diagnose IFALD, but the associated complications preclude its use on a regular basis. Steatosis is a dominant feature of IFALD in adults. This study shows that proton magnetic resonance spectroscopy is a reliable method to quantify liver fat content in patients with chronic intestinal failure who are receiving long-term parenteral nutrition, if correction is implemented for possible accumulation of paramagnetic home parenteral nutrition trace elements in the liver. Proton magnetic resonance spectroscopy can be used in future trials to assess treatment effects of IFALD-related steatosis.
Introduction
Intestinal failure–associated liver disease (IFALD)—that is, liver damage due to intestinal failure or its treatment by means of parenteral nutrition (PN)—covers the complete spectrum, from elevated liver enzymes to end-stage liver disease. Depending on the definition used, 20%–75% of adult patients receiving home PN (HPN) develop IFALD, 1 and death due to IFALD is reported in about 3% of the adult patient population with chronic intestinal failure. 2 The etiology of IFALD is most likely multifactorial.3-5
Although liver biopsy remains the reference to diagnose IFALD, many centers will not perform liver biopsies on a regular basis, because of the invasive nature of the procedure. Therefore, elevations of liver enzymes are generally used as surrogate markers, but these seem to be of little help to monitor for the onset and progression of IFALD. 6 The predominant histologic finding in adults with IFALD is hepatic steatosis.7,8 IFALD progression in adults is typically insidious and is often recognized only when liver injury has become irreversible. 9
Owing partly to the traditional invasive liver fat measurement, the evidence is scarce for the progression and/or the effects of interventions on steatosis in patients receiving HPN.8,10,11
Proton magnetic resonance spectroscopy (1H-MRS) is a noninvasive method to quantify liver fat content (LFC) by analyzing the intensities of water and fat signals in a magnetic resonance (MR) spectrum from the liver. Because values obtained by 1H-MRS correlate well with liver biopsy results, it is considered an optimal noninvasive method to quantify hepatic steatosis.12-14 Furthermore, 1H-MRS is a suitable technique to monitor metabolic changes due to disease and to follow treatment.15,16
As with MR imaging, 1H-MRS uses magnetic properties of protons to create signals. However, 1H-MRS does not produce images but spectra in which the signals originating from protons in water and fat appear at different frequencies (Figure 1). 1H-MRS signal intensities are affected by the relaxation behavior of the corresponding proton spins in the magnetic field. Water and lipid signals both decrease as an exponential function of the echo time (TE) of the 1H-MRS pulse sequence, with a faster decline of the water signal than that of the lipid signal (Figure 1). Often, a relatively short TE is used to minimize these effects in LFC determination by 1H-MRS. However, patients receiving HPN usually receive commercial multi–trace element admixtures, with the risk for oversupplementation and accumulation of paramagnetic constituents, such as iron, copper and manganese in the liver, 17 in addition to physiologically variable liver iron. In the presence of these paramagnetic components, the fall in water signal intensity is even steeper, caused by shortened T2 relaxation (Figure 1). This effect may result in an overestimation of lipid:water ratio and falsely increased LFC. However, when MR spectra with multiple TEs are acquired, the correct signal intensities of lipid and water can be obtained by an extrapolation of both signal intensities to their values at a TE of 0 milliseconds. In this way the increased relative effect due to the presence of paramagnetic components is eliminated, and a correct LFC can be determined. 18
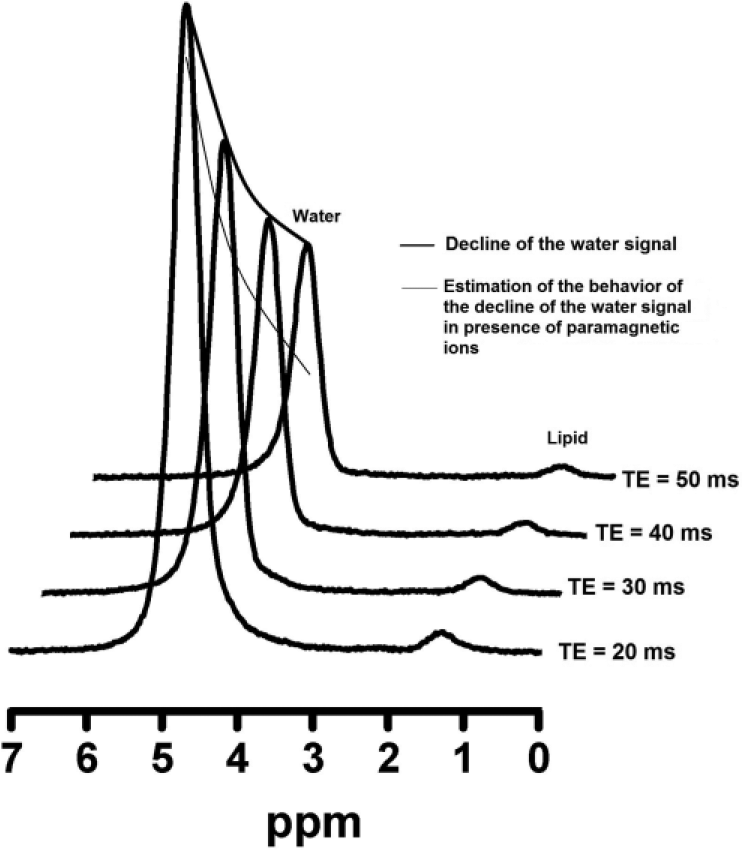
Multiple-echo magnetic resonance spectra of the liver. In the presence of paramagnetic ions, the water signal decays faster with increasing echo time (TE), while the (smaller) decay of the lipid signal is hardly affected.
Liver complications are a particular concern in patients receiving long-term PN therapy. Noninvasive monitoring with early detection and implementation of a treatment plan aiming to avoid hepatic damage is essential to maintain high-quality HPN support. This notion urged us to assess LFC with 1H-MRS in patients receiving long-term HPN, taking into account the possibility of altered relative MR signal intensities of water and lipid by components of the PN additives.
Materials and Methods
Patients
Fifteen outpatients who were under the care of the Intestinal Failure Unit of the Department of Gastroenterology and Hepatology of the Radboud University Medical Center, Nijmegen, The Netherlands, were invited for this study during a regular checkup. All were >18 years and had been receiving HPN for >6 months because of chronic intestinal failure due to a benign underlying condition. Patients with extrahepatic causes of liver test abnormalities and those with known viral hepatotoxicity were excluded. HPN formulations were individualized with respect to electrolytes and caloric intake, but all patients received overnight cyclic infusions of PN formulation enriched with water- and fat-soluble vitamins (Cernevit; Baxter, Maurepas, France) and trace elements (Addamel; Fresenius Kabi, Emmer-Compascuum, Netherlands) over 10–12 hours, with a caloric intake close to 25–30 kcal/kg per HPN day. Most patients had residual oral intake. The study was approved by the local Medical Ethics Committee. All subjects gave written informed consent.
Magnetic Resonance Investigations
MR studies of the liver were performed on a clinical 3 Tesla MR system (Tim Trio Whole Body Magnetic Resonance Scanner; Siemens, Erlangen, Germany) with the body coil for excitation and 2 phased-array surface coils positioned at the liver and the abdomen for signal reception, with the patient in a supine position. Imaging of the liver was performed with the standard clinical unenhanced MR liver-imaging protocol. This protocol included acquisition of localizers in 3 orthogonal directions during breath holding, axial T1-weighted spoiled gradient echo in-phase and opposed phase imaging (for water and fat signal) during multiple breath holds, T2-weighted coronal and axial HASTE (half-Fourier acquisition single-shot turbo spin echo) imaging during multiple breath holds, axial T2-weighted respiratory-triggered turbo spin echo imaging with and without fat saturation, and axial diffusion-weighted imaging with EPI (echo planar imaging) during a breath hold.
LFC was assessed by 1H-MRS on the same system using the images obtained for voxel placement. Single-voxel 1H-MR spectra were acquired from a volume of 30 × 30 × 30 mm3 positioned in the center of the right liver lobe, avoiding large vessel structures (Figure 2). A STEAM localization sequence without water suppression was used for data acquisition. To allow for correction of relaxation effects on signal intensity, both long repetition time (3 seconds) and 4 TEs (20, 30, 40, and 50 milliseconds) were used. Six averages were obtained during breath holding for 18 seconds. For each TE, the 1H-MRS measurement was performed in duplicate. Measurements were performed at least 6 hours after the last PN infusion. Postprocessing was performed in exactly the same way for all patients and consisted of time-domain fitting of the water signal resonating at 4.7 ppm and the methylene lipid peak at 1.3 ppm with the AMARES quantification method in the jMRUI analysis software (www.jmrui.eu). For reliable determination of the LFC, shortened T2 relaxation behavior of water 18 —possibly due to hepatic accumulation of paramagnetic PN constituents such as iron, manganese, and copper—has to be taken into account. To correct for T2 relaxation, the ratio of the signal intensities of lipid (L) and water (W) was plotted as a function of TE. L/W was determined for each TE separately to eliminate effects of possible amplitude variation among subsequently acquired spectra. It is not possible to directly measure the L/W at TE = 0 milliseconds, or (L/W)0, which is the time point where T2 relaxation effects are absent. Therefore, an exponential function L/W = (L/W)0·exp(TE*K) with K = (1/T2W – 1/T2L) was fitted to the data to obtain the value (L/W)0, with GraphPad Prism (version 5.03; GraphPad Software, Inc, La Jolla, CA), with goodness of fit expressed as an R2 value. LFC in percentage, defined as 100 × [L/(W + L)] at TE = 0 milliseconds, was calculated by the formula [100 × (L/W)0] / [1 + (L/W)0].
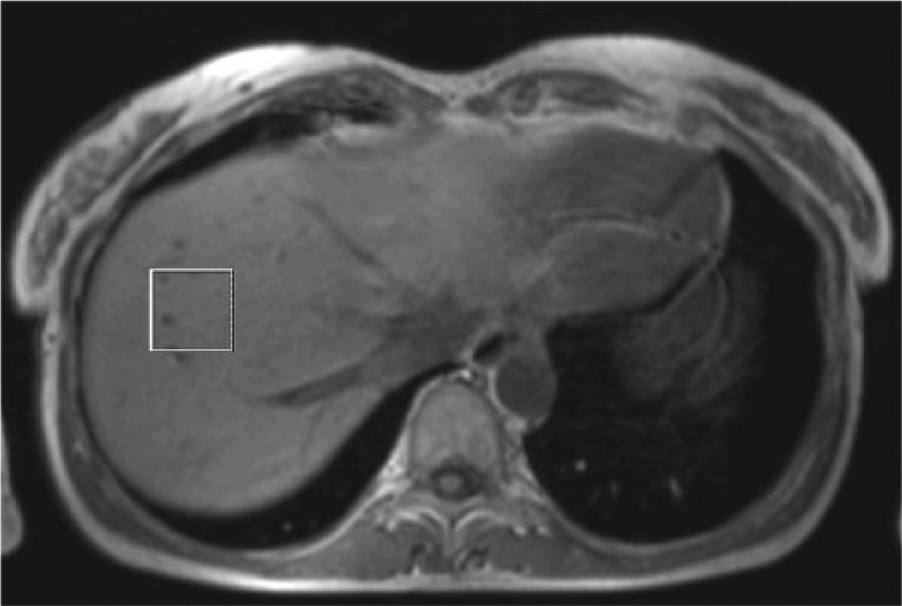
Voxel position (box) in a liver on an axial slice.
A reference K value of 0.015 milliseconds-1 was calculated from literature values for T2 of water and lipid (T2W and T2L) of 34 and 68 milliseconds, respectively, at a magnetic field of 3 T.19,20
Data Handling and Statistical Analysis
For all patients, the following data were recorded: sex, age, body mass index (kg/m2), cause of intestinal failure, clinical classification of intestinal failure according to the guideline of the European Society for Clinical Nutrition and Metabolism, 6 duration of HPN use and frequency of HPN days per week, amount of energy, and amount of carbohydrates and lipids per kg body weight infused by HPN at the time of 1H-MRS measurement. Furthermore, liver enzymes were collected: alkaline phosphatase, γ-glutamyl transferase, aspartate aminotransferase, alanine aminotransferase, total bilirubin, and direct bilirubin. If available, serum levels of iron, iron-binding capacity, ferritin, C-reactive protein, manganese, and copper were recorded from the patient’s medical chart. Information on the presence of diabetes, known alcohol abuse (defined as >1 unit per day), and concomitant medication was collected as well. Patient demographics and clinical characteristics were presented as medians (interquartile ranges) or actual patient numbers (percentages). Patients with normal (<5%) versus increased (≥5%) LFC 14 were compared with the Mann-Whitney U test for continuous variables and Fisher’s exact test for binary variables (SPSS 22; IBM, Chicago, Illinois). A 2-sided P < .05 was considered statistically significant.
Results
1H-MRS analysis revealed increased LFC (≥5%) in 5 patients (Figure 3), with a median value of 10.3% (Table 1), while 10 patients had normal LFC (0.9%).
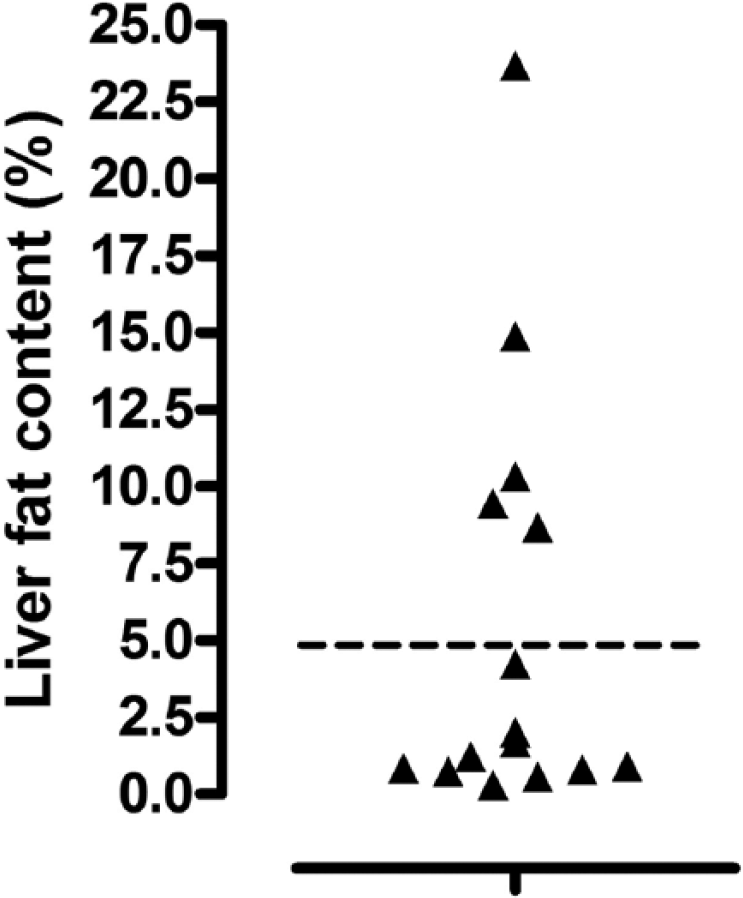
Scatter plot of liver fat content of 15 patients with chronic intestinal failure who were receiving long-term home parenteral nutrition, determined by proton magnetic resonance spectroscopy. Horizontal line in the graph is the upper level of normal for liver fat content (5%).
Patient Demographics and Clinical Characteristics. a
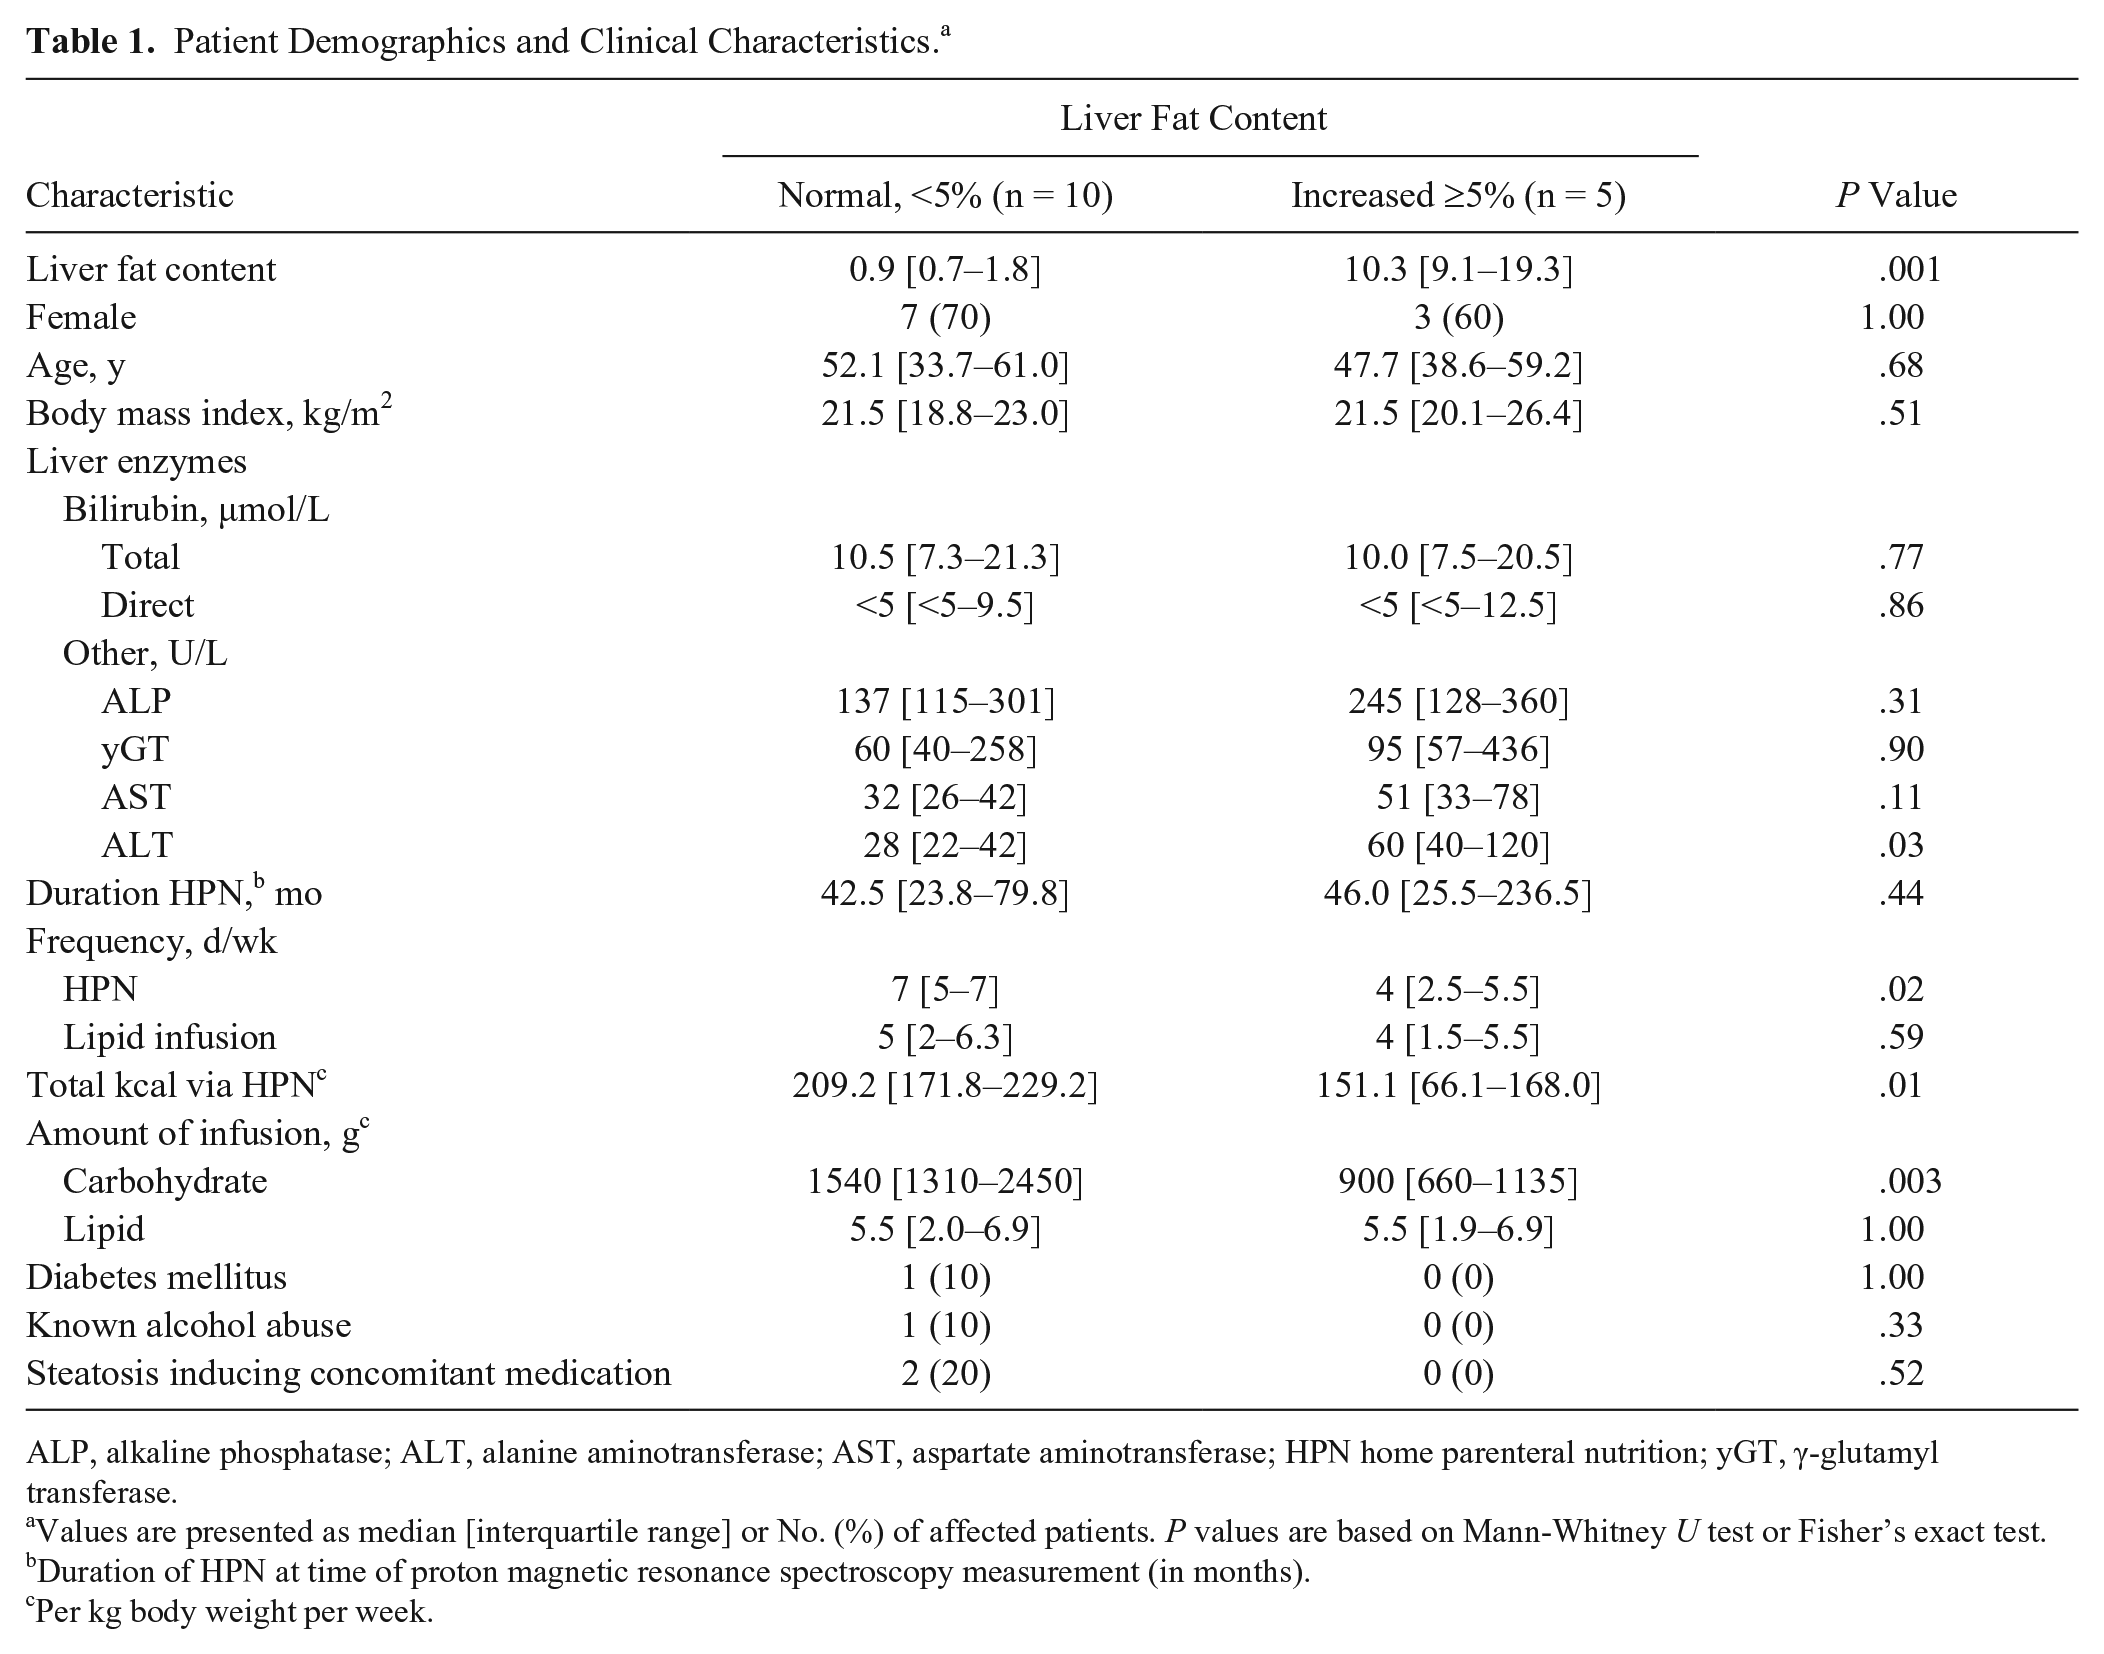
ALP, alkaline phosphatase; ALT, alanine aminotransferase; AST, aspartate aminotransferase; HPN home parenteral nutrition; yGT, γ-glutamyl transferase.
Values are presented as median [interquartile range] or No. (%) of affected patients. P values are based on Mann-Whitney U test or Fisher’s exact test.
Duration of HPN at time of proton magnetic resonance spectroscopy measurement (in months).
Per kg body weight per week.
Liver 1H-MR spectra of good quality were obtained in 14 of 15 patients. Figure 4 shows an example of the liver MR spectra of a patient with normal LFC and one with high LFC. A higher signal is present at a resonance frequency of 1.3 ppm for the patient with increased LFC, which represents the lipid signal.
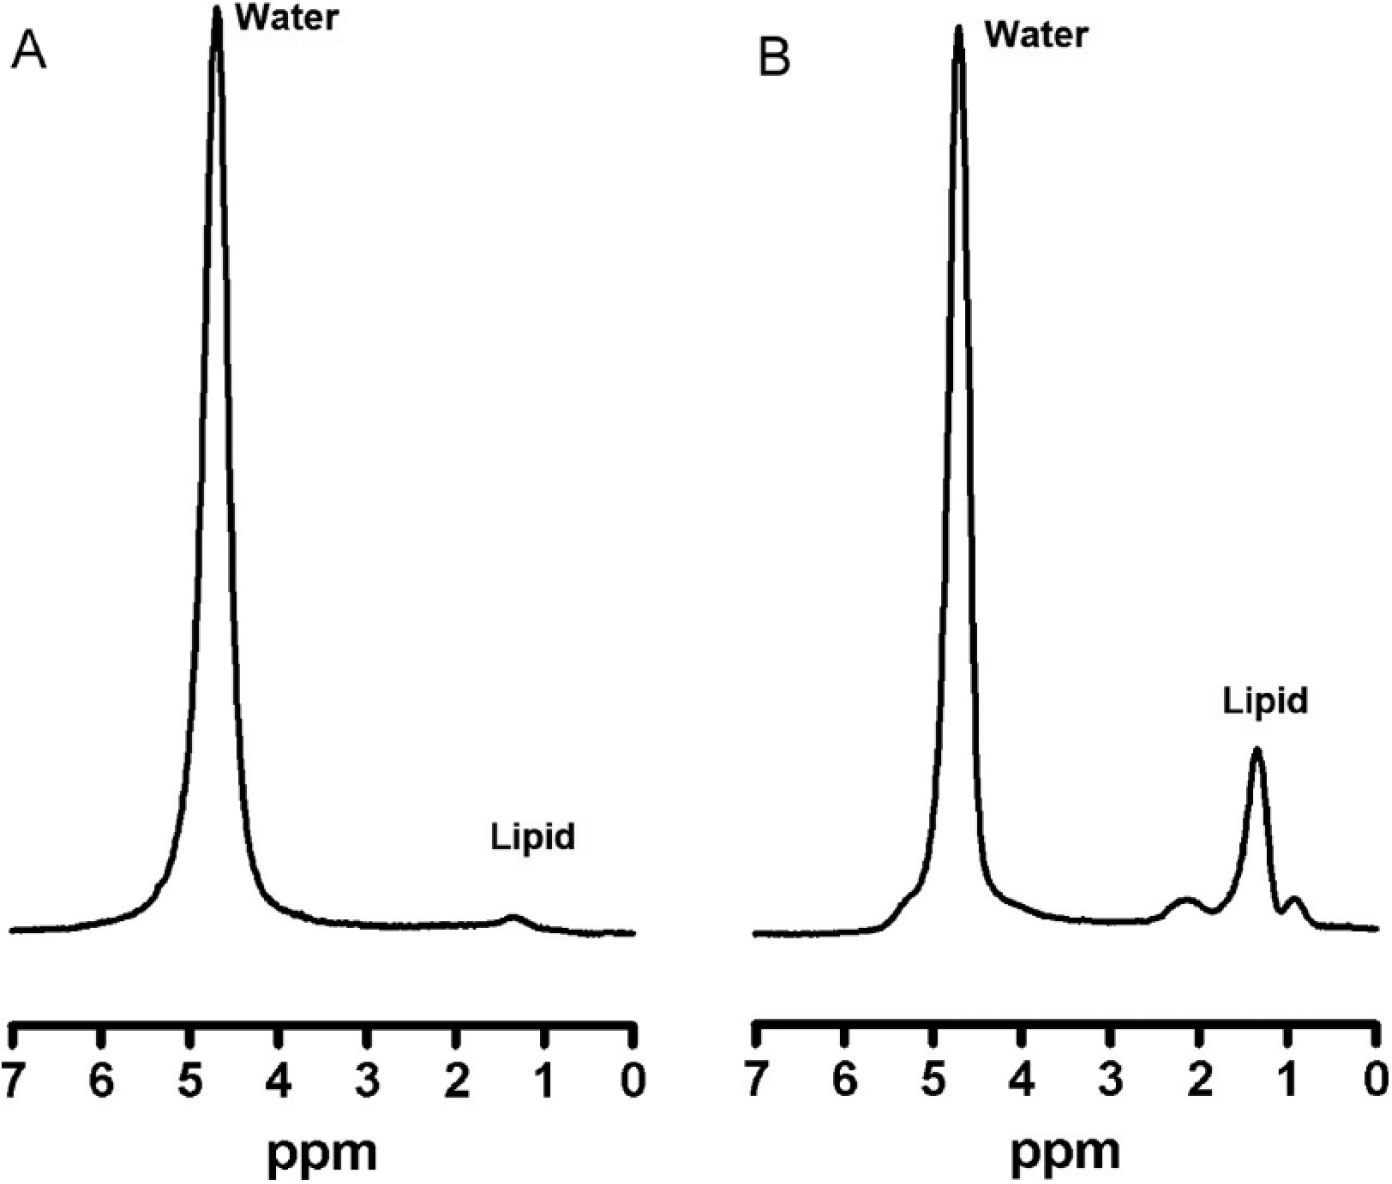
Liver magnetic resonance spectra (echo time = 20 milliseconds) of 2 patients with low (A) and high (B) LFC. Water indicates water signal; lipid indicates lipid methylene signal (resonance frequency at 4.7 and 1.3 ppm, respectively).
Figure 5 shows for 2 patients the L/W as a function of TE with an exponential fit. These 2 patients have similar LFC (approximately 2%), which can be calculated from the intercept of the curve—(L/W)0 at TE = 0 milliseconds—but they have different relaxation behavior, with K values of 0.035 and 0.016 milliseconds-1 (ie, different time constants of the exponential curves). Figure 5 illustrates that if LFC would be calculated from the L/W at TE ≥20 milliseconds, LFC would be overestimated. This is especially valid for patient 1, who has a higher K value than patient 2, as visualized by a faster exponential increase of L/W as a function of TE. This suggests a higher accumulation of paramagnetic components in the liver of patient 1 than in the liver of patient 2.
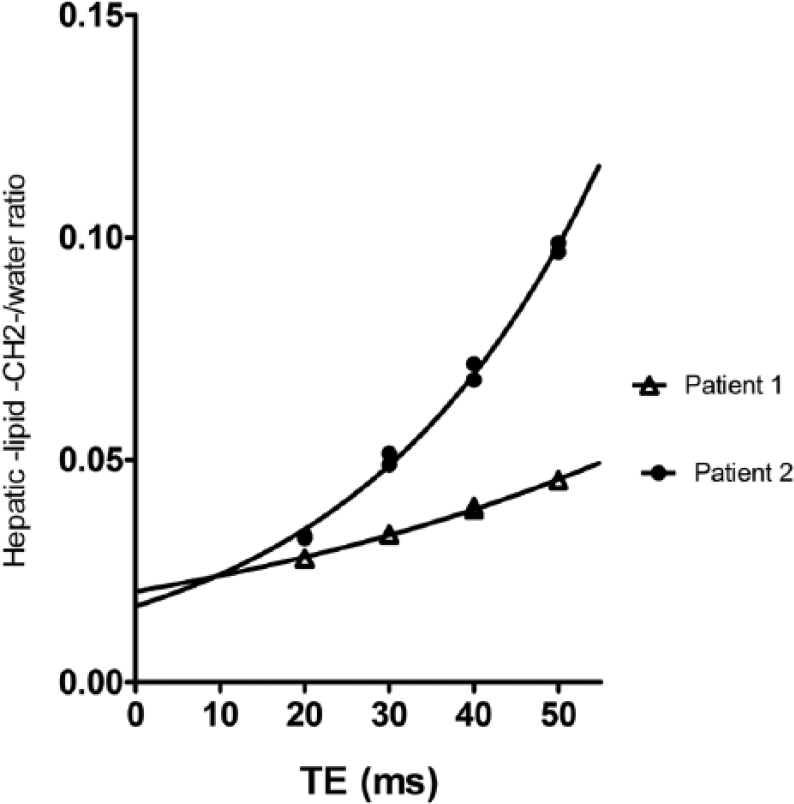
Correction for T2 relaxation effects. Lipid/water as function of echo time with an exponential fit of 2 patients. Similar liver fat content but different relaxation behavior. Liver fat content can be calculated with the lipid:water ratio at an echo time of 0 milliseconds.
The mean R2 value of the goodness of fit of the exponential function for 14 of 15 patients was 0.97, with a standard deviation of 0.03. For 1 patient, who received an iron dextran complex within 2 weeks before the examination, 1H-MRS spectra were not representative. Spectra of this patient showed broadened resonances, and the signal-to-noise ratio was reduced, especially at the longest TEs (40 and 50 milliseconds). The R2 value of the goodness of fit of the exponential function was considerably lower for this patient, being 0.65. All patients showed shortened T2 relaxation behavior of water to some extent, which can be extracted from an increased K value. K values obtained in our study population were in the range between 0.016 and 0.035 milliseconds-1, which is higher than the reference value of 0.015 milliseconds-1.
Table 1 and Supplementary Tables S1 and S2 provide patients’ demographical and clinical characteristics. When the characteristics between the patients with normal (<5%) and increased (≥5%) LFC were compared, patients with increased LFC had a higher median alanine aminotransferase value (60 vs 28 U/L). Unexpectedly, among patients with increased LFC, the frequency of HPN days per week was lower than in the group with normal LFC, 4 and 7 days, respectively. Furthermore, the median of calories (per kg body weight per week) provided by HPN was higher in the group with normal LFC (180.5 vs 151.1 kcal), as was the amount of infused carbohydrates (1540 vs 900 g). All other characteristics were comparable between the 2 groups.
In all patients, serum iron levels and iron-binding capacity were determined, and the values were within or below the reference range (data not shown). In 5 patients, ferritin was measured as well, with an elevated concentration in 3 of them, with slightly elevated C-reactive protein in 2 patients. In the third patient, ferritin concentration was very high (3632 µg/L) following a recent (within 2 weeks prior to 1H-MRS measurement) infusion of a ferric compound because of anemia. Plasma manganese (reference value, 7–20 nmol/L) was assessed in only 3 patients close to the date of the 1H-MRS measurement. One of these patients had a significantly increased manganese plasma level of 49.3 nmol/L combined with cholestatic liver enzymes; therefore, supplementation of lipids, lipid-soluble vitamins, and trace elements was terminated. No recent serum copper levels were available for any of the patients. MR imaging revealed additional findings in 10 patients: cholelithiasis in 6 patients, enlarged adrenal gland in 2, (hepato)splenomegaly in 1, and choledochocystolithiasis with normal liver tests in 1 patient.
Discussion
In our current study, LFC was assessed in 15 adult patients receiving long-term HPN with noninvasive 1H-MRS, taking into account the possibility of accumulation of paramagnetic constituents in the liver. Representative 1H-MRS spectra were obtained in 14 of 15 patients, and we found elevated LFC in 5 patients. To accurately quantify liver fat, 1H-MRS must reflect water and fat content without influences from other factors, because liver lipid calculation relies on the ratio between lipid and water amounts. Therefore, the 1H-MRS spectra in our study were acquired with a long repetition time and multiple TEs to allow correction of the signal amplitudes for water and fat for (altered) relaxation effects. 18 This is of particular importance in the determination of LFC, as it has been shown that paramagnetic components in the liver unequally affect the MR signals of water and lipid. 21 This may be the result of these components localizing preferentially in the water compartment, causing greater susceptibility effects on water protons. The consequence is a disproportionately faster loss in liver water signal relative to lipid signal, and this decay may falsely augment measured LFC with traditional, uncorrected 1H-MRS sequences. Our patients who use long-term HPN with addition of paramagnetic trace elements such as manganese, copper, and iron from fixed-concentration trace element supplements are probably even more prone to this effect than the general population due to possible liver accumulation of these trace elements.6,17,22,23 This is supported by the fact that all patients showed increased K values compared with the reference value of 0.015 milliseconds-1, indicating shortened T2 relaxation behavior of water probably due to accumulation of paramagnetic constituents in the liver. A limitation of our study is that we have no histology to prove this assumption. As an alternative, we looked at available serum iron levels, iron-binding capacity, and ferritin levels, as well as serum manganese and copper levels. In 1 patient with a high ferritin concentration (3632 µg/L) after recent transfusion with a ferric compound, very broadened resonances of the 1H-MRS spectra were seen, probably due to high amounts of iron accumulation in the liver. Except for the results obtained in this 1 patient, our results are in line with those of Kang and colleagues, who showed that the assessment of hepatic steatosis with 1H-MRS with multiecho acquisition to correct for T2 effects was not affected by hepatic iron deposition. 24 The results of Kang et al may not be applicable to patients with exceptionally high iron deposition, as these patients were not included in that study.
Regular monitoring of patients receiving fixed doses of manganese over prolonged periods is recommended, 6 but there is no readily available indicator of whole body manganese status. Elevated serum, plasma, red blood cell, and whole blood manganese concentrations have been reported in patients receiving PN, usually without symptoms, also at conventional doses between 0.15 and 0.8 mg/d when taken over a prolonged period.6,25 It is very well possible that, without reaching levels of toxicity, manganese that has accumulated in the liver influences 1H-MRS signals, especially because manganese is mainly excreted in the bile and because hepatic dysfunction and cholestasis are suspected risk factors for increased manganese accumulation. The same can be said for copper, as this trace element is also mainly excreted in bile.6,26
Hepatic steatosis is an important histologic feature in adult patients with IFALD. 8 A small proportion of patients with chronic intestinal failure are at risk of developing serious liver complications, including end-stage liver disease. Early interventions may prevent these adverse outcomes. The accuracy and safety of 1H-MRS make it a good methodology to assess LFC, to examine changes in steatosis over time, or to determine changes in response to therapeutic interventions. One study previously reported on the clinical application of 1H-MRS in 6 adult patients receiving long-term HPN. 11 The results were compared with 6 healthy controls, and a significant difference in lipid:water ratio was found. In this study, 1H-MRS spectra were measured at a single TE (35 milliseconds); thus, no correction was made for the confounding T2 relaxation effects. Furthermore, LFC was defined differently than in our study, and it is therefore difficult to compare their result with ours.
Ideally, our findings should be confirmed comparing 1H-MRS with liver biopsies in this population, but because of its invasive nature, there are ethical concerns to perform the biopsy for research purposes. However, 1H-MRS has increasingly been accepted as an alternative to liver biopsy to assess and quantify hepatic steatosis and is now regarded as one of the most adequate practical methods of measuring liver fat in clinical practice, 13 especially for longitudinal follow-up of patients. Furthermore, with MR imaging, which can be performed in 1 session, it provides information on hepatic and bile duct anatomy.
A limitation of using 1H-MRS is that no information is obtained on liver inflammation or fibrosis. Currently, there is no information on the outcomes for patients with and without IFALD-related steatosis. But the use of 1H-MRS could provide more insight into this, because noninvasive follow-up is possible. Another potential drawback is that 1H-MRS cannot be performed in all patients (eg, in those with metal-containing devices or claustrophobia), and the technique is currently not readily available in all hospitals. Conventional ultrasound can be used to show moderate to severe steatosis at low cost, is easily accessible, and can be used as a point-of-care test during a clinic visit. However, conventional ultrasound is typically not recommended when an accurate diagnosis or precise severity grading is required. Quantitative ultrasound technique might be a good alternative in the future. Computer-aided ultrasound—a technique that was recently evaluated within our group to quantify hepatic steatosis—showed a good correlation between the residual attenuation coefficient (one of the parameters obtained by computer-aided ultrasound) and LFC measured by 1H-MRS in our pilot group of long-term patients receiving HPN. 27 Additional research will need to be done to bolster these data.
The results of the present pilot study, although limited in sample size, shows higher alanine aminotransferase values in the steatosis group than in the patient group with normal LFC. The other liver enzymes were comparable between the 2 groups. As the use of PN is considered to be an important risk factor for developing IFALD,3,9,28 PN characteristics were compared between the groups with high and normal LFC. Surprisingly, the patients with normal LFC had more HPN infusion days per week, with more HPN calories per week, than the steatosis group. The high LFC could furthermore not be explained by differences in type of lipid emulsion, the duration, or the amount of lipids infused (Table 1, Supplementary Table S2). Other risk factors for steatosis—such as body mass index, alcohol use, diabetes, or concomitant use of steatosis-inducing medication, were comparable between the 2 groups (Table 1). Other factors possibly play a role, such as oral food intake of energy, physical activity, or other implicated risk factors of IFALD not evaluated in this study. 9
In conclusion, our results show that 1H-MRS is suitable to quantify LFC in adult patients receiving long-term HPN, as long as altered T2 relaxation behavior is taken into account. LFC measured by 1H-MRS seems less reliable after recent ferric compound infusion, which should be kept in mind in planning 1H-MRS in this patient group. Factors explaining the difference in LFC were not identified.
Footnotes
Financial disclosure:
None declared.
Conflicts of interest:
None declared.
Statement of Authorship
G. Wanten and M. van der Graaf contributed to the conception and design of the research; M. van der Graaf, A. Huijbers, and H. M. Dekker contributed to the acquisition, analysis, or interpretation of the data; and A. Huijbers, G. Wanten, and M. van der Graaf drafted the manuscript. All authors critically revised the manuscript, agree to be fully accountable for ensuring the integrity and accuracy of the work, and read and approved the final manuscript.
References
Supplementary Material
Please find the following supplemental material available below.
For Open Access articles published under a Creative Commons License, all supplemental material carries the same license as the article it is associated with.
For non-Open Access articles published, all supplemental material carries a non-exclusive license, and permission requests for re-use of supplemental material or any part of supplemental material shall be sent directly to the copyright owner as specified in the copyright notice associated with the article.