
Abstract
In accounting and auditing, critical monetary estimation applications based on sampling often rely on stratified mean-per-unit (SMPU) sampling due to the technique’s unique ability to produce trustworthy confidence intervals when applied to low-error populations. Although reliable, SMPU yields less precise confidence intervals than other estimation techniques. To address this weakness, we present and test a data transformation procedure for use with SMPU-Intrastratum Counterbalancing. After strata boundaries are finalized but prior to sample selection, this procedure creates new sampling units in each stratum by counterbalancing original stratum population elements one or more times. As a result, the number of strata sampling units and strata standard deviations are reduced. These changes reduce the SMPU estimator standard deviation thereby improving precision. In simulations using real accounting populations, counterbalancing produced large improvements in precision. Compared to SMPU without counterbalancing, one application of counterbalancing produced a 52% improvement in mean precision while a second application produced a 73% improvement in mean precision. These improvements were achieved with no change in the number of original population elements examined and suggest that use of Intrastratum Counterbalancing would be beneficial in many SMPU estimation applications. Equations are provided for planning Intrastratum Counterbalancing applications.
Keywords
Introduction
Statistical sampling has long been recognized as a useful tool for accountants and auditors and is used in both hypothesis testing and monetary estimation applications (American Institute of Certified Public Accountants [AICPA], 2019, §2.38; Arkin, 1963; Backer & Fertig, 1958; Cyert & Davidson, 1962; Hill et al., 1962; Vance & Neter, 1957). Despite technological advances in accounting systems and audit practice (Kogan et al., 2019; Salijeni et al., 2019), and the resulting ability to programmatically perform many accounting and auditing activities, statistical sampling remains a useful tool (Hall et al., 2024; Lowe et al., 2018; Public Company Accounting Oversight Board [PCAOB], 2020). 1 Given this fact, both the Uniform CPA Examination and the Certified Internal Auditor Examination include sampling-related questions (AICPA, 2024; Institute of Internal Auditors [IIA], 2025).
For critical monetary estimation applications based on sampling, accountants and auditors typically rely on one of four statistical techniques: difference, ratio, regression, or stratified mean-per-unit (SMPU). If the population in question is expected to contain significant monetary error, a difference, ratio, or regression estimator will be used because these estimators yield better precision than SMPU (Neter & Loebbecke, 1975). However, these estimators tend to produce untrustworthy confidence intervals when few monetary errors are found (Duke et al., 1985; Loebbecke & Neter, 1975; Neter & Loebbecke, 1975). 2 In contrast, tests conducted by Neter and Loebbecke (1975) found that SMPU produces reliable confidence intervals over a wide range of error conditions, including low-error conditions. SMPU’s ability to produce reliable confidence intervals for low-error populations and the fact that most accounting and auditing populations exhibit low error (Allen & Elder, 2005; Durney et al., 2014) explain the common use of SMPU in critical monetary estimation applications.
Given the common use of SMPU in critical monetary estimation applications and the technique’s inferior precision relative to other techniques (Kaplan, 1973; Neter & Loebbecke, 1975), a procedure for improving the precision of SMPU estimates is needed. To address this need, we present and test a data transformation procedure for use with SMPU-Intrastratum Counterbalancing. After strata boundaries are finalized but prior to sample selection, this procedure creates new sampling units in each stratum by counterbalancing original stratum population elements one or more times. As a result, the number of strata sampling units and strata standard deviations in the transformed data set are reduced relative to the original data set. These changes reduce the SMPU estimator standard deviation thereby improving precision. In simulations using real accounting populations seeded with low error and a fixed sample size measured in original population elements (hereafter real sample size), counterbalancing produced large improvements in precision. Relative to SMPU without counterbalancing, one application of counterbalancing produced a 52% improvement in mean precision while a second application produced a 73% improvement in mean precision.
Our study contributes to the accounting and auditing literatures by presenting Intrastratum Counterbalancing and documenting the procedure’s ability to produce large improvements in SMPU precision. We also present equations for estimating SMPU precision with, and without, the use of counterbalancing. These equations should be helpful in deciding when to use counterbalancing. Our results should be of interest to accounting and auditing professionals who plan and execute SMPU monetary estimation applications and standard setting authorities responsible for providing guidance on sampling matters.
Our presentation proceeds as follows. The next section provides a definition of critical monetary estimation applications and identifies examples of these applications. This is followed by a review of SMPU mechanics, an explanation of Intrastratum Counterbalancing mechanics and its predicted effects on SMPU precision. We next present study hypotheses, details of the study methodology, and findings. The closing section presents a discussion of study results. Equations for projecting SMPU precision with, and without, counterbalancing are presented in the Appendix.
Critical Monetary Estimation Applications Defined
In accounting and auditing, a SMPU procedure may be executed as part of a hypothesis test or a monetary estimation application (AICPA, 2019, §2.38). With a hypothesis test, the SMPU procedure is executed to help determine whether the total recorded value of a population is materially correct. 3 Assurance for the hypothesis test is typically derived from multiple sources of evidence including assessments of inherent risk, tests of internal control, analytical procedures, and the sample result (AICPA, 2019, §2.06; PCAOB, 2025, ¶.19). In contrast, a monetary estimation application is executed to determine a population’s total correct value. These applications are performed when: (1) the auditor has decided to reject a hypothesis that the recorded value is materially correct or (2) there is no recorded value and one is needed. When a monetary estimation application is executed, all of the assurance for the test is derived from the sample result.
Monetary estimation applications may be classified as critical or noncritical. When the failure to reach a correct decision creates substantial legal, monetary, regulatory, or reputational risk, the estimation application is considered critical. Critical tests require more evidence and a higher level of assurance than noncritical tests. As a result, sample sizes for critical SMPU applications are substantially larger than sample sizes for noncritical SMPU applications.
This study is concerned with improving the precision of critical SMPU monetary estimation applications. These applications are routinely performed by external auditors, corporate accountants, and governmental auditors. For example, in a financial statement audit, after conducting various tests, an external auditor may decide to reject a hypothesis that the recorded value of a major asset is materially correct. In this circumstance, the external auditor may proceed to estimate the correct total value of the asset via SMPU. Outside of financial statement audits, external auditors conduct critical SMPU applications in agreed-upon procedures engagements and forensic audits. Corporate accountants perform critical SMPU applications in a variety of circumstances including cost segregation studies and estimating the basis of stock acquired in a tax-free stock-for-stock exchange. Governmental auditors perform critical SMPU applications when performing sales tax audits and audits of amounts reported on federal and state tax returns.
SMPU Mechanics
SMPU is commonly used in applications where the total recorded value (
As a first step in the estimation process, individually significant members of the population are identified, placed in a census stratum, and fully examined (AICPA, 2019; Guy et al., 2002; PCAOB, 2025, ¶.21). This practice ensures that individually significant items are always examined and yields several beneficial effects including: (1) improving estimator precision by reducing the estimator variance and (2) enhancing confidence interval reliability by reducing skewness in the sampled population. An individually significant member may be identified based on its recorded value or other risk-related characteristics. Due to the fact that all members of the census stratum are examined, results for this stratum do not affect SMPU precision. In hypothesis testing applications where overstatement error is the primary concern, auditors may also remove (trim) very small items from the sampling field as these items present no risk of material overstatement. However, in estimation applications where the objective is to estimate the total correct value of a monetary amount, very small items are not typically removed (trimmed) from the sampling field.
After creation of the census stratum, the remaining N members of the population are grouped into sampling strata. Due to their availability and high correlation with correct values in low-error populations, individual recorded values (
Specification of a minimum stratum sample size (

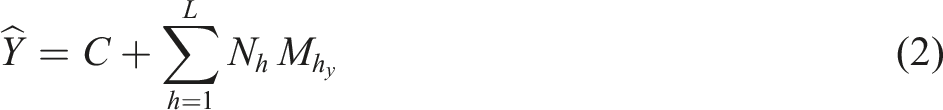
Upon completion of the examination, an estimate of the total correct value is computed as:


The precision (

In equation (6), the multiplier

Intrastratum Counterbalancing
Overview
Intrastratum Counterbalancing is a data transformation procedure applied after strata boundaries are finalized but prior to sample selection. The process of counterbalancing may be performed multiple times. While any basis for stratification may be used, a reliable proxy for correct values must be known to apply Intrastratum Counterbalancing. In accounting and auditing with low-error populations, recorded values should perform well as a proxy.
For expositional clarity, the remaining sections adopt two naming conventions. First, the subscripts cb0, cb1, cb2, cba, and cbv are used to distinguish between sampling applications using: (1) SMPU without counterbalancing (cb0 or zero-order counterbalancing), (2) SMPU with counterbalancing applied once (cb1 or first-order counterbalancing), (3) SMPU with counterbalancing applied twice (cb2 or second-order counterbalancing), (4) SMPU with counterbalancing applied a times (cba or a-order counterbalancing), or (5) SMPU with counterbalancing where the level of counterbalancing may vary. Second, when the sample size (
With conventional SMPU, the set of
Effect of Counterbalancing on Stratum Characteristics
Number of Stratum Sampling Units
Under ideal circumstances, prior to counterbalancing, the number of stratum sampling units in stratum A
h
(i.e.,
If counterbalancing is applied twice (a = 2), each of the resulting sampling units in set
In general, for a-order counterbalancing (
Stratum Sampling Fraction
In SMPU applications where the stratum sample size is determined using Neyman Allocation (Neyman, 1934), the stratum sampling fraction (
Stratum Standard Deviation
Excluding circumstances where stratum sampling unit correct values (
Screening and Construction of Sampling Strata
Ideally, once the number of counterbalancing applications (
When a sampling stratum at a particular stage (1) Sort (2) Designate one sampling unit in (3) Apply counterbalancing to the remaining sampling units in (4) The resulting next set of stratum sampling units (
These modified counterbalancing procedures introduce additional complexity into the counterbalancing process. To avoid this complexity and related work effort, if the value (1) Alter stratum boundaries until (2) Move one or more sampling units from the top sampling stratum to the census stratum to force an even number of sampling units in the top stratum. (3) Add a dummy sampling unit with a correct value of zero to each sampling stratum containing an odd number of sampling units. The recorded value of this dummy sampling unit should be set so that it is the smallest recorded value in the stratum.
In many applications, using a combination of the first two procedures will be sufficient.
Predicted Effect of Counterbalancing on SMPU Estimator Variance
Recall from equation (3), the contribution (

Under an assumption that counterbalancing maintains a constant sampling fraction, the variable

In equation (9), the contribution of sampling stratum A
h
to the estimator variance is a function of the stratum sampling fraction, number of stratum sampling units, and stratum variance. Given the assumption of a constant sampling fraction, and a recognition that the number of stratum sampling units and stratum variance vary with the number of times that counterbalancing is applied, equation (9) can be restated as:

To determine how successive counterbalancing applications affect the contribution of sampling stratum A
h
to the estimator variance, we take the total differential of equation (10). The result is:

With each successive counterbalancing application, the increment
Numeric Example: Effect of Counterbalancing on Stratum Standard Deviation
Stratum A h Sampling Units Prior to Counterbalancing (Sorted in Ascending Order on Recorded Value)

aThe sampling units presented in this table are cb0 sampling units, comprise the membership of
Stratum A h Sampling Units after First-Order Counterbalancing (Sorted in Ascending Order on Recorded Value)
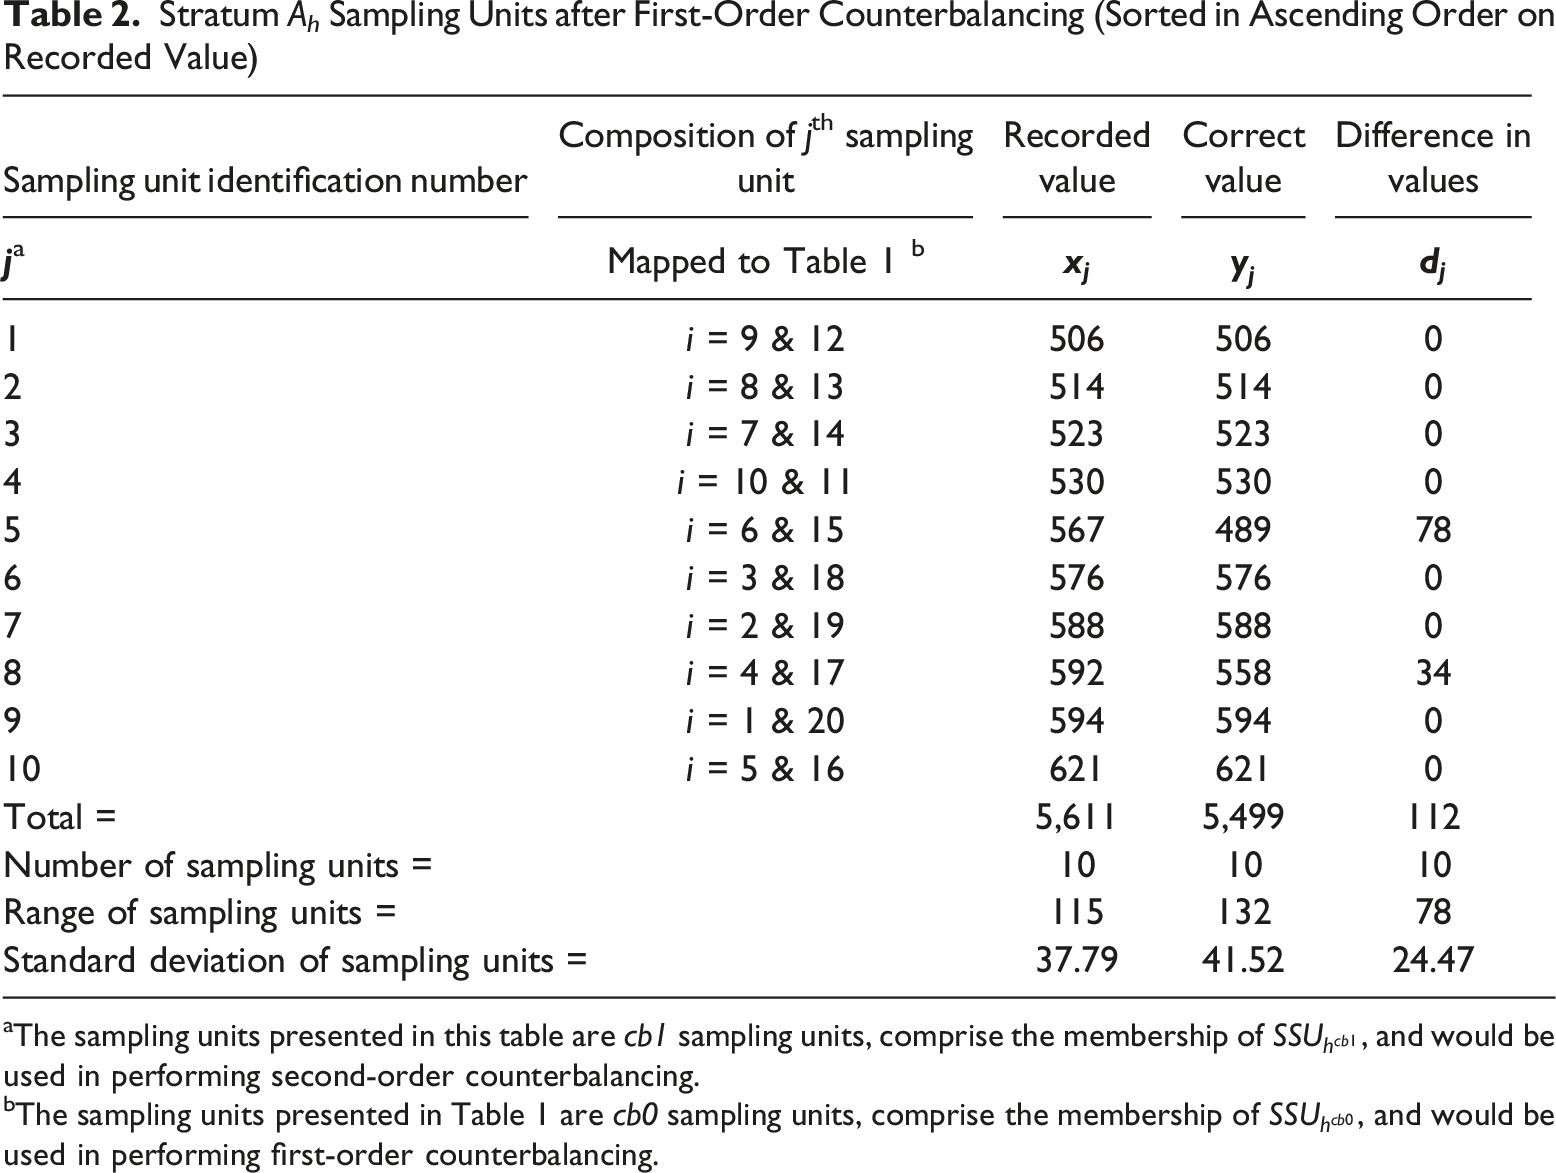
aThe sampling units presented in this table are cb1 sampling units, comprise the membership of
bThe sampling units presented in Table 1 are cb0 sampling units, comprise the membership of
Stratum A h Sampling Units after Second-Order Counterbalancing (Sorted in Ascending Order on Recorded Value)

aThe sampling units presented in this table are cb2 sampling units, comprise the membership of
bThe sampling units presented in Table 2 are cb1 sampling units, comprise the membership of
cThe sampling units presented in Table 1 are cb0 sampling units, comprise the membership of
Numeric Example: Effect of Counterbalancing on SMPU Estimator Precision
This section develops formulas to estimate the change in SMPU estimator precision (P) arising from use of Intrastratum Counterbalancing. We begin by considering how counterbalancing affects the multiplier t in equation (6). This is followed by development of numeric estimates of changes in precision when first-order counterbalancing is used.
Effect of Counterbalancing on the Multiplier t
In applications where a standard normal deviate (i.e., z-value) is used in computing precision (P), counterbalancing will have no effect on the multiplier t. If a Student’s t-value is used in computing precision (P), given the typical characteristics of accounting and auditing estimation applications (n = 100 to 300, L = 3 to 6, and planned confidence levels of 85 to 95%), the change in t will be minor.
11
For example, with
Alternatively, with
In both of the preceding examples, first-order counterbalancing increased the multiplier t by a small magnitude. Because counterbalancing always reduces the number of sampling units examined, each successive application of counterbalancing reduces the application degrees of freedom and increases the multiplier t (assuming use of a Student’s t-value). Absent other counterbalancing effects, this degrades precision. However, as demonstrated in the next two sections, other effects induced by counterbalancing lead to improved precision.
Effect of First-Order Counterbalancing on Precision
Based on equations (4) and (6), estimator precision assuming conventional SMPU (cb0) and SMPU with first-order counterbalancing (cb1) are:

To determine how first-order counterbalancing affects estimator precision, we compute the ratio of SMPU precision with first-order counterbalancing divided by SMPU precision without counterbalancing. The result is:
A ratio less than one indicates precision with first-order counterbalancing is better than precision with conventional SMPU. The result is a narrower confidence interval and improved precision.
For hypothesis-development purposes, we model strata variances with first-order counterbalancing as the product of variances with zero-order counterbalancing (i.e., conventional SMPU) and a constant multiplier 
We also model the multiplier 
Assuming strata sampling fractions are constant, substituting 
After cancellations, the result for first-order counterbalancing is:
Based on equation (18), if first-order counterbalancing reduces conventional SMPU strata variances by 20% (
Effect of Second-Order Counterbalancing on Precision
To determine how second-order counterbalancing affects estimator precision, we use the same logic as before but compare precision with second-order counterbalancing to precision with no counterbalancing. The result is:
To simplify equation (19) we model strata variances with second-order counterbalancing as the product of variances with conventional SMPU and a constant 
We also model the multiplier 
Finally, we substitute 
After cancellations, the result for second-order counterbalancing is:
If second-order counterbalancing reduces conventional SMPU strata variances by 20% (
The preceding results can be generalized as follows. The precision of SMPU with a-order counterbalancing relative to precision with conventional SMPU can be estimated as:
Planning Intrastratum Counterbalancing
In most cases, the application of counterbalancing in all sampling strata will improve SMPU estimation precision. In rare cases, counterbalancing in all strata will improve SMPU estimation precision overall, but some sampling strata will not benefit from the application of counterbalancing. To help plan the use of counterbalancing, the Appendix provides equations for: (1) assessing whether counterbalancing in all sampling strata will improve SMPU estimation precision and (2) identifying those sampling strata where the use of counterbalancing will not be beneficial.
Hypotheses
Given the predictions derived from equations (18) and (23), we expect first-order and second-order counterbalancing will yield better (smaller) estimator precision than conventional SMPU. We also expect that second-order counterbalancing will yield better (smaller) estimator precision than first-order counterbalancing. Hence, our hypotheses are:
For low-error populations, SMPU estimation with first-order counterbalancing yields better (smaller) mean precision values than SMPU estimation without counterbalancing (i.e.,
For low-error populations, SMPU estimation with second-order counterbalancing yields better (smaller) mean precision values than SMPU estimation without counterbalancing (i.e.,
For low-error populations, SMPU estimation with second-order counterbalancing yields better (smaller) mean precision values than SMPU estimation with first-order counterbalancing (i.e.,
The preceding hypotheses are tested via simulation using real accounting populations, realistic numbers of sampling strata, and realistic population misstatement rates. 12 Although our hypotheses do not involve the number of sampling strata or population misstatement rates, these factors are manipulated in our simulations to enhance the external validity of our tests. These manipulations also permit testing for important interactions between: (1) counterbalancing and the number of sampling strata, and (2) counterbalancing and the population misstatement rate.
Methodology
Overview
The study used a 3 (Counterbalancing Applications) × 3 (Number of Strata) × 4 (Misstatement Rate) factorial repeated-measures design with one observation for each of 10 populations in each of the 36 design cells. 13 A repeated-measures design was employed because relatively few real accounting populations were available making use of unique populations in each design cell infeasible. Within each cell of the experimental design, the response measure for each population was the mean SMPU estimation precision derived from 10,000 stratified random samples selected from that specific population. This large number of samples was used to eliminate the possibility that an unrepresentative sample would bias study results. In total, our simulations generated 3,600,000 stratified random samples (36 design cells x 10 populations x 10,000 samples for each population) that were averaged to create a total of 360 measures of mean SMPU estimation precision. These observations were analyzed for main effects and interaction effects.
Manipulation #1: Counterbalancing Applications
Counterbalancing Applications was manipulated on three treatment levels: stratified random selection with no counterbalancing (cb0), stratified random selection with first-order counterbalancing (cb1), and stratified random selection with second-order counterbalancing (cb2). This manipulation was used to permit testing of study hypotheses. In our cb1 and cb2 treatment levels, counterbalancing was applied in all sampling strata.
Manipulation #2: Number of Sampling Strata
Number of Strata was manipulated on three treatment levels: 3, 5, and 7 sampling strata. These values fall within the range commonly suggested in the accounting and auditing literatures (AICPA, 2019; Guy et al., 2002; Roberts, 1978). The range of sampling strata used in the study does not include larger values that are sometimes used in practice. Higher values were excluded to avoid empty cells in the study design.
Manipulation #3: Misstatement Rate
Misstatement Rate was manipulated on four treatment levels: 0.0%, 0.6%, 1.2%, and 1.8%. To achieve these misstatement rates, populations were seeded with four different error rates: 0.0%, 3.0%, 6.0%, and 9.0%. 14 Error magnitudes were fixed at 20% of recorded value (i.e., a 20% tainting).
Based on a study by Durney et al. (2014), study misstatement rates are consistent with rates commonly found in accounting populations. Durney et al. (2014) examined sampling data for 160 sampling applications performed by a large audit firm. Their analysis disclosed low misstatement rates in accounting populations. Fifty-eight percent of applications exhibited no error, 90% of applications exhibited a misstatement rate of 0.5% or less, 96% of applications exhibited a misstatement rate of 1.5% or less, and 100% of applications exhibited a misstatement rate of 5.0% or less.
Study Populations
Actual inventory listings for 10 business firms were obtained from a commercial inventory valuation firm. These inventory listings constitute the original populations used to create study populations. Each entry in these listings included a description of an inventory item and its recorded value. For some business firms, a single inventory listing was received (typically finished goods). For other business firms, three separate inventory listings were received (raw materials, work-in-progress, and finished goods). We exercised no control over the selection of these listings but did request they reflect the full range of characteristics in populations known to the inventory valuation firm.
Equations (4) and (6) indicate that population size is a causal factor in determining SMPU precision. As population size increases, the magnitude of precision (
Summary Statistics for Study Populations

aNumber of population members.
bValues are rounded to the nearest whole number.
Once the selection of study populations was completed, correct values for population items were created by randomly seeding four different error rates into each population (0.0, 3.0, 6.0, and 9.0%). Error magnitudes were fixed at 20% of recorded value (i.e., a 20% tainting). The result was four different versions of each population. The number of population items seeded with error was a function of the population error rate and the fixed population size (
Sample Size
Equations (4) and (6) indicate that sample size is a causal factor in determining SMPU precision when estimating a population total value. As sample size increases, the magnitude of precision (
Our sample size of
Sample Selection Procedures
Sample selection procedures began by stratifying each study population based on recorded values using the Dalenius-Hodges method of stratification and equal-width class intervals (Cochran, 1977; Dalenius & Hodges, 1959). Once strata boundaries were determined, strata recorded values were used to estimate strata standard deviations and the total real sample size (
Response Measure
Within each of the 36 design cells, 10,000 stratified random samples were selected for each population. For each of these 10,000 samples, SMPU precision was computed using estimator standard deviations derived from sample results and equation (6). A Student’s t-value was used for the multiplier
Primary Statistical Analysis
Response measures were analyzed as a 3 (Counterbalancing Applications) × 3 (Number of Strata) × 4 (Misstatement Rate) factorial repeated-measures ANOVA. All factors were treated as fixed effects and testing errors were determined by reference to Gamst et al. (2008) and Keppel (1991). A statistical test was considered significant when the resulting p-value was 0.05 or less. Orthogonal contrasts were used to test study hypotheses. To judge the practical significance of statistically significant model effects, we followed the suggestions of Keppel (1991) and Keren and Lewis (1979), and report partial omega squared values (
Supplemental Statistical Analysis
Because the study utilized a small number of actual inventory populations, the ANOVA statistical analysis was expected to have limited power. To address this limitation, supplemental analyses using Wilcoxon Rank-Sum nonparametric tests were executed for each combination of population, seeded Misstatement Rate, and number of strata used. For each of the resulting 120 sampling applications, a Wilcoxon test was performed for each of the three pair-wise combinations of Counterbalancing Applications (cb0 vs. cb1, cb0 vs. cb2, and cb1 vs. cb2) comparing SMPU precision values. 18 Each individual Wilcoxon test utilized 10,000 SMPU precision values for each of the two levels of Counterbalancing Applications (20,000 observations in total). In total, 360 Wilcoxon tests were executed. Given the large number of tests, to limit experiment-wise sampling risk, a Wilcoxon statistical test was considered significant when the resulting p-value was 0.00014 (0.05 ÷ 360) or less.
Results
Mean SMPU Precision Values
Panel A of Table 5 reports mean precision values ( • SMPU with first-order counterbalancing yielded a 52% reduction (improvement) in mean precision over SMPU without counterbalancing (Hypothesis • SMPU with second-order counterbalancing yielded a 73% reduction (improvement) in mean precision over SMPU without counterbalancing (Hypothesis • SMPU with second-order counterbalancing yielded a 45% reduction (improvement) in mean precision over SMPU with first-order counterbalancing (Hypothesis SMPU Mean Precision Values ( aSMPU with no counterbalancing (i.e., conventional SMPU). bSMPU with first-order counterbalancing. cSMPU with second-order counterbalancing.

Panel A of Table 5 also reports mean precision values for each level of counterbalancing by (1) Number of Strata and (2) Misstatement Rate. This information indicates that, although the patterns of improvement varied (suggesting the presence of interactions), in all cases second-order counterbalancing (cb2) provided the best mean precision, first-order counterbalancing (cb1) provided the second-best mean precision, and conventional SMPU (cb0) provided the worst mean precision. Information presented in Panel B of Table 5 indicates that precision improvements induced by counterbalancing increased as the number of sampling strata increased. However, information presented in Panel B indicates that precision improvements induced by counterbalancing were relatively stable regardless of the population misstatement rate.
Results presented in Table 5 are consistent with all three study hypotheses. Regardless of Number of Strata or Misstatement Rate, SMPU with first-order counterbalancing yielded better precision than conventional SMPU (Hypothesis
Primary Statistical Analysis Results
ANOVA Test Results and Effect Size Estimates

aA p-value of .05 or less is considered statistically significant.
bMedium effect size = .06 to .13 (see Cohen, 1988, pages 286-287).
cSmall effect size = .01 to .05 (see Cohen, 1988, pages 286-287).
The statistically significant result for Counterbalancing Applications in Table 6 indicates the presence of at least one significant difference among the manipulations, but does not directly address the specific comparisons identified in study hypotheses. To test study hypotheses, orthogonal contrasts were performed comparing mean precision for: (1) SMPU with no counterbalancing (cb0) versus SMPU with first-order counterbalancing (cb1), (2) SMPU with no counterbalancing (cb0) versus SMPU with second-order counterbalancing (cb2), and (3) SMPU with first-order counterbalancing (cb1) versus SMPU with second-order counterbalancing (cb2). The resulting p-values for these contrasts were .0545, .0093, and .4040, respectively. These test results confirm that differences in mean precision for conventional SMPU with no counterbalancing versus SMPU with second-order counterbalancing were statistically significant. However, no statistically significant differences were detected in the tests comparing mean SMPU precision for: (1) SMPU with no counterbalancing versus SMPU with first-order counterbalancing and (2) SMPU with first-order counterbalancing versus SMPU with second-order counterbalancing.
Table 6 also reports that all four tests for interaction between study main effects were statistically significant interactions with p-values less than 0.05. However, all four effect sizes were small (partial ω2 = .01 or less). These test results indicate the patterns of improvement in precision attributable to counterbalancing exhibited minor variations depending on the number of sampling strata and the population misstatement rate. However, the magnitudes of these variations appear to be inconsequential for the specific manipulations tested in this study.
Supplemental Statistical Analysis Results
The fact that SMPU mean precision values in Table 5 varied dramatically with the extent of counterbalancing but two of the three orthogonal contrasts used to test study hypotheses were not statistically significant suggests a lack of statistical power. To investigate this issue, a supplemental statistical analysis consisting of 360 individual Wilcoxon Rank-Sum tests was performed. Each test included a total of 20,000 individual SMPU precision values. The null hypothesis in each of these tests is that SMPU precision did not vary. Of the 120 tests comparing SMPU precision without counterbalancing (cb0) versus SMPU precision with first-order counterbalancing (cb1), all were statistically significant with p-values ≤ 0.00001. For the 120 tests comparing SMPU precision without counterbalancing (cb0) versus SMPU precision with second-order counterbalancing (cb2), all were statistically significant with p-values ≤ 0.00001. Finally, for the 120 tests comparing SMPU precision with first-order counterbalancing (cb1) versus SMPU precision using second-order counterbalancing (cb2), 116 of these tests were statistically significant with p-values ≤ 0.00001 but four of these tests did not meet the threshold for statistical significance (p-value ≤ 0.00014).
Support for Study Hypotheses
Given the theoretical predictions provided by equation (11), the pattern of mean precision values reported in Table 5, and the combined results of the primary and supplementary statistical analyses, Hypothesis
Discussion
Study Findings
Our study confirms that counterbalancing can materially improve the precision of SMPU monetary estimates in populations with low error. In study simulations, one application of counterbalancing produced a 52% improvement in mean precision while a second application of counterbalancing produced a 73% improvement in mean precision. These improvements increased in magnitude as the number of sampling strata increased, but were relatively stable over the population misstatement rates tested. Statistical tests disclosed that first-order and second-order counterbalancing produced improved precision relative to SMPU without counterbalancing. However, in a small number of cases, SMPU with second-order counterbalancing produced no improvement in mean precision when compared to SMPU with first-order counterbalancing. These results suggest a declining marginal benefit for counterbalancing, with first-order counterbalancing providing the highest likelihood of improved precision, followed by second-order counterbalancing, followed by higher order applications of counterbalancing.
Implications for Accounting and Auditing Practice
When a critical SMPU monetary estimation application is planned, the accountant or auditor specifies both desired precision and desired reliability (Arkin, 1963; Roberts, 1978) because these factors directly influence the quality and decision usefulness of the resulting monetary estimate. As indicated by equation (6), achieved estimation precision is a function of the multiplier t and the standard deviation of the monetary estimate while achieved reliability is determined by the multiplier t used in computing achieved precision. In most strata, assuming no change in real stratum sample size, Intrastratum Counterbalancing yields a smaller stratum standard deviation than conventional SMPU. In all strata, Intrastratum Counterbalancing reduces the number of strata sampling units compared to SMPU without counterbalancing. These two effects produce a smaller standard deviation for the estimated total correct value of the population. As a result, application precision and/or reliability with counterbalancing will be improved thus improving one or both of the quality metrics for the critical monetary estimate.
For external auditors, improved precision and/or reliability for critical monetary estimates should improve financial reporting quality and lead to improved audit quality (DeFond & Zhang, 2014; Francis, 2024). Outside of external auditing, the use of counterbalancing by industry accountants, governmental auditors, and internal auditors in SMPU estimation applications should also produce quality improvements. Alternatively, Intrastratum Counterbalancing might be used to reduce the real sample size while maintaining a specified precision and reliability. In these applications, the use of counterbalancing will improve efficiency rather than quality.
Although counterbalancing can significantly improve SMPU estimation precision, when statistical sampling is used in hypothesis testing, auditors will likely continue to rely on monetary unit sampling (MUS) techniques. For populations with very low-error rates where few, if any, errors are expected in sample results, MUS sample sizes are likely to be smaller than those required by SMPU even with the use of counterbalancing. The advantage of MUS for hypothesis testing arises because sample sizes are insensitive to the population size and variance. However, MUS does not perform well when the auditor is testing for understatements, population recorded values include both positive and negative amounts, the population contains both understatements and overstatements, some errors in the population exceed 100% of recorded value, or more than a few errors are expected in the sample result (AICPA, 2019, §6.07). For example, MUS would not likely be used when auditing inventory in a financial statement audit where the inventory system is poorly controlled and has historically yielded multiple overstatement and understatement errors. Similarly, in a forensic audit investigating loan fraud where a significant number of fraudulent loans are suspected, MUS would not likely be used.
When conditions indicate use of MUS is not appropriate, one of the classical variables sampling techniques should be considered. Classical techniques include SMPU, difference, ratio, and regression estimation. Research by Neter and Loebbecke (1975) indicates that SMPU provides reliable estimates regardless of population error conditions, but generally yields inferior estimation precision compared to other classical variables sampling techniques. However, other classical variables sampling techniques require error rates approaching 30% or higher to yield reliable estimates (Neter & Loebbecke, 1975). In circumstances where MUS techniques are not appropriate and the auditor is uncertain about population characteristics, SMPU is a safe choice and SMPU with counterbalancing is likely to yield improved estimation precision.
Planning SMPU Applications With Counterbalancing
Because Intrastratum Counterbalancing is a data transformation procedure rather than a modification of conventional SMPU, existing recommendations for the design of SMPU applications remain unchanged but must be applied giving recognition to characteristics of the counterbalanced strata. As reported in Hall et al. (2024), SMPU estimation efficiency is directly related to the number of sampling strata, inversely related to the minimum stratum sample size, and likely to be optimized when stratum boundaries are selected using an iterative search-based method or the well-known Dalenius-Hodges method. When Intrastratum Counterbalancing is used with SMPU, application design should be implemented based on characteristics of the transformed population. Those characteristics include a reduced number of strata sampling units, and typically reduced variation in strata sampling units.
When SMPU is used, the interplay of minimum stratum sample size and total sample size may limit the feasible number of sampling strata. While this constraint may affect any SMPU application (with or without counterbalancing), it is more likely to exist when counterbalancing is used given the smaller nominal sample size. Plausibly, there will be applications where counterbalancing does not affect how many sampling strata can be used. But it is also plausible that, for some applications, the use of counterbalancing will necessitate a reduction in the number of sampling strata. These circumstances will depend on the specific characteristics of the population and sample planning parameters.
In light of the reduced variation in strata sampling units, the minimum stratum sample size needed to reliably estimate the variation in strata sampling units will likely decline. However, in the absence of research on this issue, there is no evidential basis for specifying the degree of reduction. For low-error rate populations where 
In circumstances where the accountant or auditor prefers to use a constant minimum stratum sample size across all sampling strata, the largest value of
When planning an SMPU application, the accountant or auditor can assess whether counterbalancing will likely improve estimation precision by comparing results for Appendix equations (A8) (SMPU without counterbalancing) and A16/A22 (SMPU with counterbalancing). When equation (A16) (or A22) yields a smaller value than equation (A8), counterbalancing will likely improve SMPU estimation precision. In some counterbalancing applications, the number of sampling strata may need to be reduced to ensure a feasible application or to ensure the minimum stratum sample size summed over all sampling strata (i.e.,
In some applications, counterbalancing will increase a stratum’s contribution to the estimator variance and adversely affect precision. This outcome was observed in about 3% of strata in our simulations. Identification of strata where counterbalancing will degrade precision can be made via use of Appendix equations (A6) and (A14) (or A20) on a stratum-by-stratum basis. When equation (A14) (or A20) yields a larger value than equation (A6), counterbalancing the stratum in question will likely increase the stratum’s contribution to the estimator variance and adversely affect estimator precision. For those sampling strata where counterbalancing will likely increase the estimator variance, counterbalancing should not be used.
When counterbalancing is used in some sampling strata, and not used in other sampling strata, the application’s sampling units will be a mixture of counterbalanced units and noncounterbalanced units. This circumstance presents no practical or theoretical problem so long as, within each sampling stratum, every sampling unit has the same likelihood of inclusion in the stratum sample.
Implementation Issues and Limitations
Prior to the use of SMPU with counterbalancing, the population data set must be reviewed for problems and, as necessary, cleaned. This process includes addressing missing values, removing duplicates, correcting data format errors, and investigating outlier observations. In our simulations, although not an absolute requirement, we made manual adjustments to strata boundaries to ensure each stratum had an even number of sampling units. This simplified the process of counterbalancing.
At present, due to the absence of software incorporating counterbalancing, application of Intrastratum Counterbalancing is a labor-intensive process. 22 Accountants and auditors who consider using SMPU with counterbalancing will need to evaluate whether the improved estimation efficiency and/or reduced sampling cost justifies the cost of implementation. However, once Intrastratum Counterbalancing is incorporated into existing audit software, the process of creating efficient strata, identifying strata where counterbalancing is warranted, selecting strata samples, and projecting results should involve minimal cost and effort.
While counterbalancing improved SMPU estimation precision in this study, and the magnitudes of improvement were noteworthy, it is important to recognize that changes in estimation precision produced by counterbalancing will likely vary in practice. SMPU estimation precision is affected by multiple factors including number of sampling strata, sample size, population size, sampling fraction, desired confidence, sampling risk, and within-strata population variation. When counterbalancing is used, additional factors affecting precision include the degree to which counterbalancing affects: (1) within-strata population variation, (2) minimum stratum sample size, (3) number of feasible sampling strata, and (4) the multiplier
Footnotes
Acknowledgment
We are grateful for the detailed and helpful comments of the anonymous reviewer.
Funding
The authors disclosed receipt of the following financial support for the research, authorship, and/or publication of this article: The authors’ time on this work was supported by the University of Texas at Arlington and New Mexico State University.
Declaration of Conflicting Interests
The authors declared the following potential conflict of interest with respect to the research, authorship, and/or publication of this article. The University of Texas at Arlington filed a patent application establishing property rights for Intrastratum Counterbalancing.