
Abstract
This paper examines whether reduced opportunities for collusion in product markets affect CEO compensation design. Using the staggered passage of leniency laws in foreign countries that exogenously strengthen anti-cartel enforcement against United States (US) firms, we find that firms significantly reduce the convexity of CEOs’ option-based pay, captured by CEO portfolio vega, following the passage of foreign leniency laws. This effect is stronger for firms operating in more concentrated industries and those with recent collusion convictions, and is weaker for firms with greater investment opportunities. Further analyses suggest that our findings are unlikely to be driven by identified alternative explanations and show that firms actively adjust CEOs’ risk-taking incentives by decreasing CEO vega from annual option grants and decreasing both the number and value of CEOs’ option grants following the passage of foreign leniency laws. Overall, our findings align with foreign leniency laws increasing firms’ downside risks, which discourages them from offering risk-taking incentives to the managers.
Introduction
A growing body of research highlights the significant impact of product market competition on executive compensation design (Bakke et al., 2022; Lie & Yang, 2023). Competitive pressures faced by firms are often linked to their strategic and widespread use of cartels, which can impose substantial costs on consumers, both in the US and globally (Bourveau et al., 2020; Dasgupta & Žaldokas, 2019; Dong et al., 2019; González et al., 2019). This has driven many countries to adopt policies aimed at destabilizing existing cartels and deterring the formation of new ones, with leniency laws being the cornerstone of anti-cartel enforcement efforts (Miller, 2009). Leniency laws offer full or partial immunity to firms that were involved in cartels but co-operated with prosecutors by providing information about the cartel (e.g., Chen & Rey, 2013; Miller, 2009). Prior research suggests that, as more countries with which US firms trade enact leniency laws, relevant authorities collaborate more effectively to prosecute cartel members, which, in turn, increases US firms’ exposure to anti-cartel enforcement and raises their expected costs of participating in cartels (Bourveau et al., 2020). In this study, we exploit the staggered passage of leniency laws in foreign countries to examine whether and how heightened anti-cartel enforcement threats affect managerial risk pay incentives, as captured by CEO portfolio vega.
While the impact of leniency laws on collusive behavior seems clear, ex ante, it is unclear how foreign leniency laws affect CEO risk pay incentives. On the one hand, identification of illegal cartels can impose significant legal costs on firms (Connor, 2020). Strengthening anti-cartel enforcement may elevate the likelihood of cartel detection and conviction, leading to potentially significant costs, including litigation fees and financial penalties. This heightened downside risk from cartel-related liability costs can diminish shareholders’ willingness to fund new projects, as they may fear that future penalties could reduce the available cash flows generated by these investments, even if the projects are unrelated to the source of the legal risk (Gormley et al., 2013; Gormley & Matsa, 2011). More generally, we argue that increases in downside risk tend to lower shareholders’ overall appetite for risk, prompting boards to reduce managerial incentives for risk-taking (e.g., Gormley et al., 2013; Hirshleifer & Suh, 1992; Smith & Watts, 1992). On the other hand, because managers have non-diversifiable financial and human capital exposures to their firms, they may face greater career concerns under heightened competition following the passage of a foreign leniency law. These concerns encompass potential financial losses, reputational damage, and diminished career prospects (Connor & Helmers, 2007; González et al., 2019), prompting managers to adopt a more risk-averse approach in their decision-making processes. Consequently, boards may opt to provide additional risk incentives to align the risk preferences between shareholders and managers (Armstrong & Vashishtha, 2012; Coles et al., 2006; Guay, 1999; Low, 2009; Smith & Stulz, 1985).
To investigate our research question, we follow Bourveau et al. (2020) and use the passage of leniency laws in foreign countries with which a US firm’s industry trades to capture the exogenous increase in anti-cartel enforcement at the industry level. Specifically, we compute the weighted average of the passage of such laws in foreign countries, where weights are determined by the proportion of a US industry’s sales imported from that particular country. 1 Varying over time and cross-sectionally by industry, this treatment measure allows us to compare the changes in manager’s pay convexity for US firms in industries that trade relatively more with the countries adopting a leniency law with those in industries that trade less with those countries, in a given year. Our use of the passage of foreign leniency laws to examine the sensitivity of CEO risk-taking incentives to anti-cartel enforcement is appealing for at least three reasons. First, the passage of foreign leniency laws is plausibly exogenous to individual US domestic firms, given that the passage of a foreign law depends almost entirely on political decisions made outside of the US (Bourveau et al., 2020). Second, leniency laws are adopted by foreign countries in different years, which alleviates concerns about potential confounding effects of US macroeconomic conditions. Third, different industries vary in their exposure to specific foreign countries, which mitigates industry-level confounding effects.
We follow prior studies on managerial compensation (e.g., Cohen et al., 2013; Core & Guay, 2002; Gormley et al., 2013; Guay, 1999; Low, 2009) to measure CEO compensation risk-taking incentives by CEO portfolio vega—the sensitivity of the CEO’s wealth to a firm’s stock return volatility. Consistent with increased downside risks reducing shareholders’ willingness in investing in risky projects, we find that CEO portfolio vega significantly declines following the passage of foreign leniency laws. Specifically, a 1% increase in firms’ exposure to the passage of foreign leniency laws is associated with a 12% decrease in CEO portfolio vega. With the mean inflation-adjusted value of vega in our sample standing at $0.063 million, this effect translates to an average decrease of $7497 in the value of the CEO equity portfolio. These results suggest that firms adjust CEO risk-taking incentives downwards in response to stronger anti-cartel enforcement. 2
In additional analyses, we explore settings in which we expect the relation between the passage of foreign leniency laws and CEO portfolio vega to vary. First, given that prior studies suggest that collusion is easier for firms in concentrated industries (Huck et al., 2004), we expect firms in concentrated industries to be more exposed to the foreign leniency laws and therefore experience a larger reduction in CEO pay convexity. Consistent with our expectation, we find that the effect of foreign leniency laws is stronger for firms in more concentrated industries. Second, because cartels are known to proliferate in particular industries (Levenstein & Suslow, 2006), we posit and find that the effect of foreign leniency laws is stronger for firms in industries that were recently detected in a cartel case. Third, prior studies suggest that firms with substantial investment opportunities have strong incentives to provide additional risk-taking incentives to CEOs (e.g., Core & Guay, 1999; Smith & Watts, 1992). We thus expect that the reduction in CEO pay convexity is weaker for firms with substantial investment opportunities. Consistent with this expectation, we find that the effect of the passage of foreign leniency laws on CEO portfolio vega is weaker for firms with higher investment opportunities.
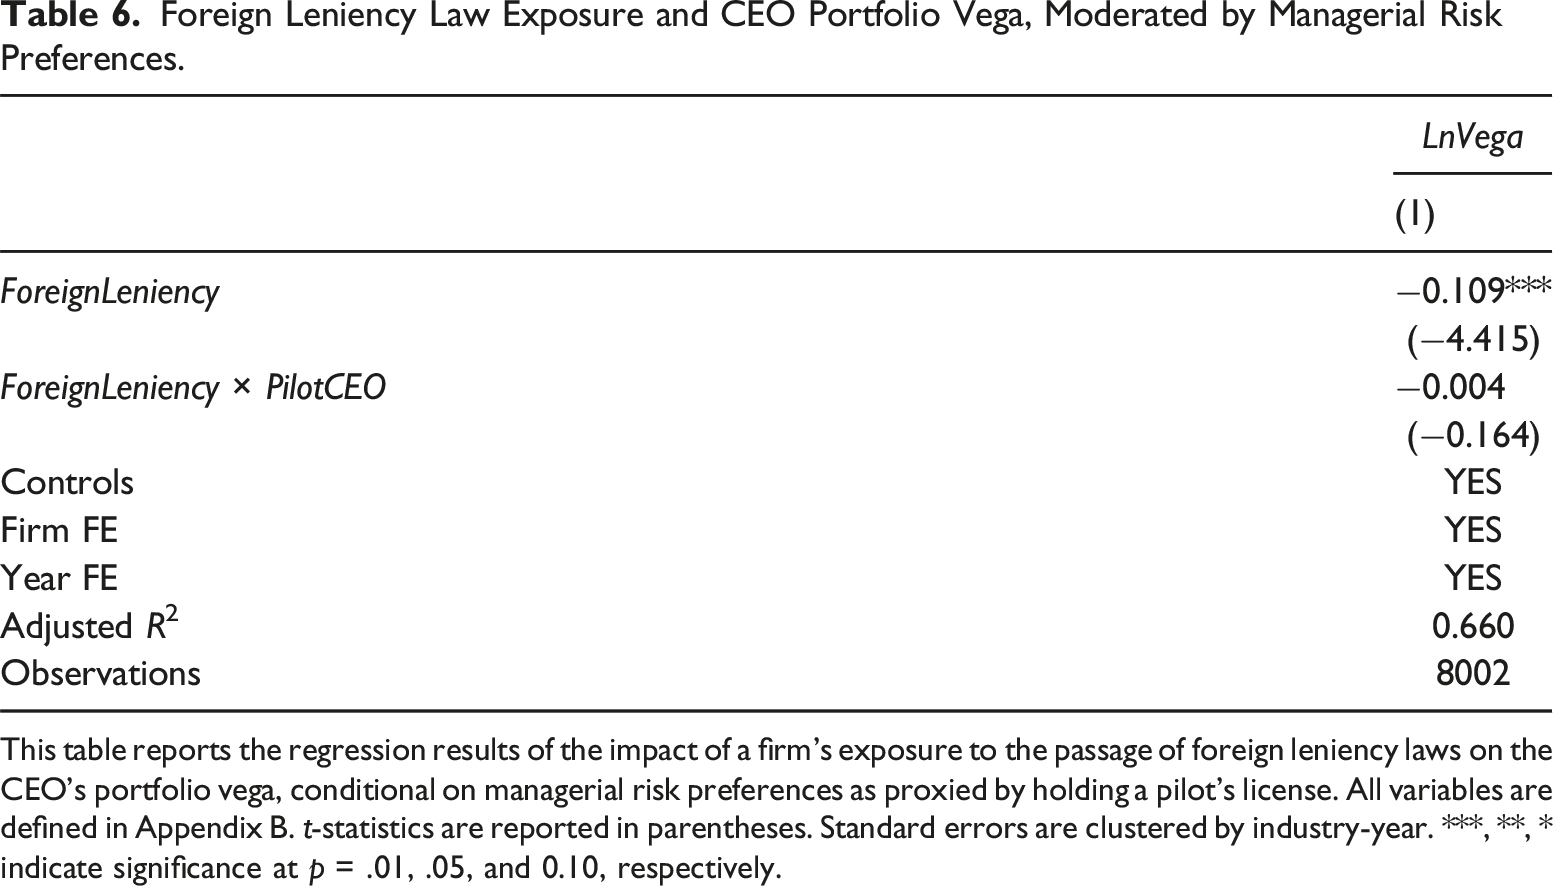
Next, we consider alternative explanations for our findings. First, we acknowledge and validate the impact of foreign anti-cartel collusion laws on competition. We find that foreign leniency laws are associated with an increase in import penetration, advertising and R&D expenditures and a decline in profit margin. These results align with the proposition that foreign leniency laws lead to stronger product market competition. Next, prior studies suggest that competition in product markets may affect executive pay (Bakke et al., 2022; Lie & Yang, 2023). It is therefore possible that our observed impact of foreign leniency laws on vega is mainly driven by heightened competition rather than downside risk associated with future cartel-related liabilities. While cartels primarily involve strategies adopted by firms, which may stem from either high or low competition in the industry, 3 we address this concern empirically by showing that our results are robust to controlling for various competition measures in our regression analysis. Third, to address the concern that the effect of foreign leniency laws on managerial risk preference might be driving the observed relationship between foreign leniency laws and vega, we conduct tests based on managers’ risk aversion. We posit that, if this explanation is correct, we should observe a stronger decrease in vega for less risk averse managers. However, we do not find evidence to support this proposition.
We test the assumed mechanism through which boards adjust CEO risk-taking incentives in response to stronger anti-cartel enforcement, and find a significantly negative relation between the passage of foreign leniency laws and the subsequent options granted to CEOs. This supports our premise that boards actively adjust CEOs’ equity incentives to optimal levels by reducing the use of stock options as incentive pay in response to the increases in downside risk. A credible concern is that our results may be driven by changes in CEOs’ option exercise behaviors rather than the boards’ actions. To address this concern, we examine whether the decreases in vega are driven by new option grants or option exercises. We find no evidence that foreign leniency laws significantly impact option exercises by the CEO, but the vega from newly granted options significantly decreases following the passage of foreign leniency laws, further supporting our argument that boards actively adjust CEOs’ equity incentives. Further, we find a reduction in firms’ stock price volatility following the passage of foreign leniency laws, consistent with the underlying assumption that the passage of foreign leniency laws reduces shareholders’ risk appetites.
We subject our findings to a battery of robustness checks. First, to alleviate the concern that measurement errors in our proxy of our treatment variable (i.e., anti-cartel enforcement) could bias our estimation, we use alternative definitions of the treatment variable and find that our main results hold when we: (1) use export data in calculating the treatment variable; (2) use a binary treatment variable, based on the year in which the firm’s most important country in terms of its industry’s import volume adopted a foreign leniency law, to implement a more standard difference-in-differences design; (3) focus on the countries that are known to have a judicial system that is relatively more efficient; (4) allow for the anticipation of leniency laws by European Union (EU) member countries when the EU passed a supranational leniency law in 2002; and (5) include or exclude influential countries (China or Japan) in calculating the treatment variable. Second, we employ a matched sample design to strengthen identification. Third, we further use the binary treatment variable in multi-period dynamic and falsification analyses. We find that the decrease in CEO portfolio vega occurs immediately after the treatment year for each industry, but not before. This suggests that there is no pre-existing trend of CEO portfolio vega for the treated firms. Our falsification analyses show that the decreases in CEO portfolio vega are unlikely to be driven by chance or a general trend. Fourth, we address the concern that the decreases in CEO portfolio vega could be driven by anticipated option expensing following the passage of Sarbanes-Oxley Act (SOX) in 2002 (Cohen et al., 2013) or the changes in accounting rules imposed by Accounting Standards Codification (ASC) 718 (previously, Statement of Financial Accounting Standards (SFAS) 123R) in 2005 that reduced the attractiveness of option-based compensation (Hayes et al., 2012). Our results hold when we exclude observations after 2002 or after 2005.
We contribute to the literature in several ways. First, we contribute to the growing literature on the link between managerial misbehavior and CEO equity incentives. Prior studies suggest that managerial misbehaviors, such as insider trading and accounting restatements, attract shareholder protests and scrutiny and can affect incentive compensation awarded to CEOs (e.g., Cheng & Farber, 2008; Denis & Xu, 2013; González et al., 2019). However, unlike managerial malfeasance by which managers profit at the expense of shareholders, cartel-related misbehaviors (e.g., price-fixing or bid-rigging) may provide significant economic benefits to shareholders (Connor & Lande, 2008). 4 Consequently, boards may face little shareholder pressure to act against participation in cartels (González et al., 2019). Focusing on the passage of foreign leniency laws allows us to examine how strengthened enforcement against cartel activity, which is a type of corporate misconduct that is generally to the economic benefit of the shareholders, influences managerial equity incentives.
Second, our study contributes to the executive compensation literature by providing evidence that boards evaluate a firm’s exposure to anti-cartel enforcement when determining CEO risk-taking incentives. Prior studies link the design of managerial risk-taking incentives in compensation contracts to firm-specific factors, including firm size and growth opportunities (Guay, 1999; Smith & Watts, 1992), risk tolerance in policy choices (Coles et al., 2006), and workers’ exposure to a carcinogen (Gormley et al., 2013), the regulatory events such as changes in the accounting treatment of stock-based compensation (Hayes et al., 2012), the enactment of the SOX (Cohen et al., 2013), the removal of short-selling constraints associated with Regulation SHO Pilot Program (Reg SHO) (De Angelis et al., 2017), and the introduction of credit default swap trading (Chen et al., 2019). Our research complements these prior studies by showing that opportunities for collusion in product markets can also affect risk-taking incentives in the design of executive compensation.
Third, our study investigates previously unexamined consequences of the exogenous strengthening of anti-cartel enforcement arising from the passage of foreign leniency laws. Prior studies suggest that firms respond to the passage of foreign leniency laws by engaging in more merger activity (Dong et al., 2019), relying more on new equity for capital than debt financing (Dasgupta & Žaldokas, 2019) and modifying financial disclosures (Bourveau et al., 2020). Our study extends this line of research by examining the impact of the passage of foreign leniency laws on the structure of the risk-taking incentives in CEO compensation. Our results suggest that foreign leniency laws increase firms’ downside risks, which discourages firms from providing risk-taking equity incentives to the managers.
Finally, our paper is related to the literature examining the effect of competition on executive pay. While prior studies like Lie and Yang (2023) investigate how product market competition affects the stock price sensitivity of managers’ wealth (as measured by delta), which is expected to motivate managers to increase firm value, there has been less exploration of how competition influences managerial risk-taking incentives (as measured by vega) (e.g., Armstrong & Vashishtha, 2012; Coles et al., 2006; Guay, 1999; Low, 2009; Smith & Stulz, 1985). One notable exception is Bakke et al. (2022), which uses increased import penetration as a proxy for competition and find that heightened competition is associated with lower CEO vega. While import penetration reflects competition pressures faced by firms, we show that increasing prospective anti-cartel enforcement exerts a unique and economically significant influence on vega, incremental to other dimensions of competition. In addition, the passage of foreign leniency laws allows us to exploit plausibly exogenous increases in competition on executive pay, as the passage of these laws is determined by political decisions made outside the US, mitigating endogeneity concerns that are strongly associated with domestic firm actions and import penetration. Moreover, our theoretical framework, grounded on the implications of increased downside risk and shareholder risk preferences, offers a new perspective on how competition influences managerial incentives, diverging from previous studies’ focus on managerial risk aversion (e.g., Bakke et al., 2022).
The remainder of the paper is structured as follows. The next section reviews the related literature and develops the hypothesis. We then describe the sample and the research design, followed by descriptive statistics and the results of tests of hypothesis. We then report the results of the cross-sectional tests, followed by the results of the additional tests, before concluding the paper.
Related Literature and Hypotheses
Background on Leniency Laws
Striving to protect consumers’ welfare and fight cartels more effectively in the US and worldwide, leniency laws have been gradually introduced over the past decades. These laws provide full or partial amnesty for conspirators who supply information that proves helpful to the antitrust authorities. This amnesty can extend to a firm’s directors, managers, and other employees. The first US leniency program was introduced in 1978 by the Department of Justice. However, the DOJ leniency program was seen as largely ineffective until it was revised in 1993 to provide automatic amnesty for fully cooperative applicants (Ghosal & Sokol, 2014). 5 Antitrust authorities in other countries noted the success of the DOJ’s revised leniency program in obtaining evidence to successfully prosecute cartel members, destabilizing existing cartels and deterring cartel formation (Miller, 2009). Leniency laws were then gradually adopted as part of anti-cartel enforcement reform across developed and developing economies (Hammond, 2005); the timing of the passages of foreign leniency laws is tabulated in Appendix A.
By granting full or partial amnesty to cartel participants who cooperate with authorities in investigating and prosecuting other cartel participants, leniency laws are expected to increase the costs of engaging in collusive activities and the benefits of breaking up cartels. Prior studies suggest that leniency laws effectively weaken existing collusive arrangements and discourage new ones (Chen & Rey, 2013). Using a difference-in-differences design, Dong et al. (2019) document that the global wave of leniency laws led to higher cartel conviction rates and lower gross margins of affected firms, implying that leniency laws significantly increase the costs of collusion. Dasgupta and Žaldokas (2019) observe that firms shift toward greater reliance on equity issuances over debt following the passage of a leniency law. Focusing on US firms, Bourveau et al. (2020) note that affected firms provide more detailed information about their customers, contracts, and products in financial disclosures after the implementation of leniency laws in foreign jurisdictions.
CEO Equity Incentives
Prior studies suggest that firms structure CEO compensation as a convex function of firm performance to incentivize CEOs to make optimal risk-taking decisions (e.g., Coles et al., 2006; Guay, 1999; Knopf et al., 2002). Specifically, Guay (1999) finds that a firm’s stock-return volatility is positively associated with the convexity in the relation between CEO wealth and stock price, suggesting that convex incentive schemes influence CEOs’ investing and financing decisions. Knopf et al. (2002) find that firms tend to hedge less when the sensitivity of the manager’s option portfolio to stock return volatility increases. Similarly, Coles et al. (2006) find that higher CEO pay convexity is followed by more investment in research and development (R&D), less investment in property, plant, and equipment (PPE), and higher leverage.
Recent research on CEO equity incentives highlights that firms promptly adjust managerial risk-incentive compensation in response to changes in their operating environments. For example, Gormley et al. (2013) show that firms adjust the CEO risk incentive pay downwards following an unanticipated increase in business risks. Balsam et al. (2018) show that firms tend to reduce risk-taking incentives in executive compensation when debt covenant violations strengthen creditor influence, while Chen et al. (2019) find that risk-taking incentives in managerial compensation increase when firms are referenced by credit default swaps trading that reduces creditor monitoring. De Angelis et al. (2017) find that firms significantly increase the convexity of CEO compensation payoffs after the removal of short-sale constraints during Reg SHO, and Cohen et al. (2013) find that firms adjust incentive compensation awarded to their CEOs after SOX regulated firms’ governance structures and increased litigation risks. More related to our context, Bakke et al. (2022) find that heightened competition caused by foreign competitor entry into the US market is associated with a decline in vega. Different from Bakke et al. (2022), we examine how foreign leniency laws, which are expected to increase the cost of collusion for US firms, relate to managerial risk incentives. This represents a distinct and previously unexplored dimension of competition effects on executive compensation.
The Link Between Anti-cartel Enforcement and CEO Equity Incentives
Ex ante, it is not obvious how foreign leniency laws affect CEO equity incentives. On the one hand, the passage of foreign leniency laws raises the costs of collusion, thereby reducing the attractiveness of risky projects for firms (Cohen et al., 2013; Gormley et al., 2013; Gormley & Matsa, 2011). In response, boards may adjust CEO incentive pay downwards to deter investments in projects that carry a higher likelihood of illegal cartel activity. On the other hand, these laws also increase potential personal costs for CEOs, which may make them more cautious about pursuing risky investments due to career concerns (Connor & Helmers, 2007; González et al., 2019). Consequently, boards might choose to increase risk incentives to better align managers’ risk preferences with those of shareholders.
CEO pay convexity is not associated with the passage of foreign leniency laws.
Research Design
Sample
Sample Selection, Descriptive Statistics, and Correlation Matrix.
Panel A reports descriptive statistics of the key variables. Panel B reports the correlation among variables used for the main regression. Correlations with absolute values >0.02 are significant at p < .01. The sample size for both panels is 8002. All variables are defined in Appendix B.
Measuring Anti-Cartel Enforcement
Following Bourveau et al. (2020), we create the variable ForeignLeniency to capture increases in anti-cartel enforcement at the industry level. This is based on a US firm’s exposure to the passage of leniency laws in countries from which the US firm’s industry obtains a significant fraction of its imports. Specifically, ForeignLeniency is defined as the weighted average of the passage of laws in all other countries, excluding the US, thus: ForeignLeniency
jt
= Trends in Foreign Leniency Exposure for Top 10 and Bottom 10 Industries.
Measuring CEO Pay Convexity
Consistent with prior research (e.g., Cohen et al., 2013; Core & Guay, 2002; Gormley et al., 2013; Guay, 1999; Low, 2009), we proxy for CEO pay convexity using vega, which is the change in the dollar value of the CEO’s wealth for a 0.01 change in the annualized standard deviation of a firm’s stock return. We calculate vega based on the Black–Scholes (1973) option valuation model, as modified by Merton (1973) to account for dividend payouts. Consistent with Guay (1999) and Coles et al. (2013), we use the vega of the CEO’s options portfolio to measure the total vega of the equity portfolio (Vega). Consistent with prior studies (e.g., Gormley et al., 2013), we adjust the dollar value of vega by inflation using the annual average CPI-U.
Model
To test our hypothesis, we use ForeignLeniency to identify the impact of the passage of foreign leniency laws on CEO pay convexity, and estimate the following model:
We include firm-level control variables known to affect CEO portfolio vega. Unless stated otherwise, variables are for year t. Size is the natural logarithm of a firm’s total assets. MB is a firm’s market value of equity divided by its book value of equity, and proxies for growth opportunities (Smith & Watts, 1992). Leverage is total debt divided by total assets, which has been found to affect managerial risk-taking incentives (e.g., Coles et al., 2006). R&D is research and development expenditure divided by total assets. CAPEX is net capital expenditure divided by total assets. R&D and CAPEX control for variations in investment opportunities. Following Gormley et al. (2013), CashFlow is operating income adjusted for depreciation and accruals, divided by total assets, and controls for firms’ cash constraints because firms prefer equity-based pay to cash compensation if they face cash constraints (Core & Guay, 1999; Dechow et al., 1996). StockReturn is a firm’s stock return for the last 12-month fiscal period. ROA is income before extraordinary items scaled by lagged total assets. StockReturn and ROA are used to control for the effect of firm performance on CEO compensation and wealth (Core & Guay, 1999). LnCashCompensation is the natural logarithm of cash compensation for year t-1, where cash compensation is the sum of salary and bonus, adjusted for inflation using the annual average CPI-U, consistent with Gormley et al. (2013). Chg_CashCompensation is the changes in cash compensation adjusted for inflation using the annual average CPI-U from year t-1 to year t. CEOs with high cash compensation tend to be wealthier and better diversified, making them less risk-averse (Berger et al., 1997; Guay, 1999). We include three industry level controls for the potential effect of trade policy changes. HHI is industry concentration, as proxied by the Herfindahl–Hirschman Index at the three-digit SIC industry. ImportPenetration is the value of imports scaled by the sum of imports and the shipment value minus the value of exports. ForeignSale is foreign sales divided by total sales at the three-digit SIC industry-level. Firm and year fixed effects are included to control for time-invariant firm characteristics and economy-wide shocks that vary over time. The definitions and data sources for all variables are summarized in Appendix B.
Main Tests
Descriptive Statistics
Summary statistics of the variables used in our main regression analysis are reported in Table 1 Panel B. To control for outliers, continuous variables are winsorized at the bottom and top 1%. The mean value of Vega is $63,237, which indicates an average increase of $63,237 in the dollar value of CEO wealth for a 0.01 increase in the annualized standard deviation of a firm’s stock price. The mean value of ForeignLeniency is 0.085, similar to the mean of 0.070 reported in Bourveau et al. (2020). Overall, the descriptive statistics of the variables are consistent with those reported in previous studies (e.g., Bettis et al., 2018; Bourveau et al., 2020; Coles et al., 2006; Gormley et al., 2013). The correlations among the variables are reported in Table 1 Panel C. ForeignLeniency has a mildly negative relation to CEO portfolio vega.
Test of Hypothesis
Foreign Leniency Law Exposure and CEO Portfolio Vega.
This table reports the regression results of the impact of a firm’s exposure to the passage of foreign leniency on the CEO’s portfolio vega. t-statistics, reported in parentheses, are based on standard errors clustered by industry-year. ***, **, * indicate significance at p = .01, .05, and 0.10, respectively. All variables are defined in Appendix B.
Because the dependent variable is log-transformed, the coefficient for ForeignLeniency of 0.112 in column 2 implies that a 1% increase in ForeignLeniency is followed by a 12% decrease in CEOs’ portfolio vega, when holding other factors constant. With the mean inflation-adjusted value of vega in our sample standing at $63,237, the effect of ForeignLeniency translates to an average decrease of $7525 (0.119 × $63,237) in the value of the CEO equity portfolio. The coefficients for the control variables are generally consistent with those of prior studies (e.g., Coles et al., 2006; Croci & Petmezas, 2015; Guay, 1999). LnVega is positively related to firm size, market-to-book ratio, R&D, ROA, and cash compensation; and negatively related to leverage, cash flow, and stock return.
These results suggest that stronger anti-cartel enforcement associated with the passage of foreign leniency laws increase firms’ downside risks, which discourages them from offering risk-taking equity incentives to the managers, resulting in decreases CEOs’ portfolio vega.
Cross-Sectional Tests
This section explores whether and how the effect for ForeignLeniency differs systematically across firms, in circumstances where firms may differ in their exposure to foreign leniency laws or their impact on the firms’ opportunities.
High versus Low Market Concentration
Foreign Leniency Law Exposure and CEO Portfolio Vega: Cross-Sectional Tests.
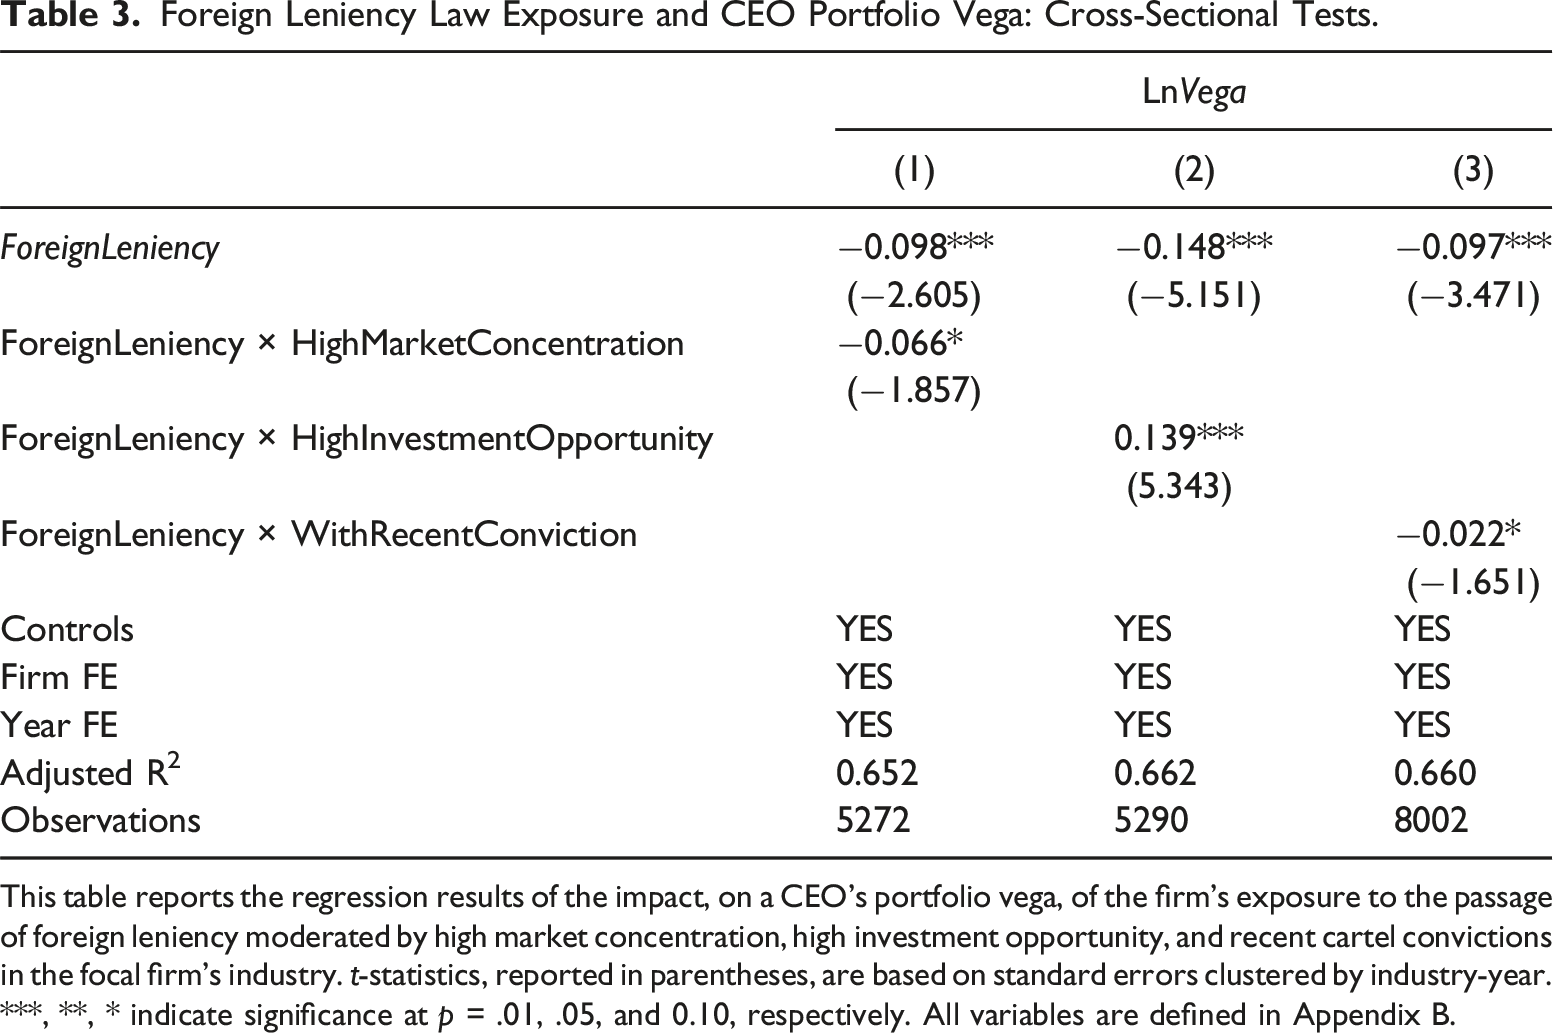
This table reports the regression results of the impact, on a CEO’s portfolio vega, of the firm’s exposure to the passage of foreign leniency moderated by high market concentration, high investment opportunity, and recent cartel convictions in the focal firm’s industry. t-statistics, reported in parentheses, are based on standard errors clustered by industry-year. ***, **, * indicate significance at p = .01, .05, and 0.10, respectively. All variables are defined in Appendix B.
High versus Low Investment Opportunities
We next test whether firms’ investment opportunities moderate the effect of foreign leniency laws on CEO pay convexity. Prior studies suggest that firms with more substantial investment opportunities are more likely to structure CEO compensation to incentivize managerial risk-taking (e.g., Core & Guay, 1999; Smith & Watts, 1992). Therefore, we expect that the reduction in CEO pay convexity is weaker for firms with high investment opportunities. To test this prediction, we measure a firm’s investment opportunity as the market-to-book ratio for equity, averaged over the two-year window. We then exclude firm-year observations in the middle tercile of market-to-book ratio for equity, and set HighInvestmentOpportunity equal to 1 (0) if it is in the upper (lower) tercile of the sample. We re-estimate the main model and interact HighInvestmentOpportunity with ForeignLeniency, as reported in column 2 of Table 3. The coefficient for ForeignLeniency is significantly negative and the coefficient on the interaction is significantly positive. These results are consistent with our prediction that the effect of the foreign leniency laws on CEOs’ portfolio vega is lower for firms with more investment opportunities, for which incentivizing risk-taking is more likely to continue to be a preferred strategy.
Recent Cartel Conviction
We posit that foreign leniency laws are more salient to firms operating in markets that are more likely to be targeted for anti-cartel enforcement, and so we predict that firms operating in industries with recent convictions in cartel cases will experience greater decreases in vega. To test this prediction, we follow Bourveau et al. (2020) and use the cartel detections reported in Connor (2014) to construct the variable WithRecentConviction, which equals 1 (0) if a firm is (not) in an industry that had a cartel case in the last three years. We re-estimate the main model and interact WithRecentConviction with ForeignLeniency, as reported in column 3 of Table 3. The coefficients for ForeignLeniency and the interaction are both significantly negative, consistent with our prediction that the effect of foreign leniency laws is stronger for firms in industries with a recently detected in a cartel case.
Additional Tests
Alternative Explanations
Competition
Foreign Leniency Exposure and Competition.
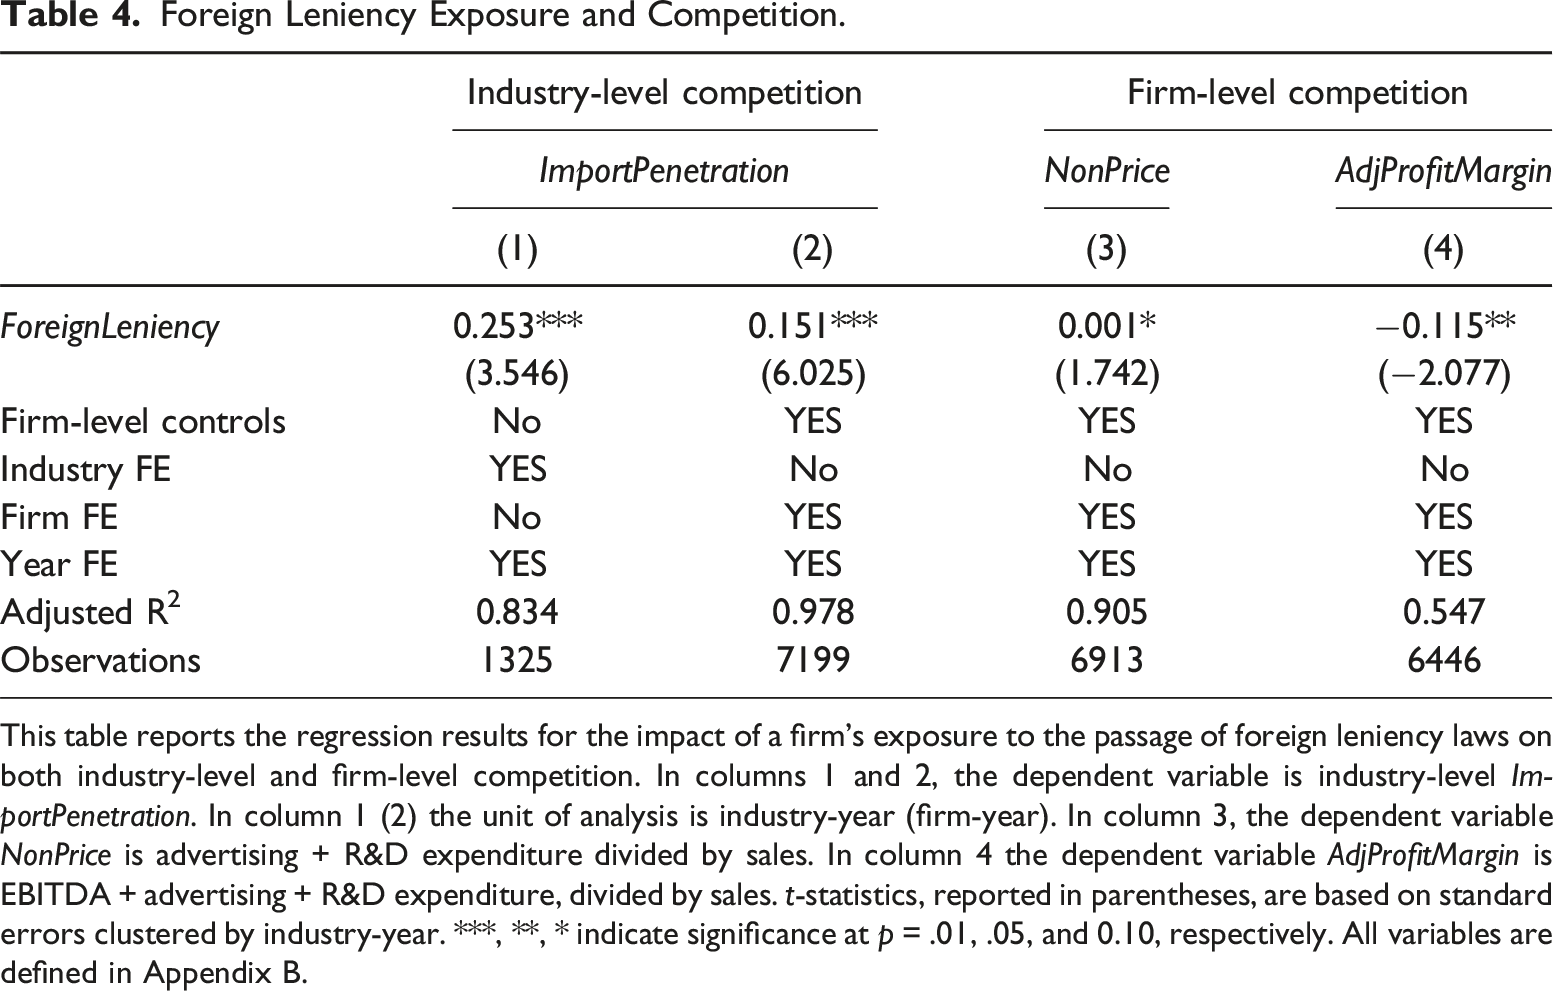
This table reports the regression results for the impact of a firm’s exposure to the passage of foreign leniency laws on both industry-level and firm-level competition. In columns 1 and 2, the dependent variable is industry-level ImportPenetration. In column 1 (2) the unit of analysis is industry-year (firm-year). In column 3, the dependent variable NonPrice is advertising + R&D expenditure divided by sales. In column 4 the dependent variable AdjProfitMargin is EBITDA + advertising + R&D expenditure, divided by sales. t-statistics, reported in parentheses, are based on standard errors clustered by industry-year. ***, **, * indicate significance at p = .01, .05, and 0.10, respectively. All variables are defined in Appendix B.
Foreign Leniency Exposure and CEOs’ Portfolio Vega: Chinese Import Penetration and Tariff Cuts.
This table reports the regression results of the impact of a firm’s exposure to the passage of foreign leniency laws on the CEO’s portfolio vega, controlling for import penetration from China and US tariff cuts. t-statistics, reported in parentheses, are based on standard errors clustered by industry-year. ***, **, * indicate significance at p = .01, .05, and 0.10, respectively. All variables are defined in Appendix B.
Managerial Risk Preference
Foreign Leniency Law Exposure and CEO Portfolio Vega, Moderated by Managerial Risk Preferences.
This table reports the regression results of the impact of a firm’s exposure to the passage of foreign leniency laws on the CEO’s portfolio vega, conditional on managerial risk preferences as proxied by holding a pilot’s license. All variables are defined in Appendix B. t-statistics are reported in parentheses. Standard errors are clustered by industry-year. ***, **, * indicate significance at p = .01, .05, and 0.10, respectively.
Mechanism
Adjustment of CEO Compensation
Foreign Leniency Exposure and CEO Compensation.
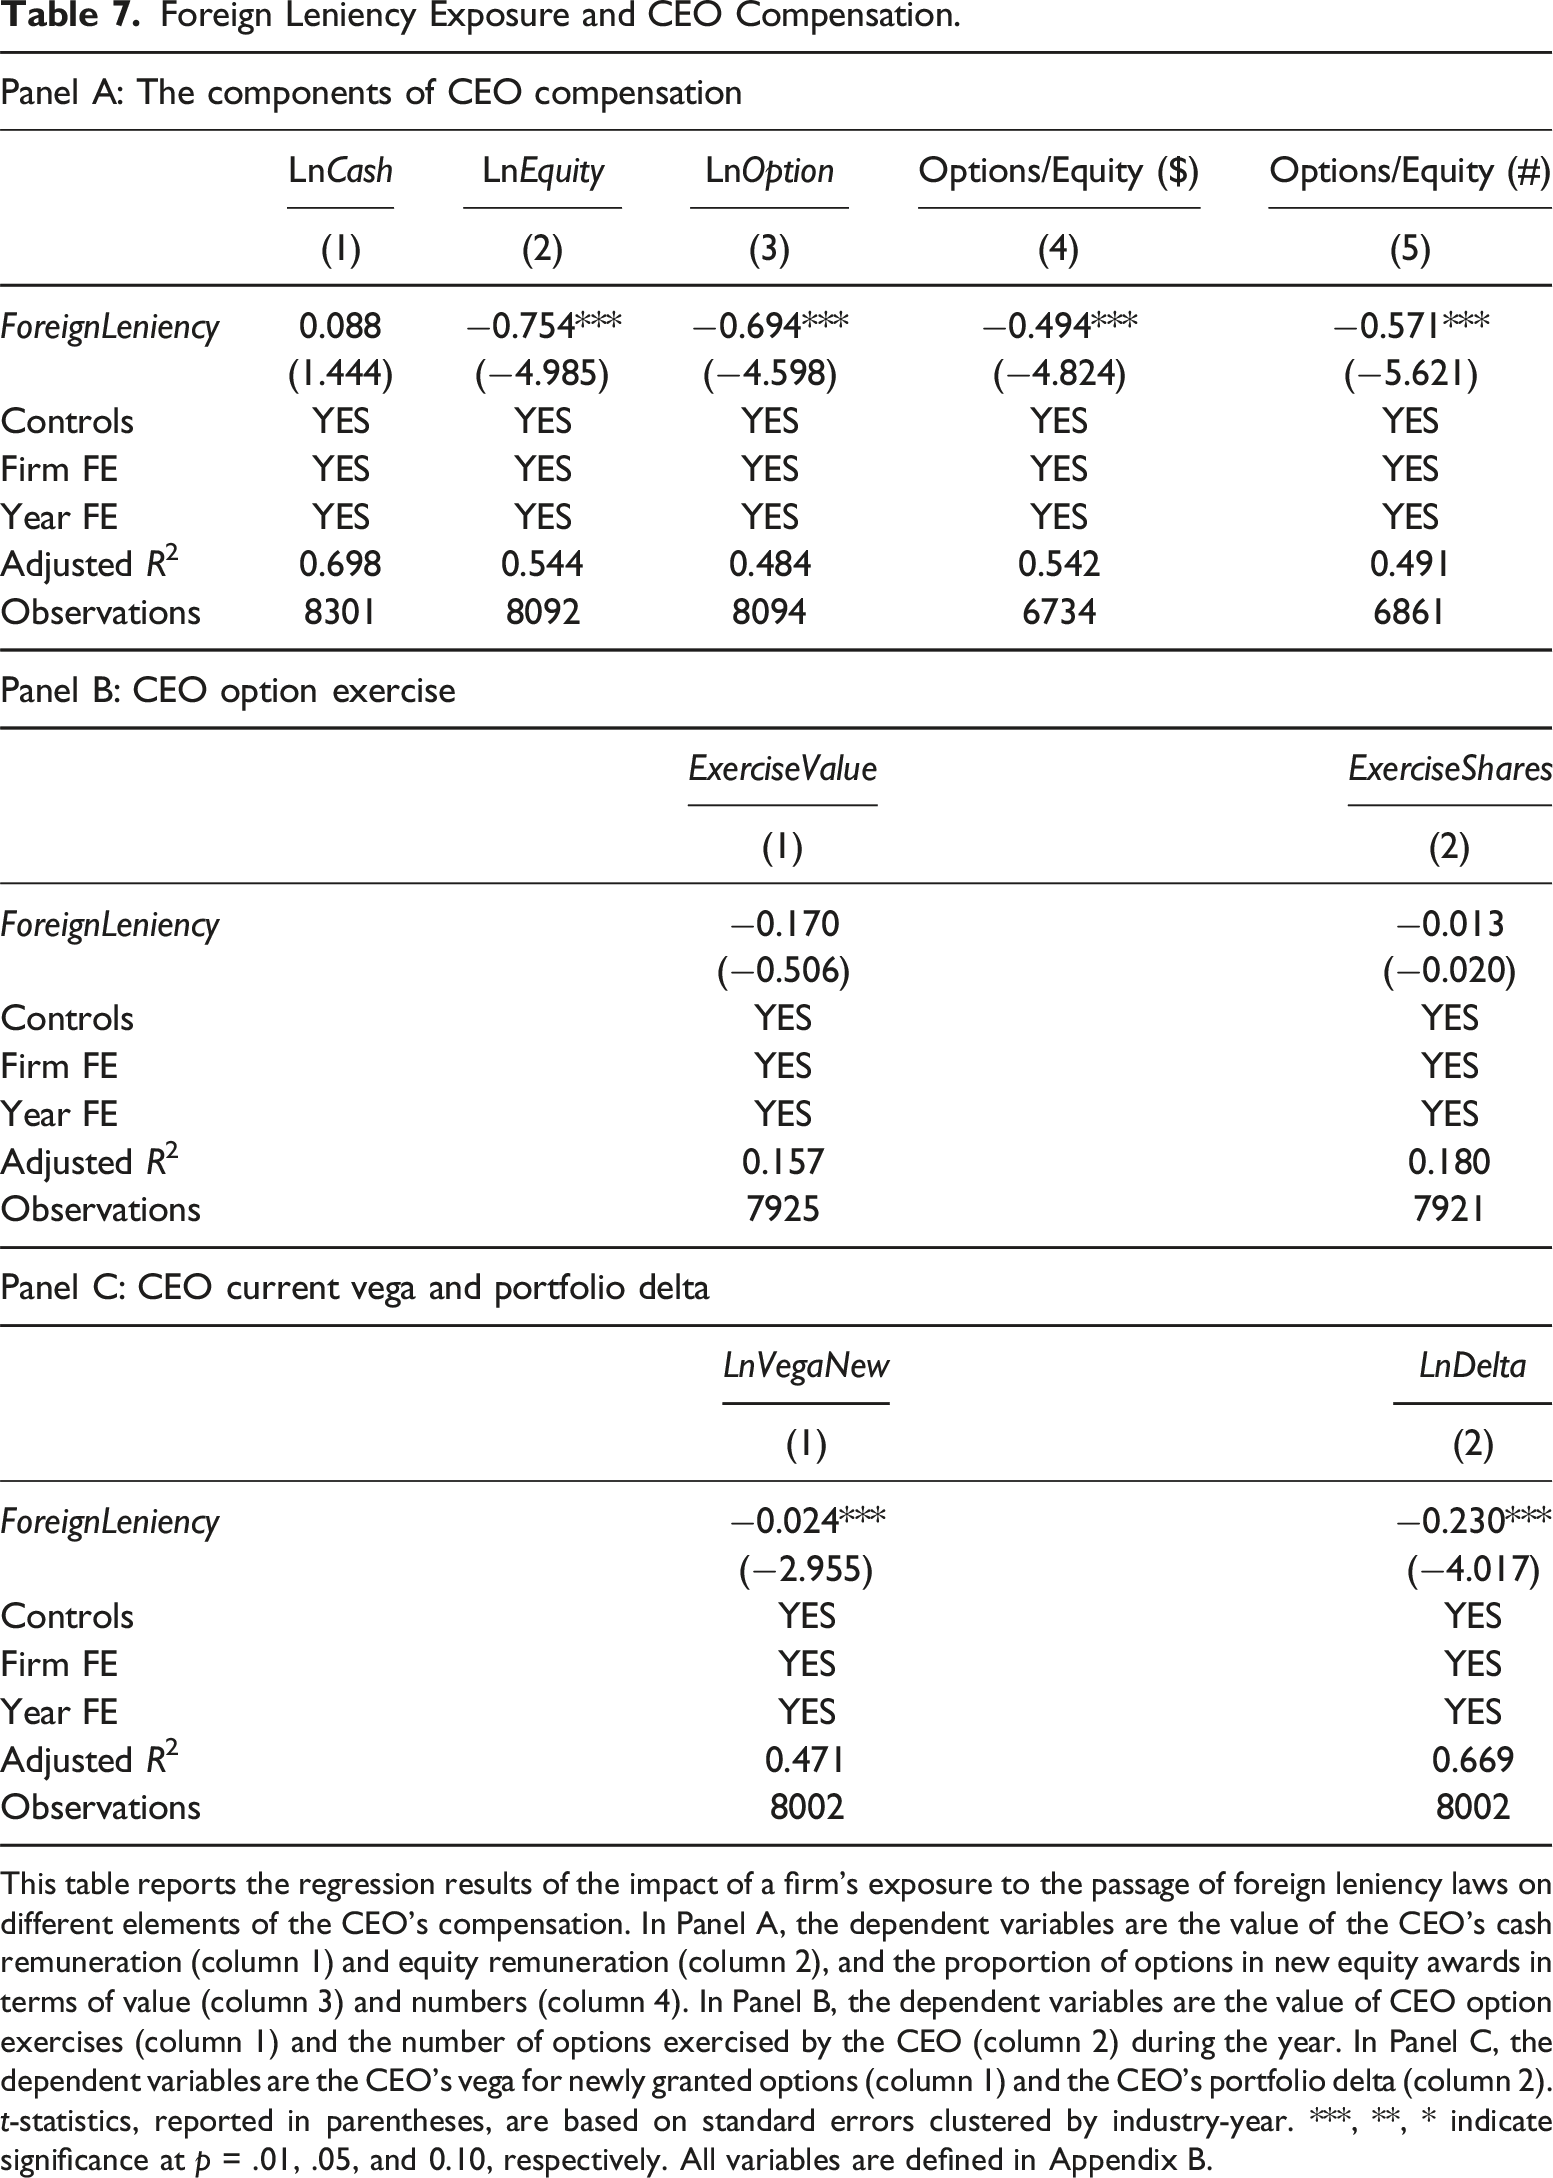
This table reports the regression results of the impact of a firm’s exposure to the passage of foreign leniency laws on different elements of the CEO’s compensation. In Panel A, the dependent variables are the value of the CEO’s cash remuneration (column 1) and equity remuneration (column 2), and the proportion of options in new equity awards in terms of value (column 3) and numbers (column 4). In Panel B, the dependent variables are the value of CEO option exercises (column 1) and the number of options exercised by the CEO (column 2) during the year. In Panel C, the dependent variables are the CEO’s vega for newly granted options (column 1) and the CEO’s portfolio delta (column 2). t-statistics, reported in parentheses, are based on standard errors clustered by industry-year. ***, **, * indicate significance at p = .01, .05, and 0.10, respectively. All variables are defined in Appendix B.
In the main analyses, we interpret the observed decreases in CEO portfolio vega as a result of the board actively managing CEOs’ risk-taking incentives in response to the passage of foreign leniency laws. However, vega can also change for reasons that are not under the control of the board. For example, changes in CEOs’ option exercise behavior can also result in changes in vega. To test this behavior, we replace the dependent variable in equation (1) with (1) the value of options exercised divided by the CEO’s total compensation (ExerciseValue) and (2) the number of options exercised deflated by the number of outstanding shares held by the CEO (ExerciseShares). A positive effect in relation to the value or the number of options exercised would be consistent with CEOs modifying their option exercise behavior following the passage of foreign leniency laws. The results reported in Table 7 Panel B do not provide any evidence that foreign leniency laws impact option exercises by the CEO, from which we conclude that they are unlikely to be driving our main results.
To better understand how foreign leniency laws change CEO compensation vega, we investigate whether the decrease in vega is driven by new option grants during the year. While portfolio vega is a comprehensive and precise measure of managers’ risk-taking incentives and captures the overall effect of aggregate holdings following a government spending shock, examining the vega of annual option grants provides more insight into whether changes in CEO portfolio vega are attributable to changes in the vega of new options granted to CEOs during the current year and whether the passage of foreign leniency laws have an immediate impact on CEOs’ pay convexity. We use LnVegaNew to measure vega estimated for newly granted options. To have a more comprehensive understanding of how anti-cartel leniency laws affect managerial compensation, we also examine changes in delta in our context of cartels. Following Coles et al. (2013), we measure LnDelta as the natural logarithm of 1 plus portfolio delta, where delta is the change in the dollar value of the CEO’s wealth for a 1% change in a firm’s stock price. The results are reported in Table 7 Panel C. Column 1 shows a decrease in vega of new option grants following the passage of foreign leniency laws, suggesting boards actively adjust CEOs’ risk-taking incentives by decreasing CEO vega from annual option grants in response to the passage of foreign leniency laws. As shown in column 2, we find delta also decreases following the passage of foreign leniency laws, which is consistent with the suggestion in Gormley et al. (2013) that decreases in desired investments also reduce the need for delta.
Firm Performance Volatility
Foreign Leniency Exposure and Firm Performance Volatility.
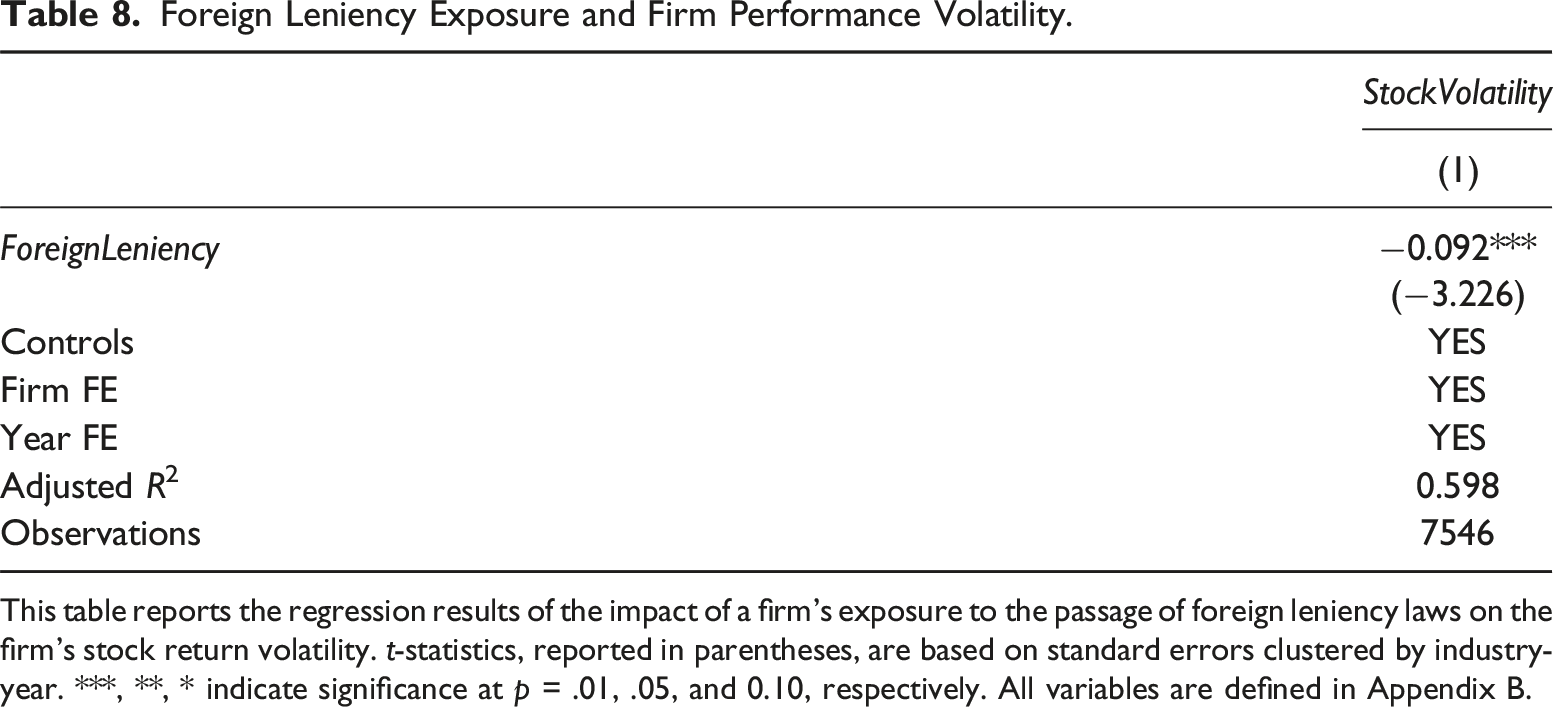
This table reports the regression results of the impact of a firm’s exposure to the passage of foreign leniency laws on the firm’s stock return volatility. t-statistics, reported in parentheses, are based on standard errors clustered by industry-year. ***, **, * indicate significance at p = .01, .05, and 0.10, respectively. All variables are defined in Appendix B.
Robustness Tests
Alternative Measures
As robustness checks, we re-estimate our model using four different specifications of the treatment variable based on foreign leniency laws.
First, to alleviate the concern that a firm’s industry exports are more exposed than imports to the passage of leniency laws in foreign countries, we construct the treatment variable ForeignLeniency_Export by replacing the weight in ForeignLeniency (the country share of imports in an industry) with the share of exports of each three-digit SIC industry from the US to the relevant countries.
Second, we use a binary treatment in place of the continuous measure of ForeignLeniency, which allows us to implement a more standard difference-in-differences estimation of the staggered assignment of the treatment, following Bourveau et al. (2020). For each three-digit SIC industry, we identify the treatment year as the year in which the most important country in terms of import volume adopted the foreign leniency law. ForeignLeniency_Dummy equals 1 for the industry following the treatment year and 0 otherwise.
Third, given that the enforcement of leniency laws may not be effective in some countries, we reconstruct our treatment variable to focus on the countries with more efficient judicial systems based on World Bank Worldwide Governance Indicators (WGI). The WGI reports time-varying national governance index for 212 countries annually over the period 1996–2021. 7 It reflects both the quality of policy formulation and implementation and the credibility of the government’s commitment to such policies. We follow Dasgupta and Žaldokas (2019) to use this country-level governance index to proxy for a country’s judicial system effectiveness. We construct ForeignLeniency_Enforcement by including only leniency laws that were passed in countries whose governance index is larger than the sample median around the world at the time of the relevant leniency law’s implementation.
Fourth, in 2002 the EU resolved that all member countries should introduce leniency laws but the passage of leniency laws in member countries was staggered over several years. In our main analysis, we use the year in which the individual country passed the law. Here, we address a possible concern about anticipation of the leniency law for EU members in 2002. We construct ForeignLeniency_EU by setting the effective year for the leniency law of an EU member country to be the later of 2002 or the year when the country joined the EU.
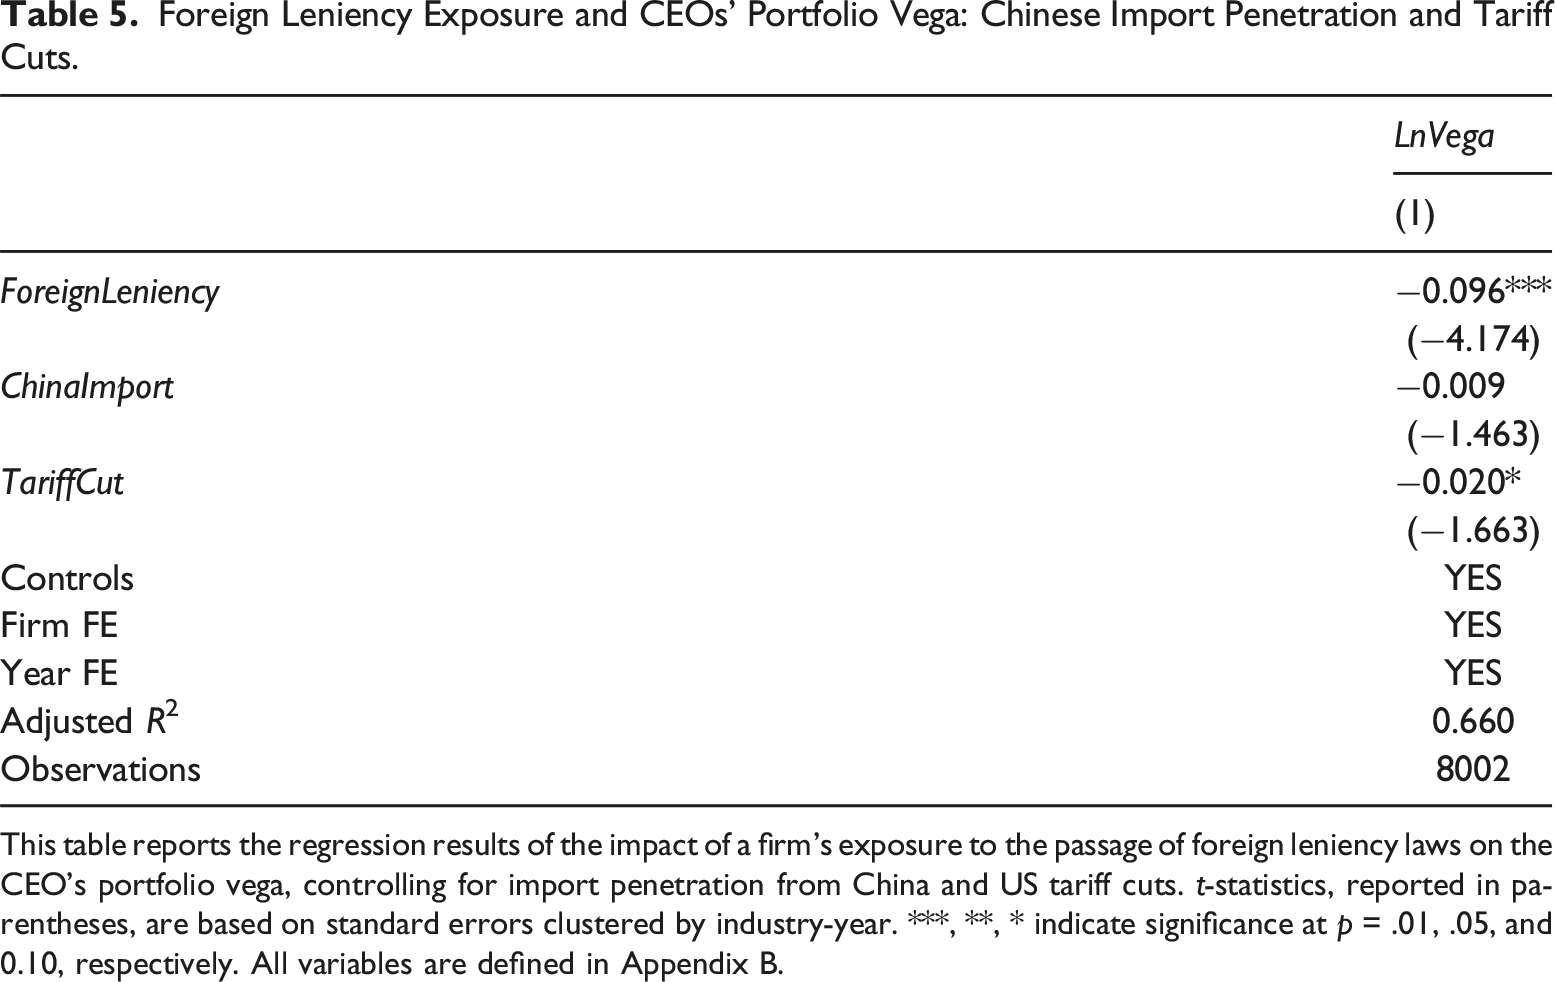
Fifth, we explore which country creates the biggest changes in foreign leniency in our sample. Our variable of interest is constructed based on the import volume from foreign countries in 1990, with Japan emerging as the most influential country for US industries in terms of imports. Acknowledging the substantial role of Chinese imports in influencing competition levels for US firms as highlighted in numerous existing studies (Lie & Yang, 2023), we incorporate the effects of both Japan and China in our additional analysis. Specifically, we re-construct our treatment variable by: (1) including only the anti-cartel collusion law passed in China (ForeignLeniency_China); (2) including only the anti-cartel collusion law passed in Japan (ForeignLeniency_Japan); (3) excluding the anti-cartel collusion law passed in China (ForeignLeniency_Excl_China); and (4) excluding the anti-cartel collusion law passed in Japan (ForeignLeniency_Excl_Japan).
Foreign Leniency Exposure and CEOs’ Portfolio Vega: Alternative Measures.
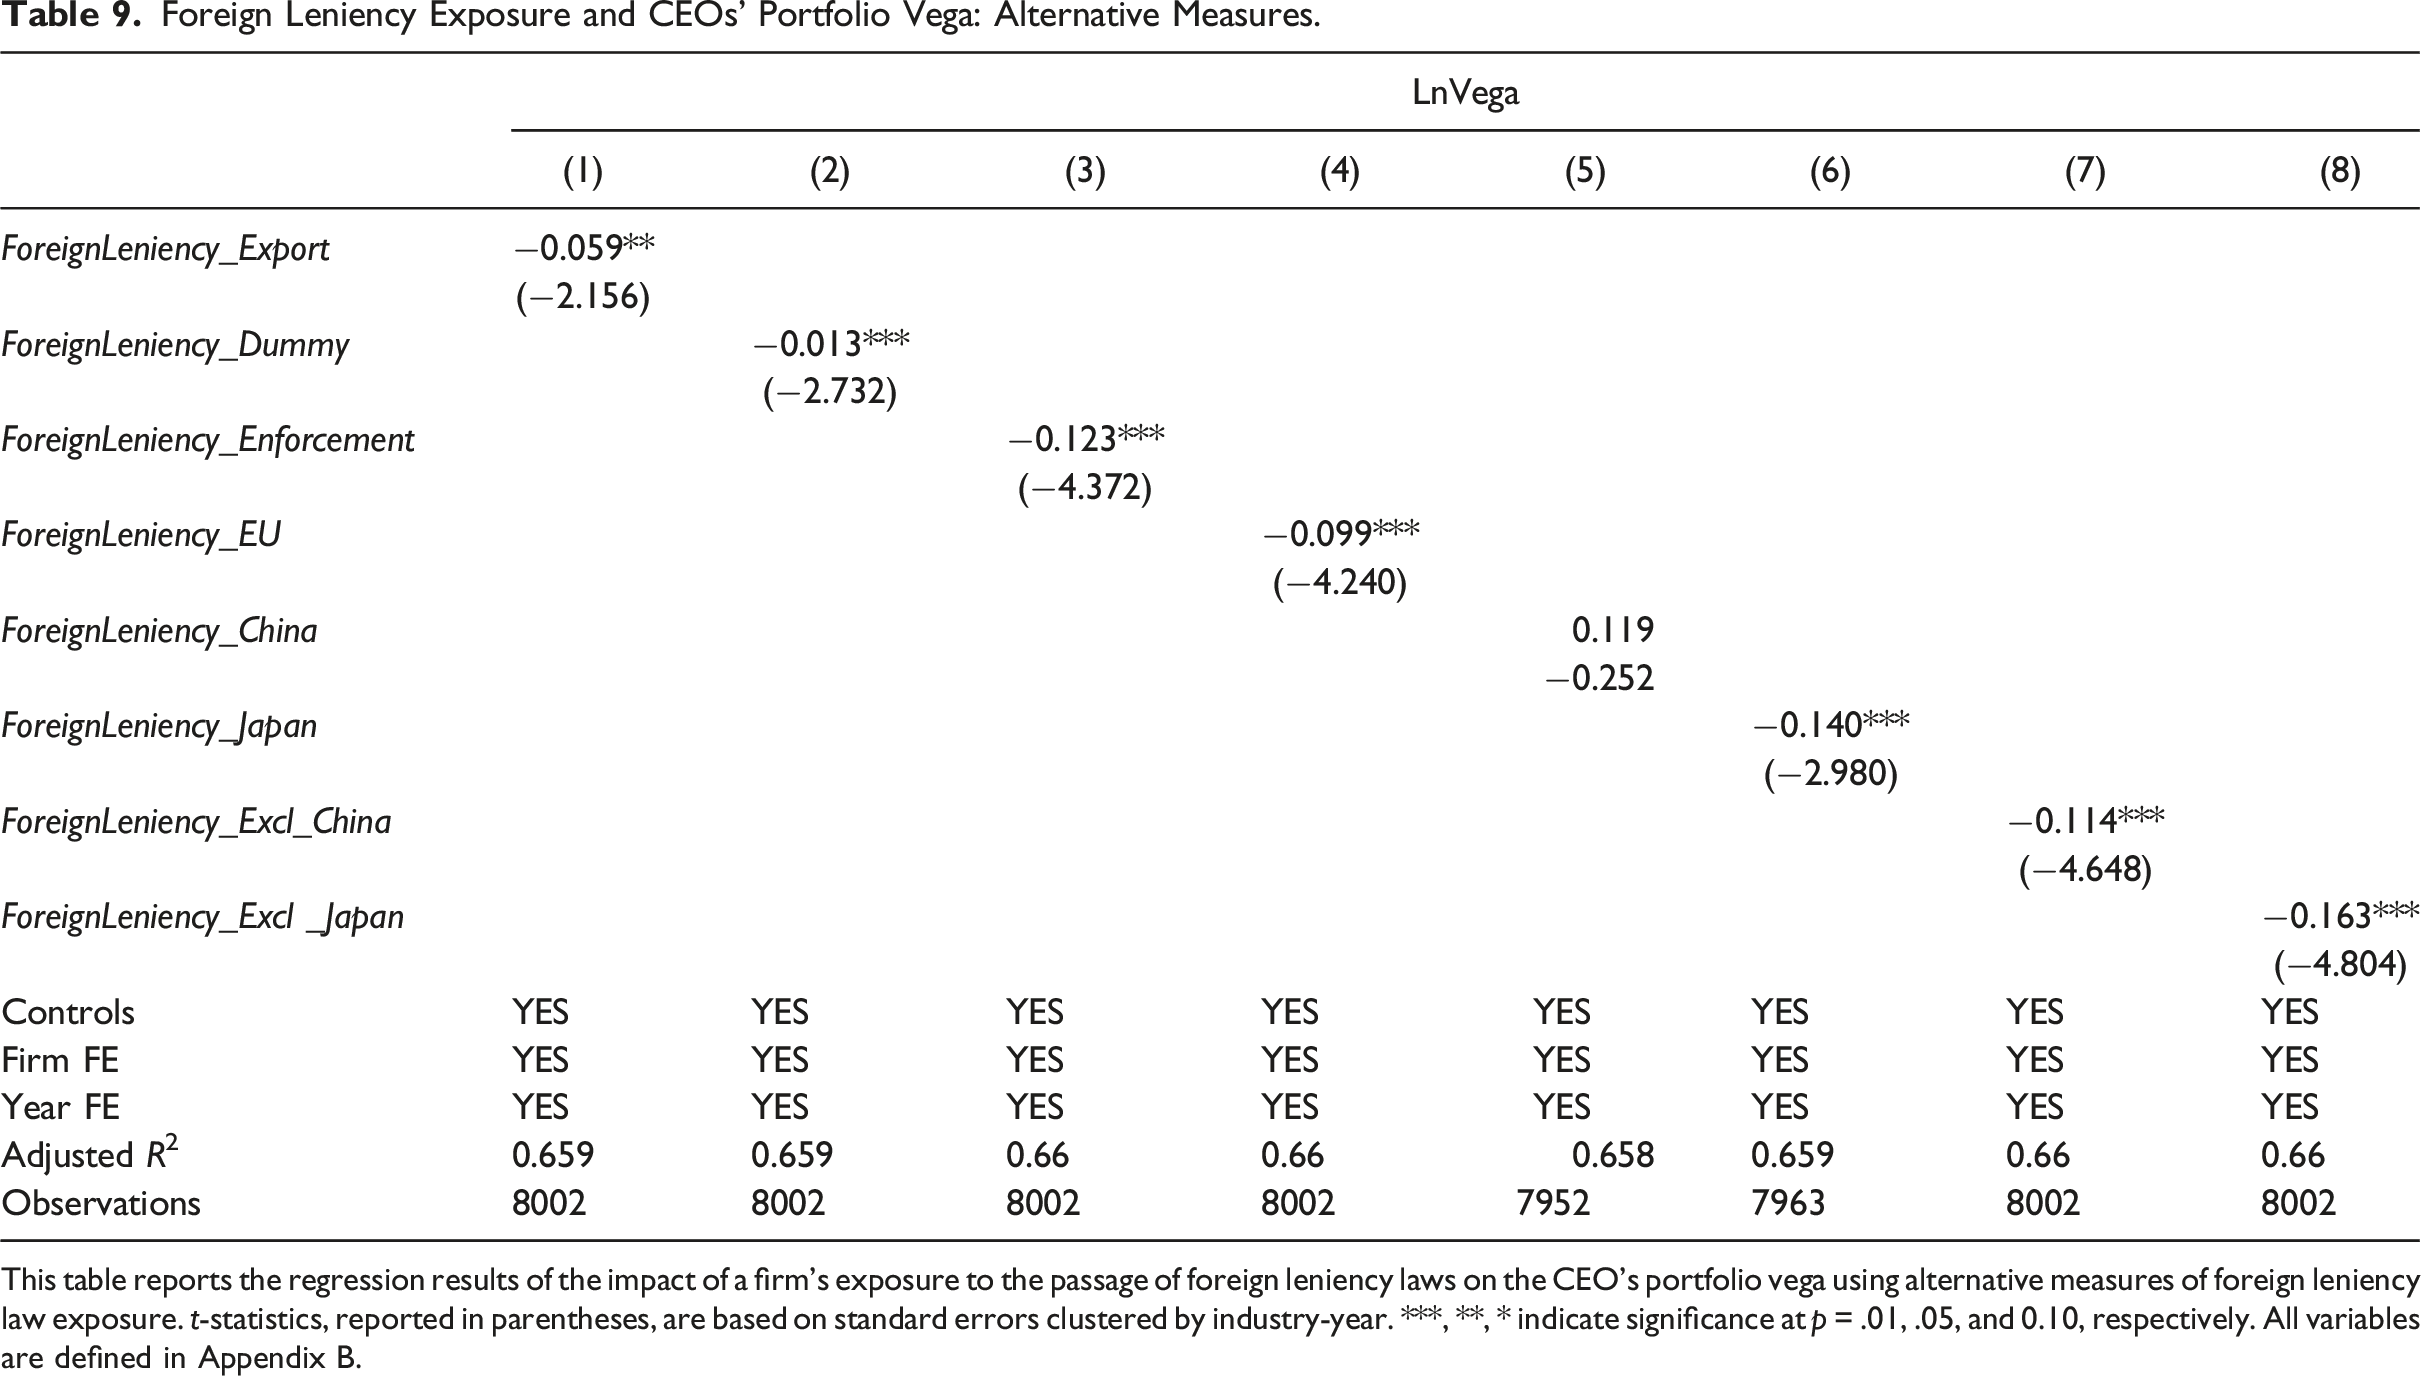
This table reports the regression results of the impact of a firm’s exposure to the passage of foreign leniency laws on the CEO’s portfolio vega using alternative measures of foreign leniency law exposure. t-statistics, reported in parentheses, are based on standard errors clustered by industry-year. ***, **, * indicate significance at p = .01, .05, and 0.10, respectively. All variables are defined in Appendix B.
Matched Sample
Foreign Leniency Exposure and CEOs’ Portfolio Vega: DID Test.
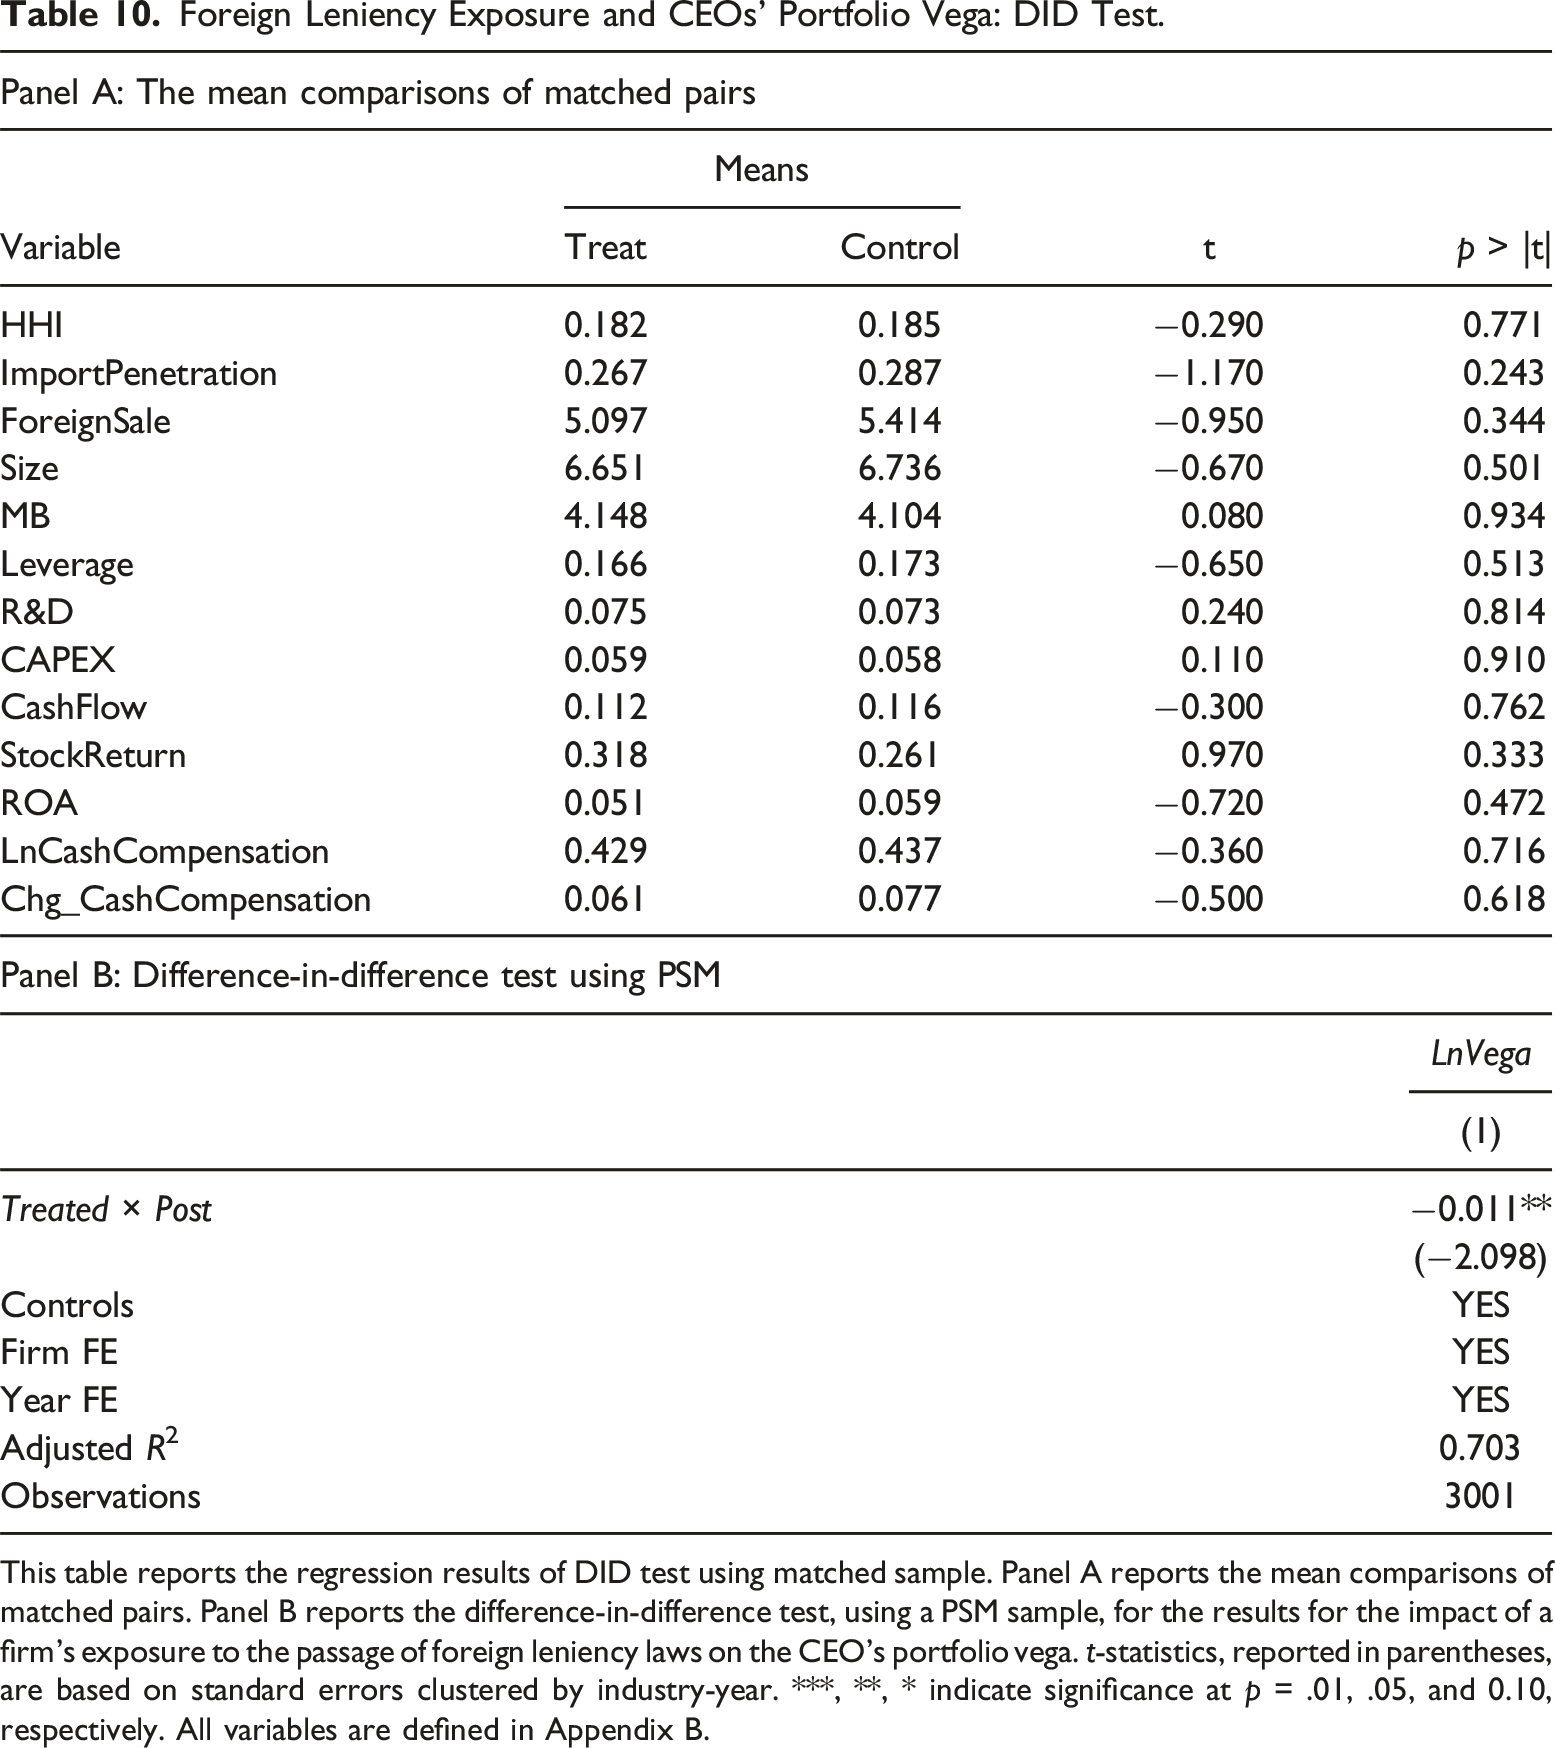
This table reports the regression results of DID test using matched sample. Panel A reports the mean comparisons of matched pairs. Panel B reports the difference-in-difference test, using a PSM sample, for the results for the impact of a firm’s exposure to the passage of foreign leniency laws on the CEO’s portfolio vega. t-statistics, reported in parentheses, are based on standard errors clustered by industry-year. ***, **, * indicate significance at p = .01, .05, and 0.10, respectively. All variables are defined in Appendix B.
Falsification Test and Dynamic Test
We perform a falsification test and then further utilize the binary treatment variable ForeignLeniency_Dummy to explore the multi-period dynamics of the effect of foreign leniency laws on vega.
Foreign Leniency Exposure and CEOs’ Portfolio Vega: Falsification Test and Dynamic Test.
This table reports the regression results of a falsification test (column 1) and a dynamics test (column 2) for the impact of a firm’s exposure to the passage of foreign leniency laws on the CEO’s portfolio vega. The falsification test uses a pseudo treatment year as four years before the actual year of the passage of a foreign leniency law. The dynamics test uses lags (−3, +3) of ForeignLeniency_Dummy from Table 9 t-statistics, reported in parentheses, are based on standard errors clustered by industry-year. ***, **, * indicate significance at p = .01, .05, and 0.10, respectively. All variables are defined in Appendix B.
To explore the dynamics of the leniency law effect, we decompose ForeignLeniency_Dummy into seven time-period indicator variables that simultaneously replace ForeignLeniency in the main model. ForeignLeniency (−3), ForeignLeniency (−2), and ForeignLeniency (−1), respectively, equals 1 for observations in year 3, 2, and 1 before the treatment year, and 0 otherwise. ForeignLeniency (0) equals 1 for observations in the treatment year, and 0 otherwise. ForeignLeniency (+1), ForeignLeniency (+2), and ForeignLeniency (+3), respectively, equals 1 for observations in year 1, 2, and 3 after the treatment year, and 0 otherwise. As reported in column 2 of Table 11, the coefficients for these period indicators show that CEO portfolio vega does not significantly decrease before the treatment year but begins to fall immediately in the year of treatment, and this effect continues for the subsequent 2 years.
Subsample Tests
Foreign Leniency Exposure and CEOs’ Portfolio Vega: Subsample Tests.
This table reports the regression results for the impact of a firm’s exposure to the passage of foreign leniency laws on the CEO’s portfolio vega, after excluding observations post-ASC 718 (column 1) or post-SOX (column 2). t-statistics, reported in parentheses, are based on standard errors clustered by industry-year. ***, **, * indicate significance at p = .01, .05, and 0.10, respectively. All variables are defined in Appendix B.
We observe that option-based compensation began to decrease after the 2002 passage of SOX and before ASC 718. Prior studies suggest that there was increased pressure from shareholder activists and regulators to reform the rules governing firms’ stock option plans post-SOX (Yang et al., 2021). We further restrict our sample to pre-SOX observations, as reported in column 2 of Table 12, and the effect of ForeignLeniency remains negative and significant in the pre-SOX period.
Conclusions
In this study, we exploit the staggered passage of leniency laws in foreign countries to explore how exogenously strengthened anti-cartel enforcement affects US firms’ CEO risk-taking incentives, as captured by CEO portfolio vega. We find that firms significantly reduce CEO portfolio vega following the passage of foreign leniency laws. Further analyses reveal that the observed reduction in risk-taking incentives is stronger for firms that are in more concentrated industries, have low investment opportunities, have fewer prospects for new competitive projects, and are in industries that had recent cartel investigations. We also show our results are unlikely to be driven by other dimensions of competition, managerial risk aversion, or CEO option exercising behaviors. Despite our efforts to isolate the effect of anti-cartel enforcement on vega, we acknowledge the challenge of untangling the individual impacts of these factors and establishing causal relationships due to their interconnected and often overlapping nature.
This study extends the literature exploring the link between managerial misbehaviors and CEO compensation structure and contributes to the growing literature exploring the determinants of CEO risk-incentive compensation. Our results are consistent with foreign leniency laws increasing firms’ downside risks, which discourages their boards from offering risk-taking equity incentives to managers. In this respect, our results imply a connection between anti-cartel enforcement and executive compensation design that may have broader ethical and policy implications. The evidence that foreign leniency laws affect compensation vega also contributes to the literature examining the economic consequences of the passage of foreign leniency laws. Finally, our study advances understanding of competition’s effects on executive pay by showing that anti-cartel enforcement exerts a unique and significant influence on vega.
Footnotes
Declaration of Conflicting Interests
The author(s) declared no potential conflicts of interest with respect to the research, authorship, and/or publication of this article.
Funding
The author(s) received no financial support for the research, authorship, and/or publication of this article.
Notes
Appendix
The table presents leniency law passage by country. We obtain the leniency law passage dates from Dasgupta and Žaldokas (2019), who collect information on initiation of leniency laws from the Cartel Regulation 2013, published by Getting the Deal Through.
Foreign Leniency Law Passage.
Country
Year
Country
Year
Argentina
None
Latvia
2004
Australia
2003
Lithuania
2008
Austria
2006
Luxembourg
2004
Belgium
2004
Malaysia
2010
Brazil
2000
Mexico
2006
Bulgaria
2003
Netherlands
2002
Canada
2000
New Zealand
2004
Chile
2009
Nigeria
None
China
2008
Norway
2005
Colombia Croatia
2009
Oman
None
Croatia
2010
Pakistan
2007
Cyprus
2011
Peru
2005
Czech Republic
2001
Philippines
2009
Denmark
2007
Poland
2004
Ecuador
2011
Portugal
2006
Estonia
2002
Romania
2004
Finland
2004
Russia
2007
France
2001
Singapore
2006
Germany
2000
Slovakia
2001
Greece
2006
Slovenia
2010
Hong Kong
None
South Africa
2004
Hungary
2003
Spain
2008
Iceland
2005
Sweden
2002
India
2009
Switzerland
2004
Indonesia
None
Taiwan
2012
Ireland
2001
Thailand
None
Israel
2005
Turkey
2009
Italy
2007
Ukraine
2012
Japan
2005
United Kingdom
1998
Jordan
None
Venezuela
None
Korea
1997
Zambia
None
Variable Definitions.
Variable
Definition
Data source
Main variables
LnVega
The natural logarithm of 1 plus portfolio vega in year t, where portfolio vega is calculated as the change in the dollar value of the CEO’s wealth for a 0.01 change in the annualized standard deviation of a firm’s stock return, following Core and Guay (2002). The value of the CEO’s wealth is for the CEO’s portfolio of stock and options. The option portfolio is the sum of the Black-Scholes values of the newly granted options plus previously granted non-exercisable and exercisable options
Execucomp
ForeignLeniency
The weighted average of the passage of laws in all other countries in year t, excluding the US. It is calculated as ForeignLeniency
jt
=
, where k, j, and t denote the foreign country, three-digit SIC industry, and year, respectively, and
is the share of three-digit SIC industry j’s sales imported from country k out of all industry j’s sales in 1990
Cartel Regulation 2013; Schott’s Data Library
Control variables
HHI
The Herfindahl–Hirschman Index for each three-digit SIC industry in year t is calculated by squaring the market share of each firm in the industry and then summing the resulting values across all firms in the industry
Compustat
ImportPenetration
The value of imports, divided by the sum of the value of imports and the shipment value minus the value of exports, at the industry level in year t
Schott’s Data Library
ForeignSale
Foreign sales divided by total sales at three-digit SIC industry-level in year t, calculated as pifo/sale
Compustat
Size
The log of firms’ total assets in year t, calculated as ln(at)
Compustat
MB
The market value of equity divided by the book value of equity in year t, calculated as (csho × prcc_c)/ceq
Compustat
Leverage
Total debt divided by total assets in year t, calculated as (dltt + dlc)/at
Compustat
R&D
Research and development expenditure divided by total assets in year t, calculated as xrd/at
Compustat
CAPEX
Net capital expenditure divided by total assets in year t, calculated as (capx -sppiv)/at
Compustat
CashFlow
Operating income, adjusted for depreciation and other accruals, and divided by total assets in year t, calculated using Compustat variables are as follows: (oiadp - accruals)/at, where accruals = (actt−actt−1) − (chet−chet−1) − (lctt−lctt−1) + (dlct−dlct−1) – dp, where act is current assets, che is cash and cash equivalents, lct is current liabilities, dlc is debt in current liabilities, and dp is depreciation and amortization expense
Compustat
StockReturn
Stock return for the 12-month fiscal period ending in year t
CRSP
ROA
Income before extraordinary items divided by total assets in year t, calculated as ib/at
Compustat
LnCashCompensation
The natural logarithm of 1 plus cash compensation in year t-1, calculated as ln (1 + total_curr)
Execucomp
Chg_CashCompensation
The changes in cash compensation (total_curr) from year t-1 to year t
Execucomp
Variables of cross-sectional tests
HighMarketConcentration
Market concentration is measured using the three-digit SIC industry Herfindahl-Hirschman Index (HHI) for year t. A firm-year is excluded if its HHI falls within the middle tercile and is assigned a value of 1 if it is in the upper tercile, or 0 if it is in the lower tercile of the sample
Compustat
WithRecentConviction
It equals 1 if a firm is in an industry that had a cartel case in the last three years, and 0 if it is not
Connor (2014)
HighInvestmentOpportunity
Firms’ investment opportunity is measured as the average market-to-book value of equity over a two-year window, calculated as (csho × prcc_c)/ceq. A firm-year is excluded if its market-to-book value of equity falls within the middle tercile and is assigned a value of 1 if it is in the upper tercile, or 0 if it is in the lower tercile of the sample
Compustat
Variables of additional test
NonPrice
The sum of firm-level advertising expenditure and R&D expenses, divided by the sum of firm-level sales in an industry in year t+1, calculated as (xad + xrd) / sale
Compustat
AdjProfitMargin
The sum of pre-tax income, interest expense, depreciation/amortization, R&D expenses, and advertising expenses, divided by total sales in year t+1, calculated as (pi + xint + dp + xrd + xad) / sale
Compustat
ChineseImport
The total value of imports from China divided by the sum of total value of imports and domestic production (shipments minus exports) for each three-digit SIC industry in year t
Schott’s Data Library
TariffCut
It equals 1 in the years following the tariff cut shock, and 0 in all other years
US Customs Service
PilotCEO
It equals 1 if the CEO holds a pilot license, and 0 otherwise
Federal Aviation Administration’s (FAA’s) Airmen Certification database
LnCash
The natural logarithm of 1 plus cash compensation in year t, calculated as ln (1 + total_curr)
Execucomp
LnEquity
The natural logarithm of 1 plus equity compensation in year t, calculated as ln (Options($) + Stock($)). Options($) is option_awards_blk_value before 2006 and option_awards_fv from 2006 onwards. Stock($) is rstkgrnt before 2006 and stock_awards_fv from 2006 onwards
Execucomp
LnOption
The natural logarithm of 1 plus option in year t, calculated as ln (1 + Options($))
Execucomp
Options/Equity ($)
The ratio of the value of stock options granted to the total value of equity grants in year t, calculated as Options($) / (Options($) + Stock($))
Execucomp
Options/Equity (#)
The ratio of the number of stock options granted to the total number of stock options and shares of stock granted in year t, calculated as option_awards_num/(option_awards_num + Stock($) / prcc_f)
Execucomp
ExerciseValue
The value realized by the CEO from option exercises divided by the total compensation in year t, calculated as opt_exer_val / tdc
Execucomp
ExerciseShares
The number of options exercised by the CEO during the year divided by the number of shares outstanding at the end of the year in year t, calculated as opt_exer_num / csho
Execucomp
LnVegaNew
The natural logarithm of 1 plus annual vega in year t, where annual vega is calculated as the change in the dollar value of the CEO’s wealth for a 0.01 change in the annualized standard deviation of a firm’s stock return. This variable is calculated using the methodology from Core and Guay (2002). The value of the CEO’s wealth is from the complete portfolio of stock and options. The option portfolio is the Black-Scholes values of the newly granted options
Execucomp
LnDelta
The natural logarithm of 1 plus portfolio delta in year t, where delta is the change in the dollar value of the CEO’s wealth for a 1% change in a firm’s stock price
Execucomp
StockVolatility
The standard deviation of a firm’s monthly stock return in year t
CRSP
ForeignLeniency_Export
The weighted average of the passage of laws, with the weight based on the share of exports
Cartel Regulation 2013; Schott’s Data Library
ForeignLeniency_Dummy
First, we rank the countries within each industry, based on import volume for each three-digit SIC code, and then select the top-ranked countries for each industry. The treatment year is identified as the year when a country first adopts its leniency law. The binary treatment variable equals 1 for the treated industry after the adoption of the leniency law, and 0 otherwise
Cartel Regulation 2013; Schott’s Data Library
ForeignLeniency_Enforcement
The weighted average of the passage of leniency laws in all countries whose governance index is higher than the global sample median at the time of leniency law implementation
Cartel Regulation 2013; Schott’s Data Library
ForeignLeniency_EU
The weighted average of the passage of leniency laws, with the year of the EU member’s leniency law passage set as 2002
Cartel Regulation 2013; Schott’s Data Library
ForeignLeniency_China
The weighted average of the passage of leniency law in China
Cartel Regulation 2013; Schott’s Data Library
ForeignLeniency_Japan
The weighted average of the passage of leniency law in Japan
Cartel Regulation 2013; Schott’s Data Library
ForeignLeniency_Excl_China
The weighted average of the passage of leniency laws in all foreign countries, excluding China
Cartel Regulation 2013; Schott’s Data Library
ForeignLeniency_Excl_Japan
The weighted average of the passage of leniency laws in all foreign countries, excluding Japan
Cartel Regulation 2013; Schott’s Data Library
Treated × Post
Treated equals 1 for treatment firms and 0 for matched control firms. Treatment firms are those in industries that experience the largest increase in leniency law exposure in a given year. Control firms are those that do not experience the largest increase in leniency law exposure and are matched with treatment firms using the propensity score matching method. Because the dynamic tests suggest that the effect of foreign leniency laws persist for three years (as mentioned earlier), we estimate the model using a 6-year event window, where Post equals 1 in the event year and two subsequent years, and 0 in the three years preceding the event
Cartel Regulation 2013; Schott’s Data Library
ForeignLeniency_Falsification
The falsification shock is applied to the four years prior to the treatment year, which is defined as the year a country first adopts its foreign leniency law
Cartel Regulation 2013; Schott’s Data Library
ForeignLeniency (−k), (0), (+k) where k = 3, 2, and 1
It equals 1 for firms in the third, second, and first years prior to the treatment year, the treatment year itself, and the first, second, and third years following the treatment year, and 0 otherwise
Cartel Regulation 2013; Schott’s Data Library