
Abstract
This study investigates the role of free cash flows and (cross-sectional and time-series) price momentum in predicting future stock returns. Past returns and free cash flows each positively predict future stock returns after controlling for the other, suggesting that cash flows and momentum both contain valuable and distinctive information about future stock returns. A strategy of buying past winners with high free cash flows and shorting past losers with low free cash flows significantly outperforms the traditional momentum trading strategy. The enhanced performance is not sensitive to investor sentiment, time variations, or transaction costs. Further analysis shows that the incremental cash flow effects are largely attributable to net distributions to equity/debt holders. Overall, our findings shed light on the role of corporate fundamentals in technical trading strategies.
Keywords
Introduction
Cash is the lifeblood of a business, yet managers and investors tend to fixate upon earnings and overlook cash flows. Even sophisticated market participants such as financial analysts sometimes neglect cash flow information. For example, on January 23, 2018, Netflix Inc. shares rose by 13% after the company’s fourth-quarter earnings announcement. This increase was primarily because most analysts believed that the company had done very well in reported earnings; however, its cash flow generation was “abysmal and worsening.” 1 In addition, because the U.S. government does not require companies to provide complete financial statements in quarterly earnings releases, the disclosure of items from the statement of cash flows remains infrequent (Miao et al., 2016). Accordingly, the valuation implications of cash flows are relatively underexamined in previous research (Adame et al., 2020; Dechow et al., 2008). 2 Our study attempts to address this gap in the literature by examining the role of free cash flows (FCFs) in predicting future stock returns when interacting with price momentum.
Price momentum was first documented by Jegadeesh and Titman (1993), who find that a trading strategy of buying past winners and shorting past losers generates significant profits. This anomaly is robust across asset classes, sample periods, and geographic markets (e.g., Asness et al., 2013; Chan et al., 1996; Griffin et al., 2005), and cannot be explained by the standard asset pricing models (e.g., Fama & French, 1996; Grundy & Martin, 2001). Recent research extends the literature from cross-sectional momentum (CSMOM) to time-series momentum (TSMOM) and finds strong positive predictability from a stock’s own past returns (e.g., Huang et al., 2020; Moskowitz et al., 2012). The momentum anomaly has been acknowledged as one of the biggest challenges to asset pricing (Fama & French, 2008, 2016). 3
Despite extensive evidence on the robustness of the momentum anomaly, a consensus has yet to be reached regarding the source of stock return predictability based on past returns. Chan et al. (1996), the first to explore this question, posit that one important avenue to understand the price momentum is to explore how it relates to the market’s pricing of fundamental information. 4 They link the price momentum to the market’s underreaction to earnings surprises based on the possibility that a stock’s prior 6-month returns capture the market’s reaction to the most recent earnings surprise. They find that past returns and past earnings surprises both predict large drifts in future returns after controlling for the other. Subsequent studies extend Chan et al. (1996) by examining how past returns interact with other key accounting-based measures that carry important messages on firm performance, including the systematic component of earnings momentum (Chordia & Shivakumar, 2006), revenue surprise (Chen et al., 2014), and accruals (Gu & Wu, 2020).
However, to the best of our knowledge, the empirical evidence on how the interplay of FCFs with price momentum predicts future returns is sparse. This omission is unfortunate given that FCFs are fundamental to firm valuation and price formation (Copeland et al., 2000). Our study investigates (a) whether the predictability of price momentum is subsumed by FCFs, and (b) whether a trading strategy based on FCFs and past returns generates larger profits than the traditional momentum strategy. We consider both CSMOM and TSMOM and decompose FCF by their uses—distribution to debt or equity holders—to gain additional insight on how different sources of cash flows affect price momentum. 5
We start by sorting and ranking stocks independently based on their past returns and FCFs. Consistent with previous research (e.g., Asness et al., 2013; Jegadeesh & Titman, 1993, 2001), we classify stocks with the highest past returns as winners and those with the lowest past returns as losers. After controlling for the past returns in both two-way analysis and the Fama–MacBeth regressions, we find that cash flows exhibit significant explanatory power for future stock returns. We also find that the portfolio payouts are unaffected by alternative techniques of portfolio formation. Similarly, after controlling for cash flows, we find that the profitability of the momentum strategy remains robust, with the momentum profits being higher in low FCF firms. Our results suggest that FCFs and past returns both contain valuable and distinctive information for forecasting stock returns. 6
Next, we propose an enhanced momentum strategy based on the combined signal from past returns and FCFs (the FCF-based momentum strategy). Our results show that conditioning the momentum trading strategy on cash flows substantially boosts portfolio profits. Specifically, if we long winner stocks with high cash flows and short loser stocks with low cash flows and then hold them for 6 months following the formation month, this net zero-investment portfolio will yield monthly returns up to 1.47%. In comparison, the monthly returns of the traditional price momentum over our sample period are only 0.75%. Besides the sizable improvement in terms of monthly portfolio returns, the enhanced momentum strategies also exhibit much smaller downward risks (measured with skewness and kurtosis) and almost double the Sharpe ratio of the traditional momentum strategy. In the sensitivity checks, we find that our enhanced momentum strategy outperforms the traditional momentum strategy across different levels of investor sentiment and time periods.
Dechow et al. (2008) argue that, among cash flow components, retained cash flows are less persistent compared with the distribution parts to equity and debt holders. We predict that components with relatively high persistence are more likely to be underpriced if investors fixate on earnings. Following Dechow et al. (2008), we decompose FCFs into changes in the annual cash balance, net distributions to equity holders, and net distributions to debt holders. As expected, our results show that the underpricing of cash flows is driven by net cash distributions to equity and debt holders. Portfolios formed on net distributions to equity holders/debt holders yield significant excess returns in both winner and loser groups. In addition, the incremental effects of cash flows on the momentum performance correspond predominantly to the net distributions to equity and debt holders.
We have so far reported that the enhanced momentum strategy (i.e., buying past winners with high cash flows and shorting past losers with low cash flows) generates superior payoffs relative to those that could be achieved by the conventional momentum strategy. However, some recent papers have proposed several different but not mutually exclusive explanations of momentum: the accrual anomaly, the growth explanation, the limit of arbitrage, and the risk-based explanation. Therefore, we test whether the superior performance of the FCF-based momentum strategy can be attributed to these alternative explanations.
First, one may reasonably be concerned that the mispricing of FCFs can be attributable to the accrual anomaly. To test this alternative explanation, we consider three partition variables: total accruals, dictionary accruals, and growth in net operating assets. We divide our sample into high and low accrual groups and repeat our main analysis. Our results suggest that the incremental effect of FCFs on momentum payoffs cannot be fully explained by the accrual anomaly.
Second, we examine whether limits-to-arbitrage can explain the profits of our enhanced momentum strategy. Arbitrage is costly. Trading frictions (e.g., transaction costs) may potentially restrict arbitrageurs’ trading behavior, which subsequently causes mispricing (Lam & Wei, 2011). Arbitrage is also risky. Momentum effects are stronger among high idiosyncratic volatility stocks (Arena et al., 2008). We employ five proxies for limits-to-arbitrage. If the superior performance of our enhanced momentum strategy is due to the limit of arbitrage, then the superiority should disappear in groups with low arbitrage constraints. However, we find that the enhanced momentum trading strategy yields higher returns than the traditional momentum strategy in both high and low limits-to-arbitrage groups.
Third, we conduct a series of risk control tests to examine whether the enhanced momentum effect is attributable to risk. We repeat portfolio analyses after replacing raw stock returns with size-adjusted returns, size- and book-to-market-adjusted returns, and industry-adjusted returns. We also estimate alphas for the intersection portfolios using six conventional asset pricing models. Our results support the conjecture that the momentum effect and the cash flow effect are distinct and that the enhanced performance of the FCF-based momentum strategy cannot be fully captured by the existing asset pricing models and common risk factors.
Finally, we extend the Fama–French (FF) three factors with a mimic factor of earnings surprises Standardized Unexpected Earnings (SUE factor) to test whether the cash flow effects, the momentum effects, and the FCF-based momentum strategy can be explained away by the SUE factor. After controlling for the SUE factor, we find that the cash flow effects, for both past loser and winner stocks, remain strong, but the profits of the CSMOM and TSMOM strategies disappear for stocks with high FCF. This suggests that the combined explanatory effect of FCFs and earnings surprises on price momentum is prominent. In contrast, the FCF-enhanced momentum strategies continue to present superior performance.
Our study contributes to the literature in the following ways. First, we contribute to the recent development in the literature that incorporates profitability, investment, and expected earnings growth, among other factors based on accounting numbers, in explaining future expected returns (Fama & French, 2015; Hou et al., 2015; Penman & Zhang, 2020; Penman & Zhu, 2022). Our results suggest that cash flow and past returns contain distinct information that the market fails to react efficiently. The strong positive association between cash flows and future returns, after controlling for various risk factors, supports the notion that investors fixate on earnings and thus underprice cash flows.
Second, our article adds to the research that explores enhanced momentum strategies by relating firm-specific attributes to the traditional momentum strategies. Prior research has examined revenue growth (Sagi & Seasholes, 2007), dividends (Asem, 2009), revenue surprise and earnings surprise (Chen et al., 2014), and the quality of governance (Sherif & Chen, 2019). We show that an enhanced momentum strategy that buys firms with high past returns and high FCFs and sells firms with low past returns and low FCFs outperforms the traditional momentum strategy. Unlike the above studies that limit their investigation to CSMOM, our study examines both CSMOM and TSMOM in a unified setting. 7 Results on the enhanced momentum strategy provide implications on how investors process information contained in cash flows and past returns interactively in pricing stocks.
Third, our study contributes to the accounting literature on the pricing of earnings components and cash flows in particular. When examining how investors process earnings components in pricing stocks, prior research extensively focuses on accruals—the noncash component of earnings (Fairfield et al., 2003b; S. A. Richardson et al., 2005; Sloan, 1996). The valuation implications and the market perceptions of cash flows are relatively underexamined (Adame et al., 2020; Cheng & Hollie, 2008). Extant studies on the mispricing of cash flows mostly investigate whether cash flows are distinct from accruals in predicting future returns (Cheng & Thomas, 2006; Houge & Loughran, 2000; Hribar & Yehuda, 2015). We extend the literature by providing evidence on how FCFs interact with past returns in predicting future returns. Our results also show that the underpricing of cash flow is driven by net cash distributions to equity and debt holders.
The remainder of this article is organized as follows. The “Related Literature and Hypothesis Development” section reviews relevant literature on the valuation effect of cash flows and develops our testable hypotheses. The “Data and Method” section describes the data and methodology. The empirical results are discussed in the “Empirical Results” and “Further Analyses” sections. The “Conclusion” section concludes the article.
Related Literature and Hypothesis Development
The Valuation Role of Cash Flows
The first strand of literature pertinent to our study relates to the valuation implication of cash flows. A positive relation between cash-based measures and future returns is well documented (Hackel et al., 2000; Houge & Loughran, 2000; Lakonishok et al., 1994). Prior studies attribute this positive relation to investors’ inability to process cash flow information, and they provide two behavioral explanations. On one hand, because cash-to-price (C/P) is a common value-glamor proxy, the positive relation between cash flows and future returns is viewed as value/glamor phenomenon in the finance literature—a fact that value stocks outperform growth stocks. In an influential paper, Lakonishok et al. (1994) attribute the superior performance of high C/P stocks (value stocks) to investors’ exceptional errors on firms’ future growth rates. They find that value stocks are underpriced because investors extrapolate poor past growth rates into the future and thus are overly pessimistic about such stocks.
On the other hand, accounting papers tend to attribute investors’ underpricing of cash flow to their failure to appreciate its high persistence relative to accruals. Sloan (1996) shows that accruals are less persistent than operating cash flows for 1-year-ahead earnings, and firms with high (low) accruals tend to have abnormally low (high) future stock returns. He interprets the results as suggesting that investors fixate on earnings and thus overprice (underprice) the component of earnings with lower (higher) persistence. Houge and Loughran (2000) extend Sloan’s (1996) work by documenting approximately 10.4% annualized excess returns to a trading strategy based on cash flows. They also find that although cash flows and accruals are negatively related, the hedge portfolios based on cash flows and those based on accruals contain mostly firms with distinct size, book-to-market, and persistence characteristics. Desai et al. (2004) and Cheng and Thomas (2006) investigate whether cash flows subsume accruals in predicting future returns and report mixed results. Hribar and Yehuda (2015) incorporate the firm life cycle concept and find that FCFs subsume mispricing of total accruals in the maturity and decline stages but not in the growth stage, consistent with accruals and cash flows containing unique information in the growth stage. In summary, this strand of literature mainly focuses on whether cash flows are distinct from accruals in predicting future returns.
Recent accounting research demonstrates that so-called anomalous returns predicted by accounting numbers reflect normal returns for risk. Theoretical work in Penman and Zhang (2020) shows how accounting numbers convey information about risk when prepared under conservative accounting. Penman and Zhang (2021) seek validation of the theory and provide empirical support by examining how the book rate of return is connected to risk and expected stock returns. A more recent study by Penman and Zhu (2022) connects accounting principles (e.g., clean surplus and earnings recognition) with consumption risk. They develop an asset pricing model that equates expected returns to accounting metrics that a priori indicate expected future earnings growth at risk. Given that cash flows are one of the key accounting characteristics in valuation, these studies suggest a risk-based explanation of why cash flows predict future returns.
We extend the literature on how the market processes cash flow information by investigating (a) the pricing of cash flows conditional on past returns and (b) the pricing of cash flow components.
The Momentum Anomaly and the Underreaction Explanation
Our study is also related to the literature on the robustness of price momentum and the underreaction explanation. Jegadeesh and Titman (1993), using a U.S. sample of New York Stock Exchange (NYSE)/American Stock Exchange (AMEX) stocks from 1965 through 1989, document that a trading strategy of buying stocks that were winners in the past 6 months and selling those that were losers in the past 6 months generates approximately 1% monthly returns over the subsequent 6 months. Fama and French (1996) note that momentum effects are not subsumed by their three-factor model. Subsequent papers demonstrate that the momentum effect cannot be justified with a risk-based explanation and is robust across securities, sample periods, and international markets (e.g., Asness et al., 2013; Chan et al., 1996; Griffin et al., 2005). While early studies on momentum focus primarily on CSMOM, recent research documents significant TSMOM (e.g., Huang et al., 2020; Moskowitz et al., 2012).
A large body of research attempts to elucidate momentum by studying investors’ reactions to firm-specific information and how such information is incorporated into stock prices. Behavioral models show that momentum arises mainly from underreaction to information due to conservatism in expectation updating (Barberis et al., 1998), slow information diffusion (Hong & Stein, 1999), and the disposition effect (i.e., investor’s tendency to ride losses and realize gains) (Grinblatt & Han, 2002). Subsequent studies find empirical evidence consistent with the underreaction explanation. For example, Frazzini (2006) finds that bad news travels slowly among stocks trading at large capital losses and good news travels slowly among stocks trading at large capital gains, in turn leading to price momentum. Lee and Swaminathan (2000) find that stocks with higher trading volume exhibit stronger momentum. Verardo (2009) documents that momentum profits are larger in portfolios with higher dispersion in analyst forecasts. Hong et al. (2000) show that the momentum strategies work better in stocks with small size and low analyst coverage, consistent with the underreaction hypothesis. Finally, Jiang et al. (2005) and Zhang (2006) find higher momentum payoffs among firms with higher information uncertainty, proxied by firm size, firm age, return volatility, cash flow volatility, and analyst forecast dispersion. In contrast, some studies show that momentum effects are driven by overreaction. Examples include investors’ delayed overreaction to stock-specific information (K. Daniel et al., 1998), investors’ herding behavior (Grinblatt et al., 1995), and investors’ return chasing behavior (Sirri & Tufano, 1998).
It should be emphasized that we do not attempt to reconcile the underreaction versus overreaction explanations. Instead, our research is built on the evidence of underreaction in the momentum literature. If the momentum effects stem from investors’ underreaction to firm-specific information, then we believe it is natural to ask whether and how much the underreaction is related to the underreaction to cash flows.
Gu and Wu (2020) examine the role of accruals and find that momentum profits are mostly concentrated in firms with high accruals. Our study differs from Gu and Wu (2020) in three important ways. First, although accruals and cash flows have a strong negative correlation, cash flows contain distinctive information from accruals when predicting future performance or future returns (Houge & Loughran, 2000; Hribar & Yehuda, 2015). Second, unlike Gu and Wu (2020) that treat accruals as a partitioning variable and show the incremental effect of accruals on the relation between past returns and future returns, we examine whether past returns and FCFs predict future returns after controlling for the other. Third, while Gu and Wu (2020) focus on CSMOM, we consider both CSMOM and TSMOM.
Hypothesis Development
As discussed in the above sections, prior studies have widely documented the robustness of price momentum and attributed the momentum effect to investors’ underreactions to the information contained in past returns (e.g., Barberis et al., 1998; Chan et al., 1996; Frazzini, 2006; Griffin et al., 2005; Hong et al., 2000; Hong & Stein, 1999; Jegadeesh & Titman, 1993; Verardo, 2009). Other studies have examined the relationship between cash flows and future returns and attributed the underpricing of cash flows to investors’ underestimation of the valuation implication of cash flows (e.g., Desai et al., 2004; Houge & Loughran, 2000; Lakonishok et al., 1994; Sloan, 1996). These two lines of research treat the return predictability of past returns and cash flows as two separate phenomena.
We posit that, to the extent that the momentum effect and the cash flow effect stem from investors’ underreaction to firm-specific information, the separate lines of research on these two effects are developed on one implicit assumption: Past returns and cash flows contain distinct information, and thus, price momentum and cash flow mispricing are two distinct anomalies. However, there is no empirical evidence directly testing this assumption. We test this assumption by examining the joint distribution of future returns conditional on both past returns and cash flows. If past returns and cash flows contain distinct information, we expect that (a) returns to the momentum strategy are not subsumed by cash flows (and vice versa), and (b) an enhanced strategy that accounts for past returns and cash flows will generate more significant excess returns than the traditional momentum strategy.
Our predictions also build on prior research suggesting that cash flows and past returns are unique valuation metrics and contain unpriced information distinct to other metrics. Several studies show that the mispricing of cash flows is not subsumed by accruals, suggesting cash flows and accruals convey distinct information (Houge & Loughran, 2000; Hribar & Yehuda, 2015). For the momentum effect, Chan et al. (1996) relate price momentum to the market’s underreaction to earnings news. They find that momentum strategies are profitable after they control for earnings surprise, suggesting that past returns and earnings surprise capture different pieces of information that are not fully priced by the market in a timely fashion. Chen et al. (2014) examine the profits of revenue and earnings surprises and price momentum strategies and find no dominant strategy among them, suggesting that revenue surprises, earnings surprises, and prior returns each carry some exclusive unpriced information content.
Given the above, we specify two hypotheses in the alternative form:
However, our predictions are not without tension. It is possible that price momentum and cash flow mispricing may capture a similar phenomenon. First, both anomalies document future returns linked to information about firm performance. Past returns are a stock-price-based measure that reflects the market’s perception of a firm’s prospect. Cash flows indicate the accounting-based profitability level with relatively high persistence to the next period. Both indicators are likely to be positively correlated. Second, prior research suggests that both anomalies are a result of the market’s underreaction to information. While other explanations exist, the underreaction explanation—which predicts that prices adjust slowly to new information and thus firms with high past returns are undervalued—appears to be the most promising behavioral explanation of the momentum effects (Barberis et al., 1998; Chan et al., 1996; Hong & Stein, 1999). If the profitability of the momentum strategy is due to the underreaction to cash flow information, then the momentum strategy will not be profitable after controlling for cash flows.
Data and Method
Our sample consists of common shares (share Codes 10 and 11) traded on the NYSE or AMEX from January 1965 to December 2015. We collect monthly return data from The Center for Research in Security Prices (CRSP) and financial data from Compustat.
CSMOM and TSMOM both select winner and loser stocks by using past stock returns. The key difference is that CSMOM assigns stocks to winner and loser portfolios based on their relative performance, while TSMOM assigns stocks based on their absolute performance. For the CSMOM strategy, we construct the portfolios following Jegadeesh and Titman (1993). At the end of each month (Month 0), stocks are sorted into quintiles based on their returns from the past 6 months (from Month −5 to Month 0). For the TSMOM strategy, we follow Moskowitz et al. (2012) and assign stocks with positive and negative returns over the past 6 months (from Month −5 to Month 0) to the winner and loser portfolios, respectively. In both cases, we take a long position in the winner portfolio and a short position in the loser portfolio. To avoid potential microstructure biases, we skip 1 month (Month 1) between the end of the formation period and the beginning of the holding period. The winner and loser portfolios are then held for 6 months (from Month 2 to Month 7). All stocks priced less than US$5 at the beginning of the holding period are excluded from the sample. Overlapping portfolios are constructed to increase the power of our tests. Specifically, each portfolio contains selected stocks from the previous six formation months.
We measure FCFs as earnings (IB) less total accruals (ACC), with a broad definition of accruals that includes all accruals relating to operating and investing decisions (Dechow et al., 2008; Hribar & Yehuda, 2015; S. A. Richardson et al., 2005). Accruals
Following Dechow et al. (2008), we further decompose the FCFs into changes in the annual cash balance
Then we perform double sorting. In each month, we sort stocks independently based on their past returns and FCF. Stocks are assigned to one of the five (two) CSMOM (TSMOM) portfolios and one of the five FCF portfolios. For example, we run an independent double sorting based on past returns and
Empirical Results
Effects of Price Momentum and FCFs on Subsequent Stock Returns
Table 1 reports the mean of the characteristics of portfolios formed on past returns (CSMOM and TSMOM) or FCF. Panel A reports statistics of independently sorted portfolios, while Panel B reports statistics of intersected portfolios (e.g., CSMOM1+FCF1 or TSMOMNEG+ FCF). There is no large dispersion in terms of firm characteristics across CSMOM-, TSMOM-, or FCF-sorted portfolios, except for the accruals across FCF portfolios. Consistent with prior research (e.g., Dechow, 1994; Sloan, 1996), accruals and FCFs have an inverse relationship, in which the average accrual is 0.03 for low FCF firms (FCF1) and −0.08 for high FCF firms (FCF5).
Summary Statistics.
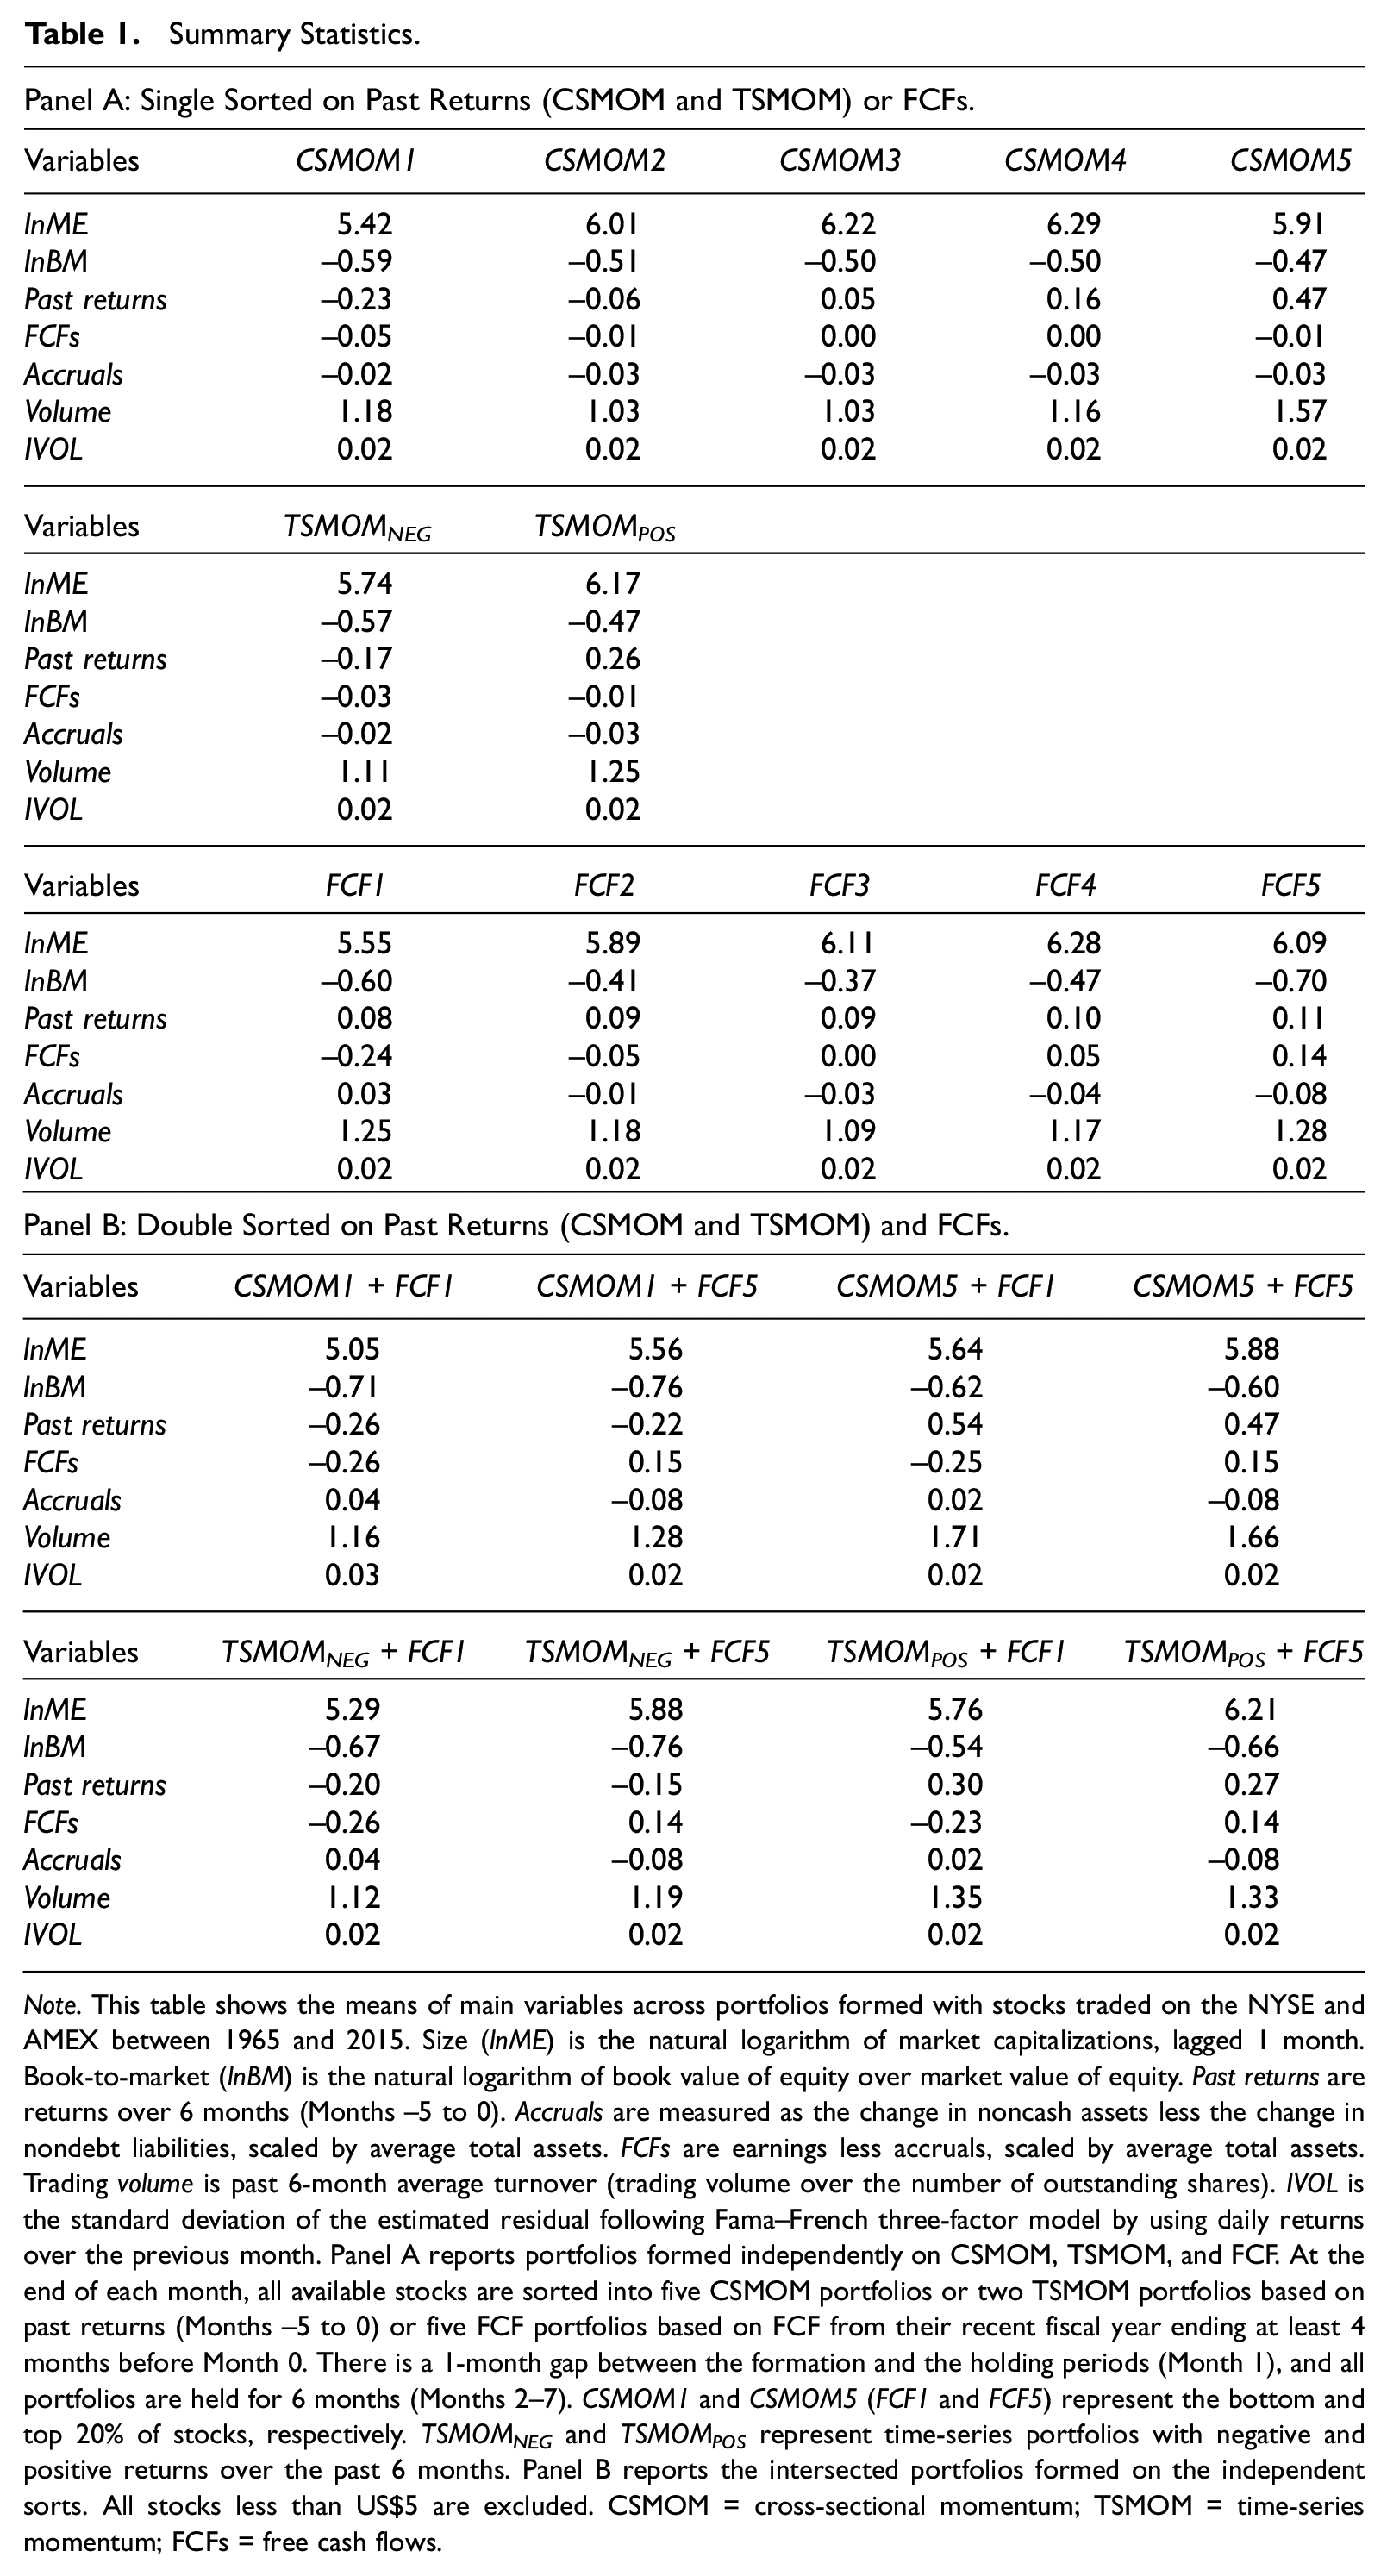
Note. This table shows the means of main variables across portfolios formed with stocks traded on the NYSE and AMEX between 1965 and 2015. Size (lnME) is the natural logarithm of market capitalizations, lagged 1 month. Book-to-market (lnBM) is the natural logarithm of book value of equity over market value of equity. Past returns are returns over 6 months (Months −5 to 0). Accruals are measured as the change in noncash assets less the change in nondebt liabilities, scaled by average total assets. FCFs are earnings less accruals, scaled by average total assets. Trading volume is past 6-month average turnover (trading volume over the number of outstanding shares). IVOL is the standard deviation of the estimated residual following Fama–French three-factor model by using daily returns over the previous month. Panel A reports portfolios formed independently on CSMOM, TSMOM, and FCF. At the end of each month, all available stocks are sorted into five CSMOM portfolios or two TSMOM portfolios based on past returns (Months −5 to 0) or five FCF portfolios based on FCF from their recent fiscal year ending at least 4 months before Month 0. There is a 1-month gap between the formation and the holding periods (Month 1), and all portfolios are held for 6 months (Months 2–7). CSMOM1 and CSMOM5 (FCF1 and FCF5) represent the bottom and top 20% of stocks, respectively. TSMOMNEG and TSMOMPOS represent time-series portfolios with negative and positive returns over the past 6 months. Panel B reports the intersected portfolios formed on the independent sorts. All stocks less than US$5 are excluded. CSMOM = cross-sectional momentum; TSMOM = time-series momentum; FCFs = free cash flows.
Table 2 reports monthly returns of portfolios formed on past stock returns and FCF. In Panel A, stocks are sorted into quintiles based on firms’ FCF and past 6-month returns for the CSMOM strategy. 9 Stocks are grouped into two portfolios on the sign of the past 6-month returns (positive or negative) for the TSMOM strategy. Each portfolio is then held for 6 months (from Month 2 to Month 7) following the formation. Consistent with existing empirical findings in the literature of momentum anomaly (e.g., Asness et al., 2013; Jegadeesh & Titman, 1993) and cash flow valuation (e.g., Lakonishok et al., 1994; Sloan, 1996), our results show that either the information of historical stock returns or corporate fundamentals of FCFs has not been fully reflected in the stock price. Specifically, results in Panel A show that the trading strategies based on CSMOM, TSMOM, and FCF earn significant risk-adjusted returns of 0.75%, 0.48%, and 0.62%, respectively.
Performance of Portfolios Formed on Past Returns and FCFs.
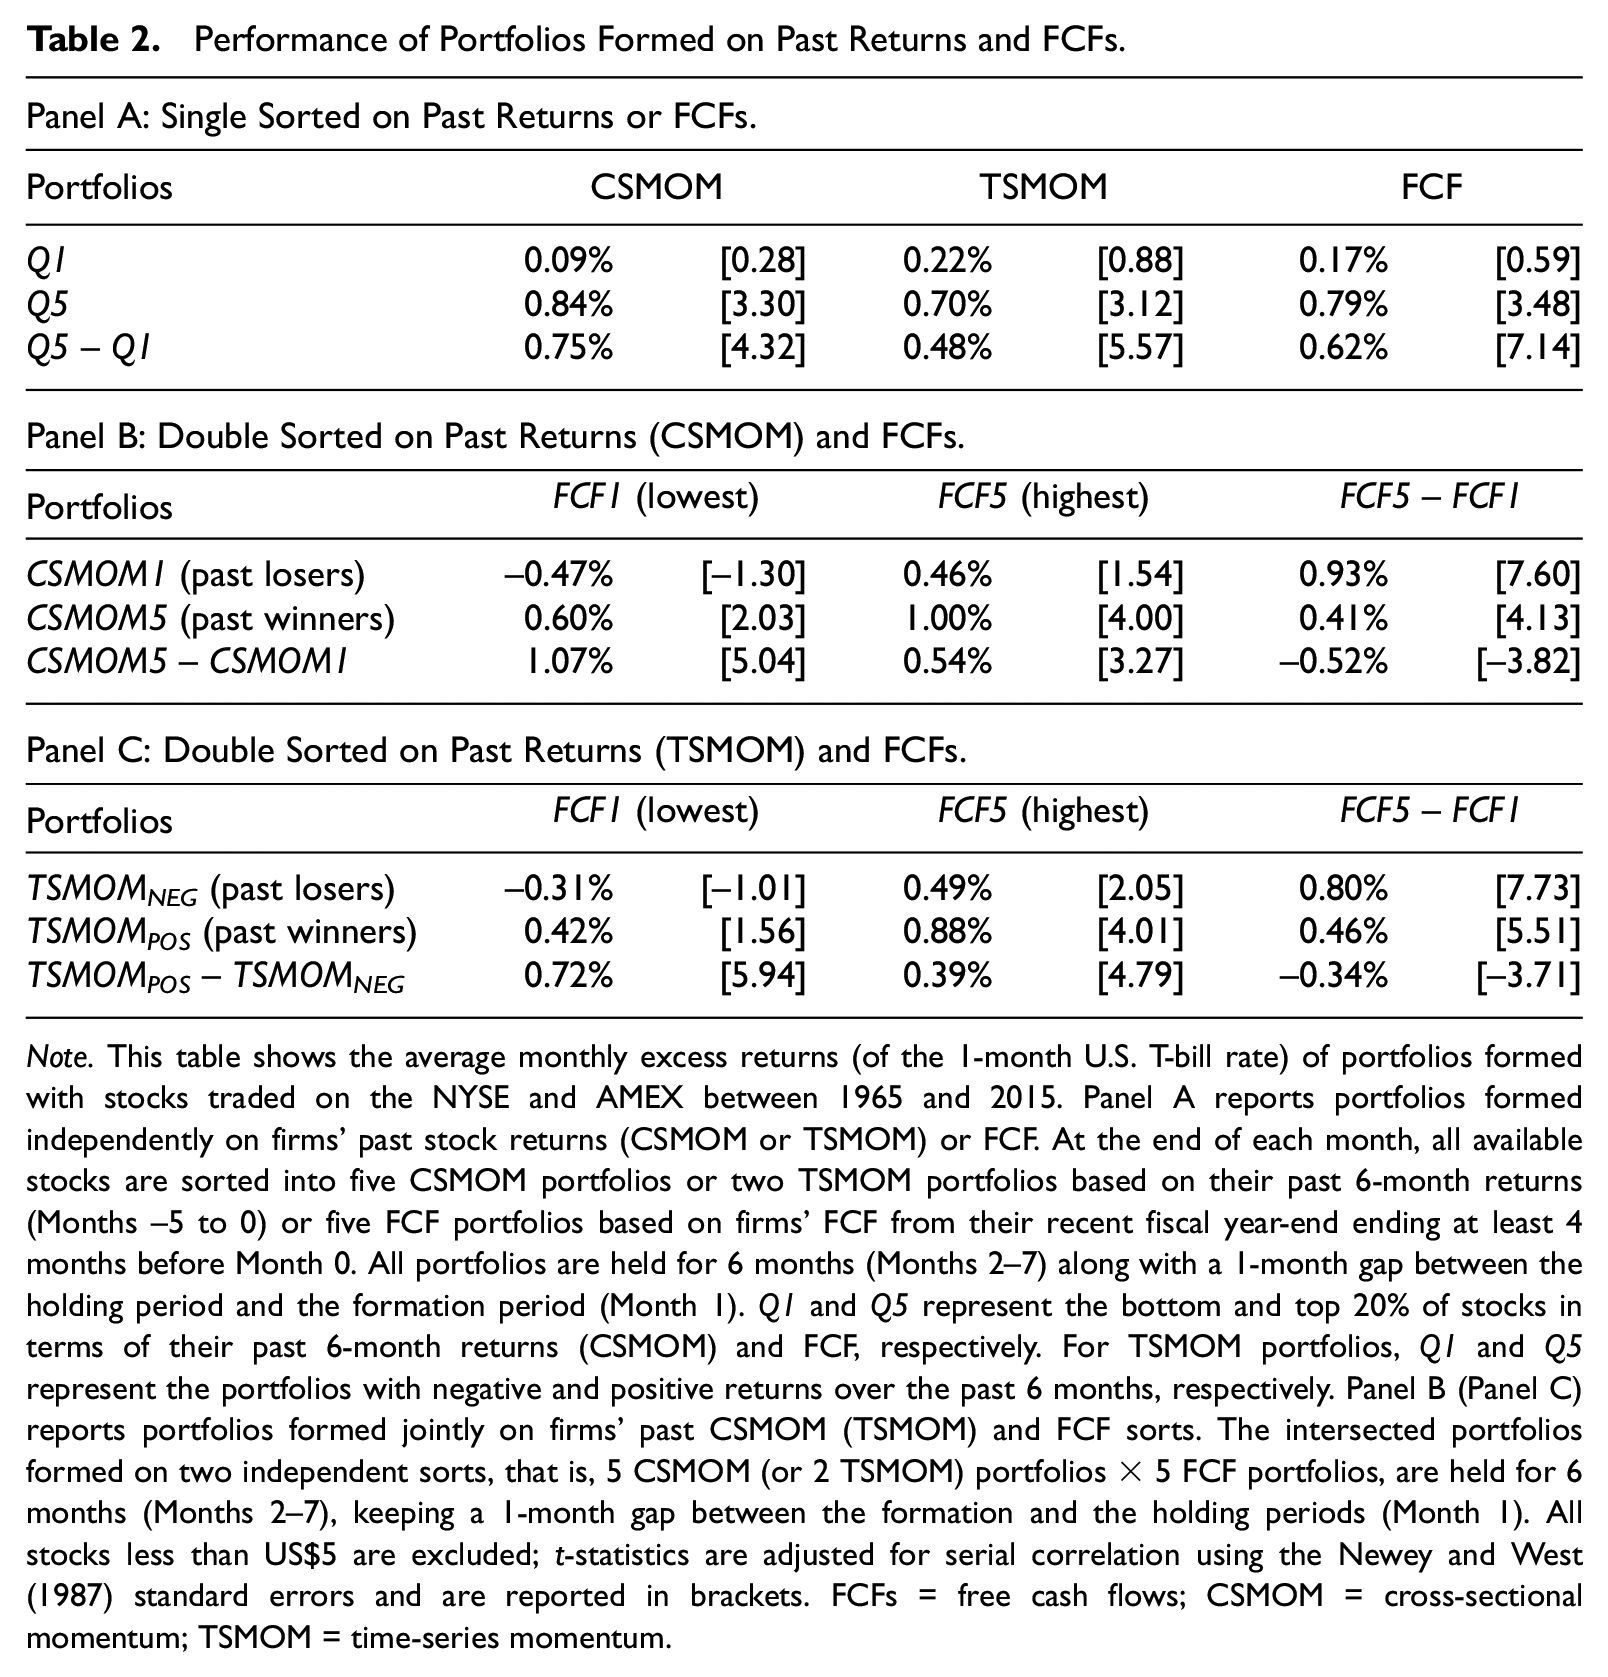
Note. This table shows the average monthly excess returns (of the 1-month U.S. T-bill rate) of portfolios formed with stocks traded on the NYSE and AMEX between 1965 and 2015. Panel A reports portfolios formed independently on firms’ past stock returns (CSMOM or TSMOM) or FCF. At the end of each month, all available stocks are sorted into five CSMOM portfolios or two TSMOM portfolios based on their past 6-month returns (Months −5 to 0) or five FCF portfolios based on firms’ FCF from their recent fiscal year-end ending at least 4 months before Month 0. All portfolios are held for 6 months (Months 2–7) along with a 1-month gap between the holding period and the formation period (Month 1). Q1 and Q5 represent the bottom and top 20% of stocks in terms of their past 6-month returns (CSMOM) and FCF, respectively. For TSMOM portfolios, Q1 and Q5 represent the portfolios with negative and positive returns over the past 6 months, respectively. Panel B (Panel C) reports portfolios formed jointly on firms’ past CSMOM (TSMOM) and FCF sorts. The intersected portfolios formed on two independent sorts, that is, 5 CSMOM (or 2 TSMOM) portfolios × 5 FCF portfolios, are held for 6 months (Months 2–7), keeping a 1-month gap between the formation and the holding periods (Month 1). All stocks less than US$5 are excluded; t-statistics are adjusted for serial correlation using the Newey and West (1987) standard errors and are reported in brackets. FCFs = free cash flows; CSMOM = cross-sectional momentum; TSMOM = time-series momentum.
To investigate whether the momentum effect dominates FCFs in predicting future returns (i.e., whether firms’ fundamental information from operating FCFs has any distinctive and incremental effects over the price momentum), we double sort stocks based on their past returns and FCF. Two key results emerge from Panels B and C that report portfolio returns based on a two-way sorting. First, focusing on the monthly performance of stand-alone and intersection portfolios formed on CSMOM (TSMOM) and FCF, we observe that high FCF stocks continuously outperform low FCF stocks in both past loser and past winner portfolios. Similarly, both CSMOM and TSMOM strategies yield positive excess returns in low and high FCF groups. This outcome indicates that neither the momentum effect nor the FCF effect can be subsumed by the other, suggesting that FCF and price momentum each contain unique and unpriced information. Second, a combination of low past returns (CSMOM1 or TSMOMNEG) and low FCF (FCF1) disseminate strong negative signals to investors and market participants (–0.47% per month for FCF1×CSMOM1 and −0.31% for FCF1×TSMOMNEG). Similarly, stocks with high past returns (CSMOM5 or TSMOMPOS) and high FCF (FCF5) experience the highest subsequent returns among all four intersection portfolios (1.00% per month for FCF5×CSMOM5 and 0.39% for FCF5×TSMOMPOS). In brief, the more desirable recent performance in stock returns, together with optimistic fundamental data, delivers strong positive buying signals to the markets.
Although neither the momentum effect nor the FCF effect can be subsumed by the other, low FCF stocks generate 0.52% (0.34%) higher CSMOM (TSMOM) returns than high FCF stocks. The greater CSMOM and TSMOM payoffs in the low FCF group are mainly due to the significant underperformance in the portfolio of past losers with poor corporate fundamental data (FCF1). In accordance with the findings of Hong and Stein (1999), this phenomenon may occur due to slow information diffusions. One possible explanation for this situation could be that investors are more reluctant to realize losses or have restrictions on building up a short position to gain profits on negative signals. Meanwhile, firms may avoid communicating bad news explicitly, which subsequently exacerbates market underreaction.
In sum, Table 2 provides evidence indicating that firms’ FCFs contain incremental information that cannot be entirely recognized by the price momentum. Low FCF stocks generate higher price momentum payoffs than the corresponding high FCF stocks. Among the four intersection portfolios, past losers with low cash flows (CSMOM1×FCF1 or TSMOMNEG×FCF1) suffer the worst performance during the holding period, while past winners with high cash flows (CSMOM5×FCF5 or TSMOMPOS×FCF5) experience the best subsequent performance.
In Table 3, we run a series of tests to examine the robustness of the baseline results. In Panel A, we replace the equal-weighted monthly raw returns with the value-weighted returns and then estimate the portfolio performance and their differences. Results are quantitatively similar to those tabulated in Table 2 in that the momentum profits are concentrated in low FCF stocks. Meanwhile, the FCF effect also cannot be explained by the momentum effect and remains prominent. In Panel B, we estimate the performance of four intersection portfolios based on 10 CSMOM (or two TSMOM) portfolios and three FCF portfolios. In light of the finer partitions of CSMOM portfolios, the momentum effect becomes more sizable among FCF portfolios (e.g., 1.36% and 0.71% CSMOM returns for low and high FCF stocks, respectively) in comparison with the 5 × 5 portfolios. The FCF effect remains strong despite the stronger price momentum effect.
Robustness Tests: Alternative Portfolio Construction.
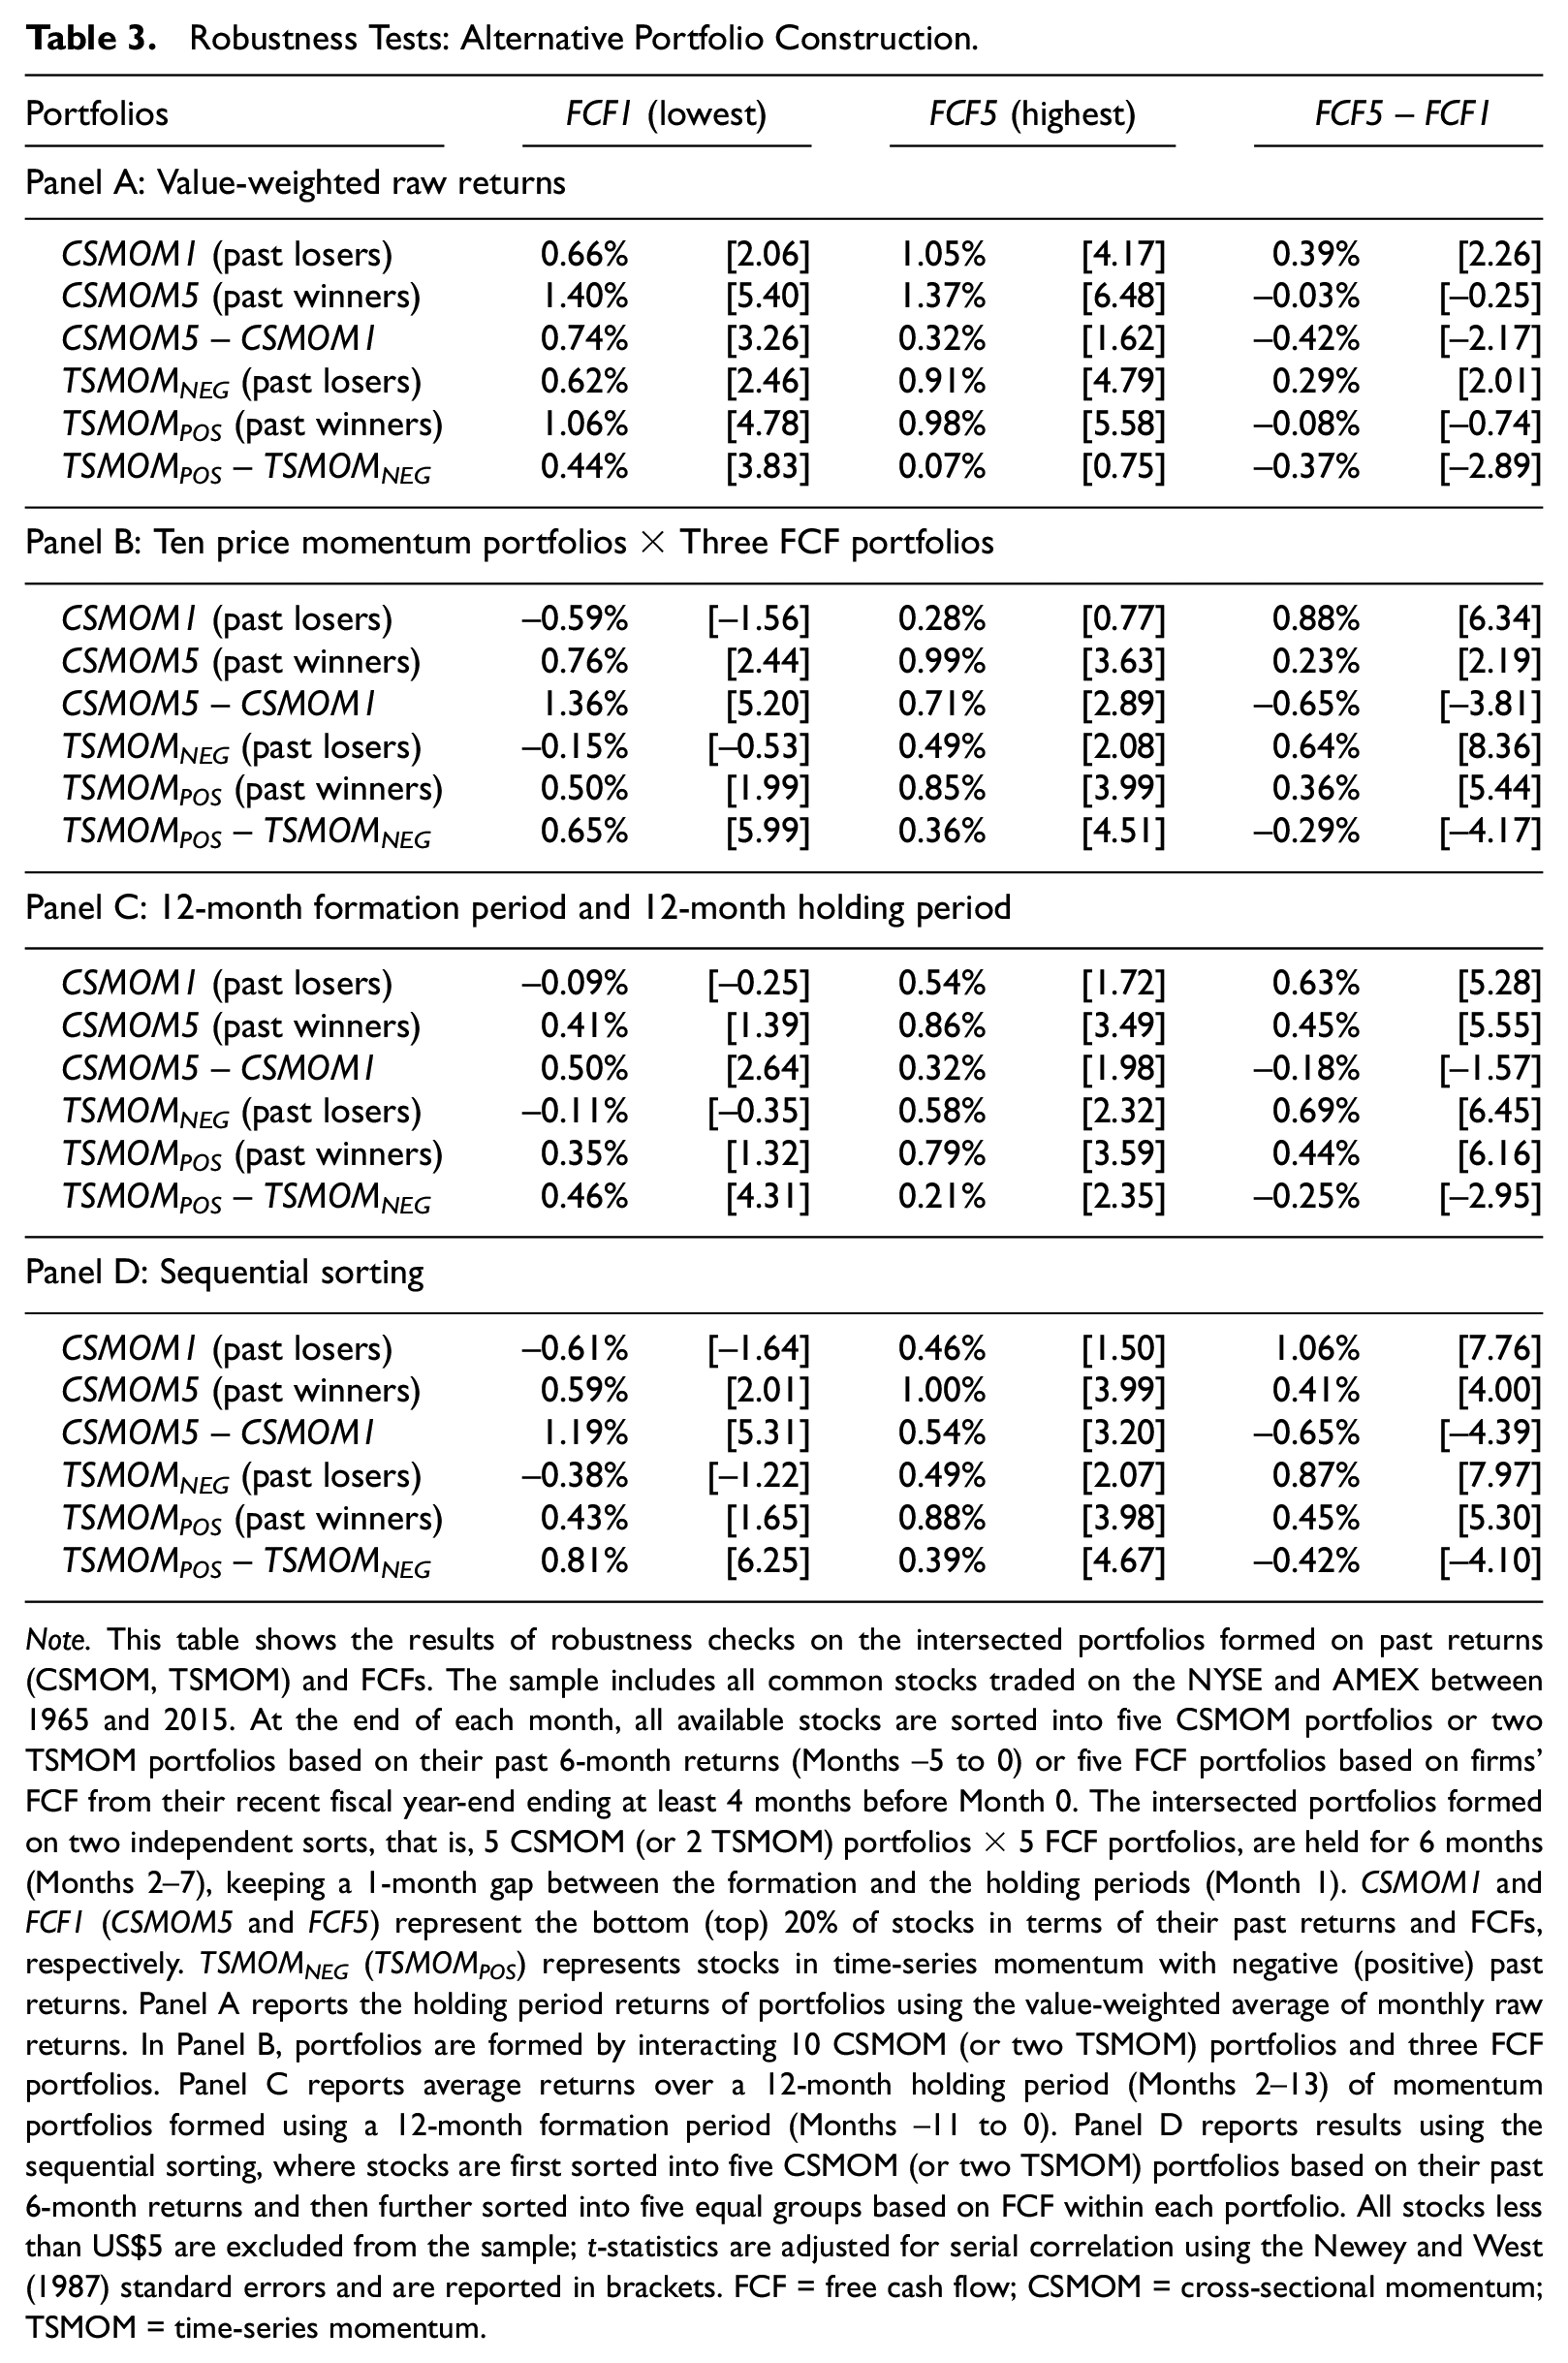
Note. This table shows the results of robustness checks on the intersected portfolios formed on past returns (CSMOM, TSMOM) and FCFs. The sample includes all common stocks traded on the NYSE and AMEX between 1965 and 2015. At the end of each month, all available stocks are sorted into five CSMOM portfolios or two TSMOM portfolios based on their past 6-month returns (Months −5 to 0) or five FCF portfolios based on firms’ FCF from their recent fiscal year-end ending at least 4 months before Month 0. The intersected portfolios formed on two independent sorts, that is, 5 CSMOM (or 2 TSMOM) portfolios × 5 FCF portfolios, are held for 6 months (Months 2–7), keeping a 1-month gap between the formation and the holding periods (Month 1). CSMOM1 and FCF1 (CSMOM5 and FCF5) represent the bottom (top) 20% of stocks in terms of their past returns and FCFs, respectively. TSMOMNEG (TSMOMPOS) represents stocks in time-series momentum with negative (positive) past returns. Panel A reports the holding period returns of portfolios using the value-weighted average of monthly raw returns. In Panel B, portfolios are formed by interacting 10 CSMOM (or two TSMOM) portfolios and three FCF portfolios. Panel C reports average returns over a 12-month holding period (Months 2–13) of momentum portfolios formed using a 12-month formation period (Months −11 to 0). Panel D reports results using the sequential sorting, where stocks are first sorted into five CSMOM (or two TSMOM) portfolios based on their past 6-month returns and then further sorted into five equal groups based on FCF within each portfolio. All stocks less than US$5 are excluded from the sample; t-statistics are adjusted for serial correlation using the Newey and West (1987) standard errors and are reported in brackets. FCF = free cash flow; CSMOM = cross-sectional momentum; TSMOM = time-series momentum.
In Panel C, we investigate the performance of portfolios using a longer window for the formation and holding periods. Specifically, we extend both periods to 12 months and find that the baseline patterns remain robust. Similar to the findings of previous studies (e.g., Jegadeesh & Titman, 1993; Lee & Swaminathan, 2000), the momentum payoff is less pronounced using longer holding periods. In Panel D, we replace the independent double sorting with the sequential double sorting, in which we first sort all stocks on past 6-month returns into five CSMOM portfolios (or two TSMOM portfolios) and, within each quintile, we then sort stocks based on their latest FCF into further quintiles. Our results are not affected by the alternative double sorting technique.
Cross-Sectional Regressions
We use Fama–MacBeth cross-sectional regressions as another way to disentangle the momentum and cash flow effects (Fama & MacBeth, 1973). Following Fama and MacBeth (1973) and Novy-Marx (2012), we include firm size (lnME) and book-to-market (lnBM) in regressions as “catch-all” variables for controlling other influences on the cross-section of stock returns. We also control for accruals, volume, and idiosyncratic volatility (IVOL), which have been documented in prior research as return predictors. Recent research demonstrates that investment and external financing affect expected stock returns (Fama & French, 2015; Hou et al., 2015; Penman & Zhu, 2022). Therefore, we further include investment and external financing variables in Table 4 as controls. 10
Fama–MacBeth Regressions.
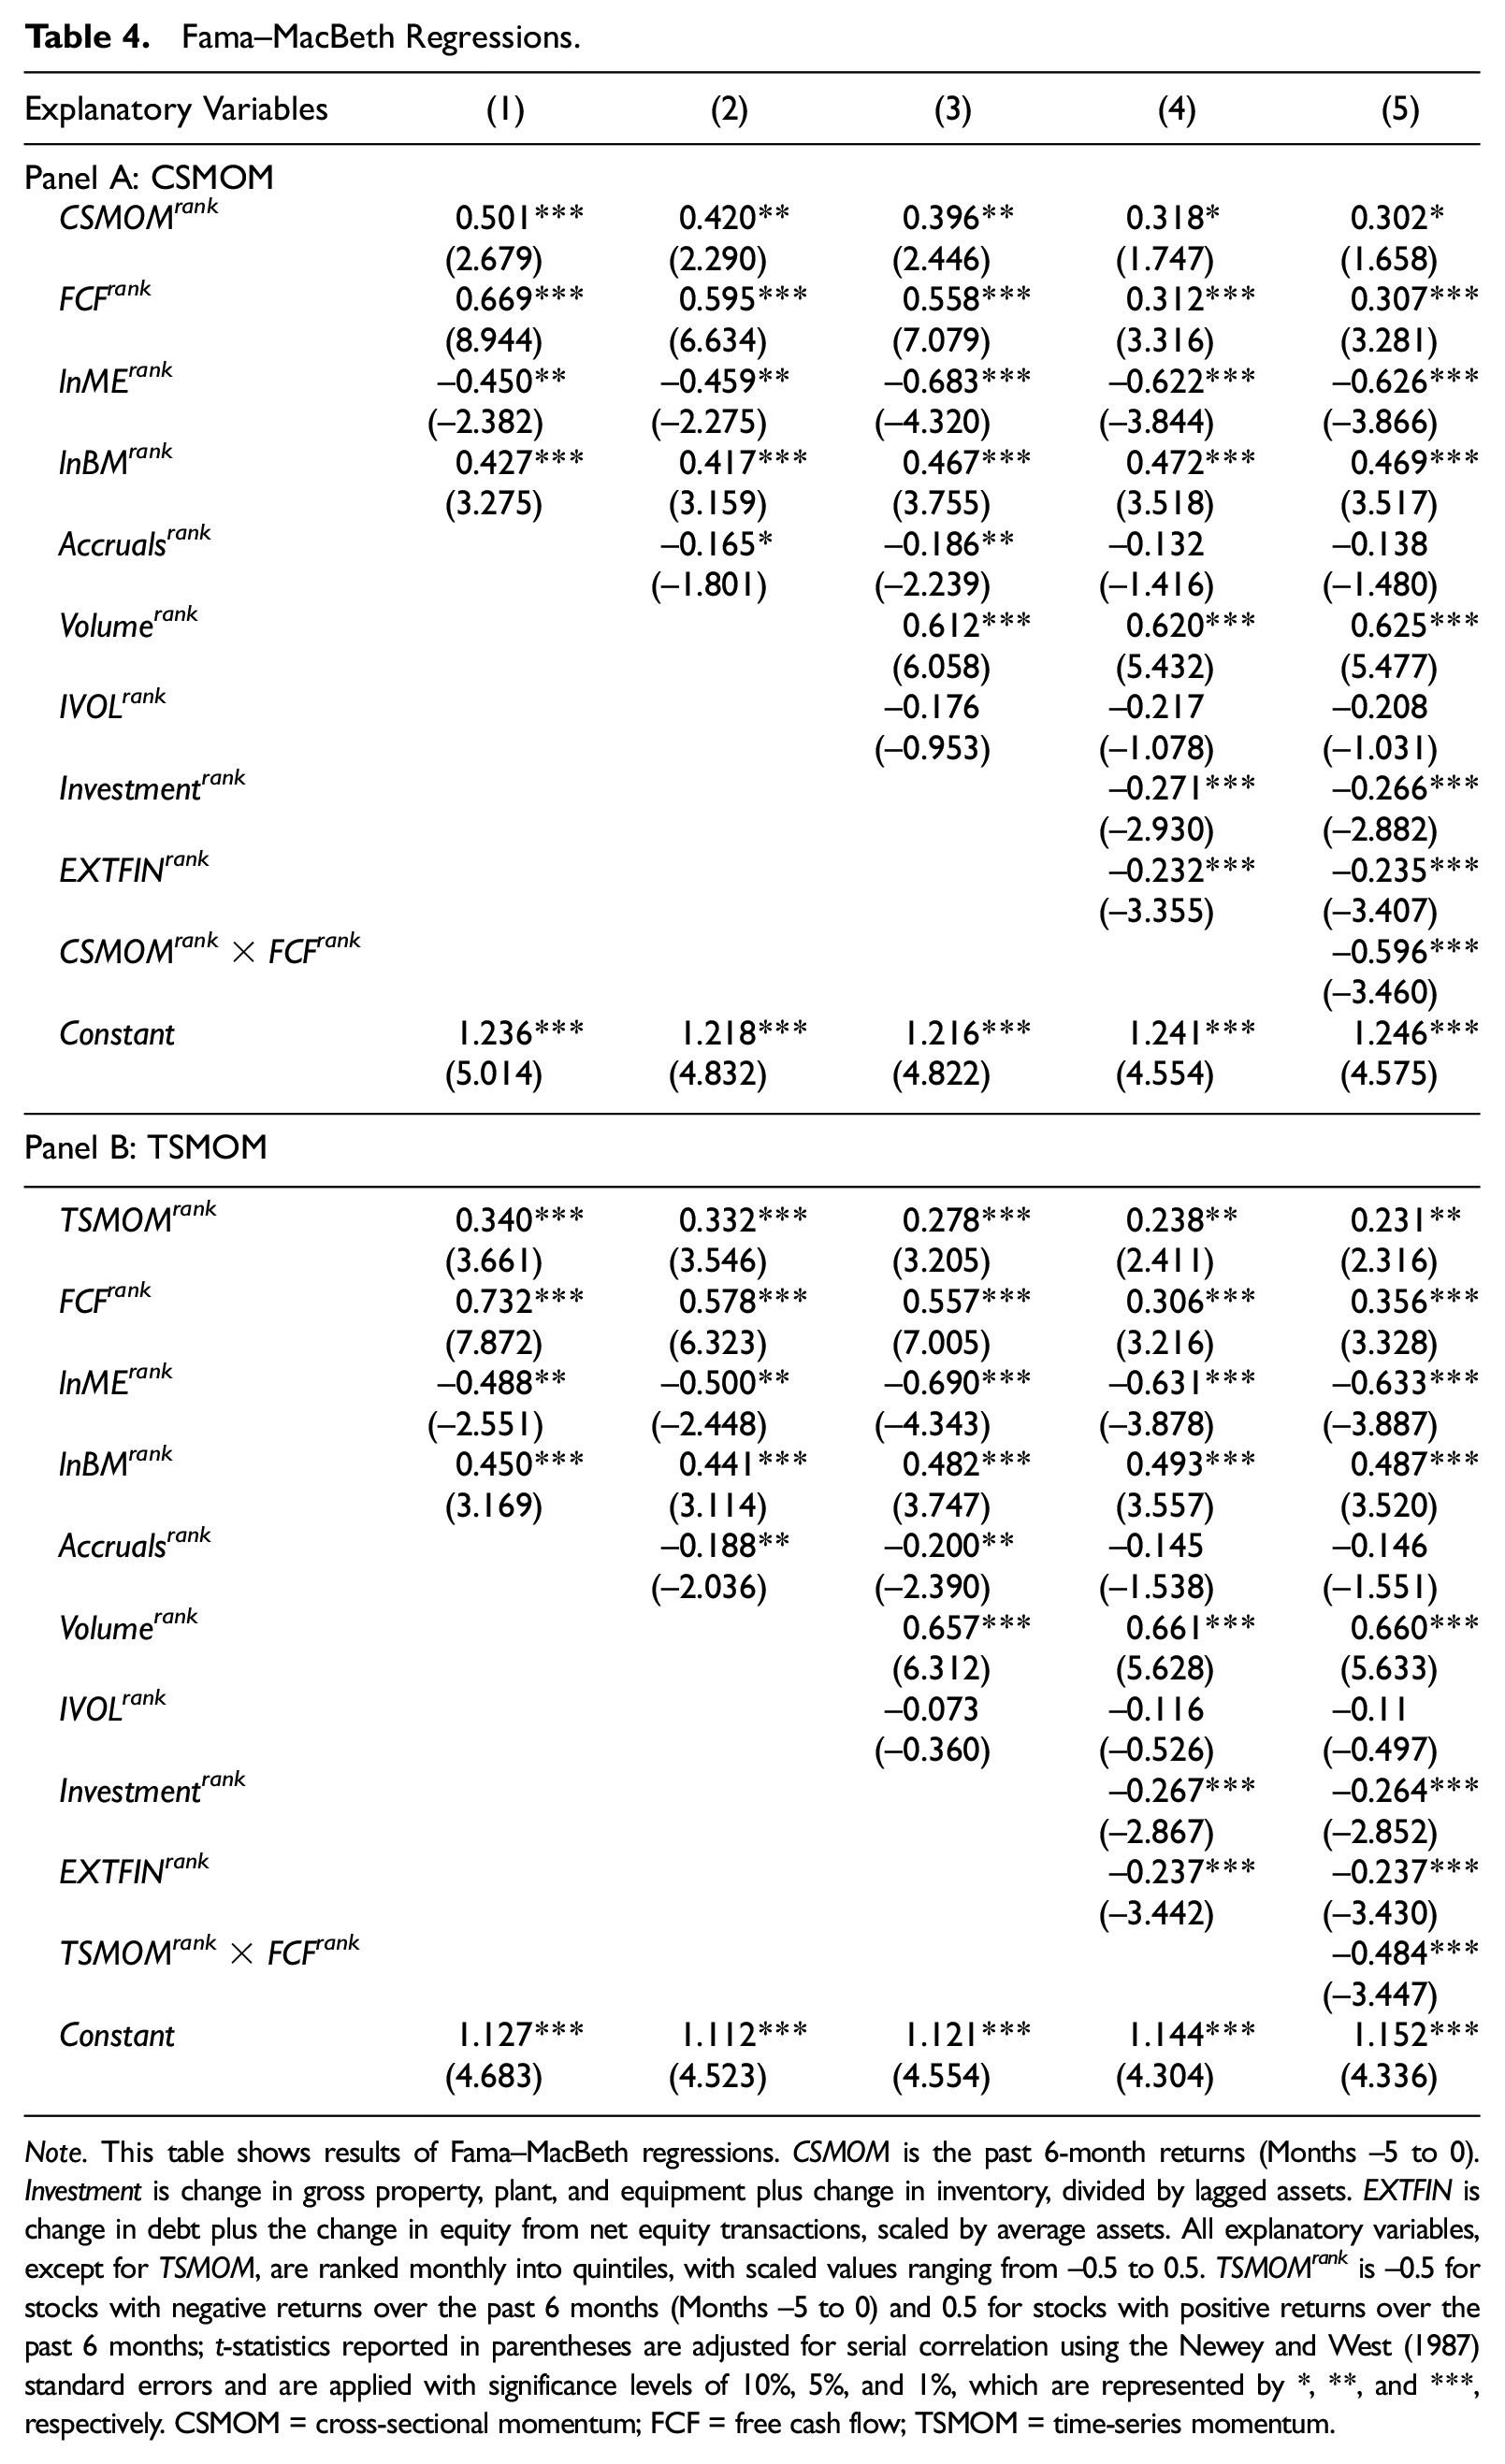
Note. This table shows results of Fama–MacBeth regressions. CSMOM is the past 6-month returns (Months −5 to 0). Investment is change in gross property, plant, and equipment plus change in inventory, divided by lagged assets. EXTFIN is change in debt plus the change in equity from net equity transactions, scaled by average assets. All explanatory variables, except for TSMOM, are ranked monthly into quintiles, with scaled values ranging from −0.5 to 0.5. TSMOM rank is −0.5 for stocks with negative returns over the past 6 months (Months −5 to 0) and 0.5 for stocks with positive returns over the past 6 months; t-statistics reported in parentheses are adjusted for serial correlation using the Newey and West (1987) standard errors and are applied with significance levels of 10%, 5%, and 1%, which are represented by *, **, and ***, respectively. CSMOM = cross-sectional momentum; FCF = free cash flow; TSMOM = time-series momentum.
Regression results are reported in Table 4. We employ rank models to control for the potential nonlinearity and outlier effects (Cheng & Thomas, 2006; Gu & Wu, 2020; Shi & Zhang, 2012). All explanatory variables, except for TSMOM, are ranked into quintiles each month. All quintile ranks are then scaled with values ranging from −0.5 to 0.5. TSMOM, by definition, assigns stocks with positive and negative returns over the past 6 months to the winner and loser portfolios. TSMOM rank takes a value of 0.5 for stocks in the winner portfolios and −0.5 for stocks in the loser portfolios.
The first column of Panel A shows that, over our sample period of 1965–2015, the coefficient on CSMOM rank and FCF rank is 0.501% and 0.669%, respectively (significant at the 1% level). This result provides strong support that CSMOM does not subsume FCF in predicting future returns, especially because the effects of size and book-to-market on returns are addressed. This result holds in Columns (2) to (4) after controlling for accruals, volume, IVOL, investment, and external financing. In Column (5), we further include the interaction term (CSMOM rank ×FCF rank ). Consistent with results reported in the portfolio analysis (Table 2), the negative coefficient on CSMOM rank ×FCF rank indicates that the momentum effect is stronger in low cash flow stocks. We repeat the analyses in Panel B by replacing CSMOM rank with TSMOM rank and find similar results.
Overall, the results of Fama–MacBeth regressions are consistent with the two-way portfolio analysis of price momentum and FCF, supporting the predictions that FCFs contain incremental information in terms of stock returns predictive power not fully captured by the price momentum.
Performance of Enhanced Momentum Strategies
In Table 2, we observe that, in both CSMOM and TSMOM portfolios, past loser and past winner portfolios experience decreased returns among low FCF firms compared with high FCF firms, consistent with the slow information diffusion explanation. Apparently, investors’ failure to appreciate negative news exacerbates the payoff of shorting past loser portfolios, contributing to the greater momentum payoffs among low FCF firms.
To further demonstrate the economic benefits of employing firms’ fundamental information in momentum trading, we take past losers and low FCFs as a joint selling signal and, oppositely, past winners and high cash flows as a joint buying signal. We then propose new enhanced momentum strategies following the combined signal from past returns and FCFs. For example, in the FCF-based CSMOM strategy, we take a long position in the winner portfolio (CSMOM5) with high FCF (FCF5) and a short position in the loser portfolio (CSMOM1) with low FCF (FCF1), and then hold this zero-investment portfolio (CSMOM5×FCF5 minus CSMOM1×FCF1) for 6 months over the holding period.
We report the monthly returns of the enhanced momentum strategies in Table 5 and compare their performance with the simple price momentum strategy. In general, our new trading strategy, taking the corporate fundamental cash flow information into account in the technical analysis of historical returns, outperforms the traditional momentum strategy based solely on past returns. For example, we find that our FCF-based CSMOM strategy (CSMOM + FCF) generates about 0.72% excess returns per month higher than what the simple momentum strategy can achieve. Similarly, the FCF-based TSMOM yields 0.71% additional returns per month compared with the profits from the stand-alone TSMOM strategy.
Traditional Momentum Versus FCF-Enhanced Momentum.
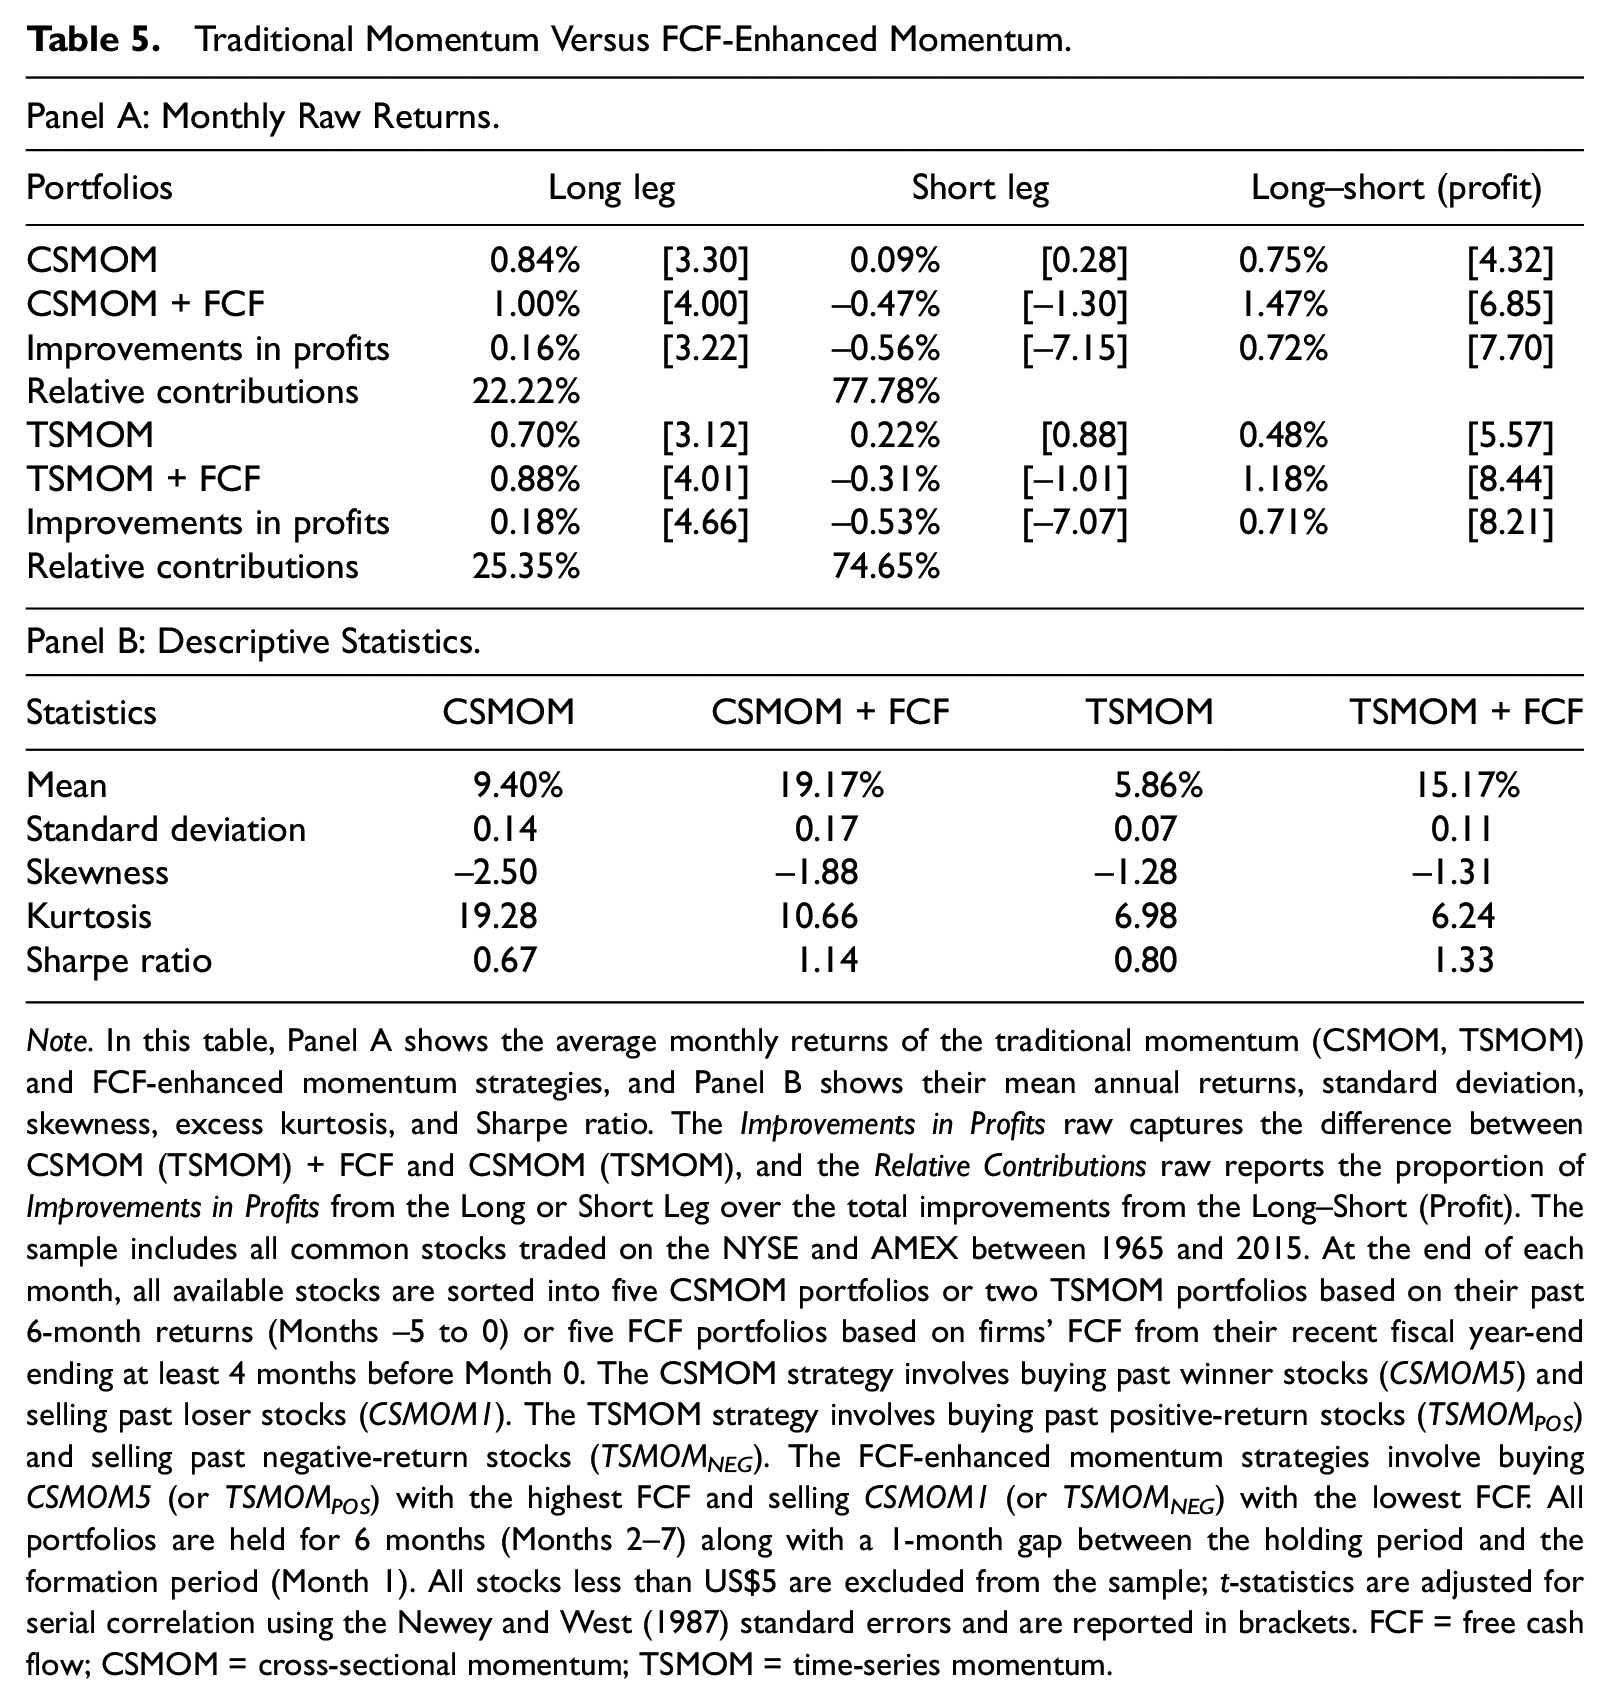
Note. In this table, Panel A shows the average monthly returns of the traditional momentum (CSMOM, TSMOM) and FCF-enhanced momentum strategies, and Panel B shows their mean annual returns, standard deviation, skewness, excess kurtosis, and Sharpe ratio. The Improvements in Profits raw captures the difference between CSMOM (TSMOM) + FCF and CSMOM (TSMOM), and the Relative Contributions raw reports the proportion of Improvements in Profits from the Long or Short Leg over the total improvements from the Long–Short (Profit). The sample includes all common stocks traded on the NYSE and AMEX between 1965 and 2015. At the end of each month, all available stocks are sorted into five CSMOM portfolios or two TSMOM portfolios based on their past 6-month returns (Months −5 to 0) or five FCF portfolios based on firms’ FCF from their recent fiscal year-end ending at least 4 months before Month 0. The CSMOM strategy involves buying past winner stocks (CSMOM5) and selling past loser stocks (CSMOM1). The TSMOM strategy involves buying past positive-return stocks (TSMOMPOS) and selling past negative-return stocks (TSMOMNEG). The FCF-enhanced momentum strategies involve buying CSMOM5 (or TSMOMPOS) with the highest FCF and selling CSMOM1 (or TSMOMNEG) with the lowest FCF. All portfolios are held for 6 months (Months 2–7) along with a 1-month gap between the holding period and the formation period (Month 1). All stocks less than US$5 are excluded from the sample; t-statistics are adjusted for serial correlation using the Newey and West (1987) standard errors and are reported in brackets. FCF = free cash flow; CSMOM = cross-sectional momentum; TSMOM = time-series momentum.
We also examine the relative contribution of excess returns from the long and short legs to understand the source of the improved profitability of the enhanced momentum strategy. 11 Our results indicate that the improved payoffs derive mainly from the short leg. This result holds for both the CSMOM + FCF strategy and the TSMOM + FCF strategy. Specifically, 77.78% of the improved returns from the FCF-based CSMOM strategy come from the short leg. Similarly, the relative contribution of the improved returns from the short leg is 74.65% when comparing profits from the FCF-based TSMOM strategy with the stand-alone TSMOM strategy. To investigate whether value weighting versus equal weighting affects the return patterns from the long and short legs of the trading strategies, we repeat the test in Table 5 using value-weighted returns. Consistent with the equal weighting results, we find that the main source of the improved payoffs of the enhanced momentum strategies mainly comes from the short leg. 12
Barroso and Santa-Clara (2015) and T. Daniel and Moskowitz (2016) document that the returns distribution of the momentum strategy has significantly negative skewness and high excess kurtosis, which leads to occasional large crashes (e.g., a crash of −62.51% from March to May 2009). Our enhanced CSMOM strategy with fundamental cash flow components experiences a less negative skewness (–1.88) and a greater Sharpe ratio (1.14) in comparison with the simple CSMOM strategy (i.e., –2.50 for skewness and 0.67 for the Sharpe ratio).
We further conduct a series of sensitivity tests to examine whether the improved performance following our enhanced strategies is subject to the commonly documented time-series factors that may affect the performance of the price momentum strategy. First, investor sentiment may play an important role in explaining the performance. Stambaugh et al. (2012) and Antoniou et al. (2013), who argue that sentiment-driven investors can cause market mispricing, show that momentum trading strategies are more profitable following high levels of sentiment as the price anomaly is stronger corresponding to high sentiment. Our results in Panels A and B of Table 6 lend support to this sentiment argument. Investor sentiment is measured by (a) the monthly market-based sentiment index constructed by Baker and Wurgler (2006) in Panel A and (b) the University of Michigan’s consumer sentiment index in Panel B. We find greater momentum gains following periods of positive investor sentiment compared with negative sentiment periods. We describe results in Panel A for brevity. For example, our enhanced CSMOM (TSMOM) strategies, on average, improve the performance of price momentum by about 0.88% (0.84%) per month following positive sentiment and by about 0.55% (0.59%) per month following negative sentiment. 13
Sensitivity Tests of FCF-Enhanced Momentum Strategies to Time-Series Variation.
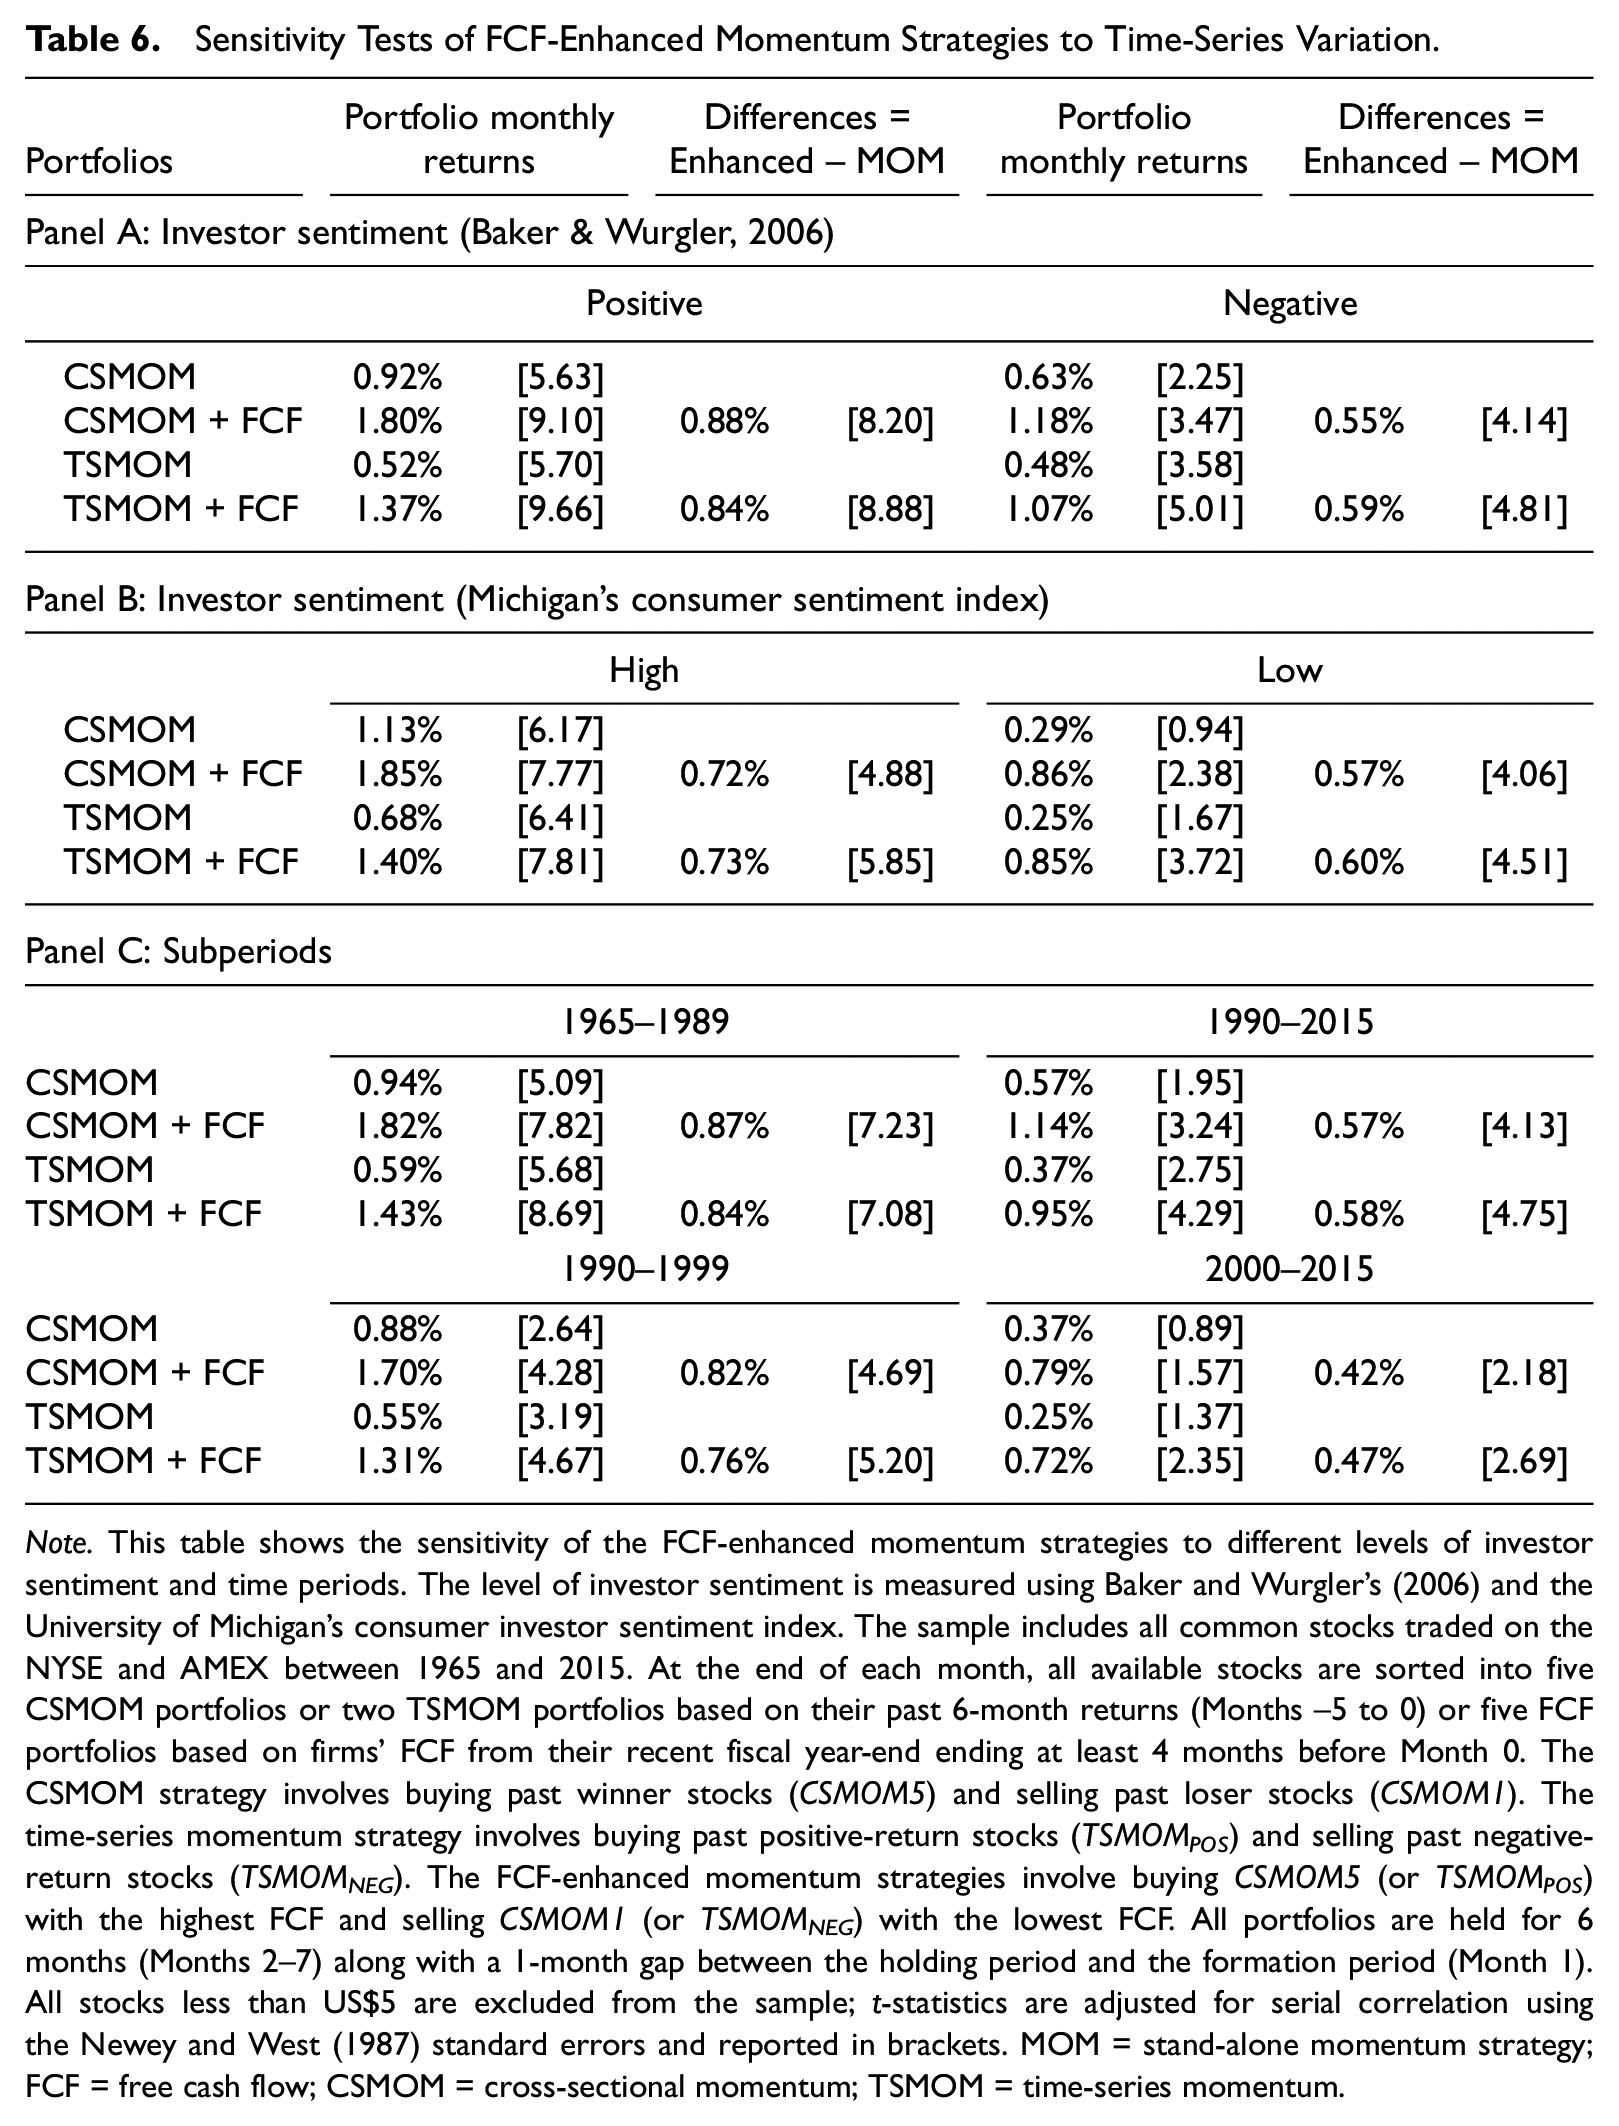
Note. This table shows the sensitivity of the FCF-enhanced momentum strategies to different levels of investor sentiment and time periods. The level of investor sentiment is measured using Baker and Wurgler’s (2006) and the University of Michigan’s consumer investor sentiment index. The sample includes all common stocks traded on the NYSE and AMEX between 1965 and 2015. At the end of each month, all available stocks are sorted into five CSMOM portfolios or two TSMOM portfolios based on their past 6-month returns (Months −5 to 0) or five FCF portfolios based on firms’ FCF from their recent fiscal year-end ending at least 4 months before Month 0. The CSMOM strategy involves buying past winner stocks (CSMOM5) and selling past loser stocks (CSMOM1). The time-series momentum strategy involves buying past positive-return stocks (TSMOMPOS) and selling past negative-return stocks (TSMOMNEG). The FCF-enhanced momentum strategies involve buying CSMOM5 (or TSMOMPOS) with the highest FCF and selling CSMOM1 (or TSMOMNEG) with the lowest FCF. All portfolios are held for 6 months (Months 2–7) along with a 1-month gap between the holding period and the formation period (Month 1). All stocks less than US$5 are excluded from the sample; t-statistics are adjusted for serial correlation using the Newey and West (1987) standard errors and reported in brackets. MOM = stand-alone momentum strategy; FCF = free cash flow; CSMOM = cross-sectional momentum; TSMOM = time-series momentum.
Second, we test whether the superior performance of the enhanced momentum strategy is sensitive to sample periods. The disappearance of momentum gains after the 1990s has attracted significant discussion (e.g., Barroso & Santa-Clara, 2015; T. Daniel & Moskowitz, 2016; Hwang & Rubesam, 2015; McLean & Pontiff, 2016). We find corroborating results that the persistent gains for both CSMOM and TSMOM have declined considerably over the last two decades. We divide the whole sample into two subperiods (i.e., 1965–1989 and 1990–2015), and the second subperiod is further broken down into two shorter subperiods (i.e., 1990–1999 and 2000–2015). 14 As presented in Panel C of Table 6, the pure price momentum strategy generates significantly less positive returns after 1990, and the positive gain even disappears during 2000–2015. However, our enhanced strategies boost the performance of the traditional momentum strategy, evidenced by the remained strong positive profits after 1990 (CSMOM + FCF returns = 1.14%, t-value = 3.24; TSMOM + FCF returns = 0.95%, t-value = 4.29).
Overall, our enhanced momentum strategies appear to be robust in terms of improving the performance of the traditional price momentum strategy.
Decomposition of FCFs
As argued by Dechow et al. (2008), retained cash shows less persistency compared with the distribution parts to equity and debt holders. Hence, the subcomponents of FCFs may play different roles in predicting future returns. To further investigate the price impact of individual components within the FCF, we decompose FCFs into changes in the annual cash balance
Portfolios Formed on Past Returns and Further Decomposed FCFs.
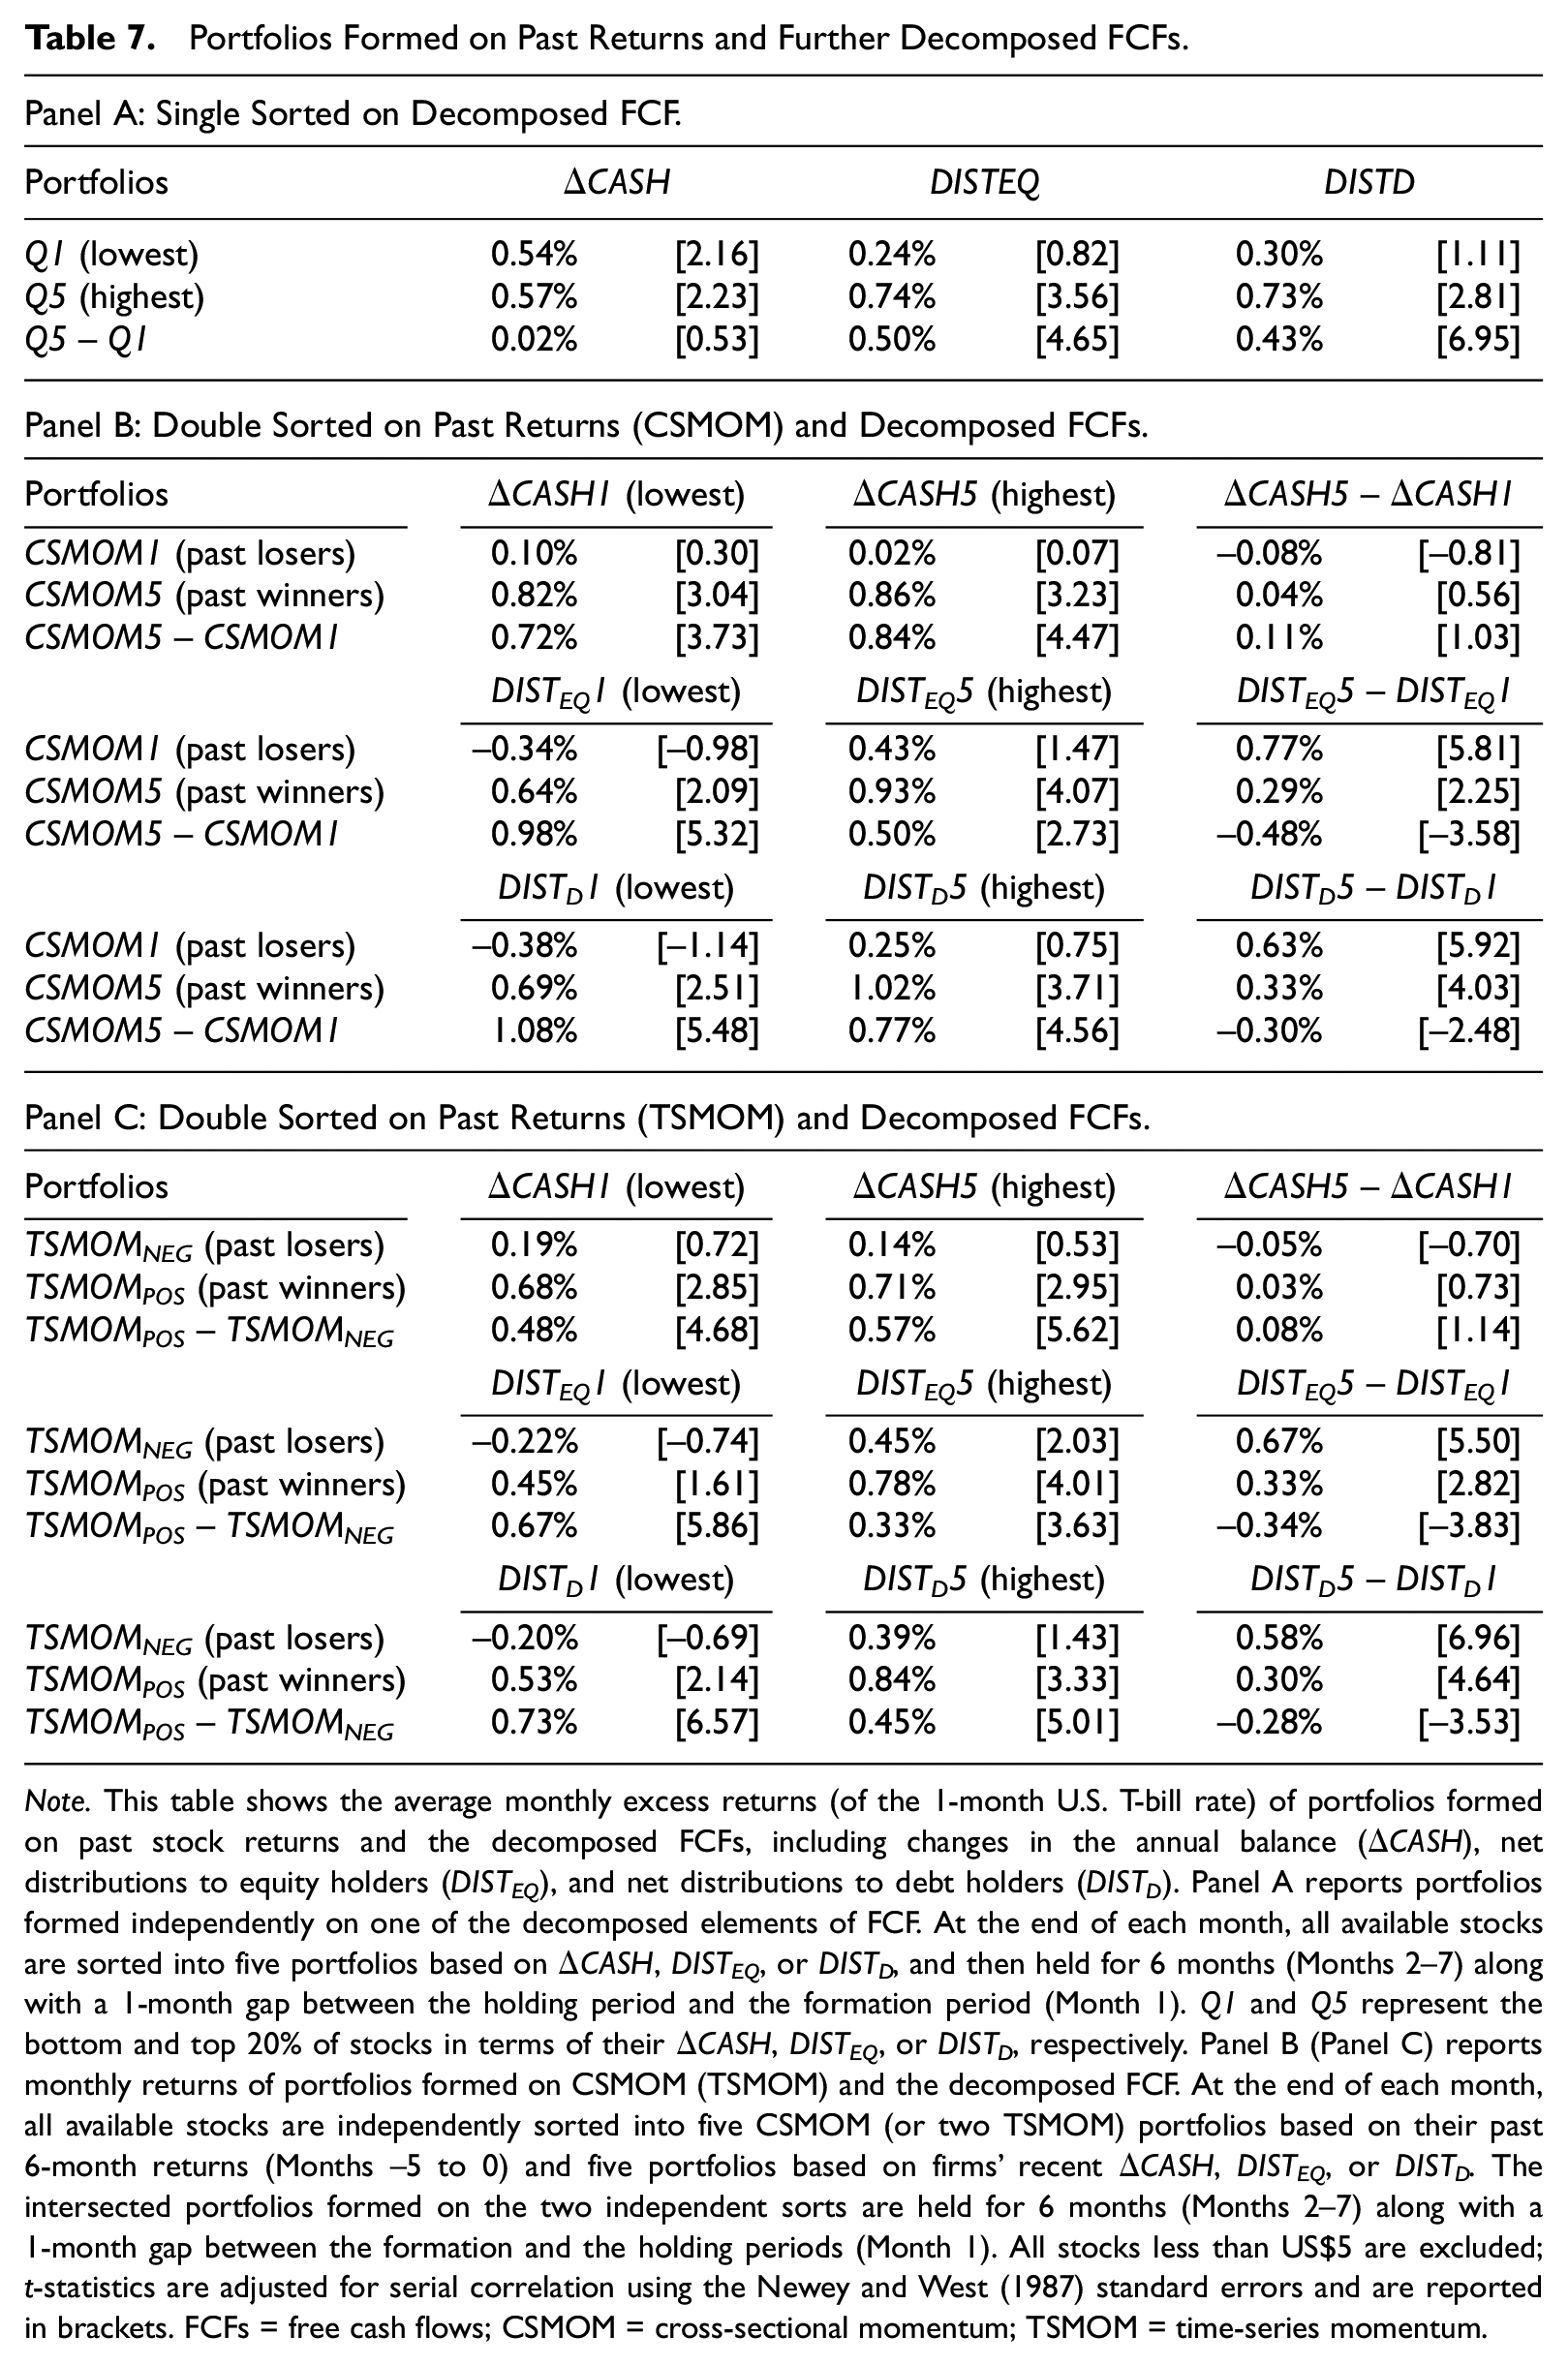
Note. This table shows the average monthly excess returns (of the 1-month U.S. T-bill rate) of portfolios formed on past stock returns and the decomposed FCFs, including changes in the annual balance (ΔCASH), net distributions to equity holders (DISTEQ), and net distributions to debt holders (DISTD). Panel A reports portfolios formed independently on one of the decomposed elements of FCF. At the end of each month, all available stocks are sorted into five portfolios based on ΔCASH, DISTEQ, or DISTD, and then held for 6 months (Months 2–7) along with a 1-month gap between the holding period and the formation period (Month 1). Q1 and Q5 represent the bottom and top 20% of stocks in terms of their ΔCASH, DISTEQ, or DISTD, respectively. Panel B (Panel C) reports monthly returns of portfolios formed on CSMOM (TSMOM) and the decomposed FCF. At the end of each month, all available stocks are independently sorted into five CSMOM (or two TSMOM) portfolios based on their past 6-month returns (Months −5 to 0) and five portfolios based on firms’ recent ΔCASH, DISTEQ, or DISTD. The intersected portfolios formed on the two independent sorts are held for 6 months (Months 2–7) along with a 1-month gap between the formation and the holding periods (Month 1). All stocks less than US$5 are excluded; t-statistics are adjusted for serial correlation using the Newey and West (1987) standard errors and are reported in brackets. FCFs = free cash flows; CSMOM = cross-sectional momentum; TSMOM = time-series momentum.
Further Analyses
To explore whether alternative explanations for the FCF mispricing may affect our main findings, we consider three nonmutually exclusive explanations: accrual anomaly, limits-to-arbitrage, and risks.
Enhanced Momentum and Accruals
S. Richardson et al. (2010) argued that failure to recognize the difference of persistence across various earnings components is a primary driver of the accounting anomalies. Firms with low FCFs are likely to be associated with high accruals. Therefore, the underpricing on FCFs may be attributable to investors’ overpricing on accruals. Gu and Wu (2000) document that price momentum is more pronounced for high accrual firms, especially for firms with high discretionary accruals. To eliminate the possibility that the incremental cash flow effect on price momentum arises from the accrual effects, we divide the whole sample into high and low accrual groups based on the (a) total accruals, (b) discretionary accruals, and (c) growth in net operating assets. 15 Online Appendix Table A1 reports the monthly returns of momentum and FCF-enhanced momentum portfolios for firms with high and low accruals. Our enhanced momentum strategies consistently outperform the simple momentum strategy in both high and low groups formed on three accrual-based measures. This outcome suggests that the accrual anomaly cannot fully explain the incremental role of FCFs in momentum effects.
Enhanced Momentum and Limits-to-Arbitrage
Limits-to-arbitrage are important reasons that stop arbitrageurs from taking trading positions to eliminate the anomalies (Ali et al., 2003; Arena et al., 2008; Lam & Wei, 2011). We, therefore, test the sensitivity of the improved performance of our enhanced momentum strategy to limits-to-arbitrage, measured by transaction costs (bid–ask spread, Amihud’s illiquidity, dollar trading volume, and institutional ownership) and arbitrage risk (idiosyncratic volatility) (Ali et al., 2003; Amihud, 2002; Huang et al., 2010; Lam & Wei, 2011). Variables’ definitions and the results are provided in Online Appendix Table A2. We first divide all stocks into high and low groups based on the above limits-to-arbitrage measures and then compare the performance of the enhanced trading strategy with the stand-alone price momentum strategy.
Consistent with prior research that attributes the momentum effect to the mispricing (e.g., Arena et al., 2008), we find greater payoffs of both the stand-alone and the enhanced momentum strategies in the group of high limits-to-arbitrage (i.e., high bid–ask spread, high Amihud’s illiquidity, low dollar trading volume, low institutional ownership, and high idiosyncratic volatility). We also find that the superior performance of our enhanced momentum strategy is not dominated by arbitrage constraints because the positive-return differences between the enhanced and the traditional momentum strategies remain significant in both high and low limit-to-arbitrage groups.
Enhanced Momentum and the Risk Explanation
To eliminate the possibility that risk explains the profits of the intersection portfolios and the improved performance of the enhanced momentum strategy, we repeat the portfolio analysis using returns adjusted by firm characteristics and returns estimated from different risk factor models. First, we use size-adjusted returns, size- and book-to-market-adjusted returns, and industry-adjusted returns. Panel A of Online Appendix Table A3 presents results for two-way sorts based on price momentum and FCF. We find that both the momentum and FCF effects continue to hold, and that the incremental effect of FCF to momentum payoffs remains significant. Panel B of Table A3 compares the returns from the enhanced momentum strategies with the returns from the stand-alone momentum strategies. We find that the performance differences are comparable with results in Table 5, where raw monthly returns are employed.
Second, we report the alphas for the intersection portfolios and the alphas for the momentum strategies estimated from six asset pricing models, including the Capital Asset Pricing Model (CAPM) model, Fama and French’s (1993) three-factor model, Fama and French’s (2015) five-factor model, a model with FF three factors plus the Pástor and Stambaugh’s (2003) liquidity factor, Carhart’s (1997) four-factor model, and Hou et al.’s (2015) q-factor model. 16 Results in Online Appendix Table A4 support our findings that the incremental effect of FCFs and the improved profitability of the FCF-based momentum strategies cannot be explained by the common risk factors. Panel A presents the alphas for the two-way sorting portfolios based on price momentum and FCF. Results show that momentum payoffs are consistently larger in low FCF stocks and that higher momentum payoffs in low FCF portfolios are mainly driven by large negative returns among past losers with low FCF (e.g., CSMOM1×FCF1). Panel B reports the alphas for the enhanced and the stand-alone momentum strategies. We find that the profitability improvement of the enhanced momentum strategies remains robust and prominent regardless of the set of risk factors employed. 17
Earnings Momentum, Price Momentum, and Cash Flow Effects
Finally, we examine the interplay among earnings momentum, price momentum, and the cash flow effect. 18 Results are presented in Online Appendix Table A5. We start by testing the association between earnings momentum and price momentum. We use earnings surprises (SUE) to construct portfolios of earnings momentum. Panel A provides evidence that price momentum is distinct from earnings momentum as one is not subsumed by the other.
Next, we investigate the role of FCFs in the relation between earnings momentum and price momentum. We partition our sample into high- and low-FCF groups and rerun the two-way sorting portfolio analyses. Panels B and C show that for firms with high FCF, both earnings momentum and price momentum demonstrate weaker portfolio returns. In contrast, the stronger earning and price momentum effects for low FCF stocks indicate that firms with low FCF contain unpriced information.
In addition, we extend the FF three factors with a mimic factor of earnings surprises (SUE factor) to test whether the price momentum and the FCF-enhanced momentum can be explained away by the SUE factor. Panels D and E report the estimated regression alpha. Results in Panel D show that the FCF effects, for both past loser and winner stocks, cannot be explained by the common risk factors and the added SUE factors. However, the positive performance of CSMOM and TSMOM disappears for stocks with high FCF when we control for the SUE factor, suggesting that the combined explanatory effect of FCFs and earnings surprises is prominent. Results in Panel E indicate that while the inclusion of the SUE factor has almost fully explained the traditional CSMOM and TSMOM, 19 the FCF-enhanced CSMOM and TSMOM strategies continue to present superior performance. Their differences with the stand-alone price momentum in terms of portfolio performance remain around 0.70% and are highly significant.
Additional Concerns
Does the rebalancing frequency affect our results?
Momentum strategies require monthly rebalancing of portfolios and their compositions. While past returns can easily be calculated at the monthly frequency, corporate fundamentals, such as FCF, are updated annually, meaning that the compositions of each FCF-sorted portfolio remain unchanged for a horizon of 12 months. How does this blend of monthly rebalancing and largely fixed portfolio composition mechanically affect our main results? We re-examine the performance of intersection portfolios formed on annually rebalanced price momentum and FCF portfolios. Results show that the FCF-enhanced momentum portfolios continue to generate sizable returns (1.02% for CSMOM + FCF and 0.93% for TSMOM + FCF per month) that significantly outperform the respective stand-alone price momentum, indicating that our results are robust to this alternative rebalancing frequency. 20
Excluding small firms or glamor stocks with extraordinary performance?
The FCF-based momentum strategies require buying past winners with high FCF and selling past losers with low FCF. As small firms tend to experience large negative returns and low FCF and glamor firms, such as FAANG (Facebook, Amazon, Apple, Netflix, and Google), often deliver extraordinary performance with high returns and FCF, our main results may be affected by the inclusions of these firms. To rule out the possibility that our results are driven by small firms or glamor firms, we repeat our main analyses—portfolios formed on past returns and FCF, Fama–MacBeth regressions, and FCF-enhanced momentum strategies—using (a) the sample that excludes firms below the bottom 20% of FF NYSE size breakpoint, and (b) the sample that excludes firms below the bottom 20% FF NYSE book-to-market breakpoint. We find robust results with both samples: (a) FCF and momentum effects generate positive portfolio returns, and neither of them is subsumed by the other; and (b) the FCF-enhanced CSMOM and TSMOM generate sizable positive monthly returns, which are also significantly higher than the traditional price momentum portfolios. 21
An alternative measure of FCF based on the statement of cash flows
We measure FCF as earnings less total accruals. While prior research has demonstrated some advantages of this balance sheet approach (Dechow et al., 2008; Hribar & Yehuda, 2015), items in the statement of cash flow provide an alternative way to measure FCF—operating cash flow minus capital expenditure, scaled by average total assets. As the statement of cash flow items are available in Compustat since 1987, we supplement the annual FCF using the balance sheet approach for pre-1987 information. We then repeat our main tests and find that our results are robust to this alternative measure of FCF. Our untabulated results show that the momentum strategy (CSMOM and TSMOM) and the FCF strategy yield significant profits after controlling for the other. The enhanced momentum strategy after incorporating FCF generates higher returns than the traditional momentum strategy.
Conclusion
This study focuses on the incremental value of FCFs to the traditional price momentum trading. We find that FCFs contain exclusive and unpriced information that can bring incremental value to the pure momentum trading strategies. Our follow-on proposed enhanced trading strategy, buying past winners with high FCFs and shorting past losers with low FCFs, generates better payoffs than the traditional momentum strategy. Further analysis shows that distributions to equity/debt holders—a component of FCFs with a high persistence level—contribute the most to the momentum performance. Cash flows are a major information source that reflects the financial fundamentals for investors’ evaluation of a firm. Our research offers a good example of identifying the incremental value of accounting information and provides guidance for incorporating fundamental analysis into the technical trading strategies for potential improvements.
Our conclusions are subject to limitations. First, we may be failing to control for some unknown risk factors that might account for our findings. In the absence of a theoretical asset pricing model where momentum and cash flows are observed in equilibrium, it is impossible to eliminate the possibility that our findings are due to an omitted risk factor. Although we conduct a battery of robustness tests, our evidence can, at best, indicate that the set of well-known risk factors fails to explain the profits from the enhanced momentum strategy. Second, although we show that the profitability from the enhanced momentum strategy remains significant in recent years, it will likely be attenuated in future years if more arbitrageurs are attracted to trade on this strategy. Future research interested in the interaction between FCFs and price momentum should take these limitations into consideration.
Our analyses also suggest several ideas for future research. We document that the enhanced momentum strategy outperforms the traditional momentum strategy. Future research can examine sources that affect returns on the long and short legs to advance the understanding of the performance of this trading strategy. In addition, we show that momentum profits are higher in low cash flow firms. Future research can investigate economic rationales to explain this phenomenon. We also find it remarkable that the profits from the cash flow strategy are at par with the momentum profits in magnitude and cannot be explained by risk factor models. Compared with price momentum, the pricing effect of cash flows receives considerably less attention in prior studies. Future research can focus on cash flows and examine cross-sectional variations and alternative explanations for the cash flow anomaly.
Supplemental Material
sj-pdf-1-jaf-10.1177_0148558X221091803 – Supplemental material for Free Cash Flows and Price Momentum
Supplemental material, sj-pdf-1-jaf-10.1177_0148558X221091803 for Free Cash Flows and Price Momentum by Jiajia Fu, Fangming Xu, Cheng Zeng and Liyi Zheng in Journal of Accounting, Auditing & Finance
Footnotes
Acknowledgements
We are grateful for the helpful comments from Xiao-Jun Zhang (the Editor), Bharat Sarath (the previous Editor), Agnes Cheng (the Associate Editor), the two anonymous reviewers, George Bulkley, Rachel Hayes, Pengguo Wang, and seminar and conference participants at the 2018 European Accounting Association Annual Congress and Jinan University. We also thank Professor Kenneth R. French and Professor Lu Zhang for sharing their factor data. All errors are our own.
Declaration of Conflicting Interests
The author(s) declared no potential conflicts of interest with respect to the research, authorship, and/or publication of this article.
Funding
The author(s) received no financial support for the research, authorship, and/or publication of this article.
Supplemental Material
Supplemental material for this article is available online.
Notes
References
Supplementary Material
Please find the following supplemental material available below.
For Open Access articles published under a Creative Commons License, all supplemental material carries the same license as the article it is associated with.
For non-Open Access articles published, all supplemental material carries a non-exclusive license, and permission requests for re-use of supplemental material or any part of supplemental material shall be sent directly to the copyright owner as specified in the copyright notice associated with the article.