
Abstract
We examine the impact of the failure of Satyam Computer Services Ltd. (“Satyam”), a major corporate governance related event in India, on related party loans of Indian public companies. Using data from a balanced panel of 794 firms for the years 2006–2012, we find that the Satyam failure had a significant negative impact on related party loans given by Indian firms. The average of net related party loans (as a proportion of total assets) declined from 2.37% in 2008 to 0.23% in 2010. Furthermore, the reduction in related party loans was more prominent in firms with lower levels of external monitoring. Finally, since prior research suggests that there was no significant Satyam effect on the frequency or attendance at audit committee meetings, our results suggest that there can be substantive changes in operational decisions without observable changes in governance.
Keywords
Introduction
The objective of this article is to provide empirical evidence about the changes in related party loans (RPLs) in Indian public companies after the Satyam failure. Motivation for this article comes from (a) the significant presence of related party loans in developing economies such as India, and (b) the role of the Satyam fraud in changing the corporate governance mechanisms in India. We examine related party loans from a balanced panel data of 794 companies during the years 2006 to 2012 and show that there was a significant reduction in RPLs after the Satyam failure.
RPLs, which are one of the prominent constituents of the related party transactions (RPTs), are a major source of financing for firms in emerging economies (Gopalan et al., 2007). There are two different perspectives about such transactions, especially when they occur within groups of firms sharing common owners and/or managers. The positive view is that such financing could be efficient and used for supporting financially weaker firms (Buchuk et al., 2014; Gopalan et al., 2007). Internal capital markets can address the information asymmetry associated with external markets. For example, Gopalan et al. (2007) show that stronger firms in business groups provide support to weaker firms as they may not want to reveal negative information about the group.
On the other hand, prior research also provides evidence that the internal capital markets could be used for tunneling of financial resources of a firm (Berkman et al., 2009; Bertrand et al., 2002; Jiang et al., 2010). Along these lines, Kohlbeck and Mayhew (2010) note that RPTs can be either “value-enhancing by creating strategic partnerships, enhancing risk sharing, and facilitating contracting” or “have the potential for insiders to extract firm wealth at the expense of other stakeholders.” RPLs and guarantees are often issued to related parties for the repayment of loans to unrelated business activities (Berkman et al., 2009) and sometimes reported as other receivables in the company’s balance sheet (Jiang et al., 2010). The misuse of RPTs in general, and RPLs in particular, is a major corporate governance issue in many developing countries, including India. More generally, regulators in many countries have tightened auditing rules related to RPTs in recent years (International Federation of Accountants, 2013; Public Company Accounting Oversight Board, 2014). Kohlbeck & Mayhew (2017, p. 901) note that regulators and standard setters have “long struggled to balance legitimate business purposes of RPTs with the heightened risk generated when insiders engage in transactions with the firms they control.”
The potential for the abuse of RPLs by corporate insiders is higher in an ownership structure where controlling shareholders play a critical role in firms’ decision-making (Berkman et al., 2009; Jiang et al., 2010). India is characterized by the concentrated ownership structure, weak law enforcement, and the lack of corporate transparency (Chakrabarti et al., 2008; Narayanaswamy et al., 2012). Such an environment makes it easier for controlling shareholders to siphon off a firm’s resources through related party lending (Peng et al., 2011) and can undermine the investors’ confidence in the market (Lo et al., 2010). Concerns about RPLs by large Indian public companies persist; for example, the Securities and Exchange Board of India (SEBI) has recently expressed concerns over the diversion of funds through the extension of loans to the related parties (“SEBI Voices Concern over Related Party Transactions,” 2019), and a Working Group submitted a report to address a variety of issues related to RPTs (SEBI, 2020).
This article contributes to the existing literature by investigating the interaction between corporate governance and RPLs in Indian firms where the issue of RPLs is particularly critical given the ownership structure where there are influential controlling shareholders. The results are particularly timely given the recent actions of SEBI (2020) with respect to RPTs by Indian public companies. In addition, our article also adds to the emerging stream of literature on RPTs. We expect that our findings would further provide an avenue for a debate about RPTs and their consequences in developing economies with less-than-stellar corporate governance practices.
In this study, we investigate the impact of the Satyam failure on RPLs by Indian public companies. The Satyam failure, which came to light in early 2009, is called as “India’s Enron” and is the biggest corporate governance failure in India to date. 1 The Satyam failure came to light when the controlling shareholders (called “promoters” in India) tried to enter into a share acquisition deal with related parties which were in unrelated business activities. Specifically, we examine whether there is any change in RPLs by Indian firms after the Satyam failure.
Based on a balanced panel data of 794 firms, we find a significant decrease in the loans given to the related parties after the collapse of Satyam. The results are consistent with the view that stakeholders in the monitoring mechanism (primarily the board of directors and auditors) became more vigilant after the Satyam failure, and acted in a manner to reduce the concerns of external shareholders following a scandal that affected many aspects of Indian corporate governance.
As part of additional analysis, we examine whether the Satyam effect on RPLs varies depending on levels of external monitoring mechanisms. External auditors play a prominent monitoring role in emerging markets (Fan & Wong, 2005); thus, we consider audit by Big 4 firms as a proxy for better monitoring. We find that the decrease in related party lending was more prominent in firms audited by non-Big 4 auditors. Larger firms are exposed to a higher amount of scrutiny from the external stakeholders, and thus, they are less likely to be involved in value expropriating behavior (Black et al., 2006). Similarly, institutional investors perform a monitoring role (McCahery et al., 2016), and thus the firms with higher institutional ownership are less likely to take value-decreasing managerial decisions. We find that the decline in RPLs post-Satyam is greater in firms that (a) are smaller, (b) are audited by non-Big 4 firms, and (c) have lower institutional ownership. Overall, the results suggest that the Satyam effect was more pronounced in firms that had lower levels of external monitoring and governance.
The next section discusses the background and related literature, followed by the hypothesis development. This is followed by a description of the method and results. The article ends with a summary and discussion.
Background and Related Literature
RPTs represent transactions between a firm and its insiders. Definitions of “related party” vary across jurisdictions, but generally always include transactions between the firm and the owners and/or managers of the firm and other entities controlled by such insiders. Kohlbeck and Mayhew (2017) note that the regulations related to the reporting and monitoring of RPTs cover a spectrum across jurisdictions. The Indian approach is somewhat similar to the U.S. approach, in that RPTs are broadly permitted (but with some prohibitions as well as additional procedures that must be followed before RPTs are undertaken) but RPTs must be disclosed by public companies in their audited financial statements. One key area of difference between the United States and India is that while RPLs were prohibited by the Sarbanes-Oxley Act (SOX, 2002), such RPLs continue to be permissible under Indian law with some restrictions.
In India, both The Companies Act provisions and the rules of the SEBI provide detailed guidance about “related party” and “related party transactions.”
2
The definitions of SEBI have been broadly similar, although the definitions continue to evolve over the years. In addition, the SEBI formed a working group in 2019 with the mandate to review the rules related to RPTs, and make recommendations for “strengthening the monitoring and enforcement of regulatory norms related to related party transactions.” This Working Group recently issued a report, including recommendations related to the disclosure and monitoring of RPTs. The Working Group Report (SEBI, 2020) noted, While it is recognised that related party transactions can per se have sound economic rationale and can be value enhancing, there have been concerns about some such transactions being questionable or against the interest of minority shareholders or even bordering on fraud or ill-intent, particularly in the recent past . . . The prevalent use of complex group structures and subsidiaries for related party transactions, particularly with unlisted entities, has increased concerns such as siphoning of funds, money laundering and round tripping.
The Working Group Report also made many recommendations related to RPTs, focusing on (a) enhancing transparency; (b) improving quality of information that investors have access to; (c) better approval processes by listed entities; and (d) more robust enforcement mechanism. The recommendations are under consideration for further action by the SEBI. Thus, RPTs continue to be an issue of concern to regulators in India.
Related Party Transactions: Efficient Contracting Perspective
There are two different perspectives about the role of RPTs. The benign, or positive, view is that RPTs are rational economic transactions that can benefit both the firm and the insiders. Thus, Gordon et al. (2004, p. 3) suggest that RPTs are “efficient transactions that rationally fulfill other economic demands of a company such as securing in-depth skills and expertise between participants with private information or providing an alternative form of compensation.”
Consistent with the above view, prior research finds that related party lending can be beneficial for all stakeholders. It fulfills practical and commercial objectives and is efficient due to higher trust between related parties (Ryngaert & Thomas, 2012). Firms with brighter prospects often have greater access to external funding (Fisman & Wang, 2010). These firms play a critical role in the internal capital market and transfer funds to the financially weaker firms (Buchuk et al., 2014; Fisman & Wang, 2010; Gopalan et al., 2007). Inter-company loans are particularly valuable either when the borrower is weak and cannot access external markets or when the borrower is strong but the external market does not have the information to realize this. 3 Such internal transactions are often used to avoid defaults and may help solve information asymmetries with external capital markets (Gopalan et al., 2007).
Jia et al. (2013) document that when the controlling entity faces financial difficulty, other related firms provide support through intercorporate loans and guarantees. The controlling entity reciprocates through other RPTs, such as related party sales. The practice of providing support to each other in difficult times is known as “co-insurance.” In support of the co-insurance theory, Buchuk et al. (2014) provide evidence that related party lending relationships are driven by capital requirements in Chilean firms. Thus, related party lending could be value-enhancing due to efficient contracting, strategic partnerships, and risk-sharing (Kohlbeck & Mayhew, 2010).
Related Party Transactions: Agency Conflict Perspective
The second perspective on RPTs focuses on the agency conflicts between the insiders and other stakeholders. Under this view, RPTs can be used for wealth transfers from the firm to related parties (to the potential detriment of other stakeholders). This, in turn, leads to unique accounting, disclosure, and auditing issues that have attracted the attention of regulators and standard-setters. The Financial Accounting Standards Board (1982, p. 15) notes that RPTs provide a potential mechanism for managers to manipulate financial statements.
4
Kohlbeck and Mayhew (2017, p. 901) also suggest that RPTs could send a “tone at the top” signal that company insiders are open to self-dealing transactions . . . Abusive RPTs provide direct evidence of a willingness to self-deal that suggests additional management-centric actions such as earnings management are more likely.
Some prior studies find that wealth generation and minority shareholder expropriation drive related party lending in the internal capital market, especially in less-developed countries. Berkman et al. (2009) find that Chinese firms expropriate minority shareholders through the issuance of loan guarantees. The guarantees are issued to related parties for the repayment of loans to unrelated business activities. Jiang et al. (2010) report the siphoning of resources in Chinese firms through intercorporate loans, which are generally reported as “other receivables.” Most of these loans did not pay either interest or the principal.
Prior studies also document the use of inter-corporate loans in tunneling the firms’ assets to parent companies. Aharony et al. (2010) find that Chinese firms boost their earnings in the pre-Initial Public Offering (IPO) period to attract more capital from minority shareholders, and then tunnel resources to parent companies through intercorporate loans in the post-IPO period. Similarly, Brockman et al. (2019) find that the approval for seasoned equity offerings (SEO) in Chinese guanxi 5 -influenced firms is significantly higher in firms with an abnormally higher level of intercorporate loans, RPTs, and earnings management.
RPTs can also affect perceptions about fraud. For example, Moyes et al. (2005) find that internal auditors rate RPTs as an effective red flag in identifying opportunities to commit fraud.
Hypothesis
The discussion above suggests that corporate insiders can use internal capital markets for the efficient transfer of loans among related parties or for siphoning off funds. An external shock in the form of a significant corporate governance failure could bring a series of changes in firms’ functioning (Gillan & Martin, 2007). Prior research in other countries shows that such shocks have led to changes in the behavior of managers, auditors, and directors (Cohen et al., 2013; Geiger et al., 2014). For example, the auditors became more conservative in the post-Enron period (Cahan & Zhang, 2006) and were likely to issue higher modifications in going-concern opinions compared with earlier periods (Feldmann & Read, 2010).
In the period after the passage of the SOX, following the corporate scandals, the audit committees were more likely to interact with auditors and provide greater support in comparison to earlier periods (DeZoort et al., 2008). It led to a significant improvement in the monitoring role of the audit committees in the post-SOX period (Cohen et al., 2010, 2013). Geiger et al. (2014) find an increase in the likelihood of the issuance of going concern opinions after the global financial crisis in comparison to prior periods.
A negative external shock such as the Satyam scandal would likely make the internal and external stakeholders more cautious about RPTs. We anticipate that stakeholders, including directors, learn from the Satyam failure and become more vigilant post-Satyam. Hence, we expect that we would observe a significant effect in the form of lower RPLs post-Satyam. This leads to the following hypothesis:
Method
Data
We obtain necessary data from the Prowessdx database, maintained by the Center for Monitoring Indian Economy (CMIE). It is the most extensive database of Indian companies, and CMIE data have been regularly employed in prior studies focused on Indian firms (e.g., see Bertrand et al. (2002), Gopalan et al. (2007), Ghosh (2007)). We select publicly listed firms for which annual report data were available in CMIE for the years examined in our study.
Table 1 presents details about the sample selection. We focus on years around the Satyam failure that was disclosed in January 2009. Since most Indian public companies have a March 31 fiscal year-end, and since the Satyam failure occurred in the last quarter of the fiscal year, to study the effect of the Satyam scandal on internal capital markets, we exclude the year ending March 31, 2009, from our analysis. We include data from one year before and after the fraud, that is, the years ending March 31, 2008, and 2010. Henceforth, for ease of exposition, we refer to fiscal years ending on March 31, 20XY as “year 20XY.”
Sample Selection.
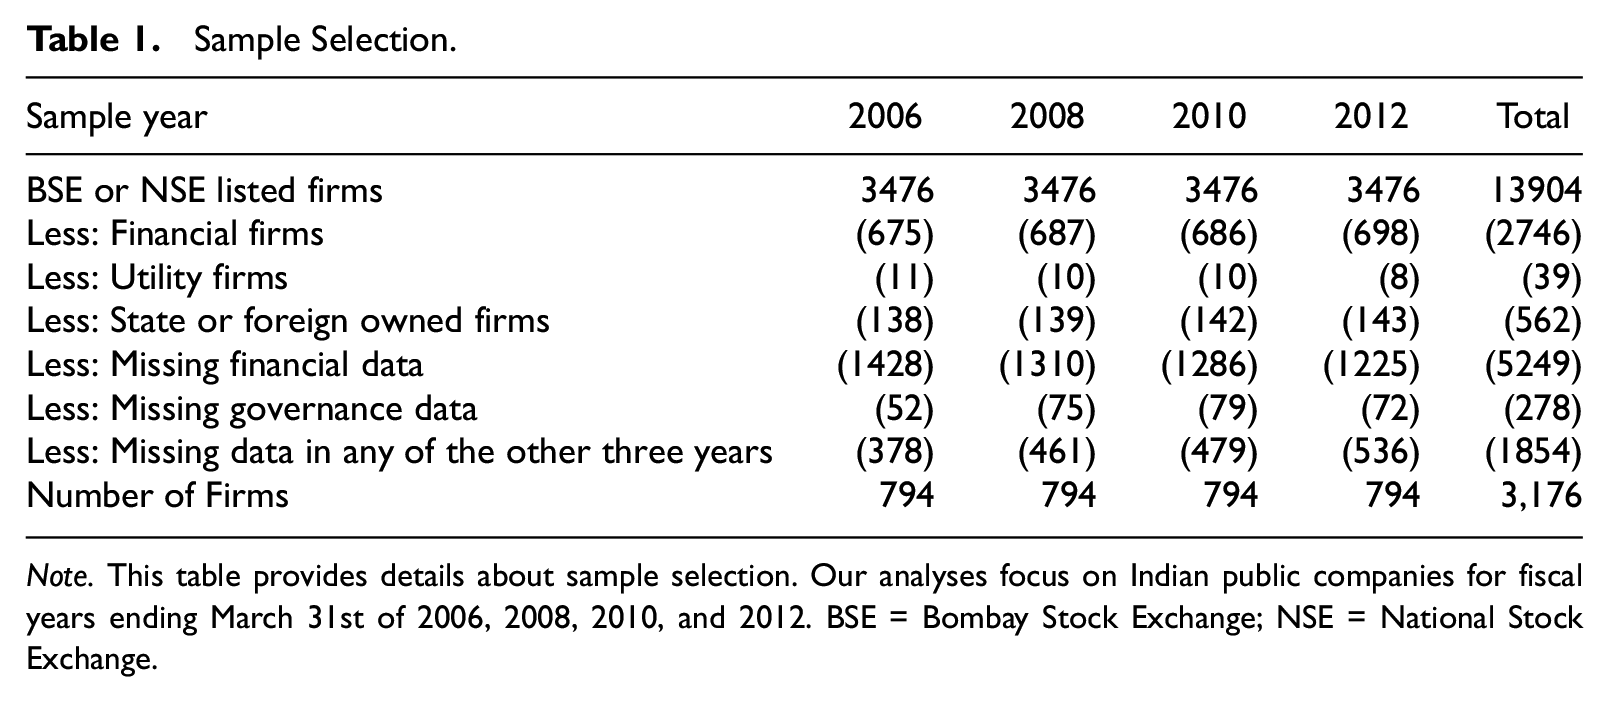
Note. This table provides details about sample selection. Our analyses focus on Indian public companies for fiscal years ending March 31st of 2006, 2008, 2010, and 2012. BSE = Bombay Stock Exchange; NSE = National Stock Exchange.
Any changes that we observe from 2008 to 2010 can be due to other secular trends in the Indian capital market. Furthermore, even if there is an immediate effect of the Satyam failure, the effects may not persist over time. Just like the Enron effects faded away once the “bright lights” of the media dimmed (Feldmann & Read, 2010) it is an open question whether the Satyam effect would also diminish over time.
Therefore, to rule out such alternative explanations and to examine whether any observed changes are transient in nature, we examine data from 2006 to 2012. This enables us to observe whether the change from 2008 to 2010 is merely reflective of any overall trends, or whether the change from 2008 to 2010 is a unique occurrence that makes it more likely that any observed changes are attributable to the Satyam effect. We exclude the years 2007 and 2011 to maintain consistency in the time interval during the period of study. Thus, our sample consists of a balanced panel of firms for the years 2006, 2008, 2010, and 2012.
As shown in Table 1, there were 3,476 listed firms in 2006 and other years. We apply various filtering criteria to the sample. Consistent with the prior studies, we exclude firms from the financial and utility sectors (i.e., two-digit National Industrial Classification [NIC] codes 64-69 and NIC codes 35-38, respectively) from our sample. We exclude government, joint sector, or foreign owned firms as these firms have very different ownership and governance structures. Next, we remove observations for which financial or governance data are missing. Finally, we require that a firm in our sample should have the data for all the dependent, explanatory, and control variables for all the financial years during the period of study. After such filtering, our sample includes 3,176 firm-year observations from 794 firms.
Model
We use the following regression model to examine the effect of the Satyam failure on RPLs in Indian firms.
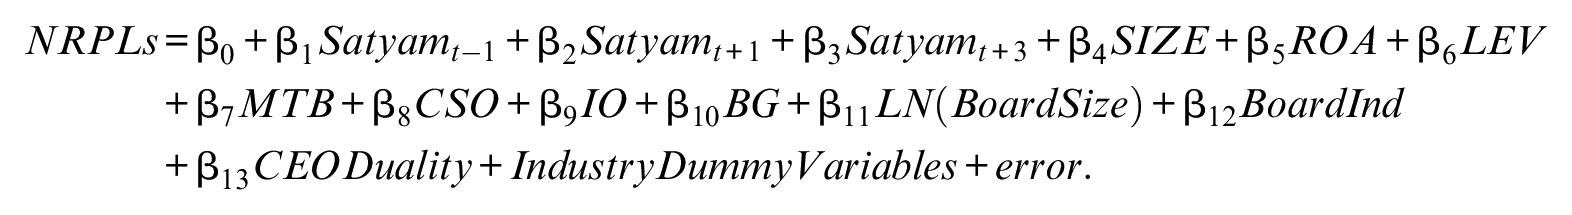
The variables are defined as follows: NRPLs (Net Related Party Loans) = loans provided to related entities net of loans taken from related parties, divided by total assets; Satyam(t-1) = 1 for fiscal year 2008, 0 otherwise; Satyam(t+1) = 1 for fiscal year 2010, 0 otherwise; Satyam(t+3) = 1 for fiscal year 2012, 0 otherwise; SIZE = natural log of total assets (measured in millions of Indian rupees); ROA (Return on Assets) = profitability of the firm measured as earnings before interest, taxes, depreciation, and amortization (EBITDA) divided by total assets; LEV (Leverage) = book value of debt divided by book value of equity of the firm; MTB (Market to Book) = market value of equity divided by book value of equity; CSO (Controlling Shareholder Ownership) = aggregate percentage ownership of controlling shareholders of the firm; IO (Institutional Ownership) = aggregate percentage ownership of institutional investors; BG = 1 if a firm is affiliated with a business group, 0 otherwise; LN(BoardSize) = natural logarithm of the total number of directors on the board; BoardInd = proportion of independent directors on the board; and CEODuality = 1 if the CEO is also the Chairperson of the board, 0 otherwise.
Our dependent variable is net loans provided to related entities (excluding loans provided to individuals) divided by total assets (NRPLs). This is measured as loans given to related parties minus loans borrowed from related parties, as a proportion of total assets. This measure has been used in prior studies (Buchuk et al., 2014; Jia et al., 2013) as a dependent variable. However, as part of sensitivity tests, we also use the gross values of given related party loans (GRPLs), which is the magnitude of total loans given to related parties as a proportion of total assets. This variable focuses on total loans given to the related parties but ignores the netting process used in the NRPLs measure. Our independent variables of interest are Satyam(t-1), Satyam(t+1), and Satyam(t+3).
In our analysis, we control for factors that are associated with RPLs based on results from prior studies. First, we control for firm-specific factors such as firm size (SIZE), profitability (ROA), leverage (LEV), and growth opportunities (MTB). Larger firms are expected to have higher RPLs because they are likely to have higher financial resources to expropriate (Berkman et al., 2009). Conversely, larger firms are likely to have better internal and external monitoring systems, including better boards (Ghosh, 2007), which may affect RPLs. More generally, firm size is used as a control variable in almost all governance and performance related studies.
Fisman and Wang (2010) show that RPLs are negatively associated with firm profitability, indicating the exploitation of firms’ resources by the controlling shareholders. Buchuk et al. (2014) show that firms with higher debt rely more on RPLs. Hence, we include leverage as a control variable. Berkman et al. (2009) provide evidence that firms with higher growth prospects are less likely to issue loan guarantees to related parties. Thus, we control for the firms’ growth prospects, measured as the market to book ratio.
Our next set of control variables focus on the ownership characteristics of the firm, such as controlling shareholders’ ownership (CSO), institutional ownership (IO), and business group affiliation (BG). Firms under greater control by the controlling shareholders are expected to issue more loans and guarantees to related parties (Berkman et al., 2009). We control for institutional ownership, since institutional investors have higher financial expertise and are more likely to perform enhanced monitoring and thus reducing the managerial excesses (Bushee, 1998). The next variable, BG, is relevant to India and some other developing Asian countries that are characterized by the presence of large business groups. Such business groups provide a bigger internal capital market to related parties (Gopalan et al., 2007; Jia et al., 2013; Jiang et al., 2010) and hence business group affiliated firms may be more likely to have higher RPLs. Conversely, firms that are part of business groups may have other mechanisms for asset transfers so they may be less likely to have RPLs.
Our final set of control variables focus on governance related constructs. Prior research suggests that the larger boards may play a role in the corporate governance of the firm (Coles et al., 2008). Therefore, we expect that RPLs would be less likely at firms with bigger boards and hence we control for board size. Lo et al. (2010) provide evidence that boards with a higher number of independent directors are less likely to engage in opportunistic behaviors. We expect that higher board independence would prevent dubious loan transactions, and hence include BoardInd as a control variable. We control for CEO duality since some studies suggest that firms where one individual holds both the titles of CEO and Chairperson are more likely to have higher value expropriating transactions with related parties (Lo et al., 2010).
Results
Table 2 provides descriptive statistics for our sample. In total, we have 3,176 firm-year observations from the 794 firms. The continuous variables are winsorized at 1% and 99%. The data show that the average value of NRPLs (as a proportion of total assets) increased from 1.95 in 2006 to 2.37 in 2008 (i.e., the pre-Satyam period) but then declined sharply to 0.23 in 2010 (i.e., immediately after Satyam) before increasing back to 1.02 in 2012 (as the Satyam effect became more distant). A similar pattern is observed with the average value of gross RPLs: increasing from 2.54 in 2006 to 3.46 in 2008, then declining to 1.28 in 2010, and then going back up to 1.68 in 2012. 6 We find that the total loans provided by companies as a percentage of total assets were 11.56%, 12.7%, 12.83%, and 12.29% in 2006, 2008, 2010, and 2012, respectively (not reported in tables). Thus, the gross RPLs were around 22% and 27% as a percentage of total loans before the Satyam scandal. However, these were reduced to 9.98% and 13.67% after the Satyam scandal. Interestingly, the total loans remain almost the same after the Satyam scandal but there was a significant reduction in the RPLs which enforces our view that the Satyam scandal affected the RPLs, not the total loans given by these firms. Thus, together these patterns show that there was a very pronounced Satyam effect on RPLs in Indian public companies.
Descriptive Statistics.
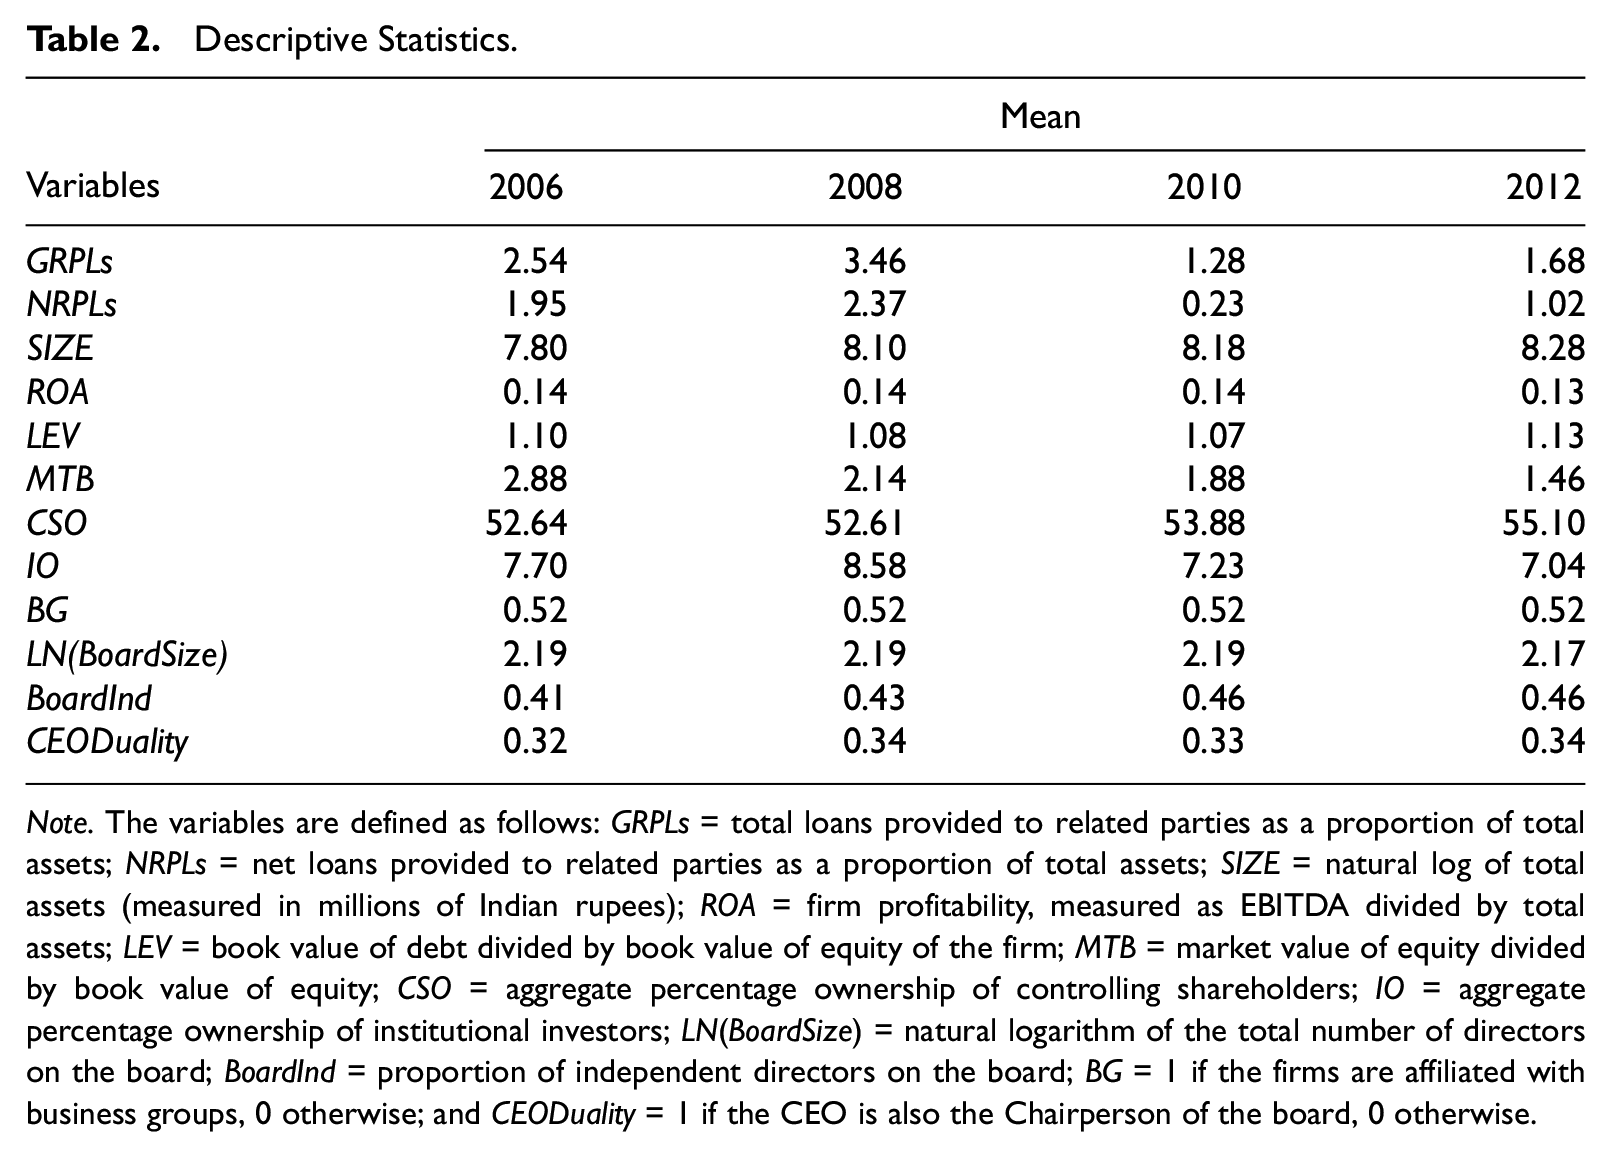
Note. The variables are defined as follows: GRPLs = total loans provided to related parties as a proportion of total assets; NRPLs = net loans provided to related parties as a proportion of total assets; SIZE = natural log of total assets (measured in millions of Indian rupees); ROA = firm profitability, measured as EBITDA divided by total assets; LEV = book value of debt divided by book value of equity of the firm; MTB = market value of equity divided by book value of equity; CSO = aggregate percentage ownership of controlling shareholders; IO = aggregate percentage ownership of institutional investors; LN(BoardSize) = natural logarithm of the total number of directors on the board; BoardInd = proportion of independent directors on the board; BG = 1 if the firms are affiliated with business groups, 0 otherwise; and CEODuality = 1 if the CEO is also the Chairperson of the board, 0 otherwise.
Turning to the control variables, we observe a steady increase in size (which is expected given that we do not use an inflation-adjusted measure). The average profitability and leverage values are relatively steady over the time period, but we observe a decline in the MTB ratio over the period examined in the study. The mean values of SIZE and other control variables are generally in line with those reported in prior research on Indian firms (Chauhan, Lakshmi, & Dey, 2016). While some of the financial ratios, such as the debt-to-equity, are quite different compared with samples of firms in the US or other Anglo-Saxon economies, they are nevertheless in line with those reported for Indian samples as well as those from some other Asian countries (such as data from South Korea reported in Kang et al. (2014)).
One notable feature in Table 2 is that controlling shareholders (known as promoters in India) often own the majority stake in Indian firms. Recall that our sample focuses on some of the largest Indian public companies; yet, even for this sample, on average, controlling shareholders own 53.56% of the shares. The dominant controlling shareholder ownership in Indian firms makes it easier for related party lending to take place. On the other hand, the mean collective ownership of the institutional investors in our sample is 7.64%. The median institutional shareholding is only 1.88%, so institutional investors collectively hold less than a 2% stake in the majority of the firms in our sample. Controlling shareholder and institutional ownership data in our sample are comparable with prior research on Indian firms (Chauhan, Dey, & Jha, 2016). The data thus reinforce the point made by Narayanaswamy et al. (2012) about the very significant role of controlling shareholders and founder-families in Indian corporate governance.
A related point is that 52% of the firms in our sample are affiliated with business groups. This number is in line with the numbers reported in prior research using Indian data (Chauhan, Dey, & Jha, 2016) and highlights the importance of group companies in Asian markets.
Turning to governance variables, the mean size of the board in our sample is 9.34 and independent directors account for 44% of the seats. The CEO is also the Chairperson of the board in 33% of the firms in our sample. These figures are comparable with prior research using data from another emerging economy (Chen et al., 2015).
Regression Results
Table 3 provides the results from the regression analyses. As noted earlier, net related party loans (as a proportion of total assets) is our dependent variable. Satyam(t-1), Satyam(t+1), and Satyam(t+3) are our independent variables. The overall model is statistically significant at p < .01. Consistent with the prior research on RPLs (Jiang et al., 2010), the adjusted R2 is around 20%.
Net Related Party Loans and Satyam Scandal.
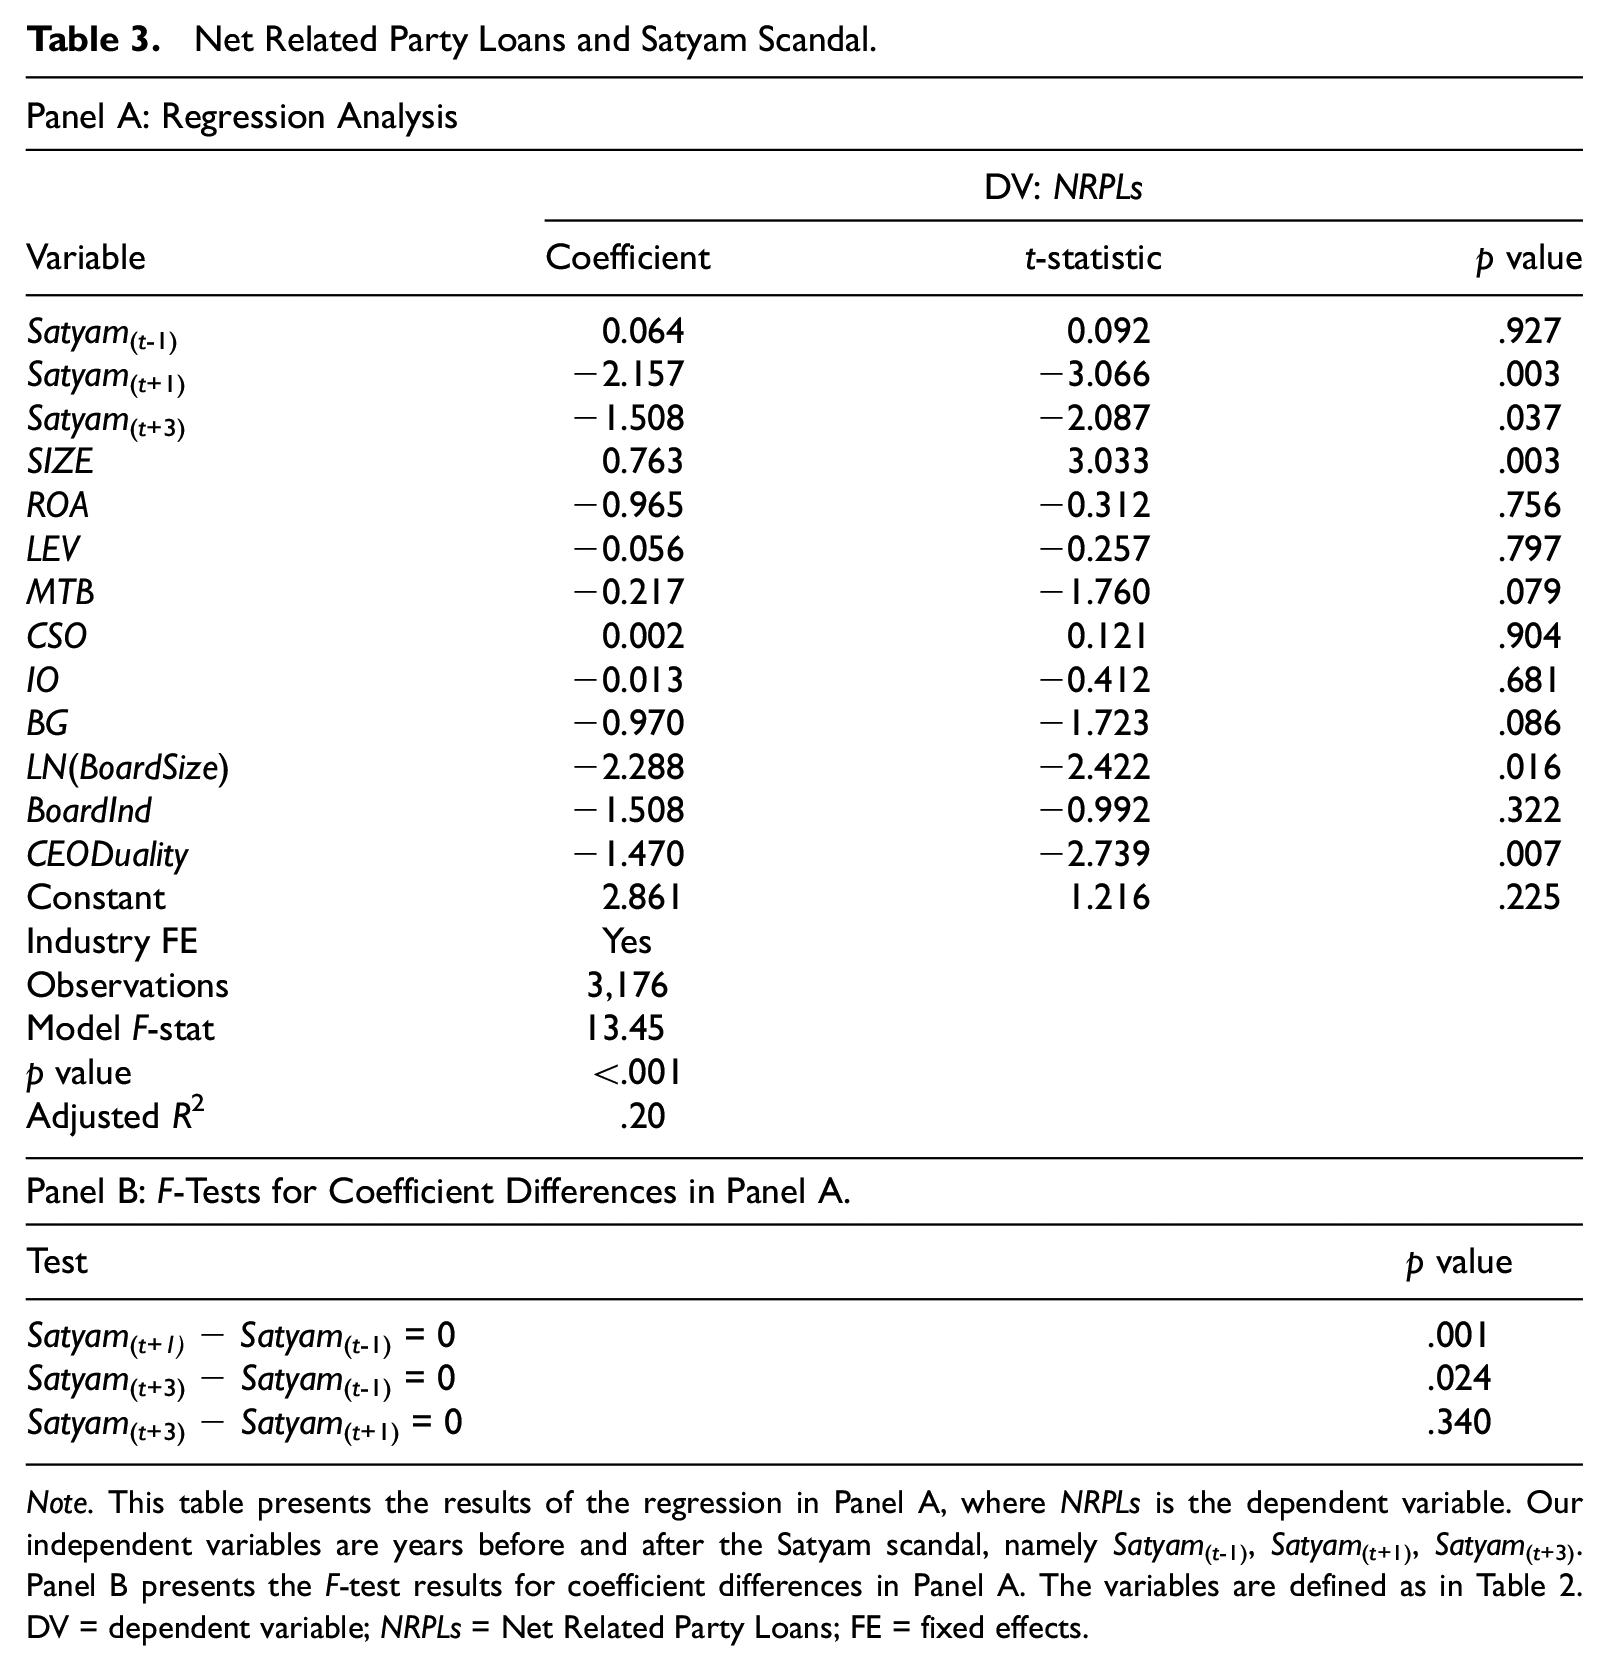
Note. This table presents the results of the regression in Panel A, where NRPLs is the dependent variable. Our independent variables are years before and after the Satyam scandal, namely Satyam(t-1), Satyam(t+1), Satyam(t+3). Panel B presents the F-test results for coefficient differences in Panel A. The variables are defined as in Table 2. DV = dependent variable; NRPLs = Net Related Party Loans; FE = fixed effects.
The coefficient of Satyam(t-1) is not significant at conventional levels, indicating that after controlling for other factors there was no statistically significant change in NRPLs from 2006 to 2008. In contrast, the coefficient of Satyam(t+1) is negative and significant (p < .01) indicating that on average the NRPLs are much lower in 2010 compared with 2006. Similarly, the coefficient of Satyam(t+3) also is negative and significant (p < .05) indicating that on average the NRPLs are much lower in 2012 compared with 2006.
In Panel B of Table 3, we provide results from a comparison of the coefficients. The results show that the coefficient of Satyam(t+1) is significantly (p < .01) more negative than the coefficient of Satyam(t-1). The coefficient of Satyam(t+3) is significantly more negative than the coefficient of Satyam(t-1) (p < .05) but the difference between Satyam(t+1) and Satyam(t+3) is not statistically significant.
Overall, the results indicate that after the Satyam scandal, there was a significant decline in the related party lending of Indian listed firms. In terms of effect size, after controlling for other variables, the NRPLs declined on average by 2.22 (0.064 - [−2.157]) percent of assets in 2010 compared with 2008. This is an economically significant effect, given that the mean value of NRPLs was only 2.37 in 2008. While the univariate data suggest a partial reversal of the decline when comparing the 2012 and 2010 data, the results in Panel B of Table 3 indicate that the changes from 2010 to 2012 are not statistically significant. Thus, it appears the post-Satyam decline persisted at least until 2012 and that the “Satyam effect” was not just a temporary blip.
Turning to our control variables, consistent with Berkman et al. (2009), we find that firm size is significantly and positively associated with NRPLs. Larger firms are likely to have greater financial resources and thus have more opportunities for transferring loans to the related parties. Furthermore, consistent with prior studies (Berkman et al., 2009; Buchuk et al., 2014), we find that firms with higher growth prospects (i.e., higher MTB) are less likely to provide loans to related parties. We find that board size is negatively and significantly associated with related party lending. This is in line with prior studies, which suggest that larger boards are more likely to have a higher level of expertise and restrict value expropriating managerial decisions. CEO duality is negative and significant indicating that firms where one individual occupies the positions of CEO and Chair are less likely to provide loans to related parties. The coefficient of BG is negative and marginally significant, indicating that NRPLs are lower in firms that are part of a business group. One interpretation of the finding is that in such firms, there are other means of asset transfer and tunneling.
Additional Analyses
Prior research shows that firms’ reactions to external systemic shocks or regulatory changes differ based on firm-specific factors. In times of financial crisis, firms with better corporate governance systems provide better shareholder wealth protection (Mitton, 2002). Some studies show that poorly governed firms tend to benefit more from a regulatory change. Berkman et al. (2010) report that firms with weaker governance experienced substantial abnormal returns than firms with stronger governance after the announcement of regulatory changes, meant to protect the minority shareholders’ interest, by the China Securities Regulatory Commission. Similarly, the operating performance of firms involved in tunneling improved significantly in comparison to non-tunneling firms after Chinese stock exchanges published a blacklist and vowed to take serious action against the firms involved in tunneling through intercorporate loans (Haß et al., 2016).
Using similar logic, an external shock in the form of a major corporate governance failure can have a greater effect on the managers and directors of firms that are subject to lower levels of monitoring. Hence, as part of additional analyses, we partition the full-sample based on three criteria and examine whether the Satyam effect varies across different types of firms.
Firm Size
Inferences can vary depending on firm size. This is due to many reasons, including variations in agency costs, rules and compliance regulations, regulatory focus, availability of resources, as well as the quality of directors and executives. Larger firms are more likely to be under the scrutiny of analysts and stakeholders, and hence may react differently to an external shock such as Satyam than smaller firms. 7 Conversely, if larger firms were always subject to such higher levels of monitoring, the room for improvement in such firms is perhaps lower than in smaller firms. Therefore, we partition the sample by size (above the median SIZE value or not), and separately examine the two groups.
Panel A of Table 4 shows the results for the two subgroups. For ease of exposition, we suppress the results related to the control variables in the table. But there are interesting differences in the pattern of results for the two groups, even though the primary inference about the Satyam effect remains the same in the two subsamples.
Additional Analyses: Effects of Firm Size, Auditor Type, and Institutional Ownership on Changes in Related Party Loans Post-Satyam.
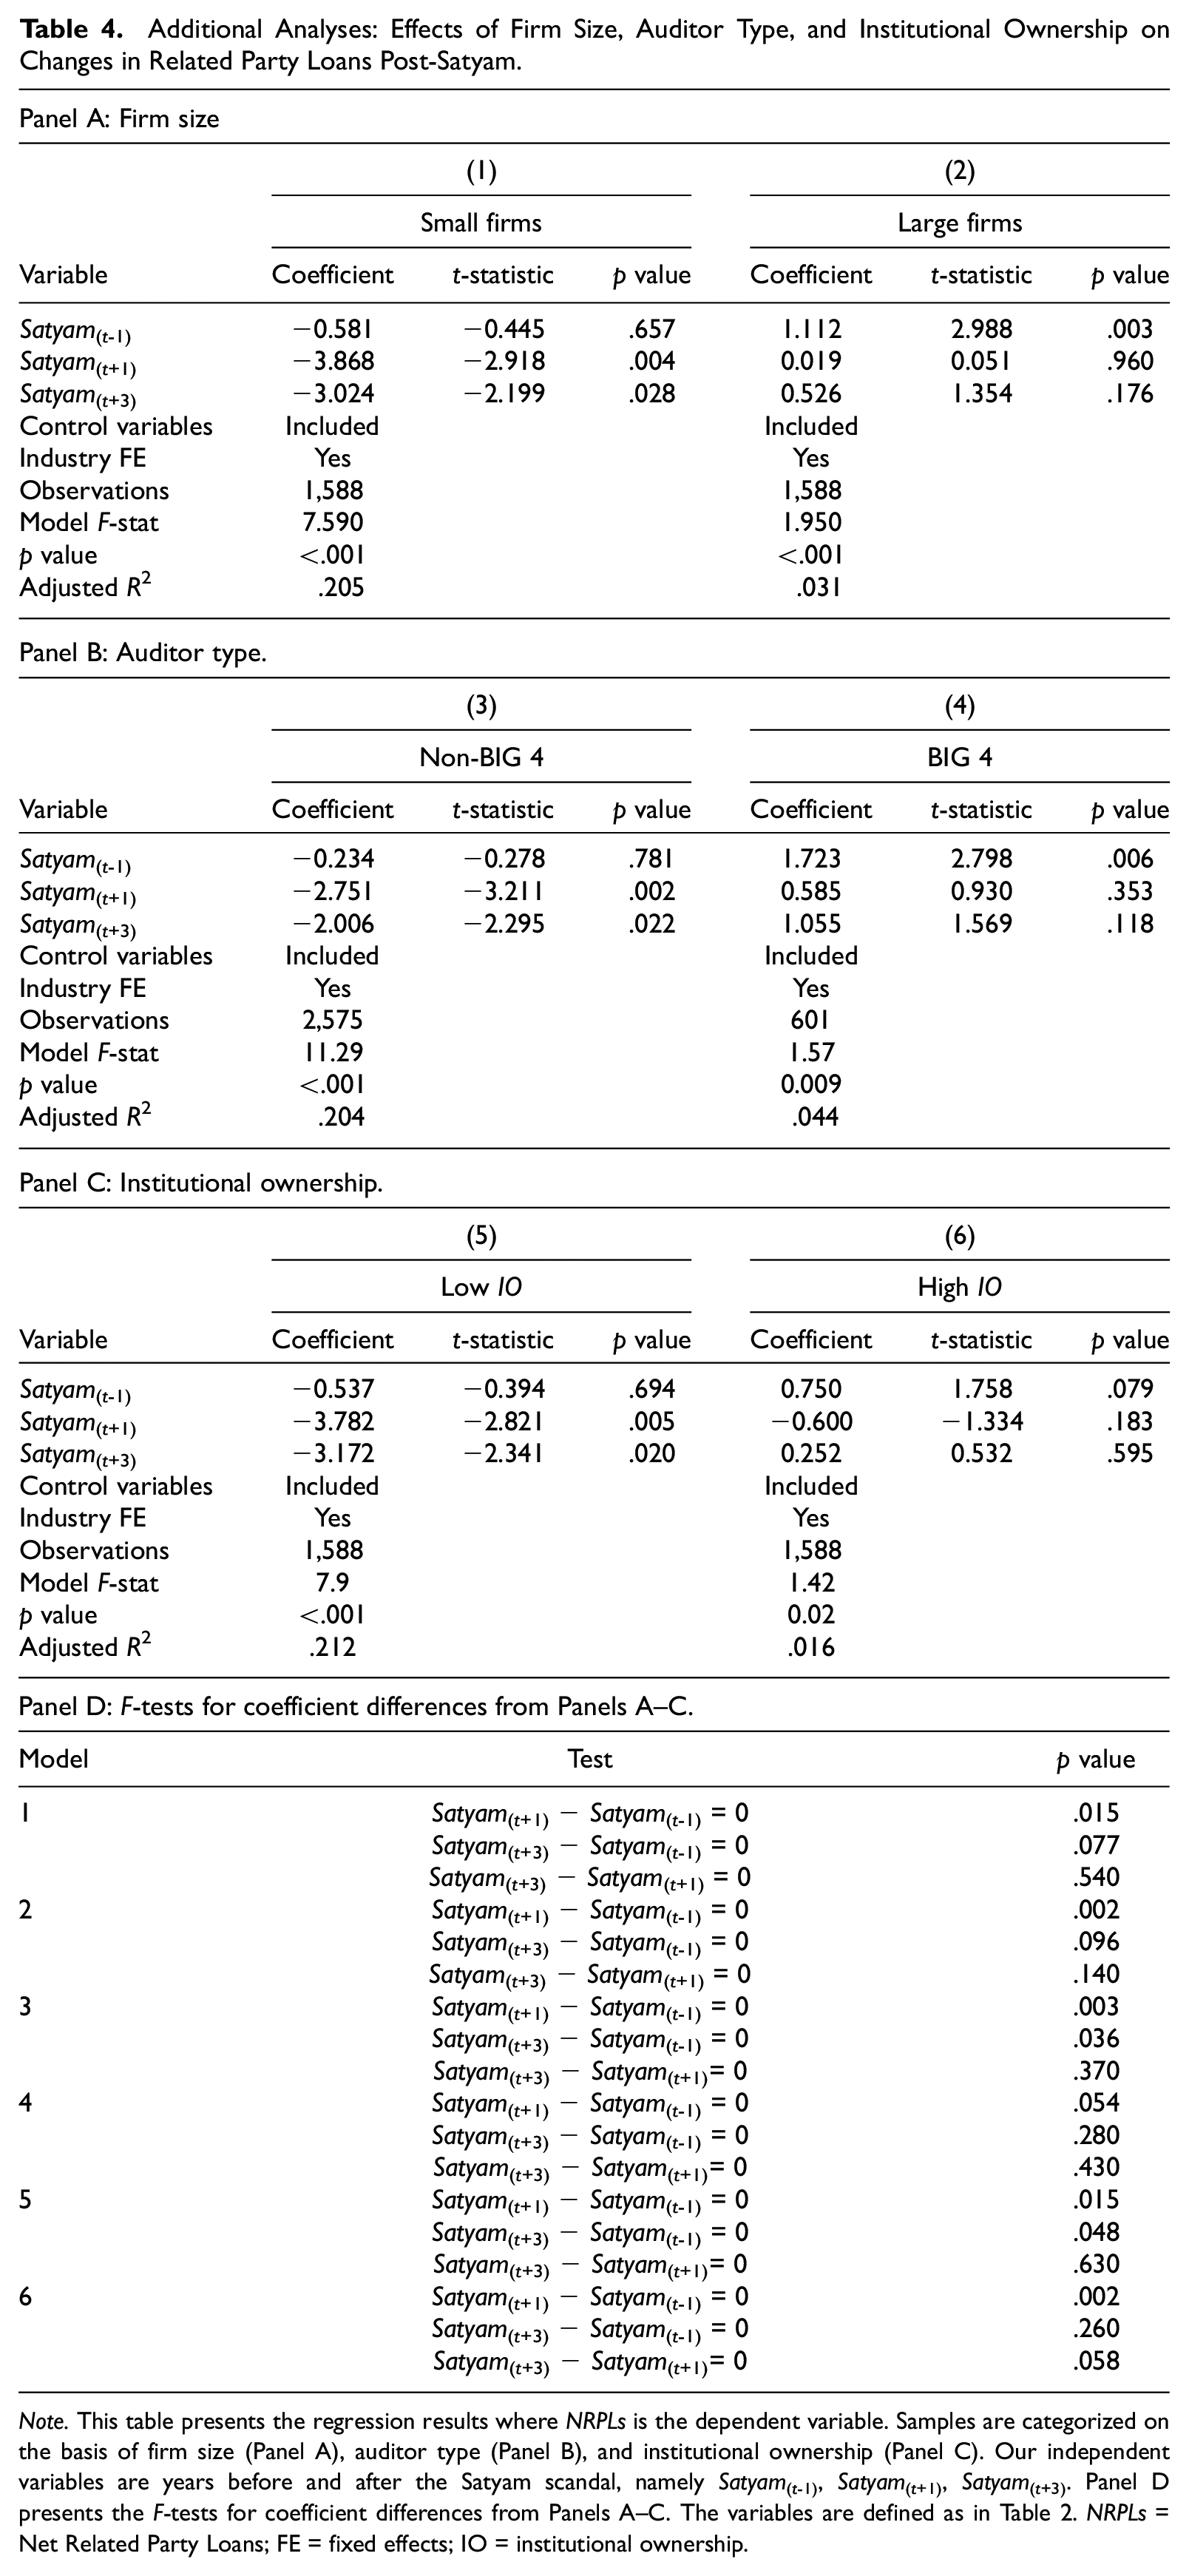
Note. This table presents the regression results where NRPLs is the dependent variable. Samples are categorized on the basis of firm size (Panel A), auditor type (Panel B), and institutional ownership (Panel C). Our independent variables are years before and after the Satyam scandal, namely Satyam(t-1), Satyam(t+1), Satyam(t+3). Panel D presents the F-tests for coefficient differences from Panels A–C. The variables are defined as in Table 2. NRPLs = Net Related Party Loans; FE = fixed effects; IO = institutional ownership.
The results for the small-firms subsample closely mirror the results presented in Table 3 for the full sample. The coefficient of Satyam(t-1) is not statistically significant, while the coefficients of Satyam(t+1) and Satyam(t+3) are both negative and significant. In addition, a comparison of the coefficients (in Panel D) shows that the coefficient of Satyam(t+1) and Satyam(t+3) are both significantly different from the coefficient of Satyam(t-1); however, the coefficients of Satyam(t+1) and Satyam(t+3) are not significantly different. Thus, in the small-firms sample the inferences remain similar to those of the full-sample: there was a significant decline in NRPLs the immediate aftermath of Satyam failure, and this decline persisted at least until 2012.
The results are somewhat different when considering the large firms subsample. The coefficient of Satyam(t-1) is positive and significant indicating a significant increase in NRPLs from 2006 to 2008. However, the coefficients of Satyam(t+1), and Satyam(t+3) are not statistically significant, indicating that on average NRPLs in 2010 and 2012 were not significantly different compared with the 2006 levels. In addition, a comparison of coefficients (in Panel D) indicates that the coefficient of Satyam(t+1) (and marginally significant for Satyam(t+3)), is significantly different from that of Satyam(t-1), indicating that there was a decline in NRPLs from 2008 to 2010. Thus, while the slopes differ for small and large firms, both groups of firms had a significant decline in NRPLs from 2008 to 2010, and such decline persisted at least until 2012.
In untabulated tests, we also compare the coefficients of Satyam(t+1) between the subsamples of small and large-firms. We find that the difference in the coefficients is statistically significant (p < .01), indicating a more pronounced Satyam effect (in terms of a decline in RPLs) for the small-firms subsample compared with the large-firms subsample.
Auditor type
Prior research suggests that the Big four auditors play a governance role in emerging economies (Fan & Wong, 2005) and the external changes have a different impact on Big four and non-Big four firms (Geiger et al., 2006, 2014). Therefore, we classify our sample into two subsamples based on auditor type (Big 4 or not).
We note that unlike in the United States or in some other advanced economies, the Big 4 do not dominate the market for audit services even when our analysis is restricted to some of the largest listed public companies in India (see also Narayanaswamy et al., 2012). Thus, while firm size is correlated with auditor type, we find that even in the large firms subgroup there is a substantial presence of non-Big 4 auditors.
In Panel B, we present the results for the two partitions. Even with the caveat in the prior paragraph, the pattern of the results in Panel B (for the auditor type partition) closely mirrors the results in Panel A (for the firm size partition). For the non-Big 4 subsample, the coefficient of Satyam(t-1) is not statistically significant, while the coefficients of Satyam(t+1) and Satyam(t+3) are both negative and significant. In addition, a comparison of the coefficients (in Panel D) shows that the coefficient of Satyam(t+1) and Satyam(t+3) are both significantly different from the coefficient of Satyam(t-1); however, the coefficients of Satyam(t+1) and Satyam(t+3) are not significantly different. Thus, in the non-Big 4 subsample the inferences remain similar to those of the full-sample: there was a significant decline in NRPLs in the immediate aftermath of the Satyam failure, and this decline persisted at least until 2012.
As with the firm size partition, the results are somewhat different when considering the Big 4 subsample. The coefficient of Satyam(t-1) is positive and significant indicating a significant increase in NRPLs from 2006 to 2008. However, the coefficients of Satyam(t+1) and Satyam(t+3) are not statistically significant, indicating that on average NRPLs in 2010 and 2012 were not significantly different compared with the 2006 levels. In addition, a comparison of coefficients (in panel D) indicates that the coefficient of Satyam(t+1), but not Satyam(t+3), is significantly different from that of Satyam(t-1), indicating that there was a decline in NRPLs from 2008 to 2010. Thus, while the changes across the years differ for firms with Big 4 and non-Big 4 auditors, the common pattern is that for both groups of firms, there was a significant decline in NRPLs immediately after the Satyam failure, and that this decline persisted at least until 2012. Finally, as with the size-partition, in untabulated tests we find that the coefficient of Satyam(t+1) is significantly different between the non-Big 4 and Big 4 subsamples. The Satyam effect, in terms of a decline in RPLs, is more pronounced for the non-Big 4 clients.
Institutional ownership
Prior studies provide evidence that institutional investors improve corporate governance in firms through interventions and play a monitoring role (McCahery et al., 2016). Therefore, the reactions of firms can vary depending on the levels of institutional ownership. To test this claim, we partition our sample into two groups based on whether institutional ownership is above or below the median.
We present the results in Panel C of Table 4. We find that the inferences for the low institutional ownership group mirror the results for the small firms and the non-Big 4 subsamples. However, the inferences for the high institutional ownership subsample differ from those for the large firms and Big 4 subsamples, in that none of the three time-period coefficients is significant at conventional levels, although the coefficient of Satyam(t-1) is positive and marginally significant (p < .10, one-tailed).
As with the other two partitions, we also compare the coefficient of Satyam(t+1) between the low and high institutional ownership subsamples. As expected, the decline in RPLs is more pronounced for the group of firms with lower institutional ownership.
Overall, the above results are consistent with findings in prior studies (Berkman et al., 2010; Haß et al., 2016) that find firms with lower levels of monitoring or corporate governance benefit more from an external or regulatory change in comparison to firms with higher levels of monitoring or better corporate governance.
Sensitivity Tests
Gross versus Net RPLs
As noted earlier, in our primary analysis we focus on net RPLs. This is because while loans given to related parties may be mechanisms for expropriation or tunneling, loans received from related parties may be viewed more favorably than loans given to related parties since such amounts put the funds of related parties at risk. Such loans received by the firm should make value-destroying actions by managers and insiders less likely, and may be more likely to arise from legitimate business transactions.
Hence, as part of our sensitivity tests, we use gross RPLs as an alternative dependent variable. In untabulated results, we find that our overall inferences with respect to the time period variables as well as the control variables remain qualitatively similar with one exception: the BG variable is not significant at conventional levels in the regression. All other variables in the model that are (not) significant in Table 3 continue to remain (not) significant in such a regression with Gross RPLs as the dependent variable.
Zero RPLs
One notable pattern in the data is that more than half the sample observations reported no related partly loans. This is also consistent with the data reported in prior studies using related party loans and guarantees as dependent variables (Chen et al., 2015; Jia et al., 2013). In addition, one argument is that just the existence of an RPT that requires disclosure is enough to evoke suspicion in the minds of investors. Hence, to ensure that our primary results are not being driven by the presence of such observations without any RPL, we conduct further tests as follows.
In Panel A of Table 5, we show the frequency of observations that reported an RPL (gross amount). We observe that the overall pattern is similar to that seen in Table 2. The number of companies disclosing non-zero given RPL increases from 2006 to 2008 but declines sharply in 2010 before increasing again in 2012. Similarly, the number of companies with net RPL greater than zero is lowest in 2010. Overall, this pattern confirms the inferences from Tables 2 and 3, about a Satyam effect on RPLs in Indian public companies.
Sensitivity Tests.
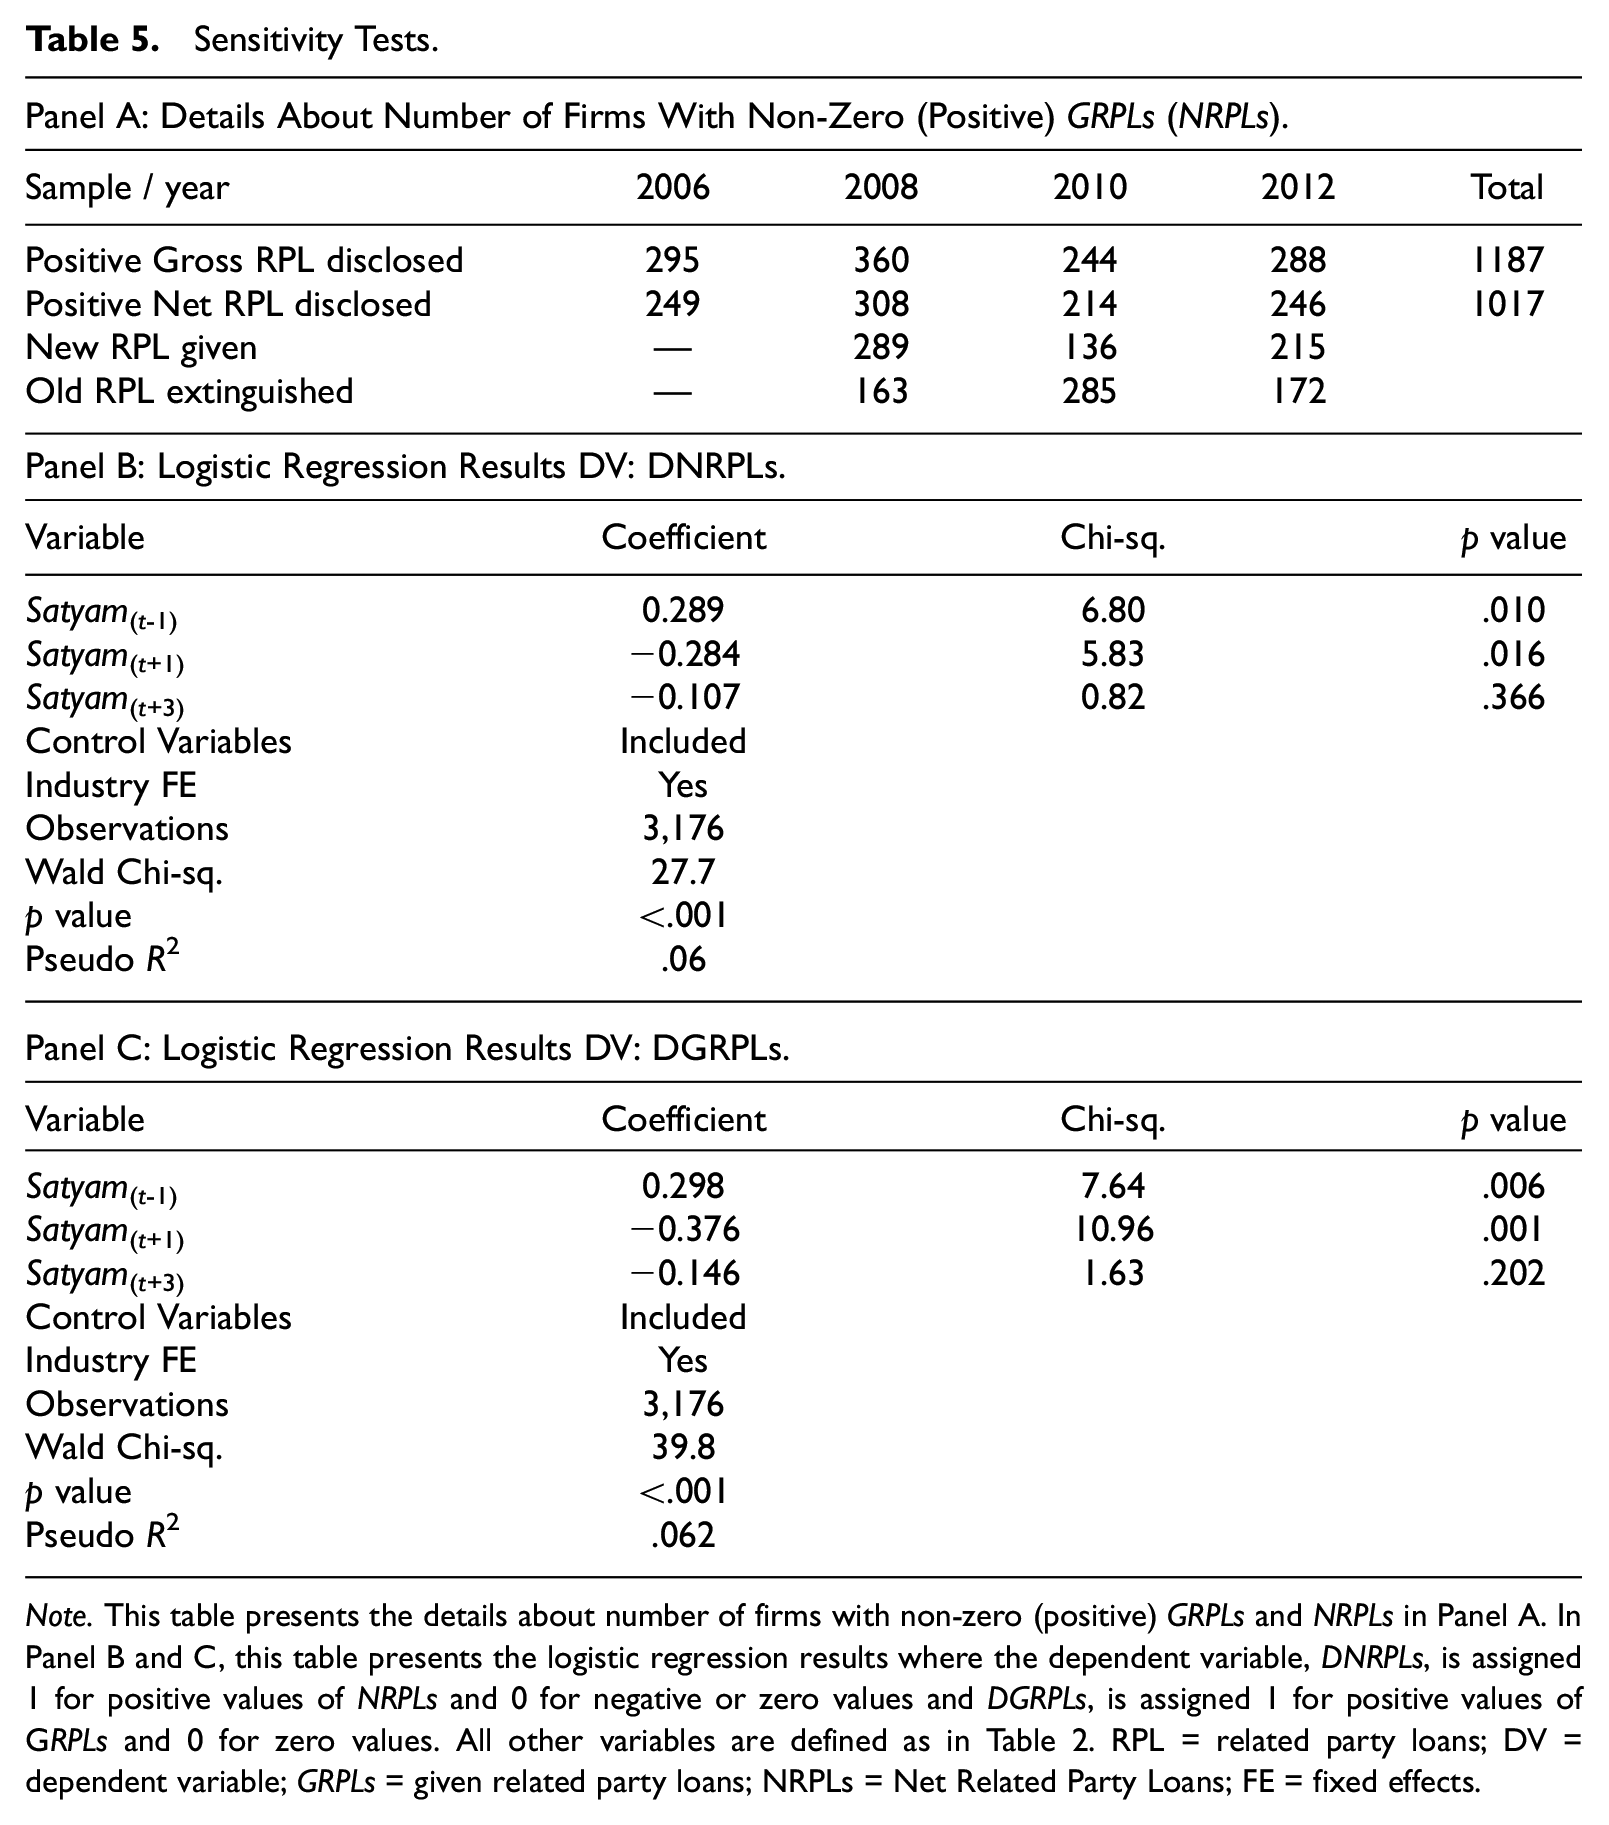
Note. This table presents the details about number of firms with non-zero (positive) GRPLs and NRPLs in Panel A. In Panel B and C, this table presents the logistic regression results where the dependent variable, DNRPLs, is assigned 1 for positive values of NRPLs and 0 for negative or zero values and DGRPLs, is assigned 1 for positive values of GRPLs and 0 for zero values. All other variables are defined as in Table 2. RPL = related party loans; DV = dependent variable; GRPLs = given related party loans; NRPLs = Net Related Party Loans; FE = fixed effects.
In Panels B and C of Table 5, we provide the results from two logistic regressions. The dependent variable in Panel B is the disclosure of a positive net RPL (1 if positive, 0 if not). In Panel C, the dependent variable is the disclosure of non-zero gross RPL (1 if the gross RPL is positive, and 0 if not). The logistic regression results reinforce the results from the primary analysis shown in Table 3: there is a significant decline in RPLs post-Satyam.
The Impact of The Companies Act (2013)
In 2013, India witnessed significant legal reform in the form of revisions to Companies Act 1956. Multiple sections of The Companies Act (2013), including Section 185 (loans to directors), Section 186 (loan and investment by the company), and Section 188 (related party transactions), were aimed at increasing the transparency in transactions with related parties and mitigating the abuse of minority shareholders by the insiders. One of the most significant reforms in the 2013 Act was the prohibition of companies from providing any loans, guarantees, or security to the directors or any of their related entities. Section 185 of the Act states that:
No company shall, directly or indirectly, advance any loan, including any loan represented by a book debt to, or give any guarantee or provide any security in connection with any loan taken by (a) any director of company, or of a company which is its holding company or any partner or relative of any such director; or (b) any firm in which any such director or relative is a partner.
This requirement applied to companies with common directors, especially within a business group where directors occupy seats on multiple companies of the group. It created significant hurdles for companies that provide loans to their subsidiaries for operational purposes. The 2013 Act was followed by an amendment in 2015 that slightly relaxed this restriction by allowing the holding companies to provide loans, guarantees, or security to their wholly-owned subsidiaries as long as these loans are utilized for principal business activities.
To examine the effect of these legal reforms, we collected data on RPLs for the period 2013 to 2017. We provide these results in Table 6. In Panel A, we observe a steady increase in the mean values of NRPLs post-Satyam, reaching 1.18% of total assets in 2013. As expected, we observe a slight decrease for mean NRPLs in the year 2015 (M = 1.13%) before the value increases back to 1.43% in 2017. We find a similar trend in GRPLs for the same period, where GRPLs reaches 1.98% of total assets in 2013, followed by a slight decrease in 2015 and a subsequent increase in 2017.
The Impact of The Companies Act (2013).
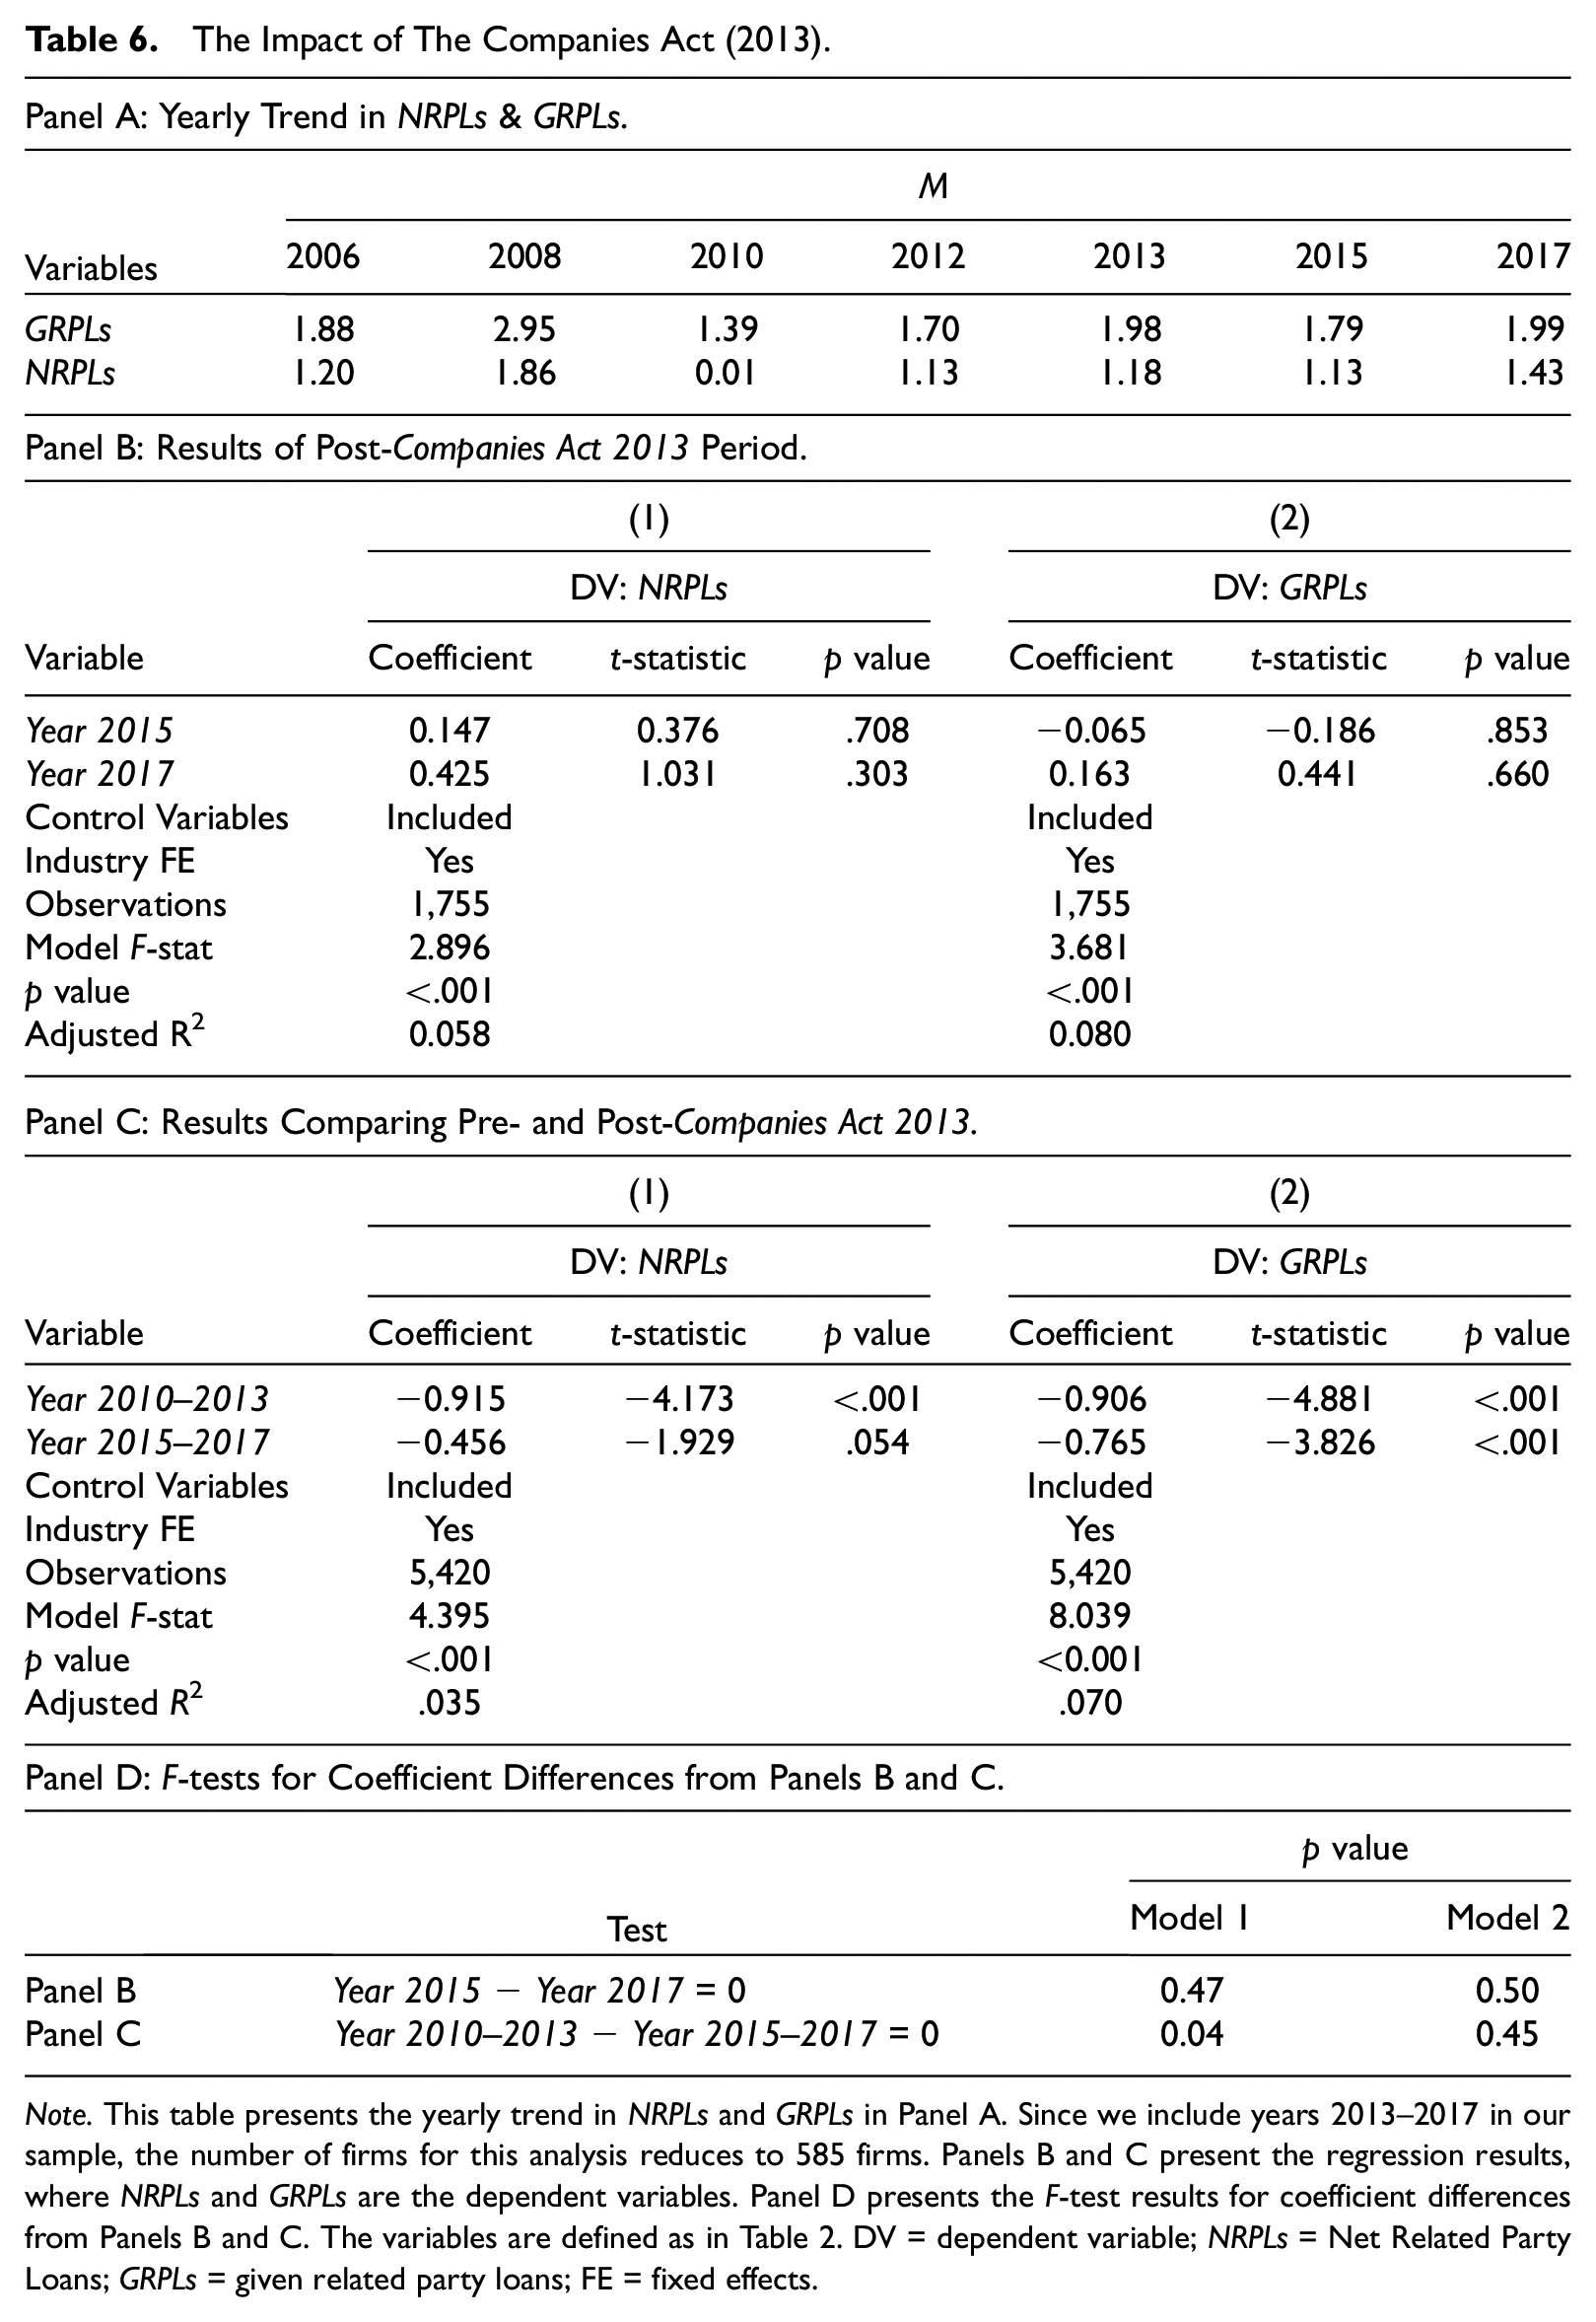
Note. This table presents the yearly trend in NRPLs and GRPLs in Panel A. Since we include years 2013–2017 in our sample, the number of firms for this analysis reduces to 585 firms. Panels B and C present the regression results, where NRPLs and GRPLs are the dependent variables. Panel D presents the F-test results for coefficient differences from Panels B and C. The variables are defined as in Table 2. DV = dependent variable; NRPLs = Net Related Party Loans; GRPLs = given related party loans; FE = fixed effects.
Furthermore, in our regression analyses in Panel B of Table 6, after controlling for other variables, we do not find a significant difference in NRPLs in the year 2015 and 2017 in comparison to 2013. Next, we compare the coefficients of NRPLs between 2015 and 2017 (Panel D of Table 6). We do not find any significant difference in NRPLs in these two years. Thus, there is no statistically significant difference in the level of NRPLs in the years 2013, 2015, and 2017.
As shown in Panel C of Table 6, we compare the level of NRPLs in the period before Satyam, that is, 2006–2008, with the period between Satyam failure and The Companies Act of 2013 (2010–2013), and years after The Companies Act of 2013 (2015–2017). We find that NRPLs in 2010–2013 and 2015–2017 are both significantly lower than in the 2006–2008 period. We find a similar pattern in the value of GRPLs for the different time periods.
Next, we compare the coefficients of the period 2010–2013 with 2015–2017 as shown in Panel D of Table 6. We see a significant increase (at p < .05) in NRPLs in 2015–2017 compared with the 2010–2013 period. However, we do not find a significant difference in GRPLs between these periods. It indicates that while loans given to related parties remain the same in 2010–2013 and 2015–2017, a decrease in borrowings from related entities led to the rise of NRPLs. Our results are similar for balanced as well as for the unbalanced panel of firms (not reported in tables for brevity).
In a significant rollback of the restrictions put forth by The Companies Act of 2013, The Companies (Amendment) Act 2017 allowed the companies to advance a loan to any other person in whom a director is interested subject to prior approval of the shareholders by a special resolution. It also required that the borrowing company must utilize these loans for its principal business activities and not for further issuance of loans or investments. 8
An interesting issue for future research is to examine the effect of the rollback by the 2017 amendment act on the magnitude of related party loans. Furthermore, future research could also examine the impact of these reduced RPLs on strategic benefits accruing to the companies in the form of lower cost of debt and or changes in the earnings response coefficients.
Summary and Discussion
The failure of Satyam Computer Systems (“Satyam”) in India had a major impact on the Indian market and brought corporate governance related issues to the forefront. In this study, we investigate the impact of the Satyam failure on RPLs by Indian public companies. We use a sample of a balanced panel of 794 firms with data available for fiscal years 2006, 2008, 2010, and 2012. In univariate analyses, we observe an increase in net RPLs from 2006 to 2008 (from 1.95% to 2.37% of assets) but this is followed by a sharp decline from 2008 to 2010 (down to 0.23% of assets); this decrease does not fully reverse by 2012, since the mean net RPL in 2012 is 1.02% of assets. After controlling for various firm and governance related factors, we find that the RPLs are significantly lower in 2010 compared with 2006, and that the RPLs in 2012 continue to be lower than the levels of 2006. Overall, our results indicate that net RPLs declined significantly after the Satyam failure.
When we partition the full sample based on various proxies for levels of external monitoring, we find that the decline in related party lending post-Satyam is more prominent in smaller firms, firms audited by non-Big four auditors, and firms with lower institutional ownership. Thus, the results indicate that the Satyam effect—at least with respect to RPLs—was more pronounced in firms with lower levels of external monitoring.
Our results contribute to the understanding of the impact of a major corporate governance failure on the internal capital markets in India. Our results also are timely, given the recent focus of Indian regulators on the need for additional disclosures and restrictions on RPTs (SEBI, 2020). The results also add to the body of evidence about the effects of the Satyam failure on Indian corporate governance.
Narayanaswamy et al. (2015) find that the Satyam scandal did not have a significant impact on audit committee diligence (number of meetings and director attendance at such meetings) in Indian firms. However, we find that there is a significant Satyam effect on RPLs. One interpretation of the differing findings is that there can be substantive changes in the decisions made by boards of directors, even if there was no outward change in publicly disclosed details about the meetings (i.e., number of meetings and director attendance at such meetings) of audit committees or boards of directors where such decisions are taken. Thus, our results also suggest that while reliance on publicly disclosed measures such as audit committee meetings and attendance at such meetings (i.e., “form”) are perhaps justified because they often are the only measures publicly disclosed in regulatory filings, such reliance on publicly disclosed measures as a proxy for director diligence and decisions taken at such meetings (i.e., “substance”) has limitations. Hence, inferences based on publicly disclosed measures such as meetings and attendance must be made with caution. That is, there can be substantive changes in operational decisions without observable changes in governance.
The other interpretation of differing findings is that auditors became more vigilant after the Satyam scandal which led to decrease in RPLs. For example, in the United States, the media and the regulators held the auditors responsible for poor quality audits of Enron (Feldmann & Read, 2010). Cahan and Zhang (2006) find that successor auditors became more conservative for their ex-Andersen clients after the Enron scandal. Similarly, after the Satyam failure, popular press, analysts, and institutional investors raised questions over the auditing practices of Satyam’s auditors (Knowledge@Wharton, 2009). Subsequently, the federal investigating agency of India, the Central Bureau of Investigation (CBI), accused the auditors of colluding with management and “intentionally” failing to apply standard audit practices (“Auditors in on Satyam Fraud: CBI,” 2009). In 2011, U.S. Securities and Exchange Commission also imposed a penalty of USD 6 million on Satyam’s auditors for their failure to detect the accounting manipulations over the past 8 years (SEC, 2011). SEC (2011) finds that “The audit failures by the PW India affiliates . . . were not limited to Satyam, but rather indicative of a much larger quality control failure throughout PW India.”
In such an environment, we expect that auditors behave conservatively and become more cautious about transactions that carry a higher risk of fraud and litigation. Since related party lending carries a greater risk of wealth expropriation, we suggest that auditor conservativeness, a real threat of litigation, and increased awareness among stakeholders could have led to improved audit quality of publicly listed companies in India, resulting in a significant decline in RPLs. Future research can empirically test whether the auditors in India became more conservative after the Satyam scandal and the subsequent passage of The Companies Act in 2013.
Supplemental Material
sj-docx-1-jaf-10.1177_0148558X211048146 – Supplemental material for The Satyam Effect on Related Party Loans in India
Supplemental material, sj-docx-1-jaf-10.1177_0148558X211048146 for The Satyam Effect on Related Party Loans in India by Narendra Nath Kushwaha and Bipin Kumar Dixit in Journal of Accounting, Auditing & Finance
Footnotes
Acknowledgements
We are grateful to the editor-in-chief, associate editor of Journal of Accounting, Auditing & Finance and an anonymous reviewer for their constructive feedback and comments.
Declaration of Conflicting Interests
The author(s) declared no potential conflicts of interest with respect to the research, authorship, and/or publication of this article.
Funding
The author(s) received no financial support for the research, authorship, and/or publication of this article.
Supplemental Material
Supplemental material for this article is available online.
Notes
References
Supplementary Material
Please find the following supplemental material available below.
For Open Access articles published under a Creative Commons License, all supplemental material carries the same license as the article it is associated with.
For non-Open Access articles published, all supplemental material carries a non-exclusive license, and permission requests for re-use of supplemental material or any part of supplemental material shall be sent directly to the copyright owner as specified in the copyright notice associated with the article.