
Abstract
We demonstrate that investors in initial public offering (IPO) firms value revenues and that the number of U.S. Securities and Exchange Commission (SEC) revenue recognition comment letters issued on the S-1 registration statement are positively associated with reported revenues. We also find that IPO managers report revenues opportunistically in the fiscal year just prior to the offer. In additional analysis, we find that discretionary revenues are associated with significantly higher first day IPO stock returns but significantly lower 1 year stock returns. Our results are consistent with the incentives of managers to report revenues opportunistically outweighing the higher monitoring and regulatory scrutiny pre-IPO.
Introduction
The U.S. initial public offering (IPO) market is a well-known setting in which the heightened information asymmetry between managers and investors creates an opportunity for managers to overstate financial performance to increase the offering price (Ball & Shivakumar, 2008; DuCharme et al., 2001; Friedlan, 1994; Teoh, Welch, & Wong, 1998; Teoh, Wong, & Rao, 1998; Venkataraman et al., 2008). While the prior research is mixed as to whether managers do in fact report opportunistically in the IPO setting, the common theme among this literature is the use of earnings-based discretionary accruals as the financial metric of interest. However, anecdotal evidence from the popular press suggests that revenues of IPO firms are the most important financial metric because “Investors look at share value and revenue. Nothing else” (Lurie, 2017). The importance of IPO firm revenues can also be seen in light of IPOs with net losses pricing above range and continuing to be traded high. 1
In contrast to the vast stream of literature that has emerged over the decades focusing on the earnings management of IPO firms, little attention has been paid to the revenue management of IPO firms. The lack of research on the revenue management of IPO firms is puzzling in light of prior research by Ertimur et al. (2003) who find that investors attach more importance to sales growth of growth companies than for value companies. Jegadeesh and Livnat (2006) further argue that revenue growth is an important driver of firm valuation, particularly for small firms. In addition, Rees and Sivaramakrishnan (2007) find evidence consistent with earnings and revenues being alternative information signals and that the market places a greater emphasis on revenues for high-growth firms.
Because IPO firms are often also small firms and/or growth firms, we argue that investors are likely also valuing the revenues of IPO firms. As such, our understanding of the opportunistic behavior of IPO firms can be improved by examining their revenue management behavior as opposed to solely studying their earnings management behavior.
To further our understanding of whether IPO managers are incentivized to manage revenues, we first investigate the value relevance of revenues in a large sample of IPO firms. Specifically, we examine whether revenues are associated with IPO offering price. We focus our valuation tests on offering price because a higher offering price provides two benefits to issuers: “Shares retained by the entrepreneur are worth more and more cash is received for the secondary shares sold” (DuCharme et al., 2001, p. 370). Consistent with managers having an incentive to manage revenues, we find that revenues are value-relevant to the IPO offering price. We also find that earnings are not value-relevant to the IPO offering price, which is consistent with Armstrong et al. (2016).
We then further decompose earnings and revenues into discretionary and nondiscretionary components to better understand their respective value relevance. We find that both discretionary revenues and nondiscretionary revenues are value-relevant to offering price. We do not find evidence that either the nondiscretionary or the discretionary accrual components of earnings are value-relevant. Thus, while Armstrong et al. (2016) similarly conclude from their analysis that inflated accruals do not benefit managers in the form of higher offering price, we provide evidence that managers do benefit from inflated revenues. These results support our argument that managers of IPO firms are incentivized to manage revenues, rather than earnings, and that to better understand managerial opportunism in the IPO setting we should examine the discretionary reporting of revenues.
We also examine U.S. Securities and Exchange Commission (SEC) revenue recognition comment letters issued pertaining to the initial registration statements of IPO firms (S-1) and the 10-K of publicly traded firms. We find that revenues are positively associated with the number of revenue recognition comment letters issued for IPO firms (S-1), while revenues are not associated with the number of revenue recognition comment letters issued for publicly traded firm (10-K). 2 These results suggest that the SEC more closely scrutinizes the revenues of IPO firms, relative to publicly traded firms.
We then examine the levels of discretionary revenues reported by IPO firms in their pre-IPO financial statements compared to discretionary revenues reported by the same firm for the fiscal year immediately after the offer (hereinafter, post-IPO). Using a sample of 1,102 unique IPO firms over the years 2000–2013, we find that discretionary revenues are higher in the pre-IPO period than in the post-IPO period. This result suggests that IPO managers report revenues opportunistically in the pre-IPO year, consistent with their incentives. In contrast, we find that discretionary accruals are lower in the pre-IPO period than in the post-IPO period. 3 That we find evidence of opportunistic financial reporting pre-IPO using discretionary revenues, but not with earnings-based accrual measures, illustrates the importance of using a proxy for managerial opportunism (revenues) that is valued by investors. 4
In additional analysis, we examine how revenue management by pre-IPO firms affects the stock performance of the firm after their IPO, using first day IPO returns, 6-month IPO returns, and 1-year IPO returns. We find that firms in the lowest quartile of discretionary revenues pre-IPO exhibit significantly lower first-day IPO returns than firms in the highest quartile of discretionary revenues. However, we find that after 1 year, firms in the lowest quartile of discretionary revenues pre-IPO exhibit significantly higher stock returns than firms in the highest quartile of discretionary revenues. These results suggest firms with the largest discretionary revenues exhibit significantly higher first day stock returns than firms with the lowest discretionary revenues, but that after one year the opposite is true; IPO firms with the lowest discretionary revenues outperform firms with the largest discretionary revenues.
The results from our study contribute to our understanding of which financial metrics are value-relevant to investors in IPO firms. Our results also contribute to a vast stream of IPO literature that has sought to better understand whether managers of IPO firms report opportunistically, but has historically only considered earnings. By identifying that revenues are value-relevant to IPO investors, we are able to conduct a more powerful test of the hypothesis that managers report opportunistically pre-IPO.
Our results also extend contemporaneous work by Fedyk et al. (2017) who predict and find evidence of systematically different financial statement management behaviors across STEM and Non-STEM IPO firms. 5 However, they do not consider the offering price for purposes of their value relevance testing, and also do not consider the additional scrutiny IPO firms garner pre-IPO in the context of their managerial opportunism testing. 6 We find that the SEC more closely scrutinizes the revenues of pre-IPO firms, relative to publicly traded firms, based on our analysis of SEC comment letters issued pertaining to revenue recognition.
We also contribute to a growing stream of literature on the determinants of SEC comment letters (Ettredge et al., 2011; Johnston & Petacchi, 2017; Kubick et al., 2016). We find an association between IPO firm revenues and the number of SEC revenue recognition comment letters issued (S-1 filings), but no association between publicly traded firm revenues and the number of comment letters issued (10-K filings).
Our results should be of interest to the SEC and the Public Company Accounting Oversight Board (PCAOB). While we find that the SEC frequently issues comment letters pertaining to IPO firm revenues, our results suggest that this should be a continued point of emphasis of the SEC. 7 Our study should also be of interest to the United States Congress, given that pre-IPO auditor litigation risk does not appear to be sufficiently high to the auditor. Our results are in contrast to the conclusion from Venkataraman et al. (2008) that pre-IPO litigation risk to auditors is sufficiently high given that we find that pre-IPO discretionary revenues are significantly higher than post-IPO.
The rest of our paper is organized as follows. The next section reviews the relevant prior literature and develops our hypotheses. We then present sections on our research methodology and results. The last section summarizes and concludes our paper.
Literature Review and Hypotheses Development
Opportunistic Financial Reporting of IPO Firms
Early studies examining the opportunistic financial reporting of IPO firms argued that the heightened information asymmetry prior to the IPO creates an opportunity for managers to inflate financial performance to increase the offering price. Friedlan (1994) provides evidence that IPO issuers make income-increasing discretionary accruals in the prospectus because reporting strong financial performance should lead to a higher IPO price. Two subsequent studies, by Teoh, Welch, and Wong (1998) and Teoh, Wong, and Rao (1998) find that discretionary accruals decrease in the 6 years after the IPO. They argue that discretionary accruals reverse in subsequent years because management is inflating earnings with discretionary accruals in the years prior to the IPO.
Litigation Risk and Increased Scrutiny of IPO Firms
More recent IPO research has argued that while IPO managers have an incentive to manage earnings in the financial statements issued just prior to the offering, they also face increased litigation risk and additional scrutiny, relative to firms that have been publicly traded for some time. DuCharme et al. (2001, p. 373) discuss that Section 11 of the Securities Act of 1933 (hereinafter, the 1933 Act) imposes increased litigation risk on the issuer because investors can bring suit if the registration statement contains “an untrue statement of a material fact or omitted a material fact necessary to make the statements not misleading.”
Venkataraman et al. (2008) further argue that discretionary accruals should be lower in the year prior to the IPO than in the year of the IPO because auditors face greater legal liability for the pre-IPO year audited financials, which are governed by the 1933 Act, than the post-IPO year audited financials, which are governed by the Securities Exchange Act of 1934 (hereinafter, the 1934 Act). Legal exposure to the auditor is higher under the 1933 Act because the auditor is required to demonstrate that they exercised due diligence as opposed to the lower threshold of good faith under the 1934 Act. 8 While auditors are akin to gatekeepers in the IPO setting (Leone et al., 2013), Big 4 auditors may be more sensitive to the increased litigation risk pre-IPO and constrain the revenue management of firms, relative to non-Big 4 auditors, because Big 4 auditors have “more to lose” from audit failure of a given client, and protect their reputation by providing a higher level of audit quality (DeAngelo, 1981, p. 185). In addition, Francis (2004, p. 352) argues that Big N auditors provide higher audit quality, as a result of either “more audit effort (more hours) or through greater expertise of the auditor (higher billing rates).” 9
Venkataraman et al. (2008) compare discretionary accruals in the pre-IPO year to the discretionary accruals of the same firm in the post-IPO year. They provide evidence that discretionary accruals are lower in the pre-IPO year than in the post-IPO year, contrary to Friedlan (1994), Teoh, Welch, and Wong (1998) and Teoh, Wong, and Rao (1998), and conclude that auditor conservatism in the pre-IPO year leads to lower discretionary accruals.
Ball and Shivakumar (2008) similarly take a contrarian view of the early IPO earnings management literature, discussing that increased scrutiny from a variety of parties: regulators, analysts, investors, auditors, litigants, and the press, should curtail pre-IPO opportunistic reporting. Ball and Shivakumar (2008) also question the efficacy of using discretionary accruals in the IPO setting.
More recently, Armstrong et al. (2016) adjust discretionary accruals for size, age and growth by using a model that matches IPO firms to non-IPO firms on propensity score, industry and year. Their results show that in the post-IPO year, discretionary accruals are higher for IPOs that occur earlier in the fiscal year than later. However, they do not estimate the discretionary accruals for the pre-IPO year and compare them to the post-IPO year. Consequently, it is unclear whether the inferences of Venkataraman et al. (2008) still hold with the model used by Armstrong et al. (2016). In addition, Armstrong et al. (2016) find that discretionary accruals are not value-relevant in an IPO setting.
Revenues in the IPO Setting
Most IPO firms are typically growth firms (Brav et al., 2009) and are seeking equity financing to expand market share with new products and market territory. Issuing equity provides an incentive for management to inflate revenues (Marquardt & Wiedman, 2004). For IPO firms, net income is likely a less reliable performance measure, because IPO firms are generally unprofitable. 10 For example, Armstrong et al. (2016, p. 1327) report that average earnings before extraordinary items (and operating cash flow) are negative for their sample of IPO firms.
Furthermore, revenues are subject to discretion and represent a large portion of the earnings discretion available to firms (Stubben, 2010). Revenue growth is also likely the greatest driver of firm valuation, particularly for small firms (Jegadeesh & Livnat, 2006). Prior research further suggests that management inflates revenues to meet analyst revenue benchmarks (Plummer & Mest, 2001), to increase the value of personal stock holdings (Rees & Sivaramakrishnan, 2007), and to increase managerial compensation (Edmonds et al., 2013). The market also rewards firms more for meeting or beating analyst revenue benchmarks than expense benchmarks, and the reward is even greater for growth firms (Ertimur et al., 2003).
We support our argument that revenues will be more value-relevant to IPO offering price than earnings for at least three reasons. First, investors attach more importance to revenue growth for growth firms (Ertimur et al., 2003). Second, revenue is an important metric in the valuation of small firms (Jegadeesh & Livnat, 2006). Finally, the market places greater emphasis on revenues for high-growth firms (Rees & Sivaramakrishnan, 2007) than nongrowth firms. The inferences from these prior studies should apply to IPO firms, because they too are often small but growing firms (Brav et al., 2009). Anecdotal evidence in the popular press further supports the notion that revenue is a more relevant performance measure to investors than earnings. 11 As such, we predict revenue will be more value-relevant to investors than earnings in IPO firms.
Pre-IPO Scrutiny—SEC Comment Letters
While the Sarbanes-Oxley Act requires the SEC to review a company’s 10-K filing at least once every three years, the SEC reviews all initial registration statements (S-1 filings) for IPO firms (Cassell et al., 2013; Ertimur & Nondorf, 2006). Given that this pre-IPO registration statement is often the first financial information that will be made available to the public, the S-1 filing is typically subject to a detailed review by the SEC (McKeon, 2016). The SEC states that their review of company filings is conducted from the potential investor’s perspective (USSEC, 2017). SEC reviews are intended to identify disclosures that are not in compliance with SEC rules or the applicable accounting standards as well as to identify “disclosure that appears to be materially deficient in explanation or clarity” (USSEC, 2017). If the SEC issues a comment letter pertaining to the S-1, the firm must respond in a satisfactory manner to the SEC before the registration statement can be finalized.
While the prior literature has extensively studied the opportunistic earnings management behavior of IPO firms, it is unclear whether the SEC review of S-1 filings plays a role in either detecting or deterring the revenue management of IPO firms. For one, the SEC states that their review of company filings “does not evaluate the merits of any transaction” and that the review process “is not a guarantee that the disclosure is complete and accurate” (USSEC, 2017). In a small sample of 130 IPO firms over the years 2004–2005, Ertimur and Nondorf (2006) report descriptive evidence that 52.6% of first round comment letters pertain to the IPO firm’s method of accounting for revenues while 16.8% of first round comment letters pertain to the IPO firm’s earnings or cash flows. The univariate nature of this evidence however does not control for the usual firm characteristics that potentially confound these findings.
Anecdotal evidence suggests that the SEC does have a keen interest in the revenue recognition practices of IPO firms. The SEC issued comment letters to 95% of technology, media, and telecommunication firms that went public in 2015 pertaining to revenue recognition (Proskauer Rose LLP, 2016). While this evidence is limited to 2015, it does provide further support for the argument that revenue recognition practices of IPO firms are closely scrutinized by the SEC.
However, Cassell et al. (2013) find in a sample of publicly traded firms (10-K filings) that loss firms are more likely to receive an SEC comment letter. Given that a majority of IPO firms are unprofitable it is plausible that it is the earnings of IPO firms that are closely scrutinized by the SEC, and that the revenues of IPO firms are not closely scrutinized by the SEC. Furthermore, Cassell et al. (2013) include sales growth in their analysis but do not find an association between this metric and the likelihood of firms receiving an SEC comment letter.
To test whether the SEC more closely scrutinizes the revenues of IPO firms compared to publicly traded firms, we examine the association between the number of revenue-related SEC comment letters issued to IPO firms on their S-1 and their reported revenues, compared to publicly traded firms on their 10-K. 12 Given that anecdotal evidence and empirical evidence suggests that the revenues of IPO firms are more closely scrutinized by the SEC than for publicly traded firms, we state our second hypothesis as follows:
Discretionary Revenues, Discretionary Accruals, and Discretionary Expenses of IPO Firms
In light of empirical and anecdotal evidence suggesting that revenues rather than earnings of IPO firms are likely of significant interest to investors and regulators, we compare the pre-IPO and post-IPO discretionary revenues and discretionary accruals reported by these firms. We conduct this analysis to better understand whether managers of IPO firms report revenues and/or earnings opportunistically.
The prior research on the opportunistic behavior of IPO managers can be summarized by the opposing arguments that managers are incentivized to report opportunistically but increased scrutiny constrains their ability to do so with the empirical results being mixed. While discretionary accruals have been used in this line of research to study opportunistic managerial behavior, Armstrong et al.’s (2016) finding that discretionary accruals are not value-relevant to IPO investors casts doubt on the validity of the inferences drawn from these prior studies. As such, we make no prediction as to whether opportunistic financial reporting by IPO managers is different pre-IPO versus post-IPO, using discretionary revenues and discretionary accruals as our test variables.
Stubben (2010) argues that discretionary revenue models are more likely to detect manipulation when both revenues and expenses are manipulated, relative to discretionary accrual models. Because discretionary accrual models consist of both revenues and expenses, accrual models will not detect manipulations when revenues and expenses are managed in opposite directions. We therefore also examine discretionary expenses between the pre-IPO year and the post-IPO year. Given the incentives of management, to offset their reporting of discretionary revenues with discretionary expenses, and the increased scrutiny surrounding the IPO we make no prediction as to whether discretionary reporting of expenses is different pre-IPO versus post-IPO.
Data and Sample
We start our analysis by examining the respective value relevance of revenues and earnings for IPO offering value (H1a). We then further decompose revenues and earnings into discretionary and nondiscretionary components to better understand the value relevance of these items (H1b). We start with 2,258 U.S. IPO firms identified on the SDC database from 2000 to 2013. We drop 472 firms with missing Compustat data, 38 American Depository Receipts (ADRs) and Unit IPOs (Venkataraman et al., 2008), 246 financial firms, and 444 firms without the necessary data to calculate control variables. This sample selection criteria yields 1,058 unique IPO firms.
To investigate whether the SEC closely scrutinizes the revenues of IPO firms (H2a) and whether the SEC closely scrutinizes the revenues of publicly traded firms (H2b), we examine the revenue recognition comment letters issued pursuant to S-1 filings and 10-K filings. We use the Audit Analytics comment letter dataset to obtain comment letters issued for S-1 filings and 10-K filings issued from August 1, 2004 to December 31, 2013. We begin with 1,767 comment letters issued for S-1 filings and 13,267 comment letters issued for 10-K filings (firm/year observations). Sample selection criteria to identify firms with all necessary financial information used in our test of H2 yields a sample of 1,072 IPO firms that received at least one comment letter on their S-1 filings and 12,693 publicly traded firms that received at least one comment letter on their 10-K filings.
To examine whether opportunistic financial reporting differs between the pre-IPO year and the post-IPO year (H3a, H3b, and H3c), we measure discretionary revenues, discretionary accruals, and discretionary expenses for the same firm in both periods. Our pre-IPO and post-IPO research design matches firms on all relevant observable and unobservable firm characteristics and allows us to isolate the effect of management incentives on financial reporting quality. Our test of H3 utilizes the same sample selection procedure as in H1, resulting in 1,102 unique IPO firms and 2,204 firm-years with all necessary financial information.
Research Design
IPO Value Relevance of Revenues and Earnings
We first investigate whether revenues and/or earnings reported in t-1 (the pre-IPO period) are value-relevant to the IPO firm’s offering value. We then further decompose earnings and revenues into discretionary and nondiscretionary components to examine the value relevance of these items. We modify the valuation models used by Kim and Ritter (1999), Fan (2007), Aggarwal et al. (2009), and Fedyk et al. (2017) to test the value relevance of revenues and earnings. We use Equations 1a and 1b to test H1a and Equations 1c and 1d to test H1b, estimated using OLS as follows:
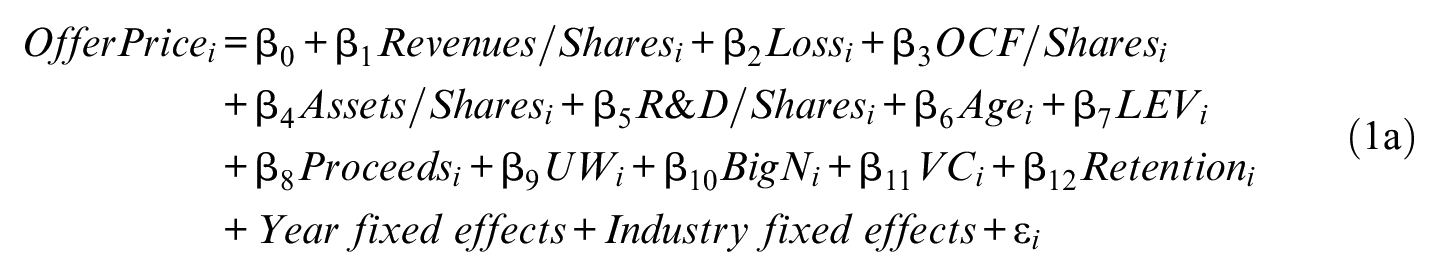
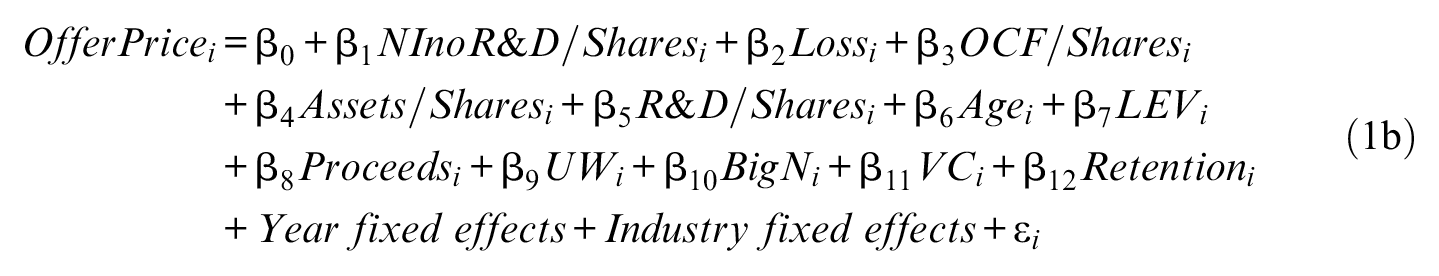
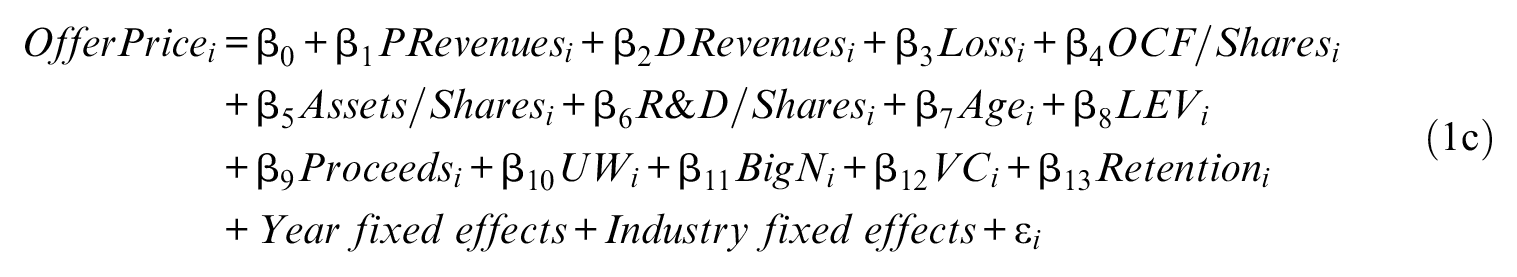
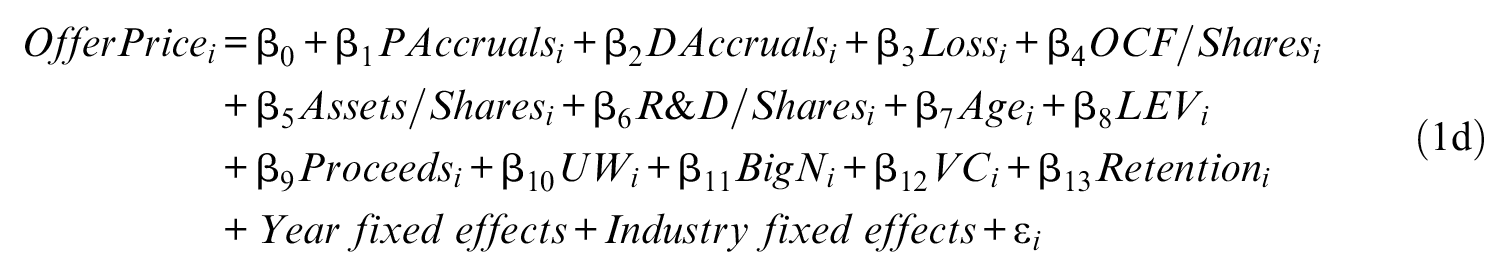
The dependent variable OfferPrice in Equations 1a–1d is the initial offer price when each company in our sample went public. Our variables of interest are Revenues/Shares in Equation 1a, NInoR&D/Shares in Equation 1b, PRevenues and DRevenues in Equation 1c, and PAccruals and DAccruals in Equation 1d. 13
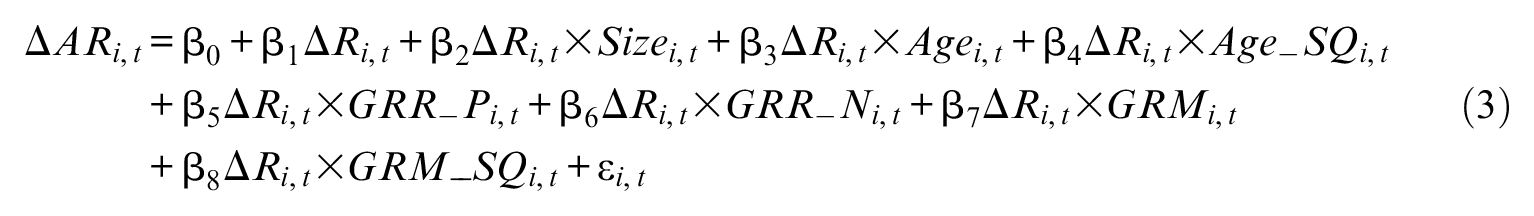
Next, we decompose revenues (Revenues) into discretionary revenues (DRevenues) and nondiscretionary revenue (PRevenues). DRevenues is discretionary revenues, for firm i in the pre-IPO year, estimated as the residual from Equation 3 developed by Stubben (2010) for the pre-IPO year. PRevenues is predicted revenues for firm i, estimated from Equation 3. 14 Similarly, we decompose earnings (NInoR&D) into discretionary accruals (DAccruals) and nondiscretionary accruals (PAccruals). 15
SEC Comment Letters
To better understand whether the SEC closely scrutinizes the revenues of IPO firms (H2a) we examine revenue-recognition SEC comment letters pertaining to the initial registration statement (S-1). We similarly examine revenue-recognition comment letters pertaining to 10-K filings to test H2b. We use the Audit Analytics comment letters dataset to obtain SEC comment letters issued on S-1 filings for all IPO firms and issued on 10-K filings for all publicly traded firms. Next, we examine whether the revenues of IPO firms are associated with the number of revenue-recognition comment letters issued pertaining to S-1 filings, and whether the revenues of publicly traded firms are associated with the number of revenue-recognition comment letters issued pertaining to 10-K filings.
Instead of including S-1 filings and 10-K filings in the same regression model, we estimate the models separately for each filing. We modify the model used in Cassell et al. (2013) to be appropriate for the comment letter sample. We use Equation 2 to test H2a for S-1 filings and H2b for 10-K filings, estimated using OLS as follows:
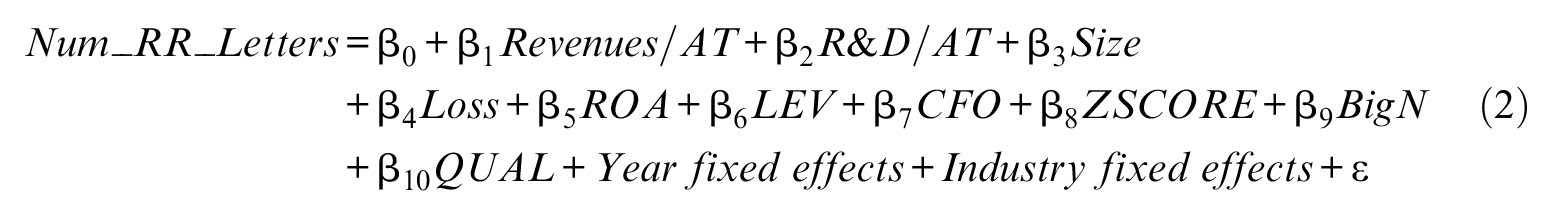
The dependent variable Num_RR_Letters is the number of revenue-recognition comment letters firm i received on their S-1 filing or their 10-K. 16 Our variable of interest is Revenues/AT in Equation 2 for the S-1 filing sample and the 10-K filing sample. Revenues/AT is revenue for firm i in the fiscal year divided by average total assets. 17
Discretionary Revenues, Discretionary Accruals, and Discretionary Expenses
To test whether managers opportunistically report revenues in the pre-IPO period (H3a), we compare the pre-IPO year discretionary revenues to the post-IPO year discretionary revenues. We follow Stubben (2010) and measure DRevenues as the residual from estimating the following Equation 3 by year and industry (two-digit SIC):
To test whether managers opportunistically report earnings in the pre-IPO period, we compare the pre-IPO year discretionary accruals to the post-IPO year. We follow the modified-Jones accruals model (Dechow et al., 1995) and measure DAccruals as the residual from estimating the following Equation 4 by year and industry (two-digit SIC):

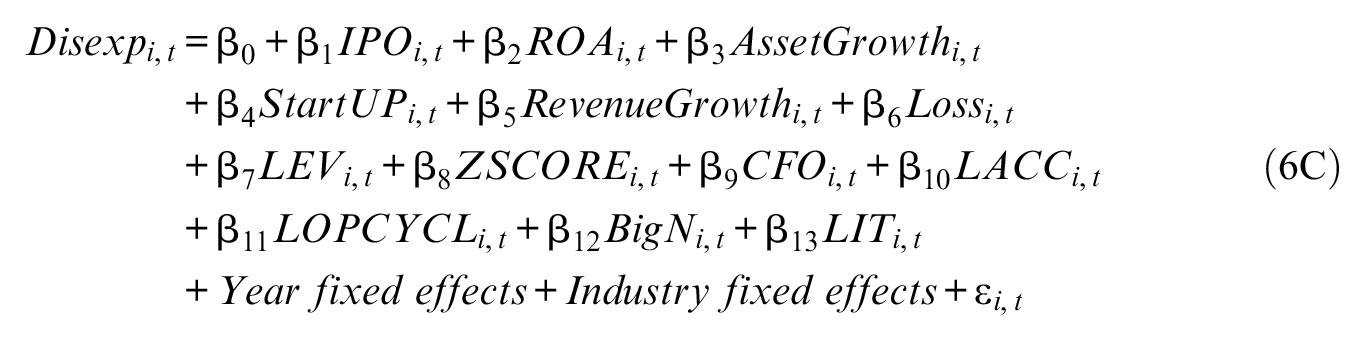
To test whether managers report expenses opportunistically, we follow Roychowdhury (2006) and measure Disexp as the residual from estimating the following Equation (5), by year and industry (two-digit SIC):

where Disexp is discretionary expenditures in fiscal year t, measured as the sum of advertising expense, R&D expense, and SG&A expense, divided by average total assets for the fiscal year. Revenues/AT is revenue for firm i in fiscal year t, divided by average total assets. Under the matching principle, expenses should be recognized in the same reporting period as the related revenues; therefore, we define expenses that are not accounted for by revenues as discretionary expenses (Disexp). We use the entire Compustat universe of firms to estimate each model, rather than only our IPO sample. 18
Next, we test H3a by estimating Equation 6a for each of the three DRevenues measures. 19 We test H3b by estimating Equation 6b for each of the three DAccruals measures, and test H3c by estimating Equation 6c for each of the three Disexp measures. We modify the models used in Venkataraman et al. (2008) and Krishnan and Yu (2012) to be appropriate for IPO firms:
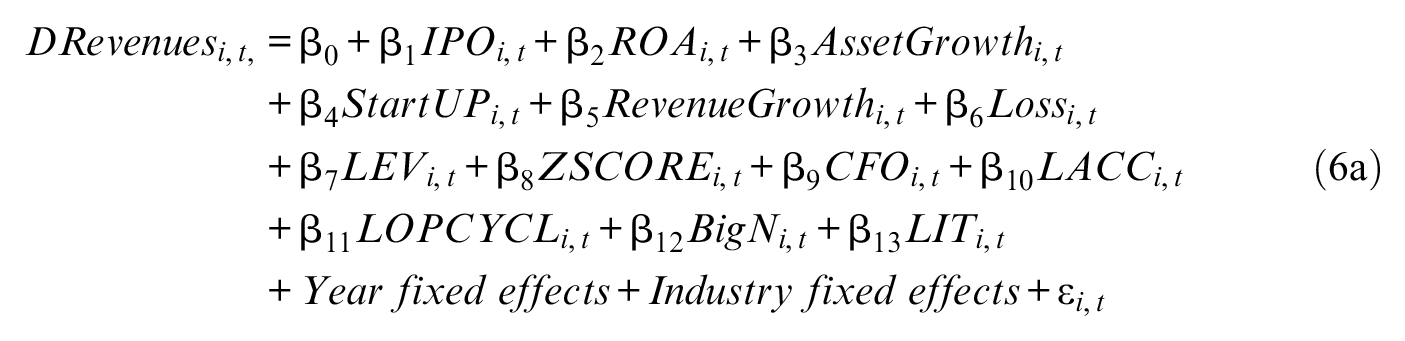
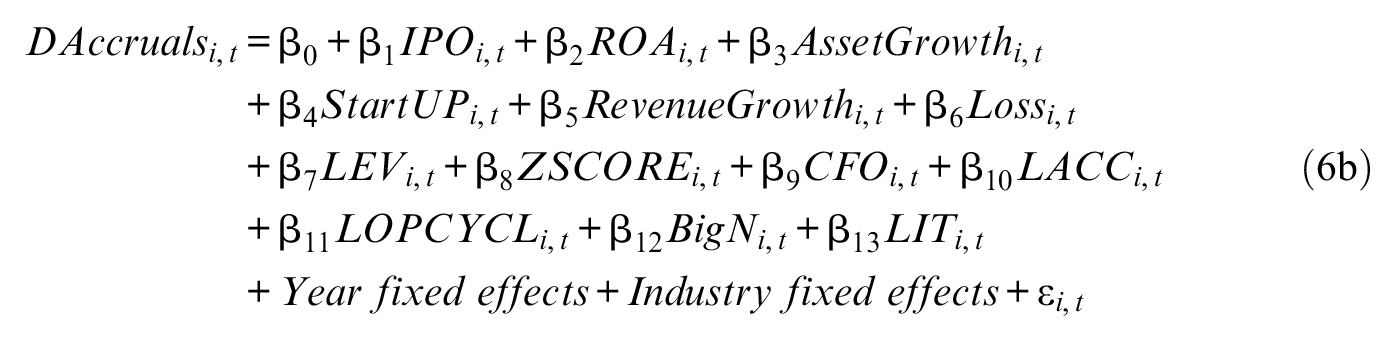
The variable of interest is IPO, and is set equal to 1 if the fiscal year is the pre-IPO year t-1, and 0 if it is the post-IPO year t. 20 If the coefficient on IPO is positive and significant for Equation 6a, it supports the conclusion that IPO firm managers opportunistically report revenues. If the coefficent on IPO is positive and significant for Equation 6b, it supports the conclusion that IPO firm managers opportunistically report earnings. If the coefficent of IPO is positive and significant for Equation 6c, it supports the conclusion that IPO firm managers opportunistically report expenses.
Results
Summary Statistics
Table 1, Panel A tabulates descriptive statistics for the variables used in the IPO valuation sample. We report mean, median and standard deviation of all variables used in Equation 1. The mean (median) pre-IPO discretionary revenue, scaled by average assets, is 0.02 (0.01) and positive. Krishnan and Yu (2012) report higher amounts of discretionary revenue for nonaccelerated filers (0.006) than matched accelerated filers (−0.007) which suggests that the pre-IPO discretionary revenues we report are similar to that of smaller firms. The mean (median) pre-IPO discretionary accruals are −0.10 (−0.04) and negative, which is consistent with Venkataraman et al. (2008).
Summary Statistics.
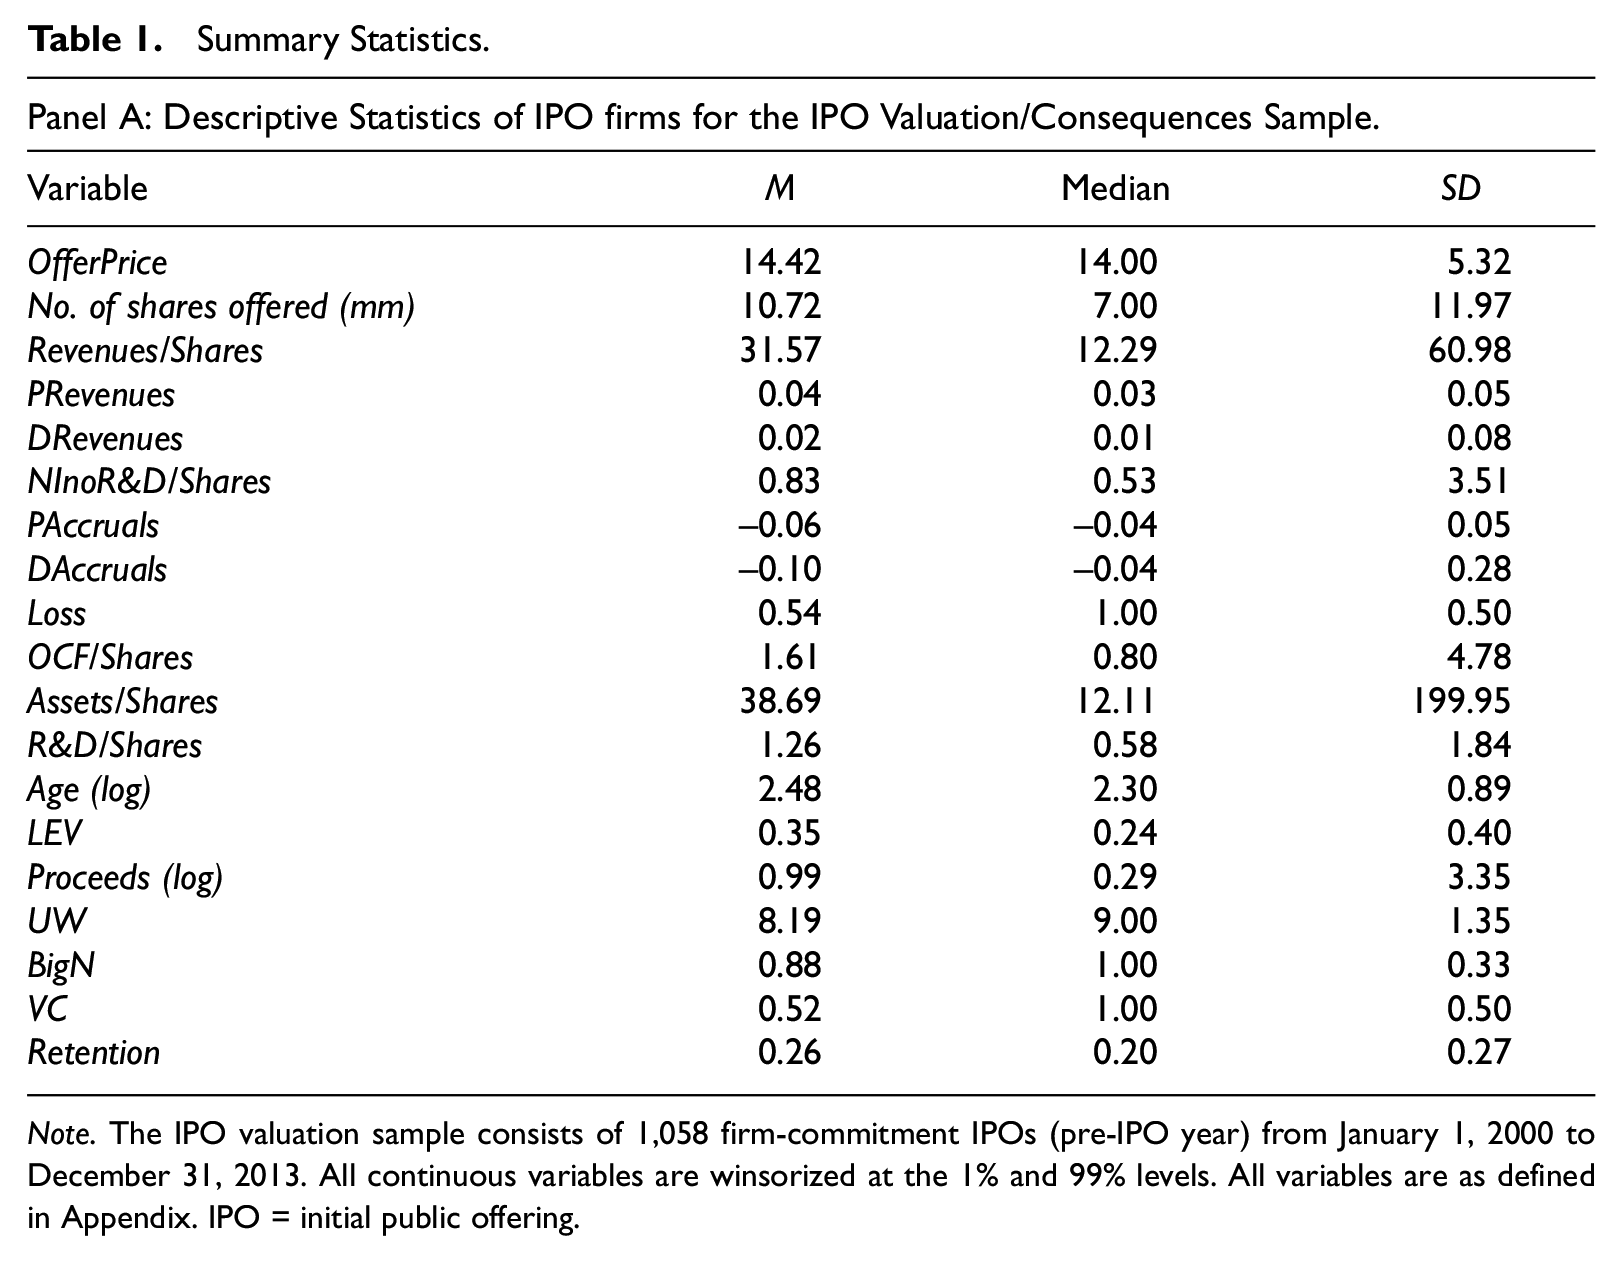
Note. The IPO valuation sample consists of 1,058 firm-commitment IPOs (pre-IPO year) from January 1, 2000 to December 31, 2013. All continuous variables are winsorized at the 1% and 99% levels. All variables are as defined in Appendix. IPO = initial public offering.
Note. The sample for S-1 filings consists of comment letters issued to 1,072 firms on their S-1 filings from January 1, 2004 to December 31, 2013. The sample for 10-K filings consists of comment letters issued to 12,693 firms on their 10-K filings between January 1, 2004 and December 31, 2013. Reported values are means and tests of differences is a paired t-test. Significance at the 10%, 5%, and 1% level is indicated by *, **, and ***, respectively. All continuous variables are winsorized at the 1% and 99% levels. All variables are as defined in Appendix. SEC = Securities and Exchange Commission.
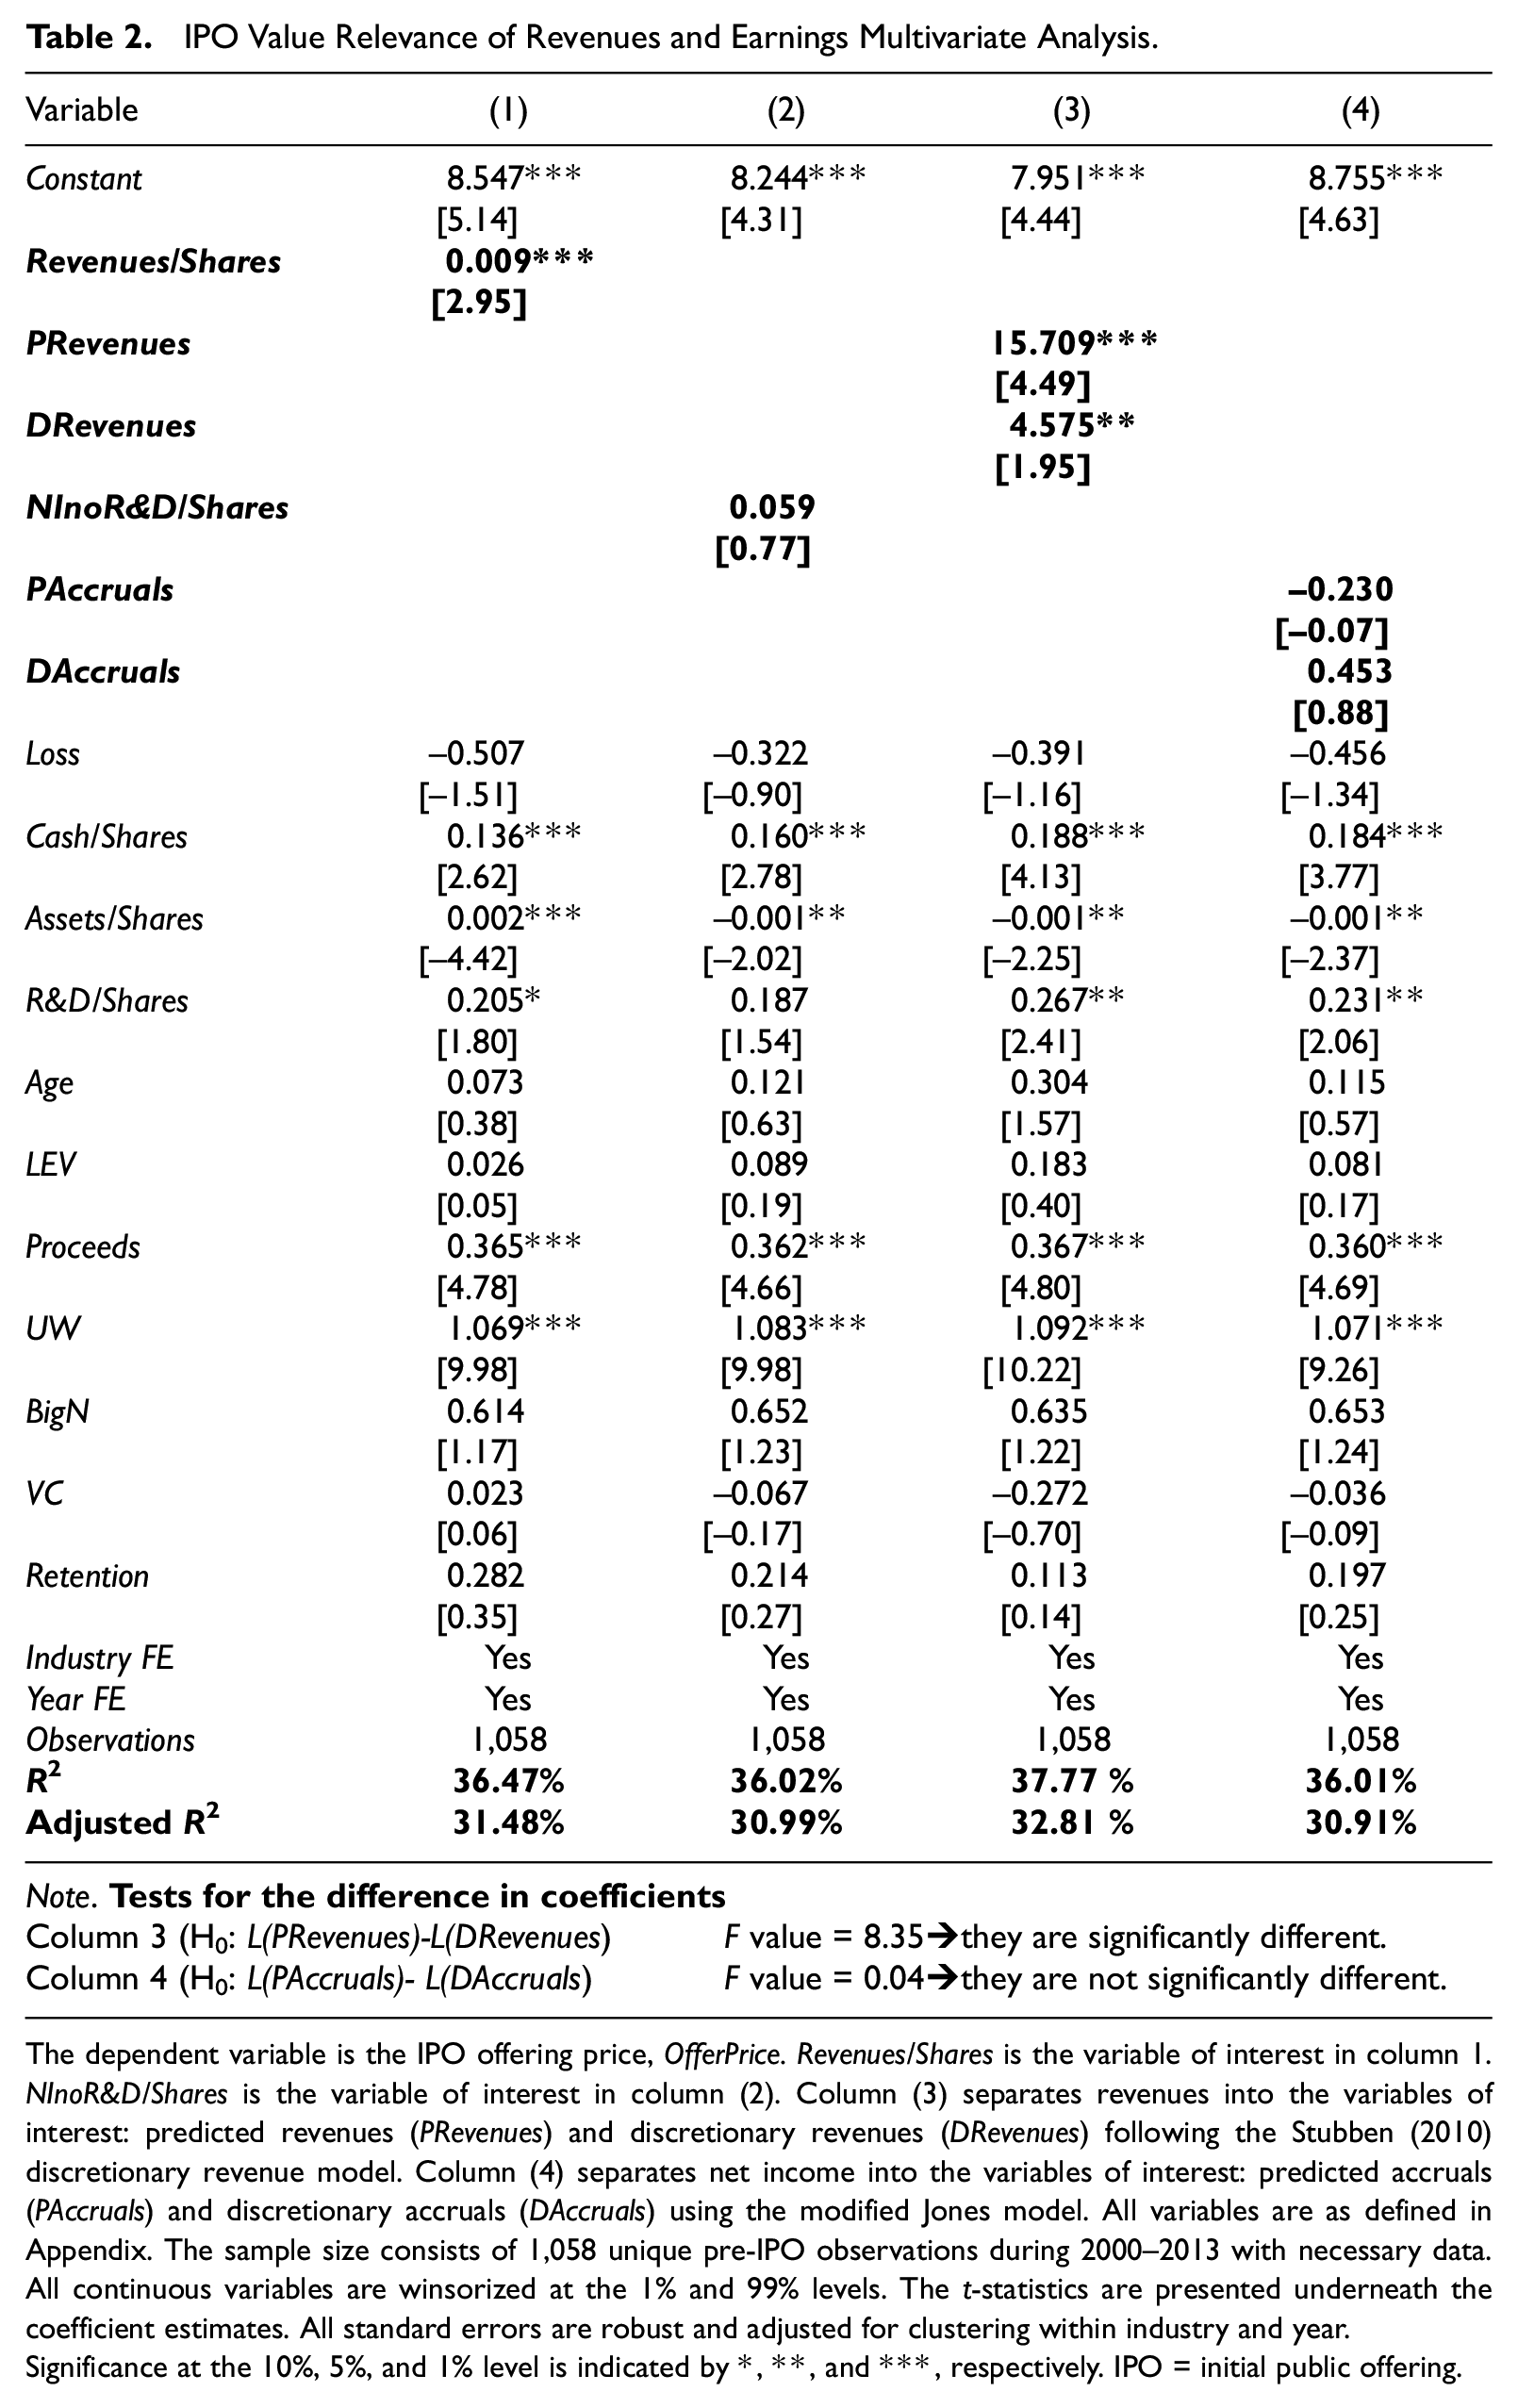
Table 1, Panel B tabulates descriptive statistics for our comment letter sample. The mean number of revenue recognition comment letters issued on S-1 filings receiving at least one comment letter, Num_RR_Letters, is 0.60 while the mean number issued for 10-K filings is 0.27. The difference between the two groups is statistically significant. Of the 1,072 IPO firms that received at least one comment letter on their S-1 filing, the proportion of IPO firms receiving comment letters pertaining to revenue recognition (36%) is significantly higher compared to 10-K filings of publicly traded firms (22%).
IPO Value Relevance of Revenues and Earnings
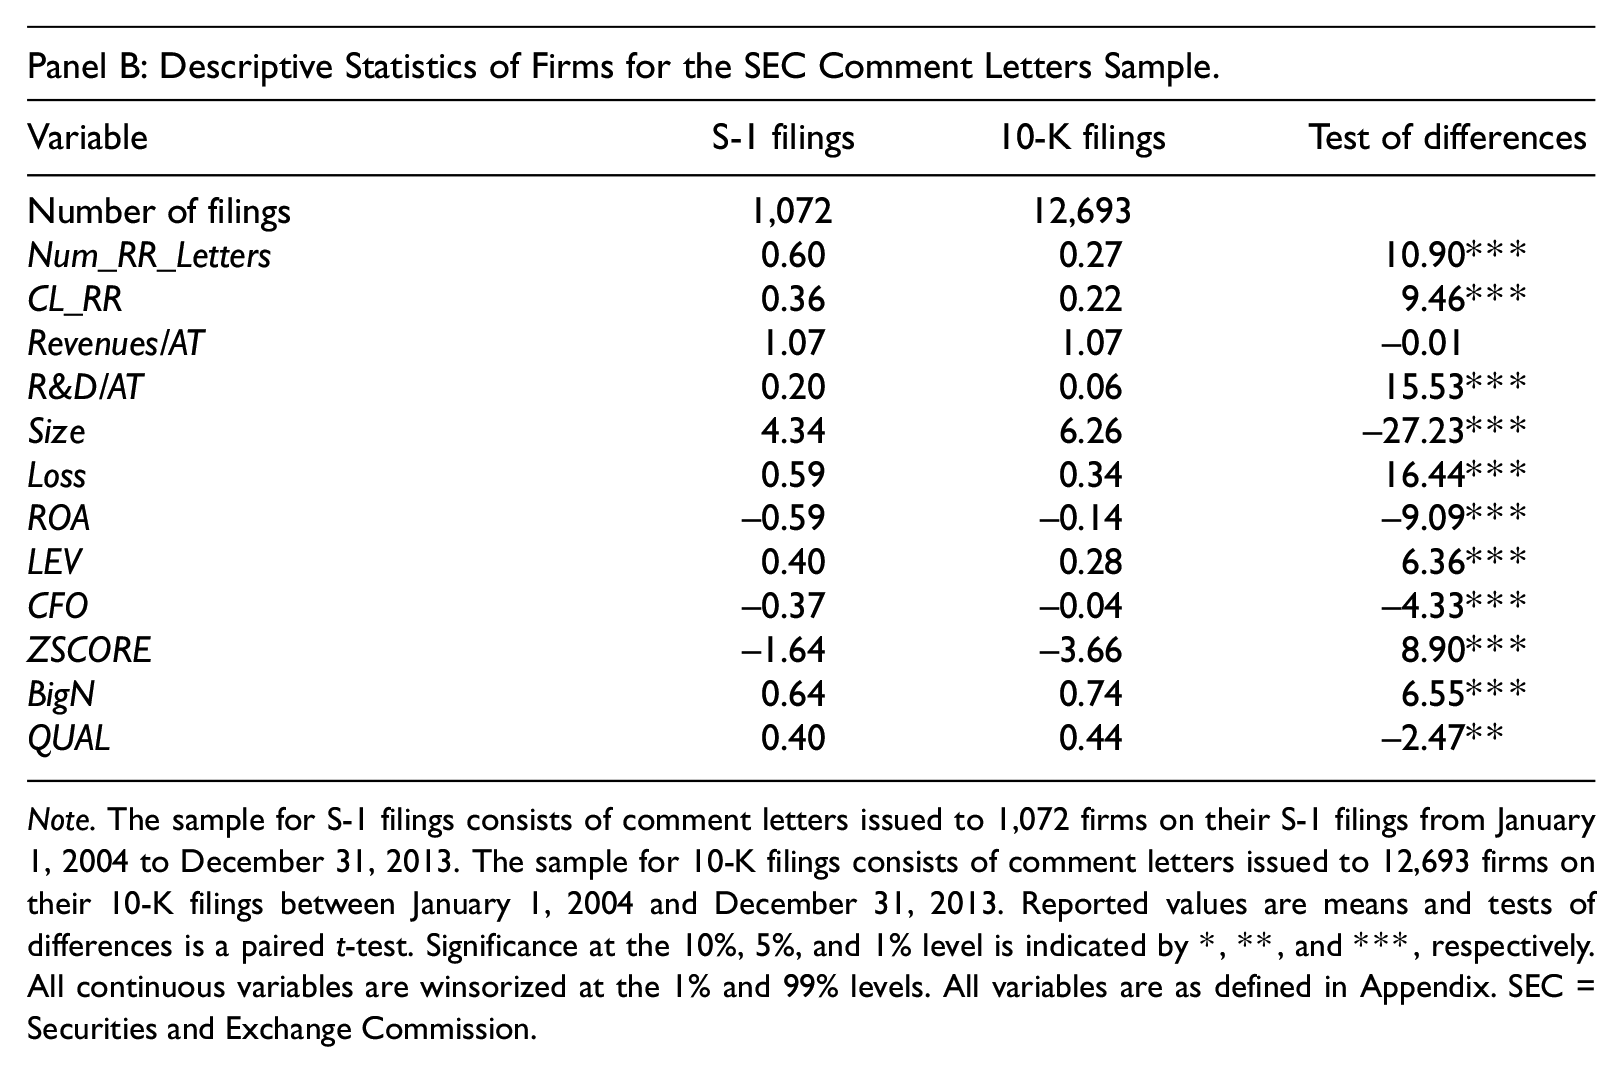
Table 2 presents results from our value relevance of revenues and earnings tests. The coefficient on Revenues/Shares is positive and statistically significant in Column 1 while the coefficient of NInoR&D/Shares is not statistically different from zero (p < .10) in Column 2. These results suggest that revenue is value-relevant to IPO offering price and that net income is not value-relevant to IPO offering price. 21 The R2 of the valuation model presented in Column 1 with Revenues/Share is 36.47% and the adjusted R2 is 31.48%. The R2 of the valuation model presented in Column 2 with NInoR&D/Shares is 36.02% and the adjusted R2 is 30.99%. These results suggest that revenues explain IPO offering price better than net income.
IPO Value Relevance of Revenues and Earnings Multivariate Analysis.
The dependent variable is the IPO offering price, OfferPrice. Revenues/Shares is the variable of interest in column 1. NInoR&D/Shares is the variable of interest in column (2). Column (3) separates revenues into the variables of interest: predicted revenues (PRevenues) and discretionary revenues (DRevenues) following the Stubben (2010) discretionary revenue model. Column (4) separates net income into the variables of interest: predicted accruals (PAccruals) and discretionary accruals (DAccruals) using the modified Jones model. All variables are as defined in Appendix. The sample size consists of 1,058 unique pre-IPO observations during 2000–2013 with necessary data. All continuous variables are winsorized at the 1% and 99% levels. The t-statistics are presented underneath the coefficient estimates. All standard errors are robust and adjusted for clustering within industry and year.
Significance at the 10%, 5%, and 1% level is indicated by *, **, and ***, respectively. IPO = initial public offering.
In Column 3 we present the results from decomposing revenues, Revenues/Shares, into nondiscretionary (PRevenues) and discretionary (DRevenues) components using the Stubben (2010) discretionary revenues model. The coefficients presented in Column 3 for PRevenues and DRevenues are positive and statistically significant (p < .01 and p < .05, respectively). In Column 4 we present the results from decomposing earnings, NInoR&D/Shares, into nondiscretionary accruals (PAccruals) and discretionary accruals (DAccruals) using the modified-Jones accruals model (Dechow et al., 1995). The coefficients presented in Column 4 for PAccruals and DAccruals are not statistically significant (p > .10).
The R2 of the valuation model presented in Column 3 with PRevenues and DRevenues is 37.77% and the adjusted R2 is 32.81%. The R2 of the valuation model presented in Column 4 with PAccruals and DAccruals is 36.01% and the adjusted R2 is 30.91%. This R2 comparison suggests that nondiscretionary revenues and discretionary revenues explain IPO offering price better than nondiscretionary accruals and discretionary accruals. The results presented in Table 2 collectively suggest that revenues and both the discretionary and nondiscretionary components explain IPO offering price better than earnings.
Comment Letters
Table 3 Panel A reports that 36.47% of S-1 filings that received at least one comment letter received at least one revenue recognition comment letter, while 22.13% of 10-K filings that received at least one comment letter received at least one revenue recognition comment letter. The mean number of revenue recognition comment letters received by IPO firms receiving at least one comment letter is .60, while the mean number of comment letters received by publicly traded firms receiving at least one comment letter is .27. A test of differences in means (paired t-test) provides univariate evidence (statistically significant at p < .01) to suggest that the SEC more closely scrutinizes revenue recognition issues for S-1 filings than for 10-K filings.
SEC Comment Letters.
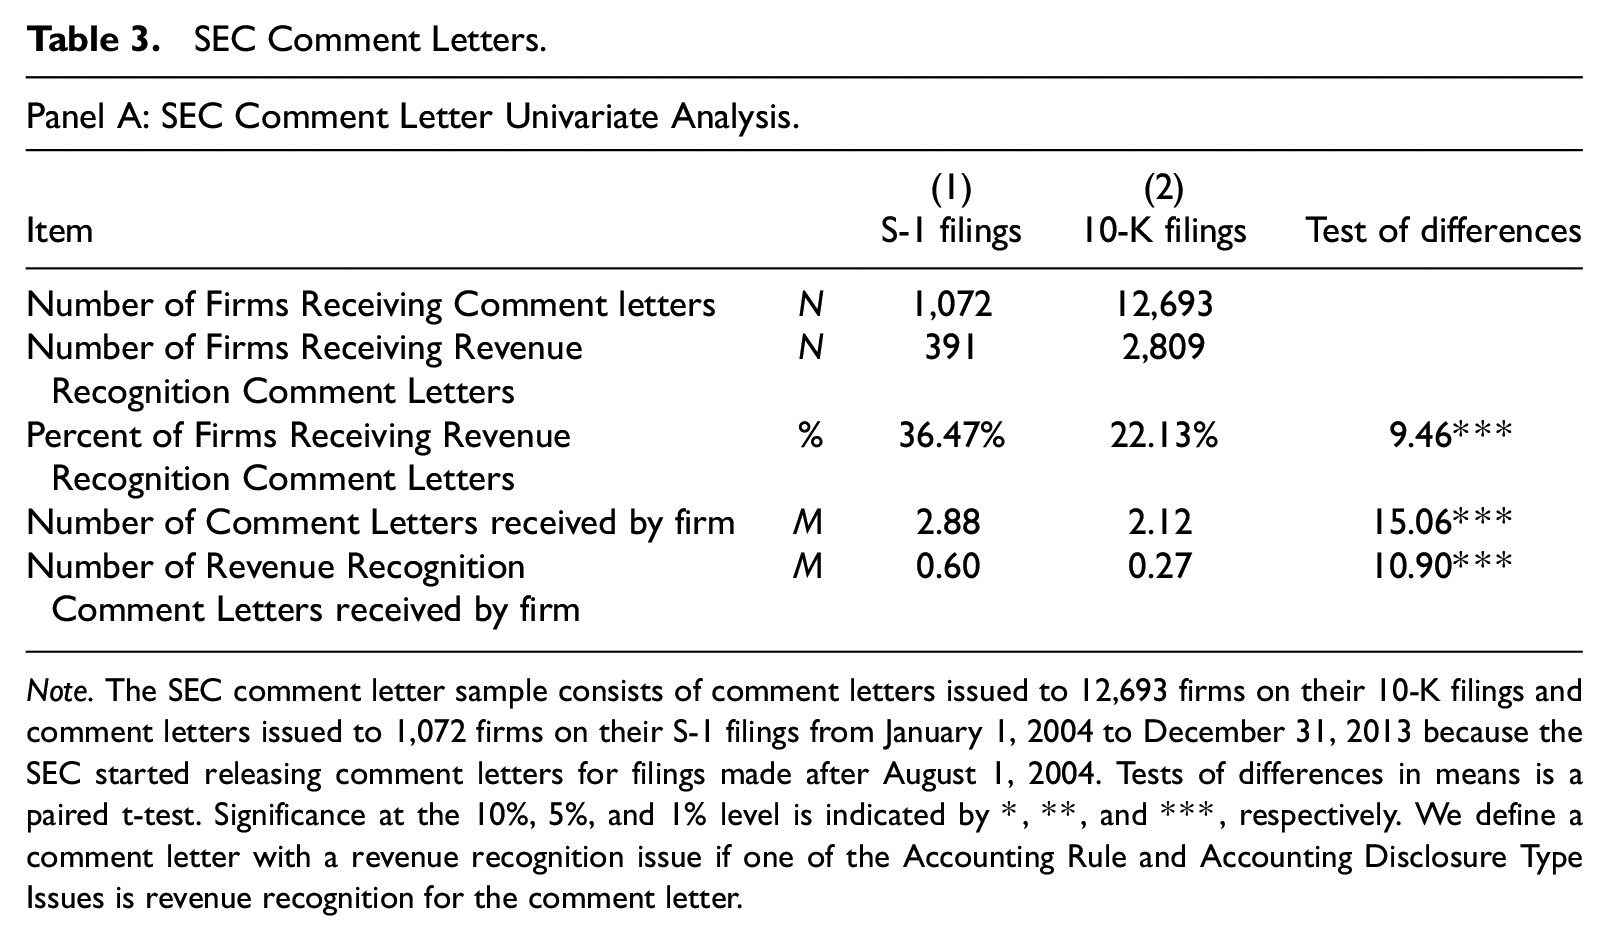
Note. The SEC comment letter sample consists of comment letters issued to 12,693 firms on their 10-K filings and comment letters issued to 1,072 firms on their S-1 filings from January 1, 2004 to December 31, 2013 because the SEC started releasing comment letters for filings made after August 1, 2004. Tests of differences in means is a paired t-test. Significance at the 10%, 5%, and 1% level is indicated by *, **, and ***, respectively. We define a comment letter with a revenue recognition issue if one of the Accounting Rule and Accounting Disclosure Type Issues is revenue recognition for the comment letter.
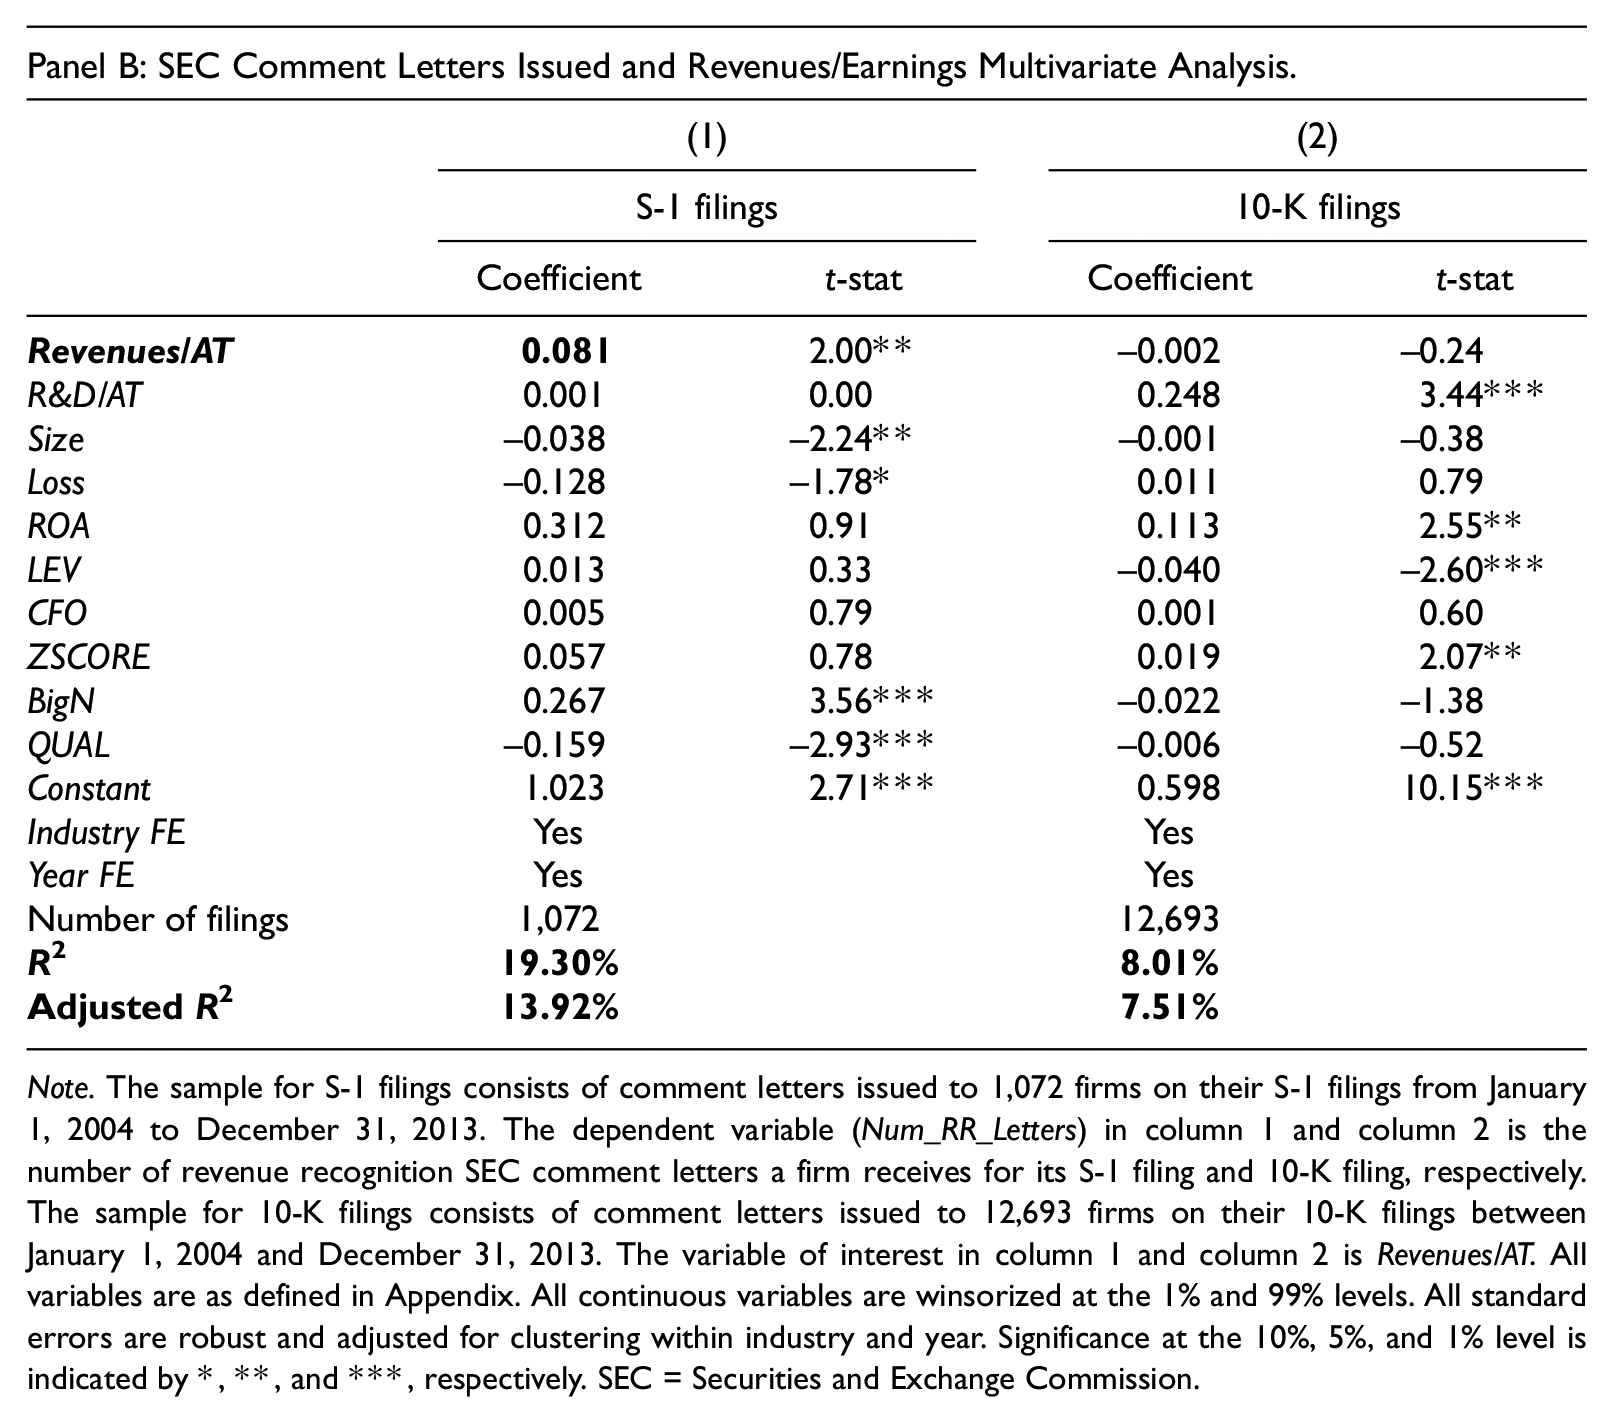
Note. The sample for S-1 filings consists of comment letters issued to 1,072 firms on their S-1 filings from January 1, 2004 to December 31, 2013. The dependent variable (Num_RR_Letters) in column 1 and column 2 is the number of revenue recognition SEC comment letters a firm receives for its S-1 filing and 10-K filing, respectively. The sample for 10-K filings consists of comment letters issued to 12,693 firms on their 10-K filings between January 1, 2004 and December 31, 2013. The variable of interest in column 1 and column 2 is Revenues/AT. All variables are as defined in Appendix. All continuous variables are winsorized at the 1% and 99% levels. All standard errors are robust and adjusted for clustering within industry and year. Significance at the 10%, 5%, and 1% level is indicated by *, **, and ***, respectively. SEC = Securities and Exchange Commission.
Table 3, Panel B presents results from our examination of the association between levels of revenues and the number of revenue recognition comment letters on S-1 filings and 10-K filings separately. The coefficient on Revenues/AT in Column 1 is positive and statistically significant. The R2 of the comment letter model presented in Column 1 with Revenues/AT in S-1 filings is 19.30% and the adjusted R2 is 13.92%. The coefficient on Revenues/AT in Column 2 is not statistically significant. The R2 of the comment letter model presented in Column 2 with 10-K filings is 8.01% and the adjusted R2 is 7.51%.
Collectively the results in Column 1 and Column 2 suggest that revenues are positively associated with the number of revenue recognition comment letters issued for S-1 filings, while there is no evidence of an association between the level of revenues and the number of revenue recognition comment letters issued for the 10-K filing. As such, our results support H2a that the level of revenues reported by IPO firms are positively associated with the number of revenue recognition comment letters they receive, and H2b that the level of revenues reported by publicly traded firms are not associated with the number of revenue recognition comment letters they receive. We conclude from these results that the association between revenues and revenue recognition comment letters is greater for S-1 filings than 10-K filings.
Discretionary Revenues, Discretionary Accruals, and Discretionary Expenses
Table 4, Panel A tabulates descriptive statistics for the variables used in our discretionary revenues, discretionary accruals, and discretionary expenses multivariate models, partitioned between the pre-IPO year and the post-IPO year. We find that the mean of discretionary revenues, performance-matched discretionary revenues, and growth-matched discretionary revenues are all significantly higher in the pre-IPO year than in the post-IPO year. In contrast, we find that the mean of discretionary accruals, performance-matched discretionary accruals, and growth-matched discretionary accruals are all significantly lower in the pre-IPO year than in the post-IPO year. We also find that the mean of discretionary expenses, performance-matched discretionary expenses, and growth-matched discretionary expenses are all significantly higher in the pre-IPO year than in the post-IPO year. A test of differences in means (paired t-test) provides univariate evidence (statistically significant at p < .01) to suggest that IPO firms inflate revenues and expenses while reporting earnings conservatively in the pre-IPO year.
Discretionary Revenues and Accruals.
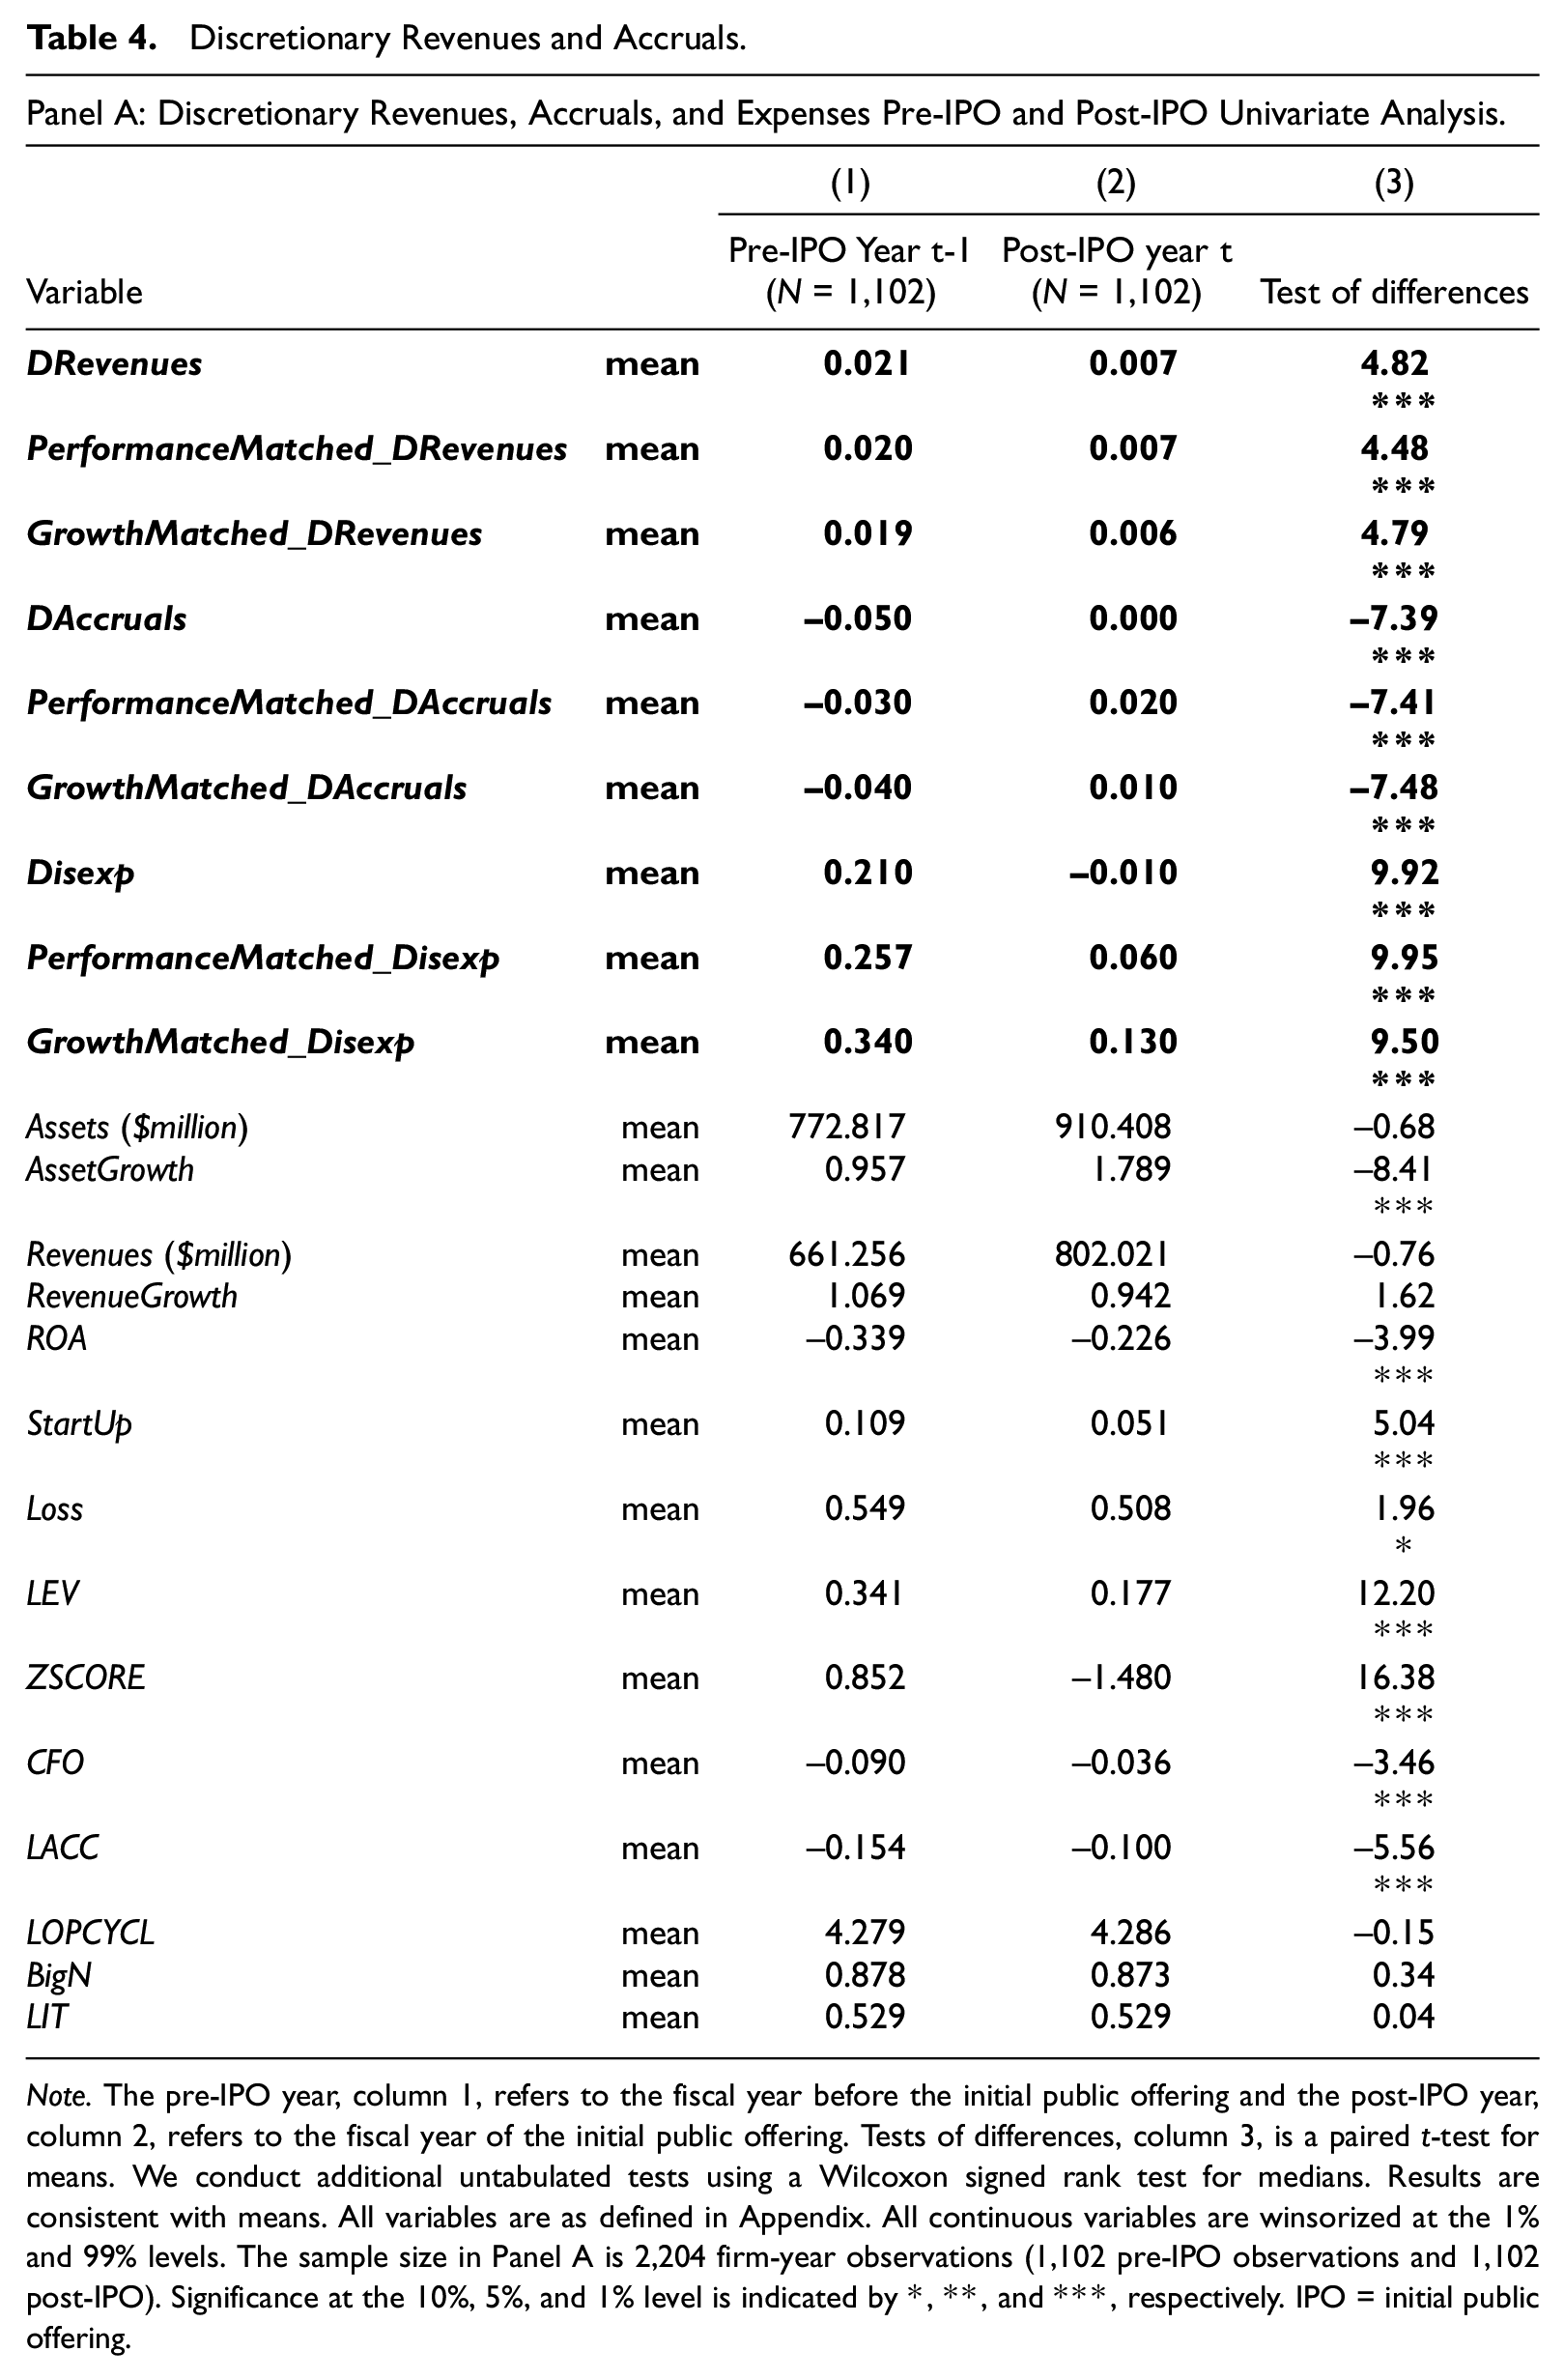
Note. The pre-IPO year, column 1, refers to the fiscal year before the initial public offering and the post-IPO year, column 2, refers to the fiscal year of the initial public offering. Tests of differences, column 3, is a paired t-test for means. We conduct additional untabulated tests using a Wilcoxon signed rank test for medians. Results are consistent with means. All variables are as defined in Appendix. All continuous variables are winsorized at the 1% and 99% levels. The sample size in Panel A is 2,204 firm-year observations (1,102 pre-IPO observations and 1,102 post-IPO). Significance at the 10%, 5%, and 1% level is indicated by *, **, and ***, respectively. IPO = initial public offering.
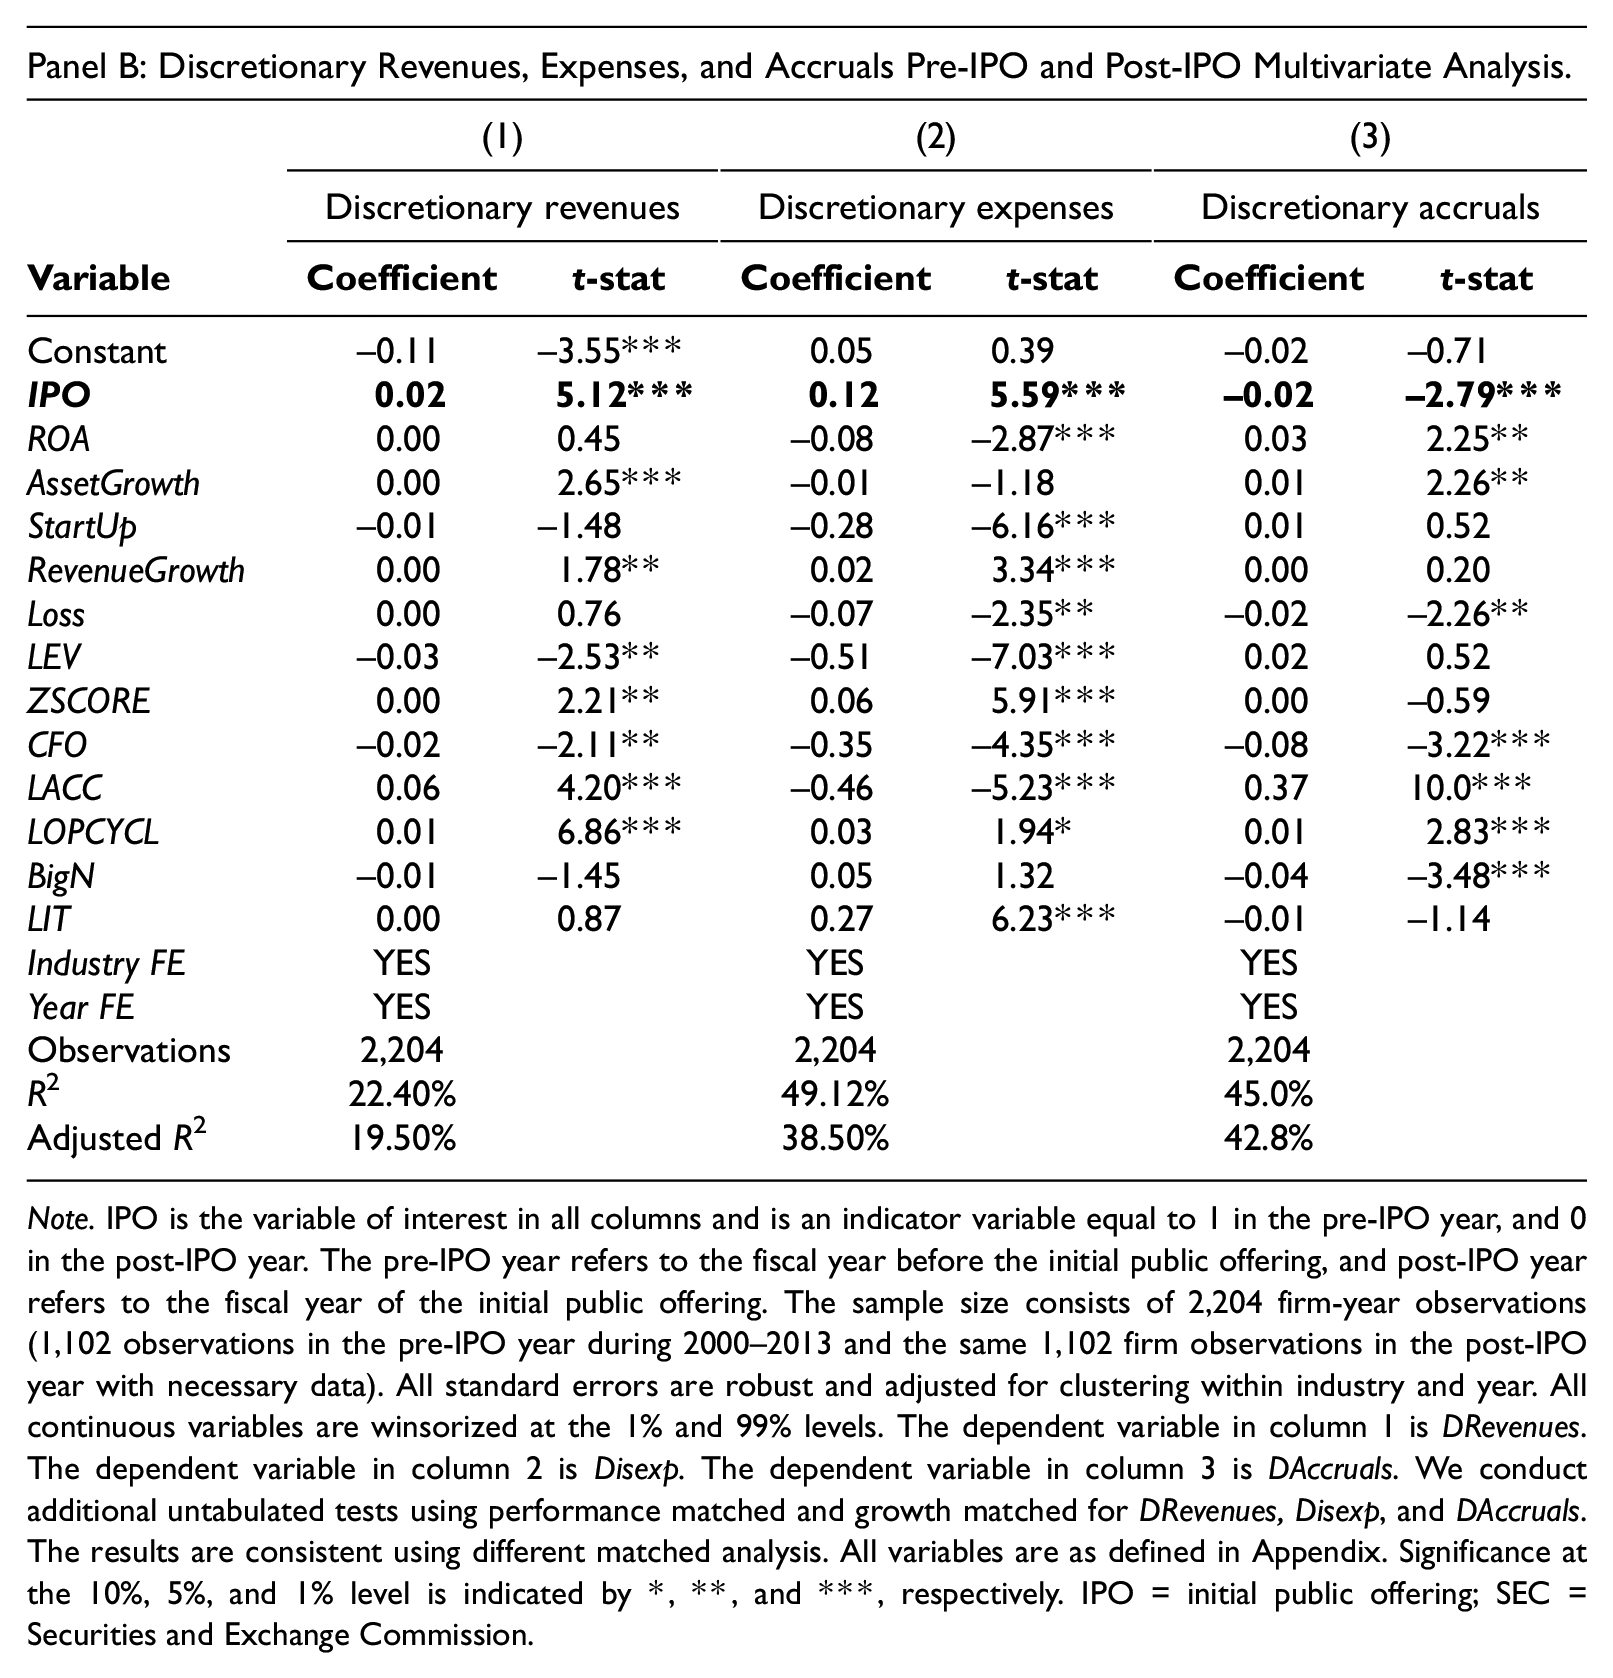
Note. IPO is the variable of interest in all columns and is an indicator variable equal to 1 in the pre-IPO year, and 0 in the post-IPO year. The pre-IPO year refers to the fiscal year before the initial public offering, and post-IPO year refers to the fiscal year of the initial public offering. The sample size consists of 2,204 firm-year observations (1,102 observations in the pre-IPO year during 2000–2013 and the same 1,102 firm observations in the post-IPO year with necessary data). All standard errors are robust and adjusted for clustering within industry and year. All continuous variables are winsorized at the 1% and 99% levels. The dependent variable in column 1 is DRevenues. The dependent variable in column 2 is Disexp. The dependent variable in column 3 is DAccruals. We conduct additional untabulated tests using performance matched and growth matched for DRevenues, Disexp, and DAccruals. The results are consistent using different matched analysis. All variables are as defined in Appendix. Significance at the 10%, 5%, and 1% level is indicated by *, **, and ***, respectively. IPO = initial public offering; SEC = Securities and Exchange Commission.
Table 4, Panel B presents the results from our estimation of Equations 6a, 6b, and 6c. The coefficients on the variable of interest (IPO) are positive and statistically significant (p < .01) using the discretionary revenue measure. 22 This result suggests that discretionary revenues are significantly higher in the pre-IPO year which leads us to reject the null H3a. In contrast, the coefficients on the variable of interest (IPO) are negative and statistically significant (p < .01) using the discretionary accrual measure. This result suggests that discretionary accruals are significantly lower in the pre-IPO year which leads us to reject the null H3b. Using the discretionary expense measure, we find that discretionary expenses in the pre-IPO year are significantly higher than in the post-IPO year which leads us to reject the null H3c.
Additional Analysis
Post-IPO Stock Returns and Revenue Management
In additional analysis, we examine how revenue management by pre-IPO firms affects the market performance of the firm post-IPO, using first day stock returns, 6-month stock returns, and 1-year stock returns. We use first day returns, 6-month returns, and 1-year returns following recent IPO studies (e.g., Chahine et al., 2020; Fedyk et al., 2017). The SDC IPO dataset includes stock prices up to 1 year after the IPO, which allows us to keep all the observations in our sample, and alleviates the concern of introducing a survival bias when using a longer time period.
Table 5, Panel A shows the post-IPO stock returns of firms based on their level of discretionary revenues, with quartile one representing firms with the lowest levels of discretionary revenue and quartile four representing firms with the highest level of discretionary revenue. IPO firms in the first quartile of pre-IPO discretionary revenues have lower first day returns compared to IPO firms in the fourth quartile of discretionary revenues. In contrast, stock returns one year after the IPO are significantly higher for IPO firms in the first quartile of discretionary revenues, compared to IPO firms in the fourth quartile of discretionary revenues.
Consequences of Revenue Management.
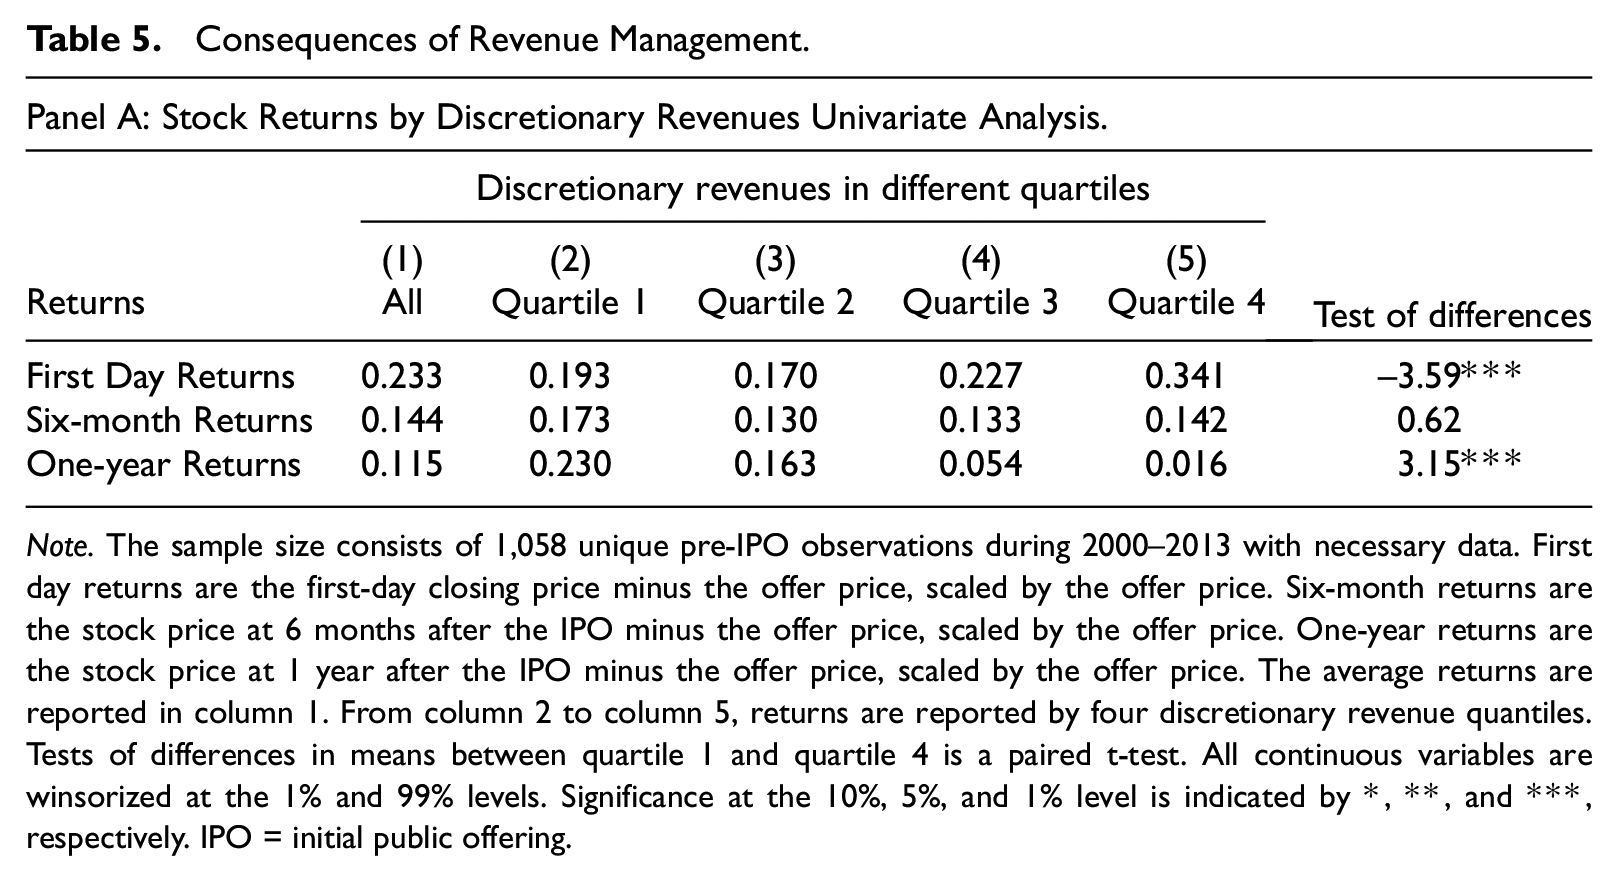
Note. The sample size consists of 1,058 unique pre-IPO observations during 2000–2013 with necessary data. First day returns are the first-day closing price minus the offer price, scaled by the offer price. Six-month returns are the stock price at 6 months after the IPO minus the offer price, scaled by the offer price. One-year returns are the stock price at 1 year after the IPO minus the offer price, scaled by the offer price. The average returns are reported in column 1. From column 2 to column 5, returns are reported by four discretionary revenue quantiles. Tests of differences in means between quartile 1 and quartile 4 is a paired t-test. All continuous variables are winsorized at the 1% and 99% levels. Significance at the 10%, 5%, and 1% level is indicated by *, **, and ***, respectively. IPO = initial public offering.
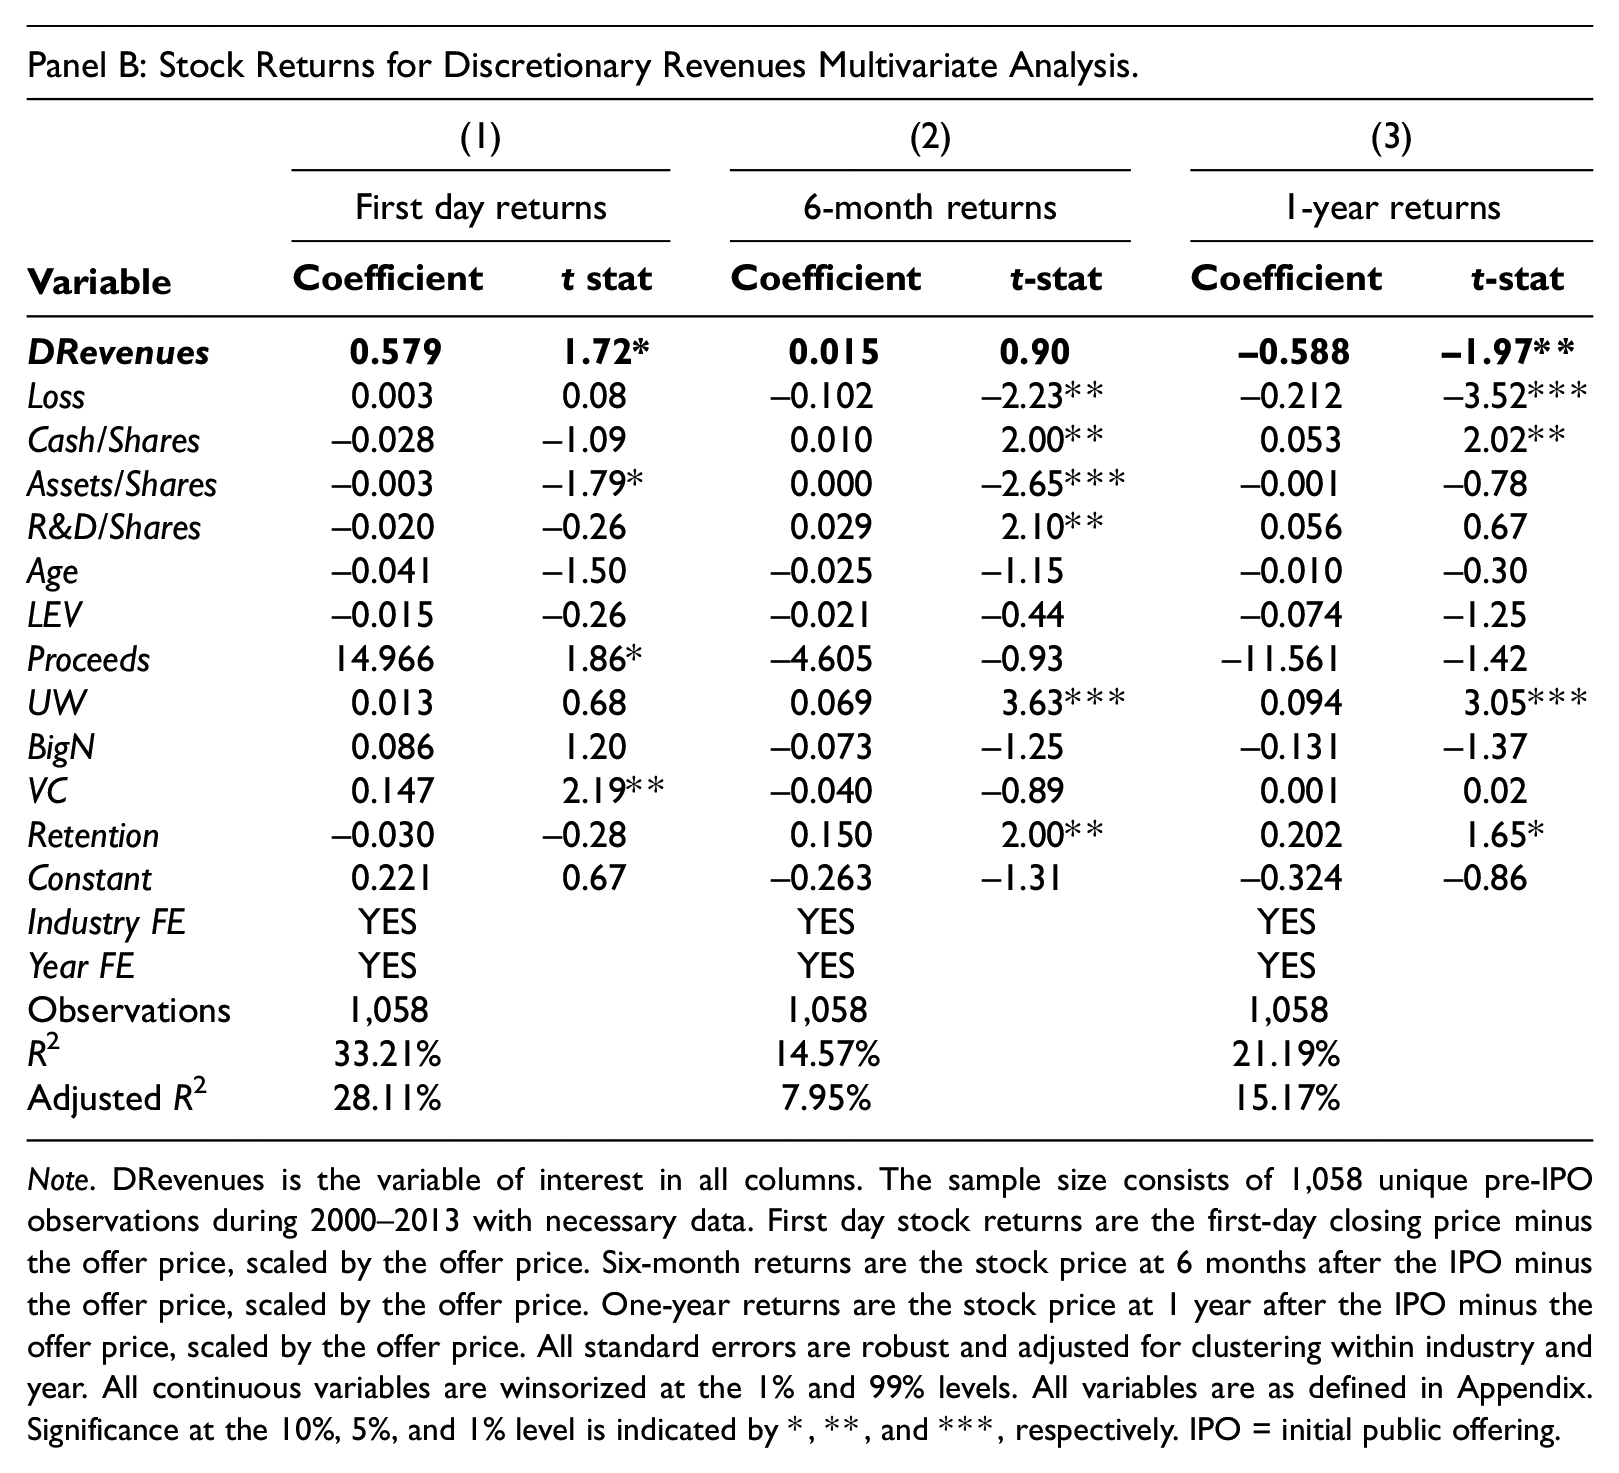
Note. DRevenues is the variable of interest in all columns. The sample size consists of 1,058 unique pre-IPO observations during 2000–2013 with necessary data. First day stock returns are the first-day closing price minus the offer price, scaled by the offer price. Six-month returns are the stock price at 6 months after the IPO minus the offer price, scaled by the offer price. One-year returns are the stock price at 1 year after the IPO minus the offer price, scaled by the offer price. All standard errors are robust and adjusted for clustering within industry and year. All continuous variables are winsorized at the 1% and 99% levels. All variables are as defined in Appendix. Significance at the 10%, 5%, and 1% level is indicated by *, **, and ***, respectively. IPO = initial public offering.
We also conduct multivariate analysis to examine the association between the level of discretionary revenues and post-IPO stock performance after controlling for firm characteristics. Table 5, Panel B shows that IPO firms with higher discretionary revenues are associated with higher first day returns, while IPO firms with higher discretionary revenues are associated with lower one-year returns. These results lead us to conclude that the opportunistic reporting of discretionary revenues leads to higher first day returns, but within a year these returns reverse.
Discretionary Revenues, Expenses, and Accruals One Year and Two Years After the IPO
In Table 6, we examine whether discretionary revenues, discretionary accruals, and discretionary expenses are different between the post-IPO year (year 1) and the second year after the IPO (year 2). We find that discretionary revenues and discretionary expenses are not higher in the post-IPO year (year 1) than they are 2 years after the IPO (year 2). These results provide further support for our earlier findings that firms opportunistically report higher levels of discretionary revenues and discretionary expenses leading up to the IPO. We also find that discretionary accruals are significantly higher in the year after the IPO (year 1) than 2 years after the IPO (year 2). This result supports the argument from prior studies that firms report discretionary accruals conservatively for the IPO (Venkataraman et al., 2008) and that discretionary accruals reverse after the IPO (Teoh, Welch, & Wong, 1998; Teoh, Wong, & Rao, 1998).
Additional Tests. Discretionary Revenues, Expenses, and Accruals One Year After the IPO (Year 1) and Two Years After the IPO (Year 2) Multivariate Analysis.
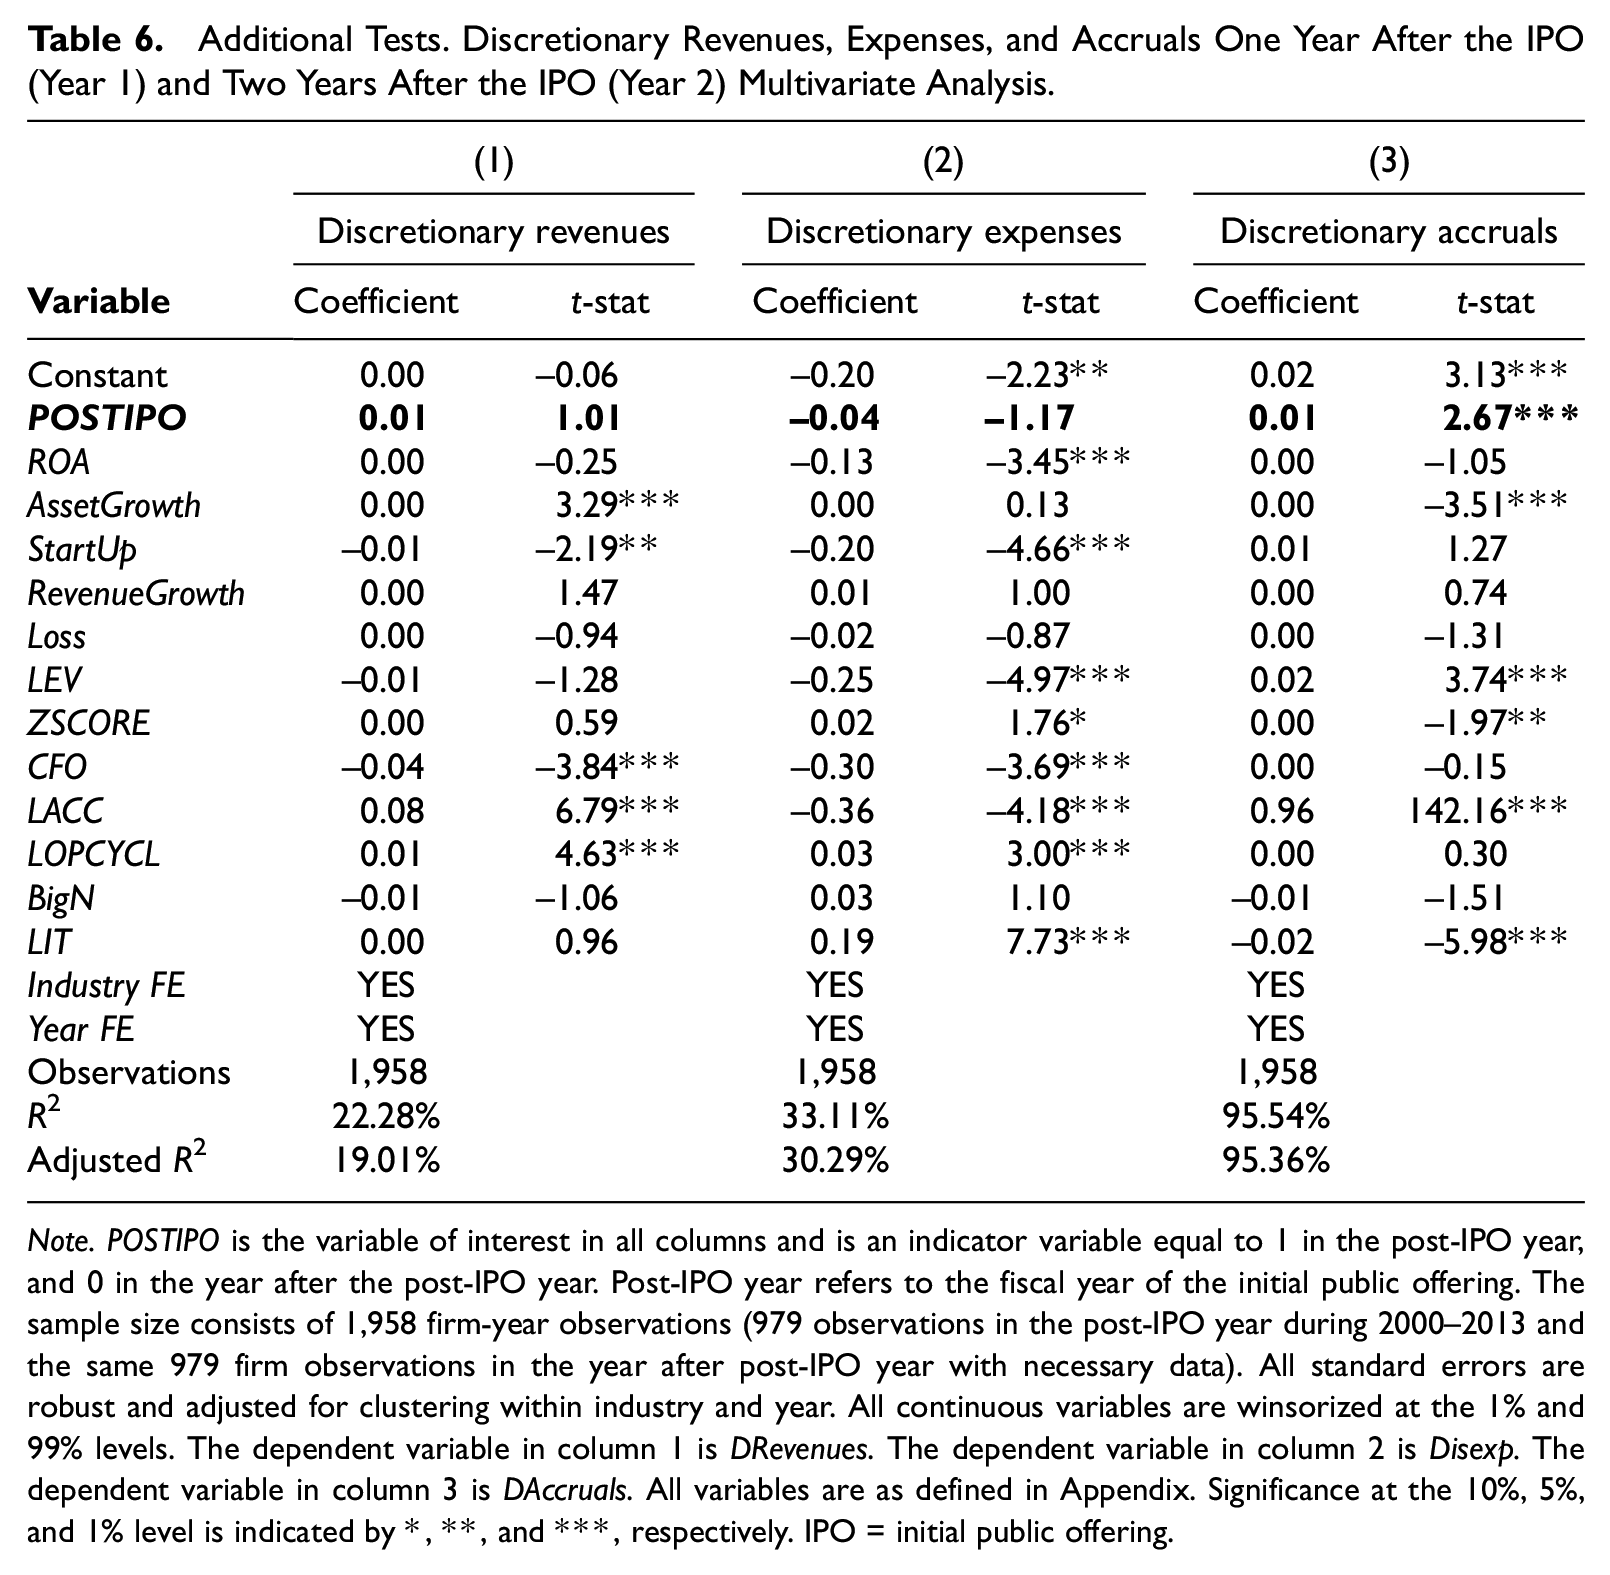
Note. POSTIPO is the variable of interest in all columns and is an indicator variable equal to 1 in the post-IPO year, and 0 in the year after the post-IPO year. Post-IPO year refers to the fiscal year of the initial public offering. The sample size consists of 1,958 firm-year observations (979 observations in the post-IPO year during 2000–2013 and the same 979 firm observations in the year after post-IPO year with necessary data). All standard errors are robust and adjusted for clustering within industry and year. All continuous variables are winsorized at the 1% and 99% levels. The dependent variable in column 1 is DRevenues. The dependent variable in column 2 is Disexp. The dependent variable in column 3 is DAccruals. All variables are as defined in Appendix. Significance at the 10%, 5%, and 1% level is indicated by *, **, and ***, respectively. IPO = initial public offering.
Conclusion
Decades of prior research on the opportunistic financial reporting of IPO firms has consistently used earnings-based accrual measures to examine managerial opportunism. In this paper we take a different tact. We first demonstrate that revenues are positively associated with IPO offer value while earnings are not. We also find that an association exists between revenues and the number of SEC comment letters issued pertaining to the S-1 filing which suggests that the SEC closely scrutinizes the revenue reporting of IPO firms.
We further find that discretionary revenues are significantly higher and discretionary accruals are significantly lower in the pre-IPO financials of a large sample of companies that went public between 2000 and 2013. This result suggests that IPO managers inflate revenues opportunistically while reporting earnings conservatively. The PCAOB and SEC should take interest in our study as our analysis indicates that the revenue reporting of IPO firms warrants additional monitoring.
Our results should also be of interest to the FASB and SEC given their recent interest on the subject of revenue recognition issues. We believe future research into whether pre-IPO revenue management differs across Big 4 and non-Big 4 auditors will provide further contribution to our understanding of the IPO market. As well, whether the revenue management of IPO firms plays a role in price formation leading up to the offering appears to be a fruitful direction for future research. If the revenue management of IPO firms can be detected between the time the prospectus is issued and the time the company executives and underwriters conduct a road show, we would expect there to be a larger difference, relative to other IPO firms, between the initial price range in the prospectus and the offer price after the road show. Such a phenomenon may help investors decode IPO revenue manipulation and its effect on the value of their IPO investment.
Footnotes
Appendix
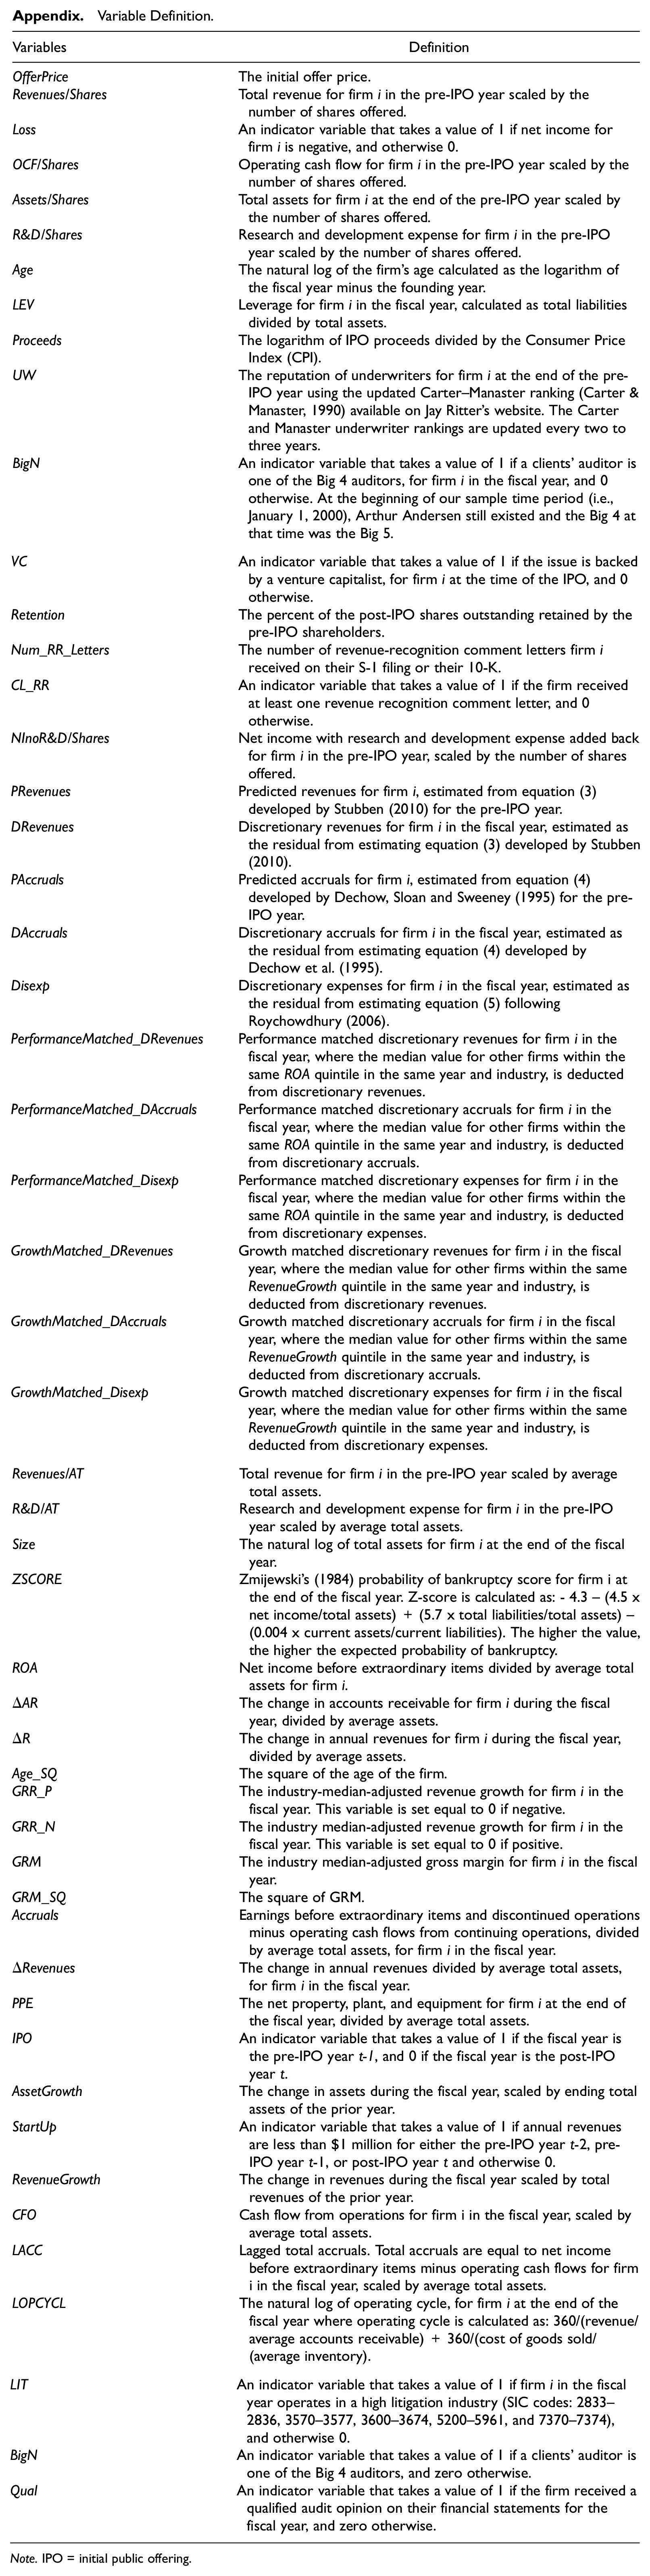
Variable Definition.
| Variables | Definition |
|---|---|
| OfferPrice | The initial offer price. |
| Revenues/Shares | Total revenue for firm i in the pre-IPO year scaled by the number of shares offered. |
| Loss | An indicator variable that takes a value of 1 if net income for firm i is negative, and otherwise 0. |
| OCF/Shares | Operating cash flow for firm i in the pre-IPO year scaled by the number of shares offered. |
| Assets/Shares | Total assets for firm i at the end of the pre-IPO year scaled by the number of shares offered. |
| R&D/Shares | Research and development expense for firm i in the pre-IPO year scaled by the number of shares offered. |
| Age | The natural log of the firm’s age calculated as the logarithm of the fiscal year minus the founding year. |
| LEV | Leverage for firm i in the fiscal year, calculated as total liabilities divided by total assets. |
| Proceeds | The logarithm of IPO proceeds divided by the Consumer Price Index (CPI). |
| UW | The reputation of underwriters for firm i at the end of the pre-IPO year using the updated Carter–Manaster ranking (Carter & Manaster, 1990) available on Jay Ritter’s website. The Carter and Manaster underwriter rankings are updated every two to three years. |
| BigN | An indicator variable that takes a value of 1 if a clients’ auditor is one of the Big 4 auditors, for firm i in the fiscal year, and 0 otherwise. At the beginning of our sample time period (i.e., January 1, 2000), Arthur Andersen still existed and the Big 4 at that time was the Big 5. |
| VC | An indicator variable that takes a value of 1 if the issue is backed by a venture capitalist, for firm i at the time of the IPO, and 0 otherwise. |
| Retention | The percent of the post-IPO shares outstanding retained by the pre-IPO shareholders. |
| Num_RR_Letters | The number of revenue-recognition comment letters firm i received on their S-1 filing or their 10-K. |
| CL_RR | An indicator variable that takes a value of 1 if the firm received at least one revenue recognition comment letter, and 0 otherwise. |
| NInoR&D/Shares | Net income with research and development expense added back for firm i in the pre-IPO year, scaled by the number of shares offered. |
| PRevenues | Predicted revenues for firm i, estimated from equation (3) developed by Stubben (2010) for the pre-IPO year. |
| DRevenues | Discretionary revenues for firm i in the fiscal year, estimated as the residual from estimating equation (3) developed by Stubben (2010). |
| PAccruals | Predicted accruals for firm i, estimated from equation (4) developed by Dechow, Sloan and Sweeney (1995) for the pre-IPO year. |
| DAccruals | Discretionary accruals for firm i in the fiscal year, estimated as the residual from estimating equation (4) developed by Dechow et al. (1995). |
| Disexp | Discretionary expenses for firm i in the fiscal year, estimated as the residual from estimating equation (5) following Roychowdhury (2006). |
| PerformanceMatched_DRevenues | Performance matched discretionary revenues for firm i in the fiscal year, where the median value for other firms within the same ROA quintile in the same year and industry, is deducted from discretionary revenues. |
| PerformanceMatched_DAccruals | Performance matched discretionary accruals for firm i in the fiscal year, where the median value for other firms within the same ROA quintile in the same year and industry, is deducted from discretionary accruals. |
| PerformanceMatched_Disexp | Performance matched discretionary expenses for firm i in the fiscal year, where the median value for other firms within the same ROA quintile in the same year and industry, is deducted from discretionary expenses. |
| GrowthMatched_DRevenues | Growth matched discretionary revenues for firm i in the fiscal year, where the median value for other firms within the same RevenueGrowth quintile in the same year and industry, is deducted from discretionary revenues. |
| GrowthMatched_DAccruals | Growth matched discretionary accruals for firm i in the fiscal year, where the median value for other firms within the same RevenueGrowth quintile in the same year and industry, is deducted from discretionary accruals. |
| GrowthMatched_Disexp | Growth matched discretionary expenses for firm i in the fiscal year, where the median value for other firms within the same RevenueGrowth quintile in the same year and industry, is deducted from discretionary expenses. |
| Revenues/AT | Total revenue for firm i in the pre-IPO year scaled by average total assets. |
| R&D/AT | Research and development expense for firm i in the pre-IPO year scaled by average total assets. |
| Size | The natural log of total assets for firm i at the end of the fiscal year. |
| ZSCORE | Zmijewski’s (1984) probability of bankruptcy score for firm i at the end of the fiscal year. Z-score is calculated as: - 4.3 – (4.5 x net income/total assets) + (5.7 x total liabilities/total assets) − (0.004 x current assets/current liabilities). The higher the value, the higher the expected probability of bankruptcy. |
| ROA | Net income before extraordinary items divided by average total assets for firm i. |
| ΔAR | The change in accounts receivable for firm i during the fiscal year, divided by average assets. |
| ΔR | The change in annual revenues for firm i during the fiscal year, divided by average assets. |
| Age_SQ | The square of the age of the firm. |
| GRR_P | The industry-median-adjusted revenue growth for firm i in the fiscal year. This variable is set equal to 0 if negative. |
| GRR_N | The industry median-adjusted revenue growth for firm i in the fiscal year. This variable is set equal to 0 if positive. |
| GRM | The industry median-adjusted gross margin for firm i in the fiscal year. |
| GRM_SQ | The square of GRM. |
| Accruals | Earnings before extraordinary items and discontinued operations minus operating cash flows from continuing operations, divided by average total assets, for firm i in the fiscal year. |
| ΔRevenues | The change in annual revenues divided by average total assets, for firm i in the fiscal year. |
| PPE | The net property, plant, and equipment for firm i at the end of the fiscal year, divided by average total assets. |
| IPO | An indicator variable that takes a value of 1 if the fiscal year is the pre-IPO year t-1, and 0 if the fiscal year is the post-IPO year t. |
| AssetGrowth | The change in assets during the fiscal year, scaled by ending total assets of the prior year. |
| StartUp | An indicator variable that takes a value of 1 if annual revenues are less than $1 million for either the pre-IPO year t-2, pre-IPO year t-1, or post-IPO year t and otherwise 0. |
| RevenueGrowth | The change in revenues during the fiscal year scaled by total revenues of the prior year. |
| CFO | Cash flow from operations for firm i in the fiscal year, scaled by average total assets. |
| LACC | Lagged total accruals. Total accruals are equal to net income before extraordinary items minus operating cash flows for firm i in the fiscal year, scaled by average total assets. |
| LOPCYCL | The natural log of operating cycle, for firm i at the end of the fiscal year where operating cycle is calculated as: 360/(revenue/average accounts receivable) + 360/(cost of goods sold/(average inventory). |
| LIT | An indicator variable that takes a value of 1 if firm i in the fiscal year operates in a high litigation industry (SIC codes: 2833–2836, 3570–3577, 3600–3674, 5200–5961, and 7370–7374), and otherwise 0. |
| BigN | An indicator variable that takes a value of 1 if a clients’ auditor is one of the Big 4 auditors, and zero otherwise. |
| Qual | An indicator variable that takes a value of 1 if the firm received a qualified audit opinion on their financial statements for the fiscal year, and zero otherwise. |
Note. IPO = initial public offering.
Acknowledgements
We wish to thank Katherine Gunny, Karen Hennes, Paul Hribar, Santanu Mitra, Linda Myers, and Dechun Wang for their thoughtful comments, as well as participants at the 2016 American Accounting Association Midyear Auditing Meeting, the 2017 American Accounting Association Annual Meeting, and the 2018 Journal of Accounting, Auditing, and Finance Conference.
Declaration of Conflicting Interests
The author(s) declared no potential conflicts of interest with respect to the research, authorship, and/or publication of this article.
Funding
The author(s) received no financial support for the research, authorship, and/or publication of this article.