
Abstract
Prior studies find a positive relation between analyst forecast revisions and upcoming news, suggesting that analysts’ forecast revisions are incomplete with respect to available information. In this study, we use the association between forecast revisions and upcoming news to measure forecast completeness and show that post-forecast-revision drift is higher when forecasts are incomplete. We follow Hui and Yeung’s (2013) approach to separate forecast revision news into industry-wide and firm-specific components because they find that drift is primarily associated with the industry component. We find that forecast revisions are less complete for industry-wide news than for firm-specific news. Furthermore, analysts’ industry-wide revisions are less complete early in the year and when the underlying news is bad, and we find stronger post-forecast-revision drift in those cases. We also show that analysts who were optimistic in prior periods tend to issue forecasts that are less complete and that generate stronger drift than forecasts by other analysts. Our findings provide an explanation for the drift that contrasts with prior studies that attribute the drift to investors’ slow assimilation of the news in forecast revisions. Thus, our study sheds light on analysts’ role in conveying firm-specific and industry-wide news to investors and on the implications for post-forecast-revision drift.
Keywords
In this study, we use the association between forecast revisions and upcoming earnings news to derive a measure of the completeness of analyst forecast revisions and investigate its association with post-forecast revision drift. Prior studies attribute post-forecast revision drift to investors’ underreaction to the revisions, that is, the underreaction explanation (e.g., Givoly & Lakonishok, 1980; Gleason & Lee, 2003; Hui & Yeung, 2013; Stickel, 1991). We build on prior research that finds that analyst forecast revisions are positively associated with news at the earnings announcement and concludes that analysts only partially reveal available information in their forecasts. 1 We label such forecast revisions “incomplete” and argue that they contribute to the delay in return response to forecast revisions because investors do not fully anticipate and correct for biases in analyst forecasts (Bauman & Dowen, 1988; Bradshaw et al., 2006; Dechow et al., 2000; La Porta, 1996; So, 2013). Thus, we conjecture that prices will continue to drift in the direction of forecast revisions even when investors fully respond to incomplete forecast revision news, that is, the forecast completeness explanation. 2 Our study provides an explanation for the drift that contrasts with prior studies that attribute the drift to investors’ slow assimilation of news in forecast revisions.
We estimate the completeness of the forecast revision by regressing the upcoming earnings news (the difference between actual earnings and the revised forecast of earnings) on analyst’s forecast revisions. A positive relation between forecast revisions and upcoming news indicates that analysts’ forecast revision is incomplete. Using data from 2004 to 2013, we find that analysts’ forecast revisions reflect about 79% of the information in earnings news. We show that post-revision returns are strongly positively associated with analyst forecast revisions. However, this association is subsumed by the association between post-forecast revision returns and upcoming news when we include that variable in the model, suggesting that drift arises because forecast revisions incompletely reveal upcoming earnings news. Furthermore, we find no drift when we restrict the sample to ex post complete forecast revisions (i.e., forecasts that are approximately equal to the upcoming earnings). Thus, our findings suggest that the drift is more consistent with the incomplete revision explanation than the underreaction explanation.
Hui and Yeung (2013) separate forecast revisions into their industry-wide and firm-specific components and find that post-forecast-revision drift is primarily related to the industry-wide component. They conclude that the drift is caused by investors’ underreaction to news in analyst forecasts about industry-wide fundamentals. Under the incomplete forecast revision explanation, we argue that the stronger drift associated with the industry-wide component can also arise because analyst forecast revisions are less complete with respect to industry-related information than to firm-specific information. We decompose forecast revisions into industry-wide and firm-specific components and confirm Hui and Yeung’s (2013) finding that post-forecast-revision drift is primarily associated with the industry-wide component of analyst forecast revisions. We find that the level of completeness is smaller for industry-wide news than for firm-specific news (64.5% for industry-wide news vs. 80.2% for firm-specific news). Thus, consistent with the incomplete forecast revision explanation, we find that the completeness of industry-related and firm-specific forecast revisions is significantly associated with post-forecast revision price drift.
For further evidence to distinguish between the underreaction and forecast revision completeness explanations for the drift, we examine the difference in completeness of upward versus downward forecast revisions. Prior research suggests that compensation and career incentives deter analysts from delivering unfavorable news about the firms they cover (Easterwood & Nutt, 1999; Hong et al., 2000; Hugon et al., 2016; McNichols & O’Brien, 1997; Scherbina, 2008). Thus, we expect analysts’ downward forecast revisions to be less complete than their upward forecast revisions. Consistent with our expectation, we find that analysts’ upward revisions fully incorporate good news while their downward revisions only reflect about 73% of bad news. More importantly, we find that the drift is mainly driven by downward forecast revisions, consistent with the forecast revision completeness explanation. 3 Downward industry-wide forecast revisions are the least complete component, at 60.3%, and account for most of the drift.
We use forecast revisions issued early versus late in the fiscal year as another scenario to distinguish between the forecast revision completeness and the underreaction explanations for the drift. Prior evidence suggests that analysts’ early forecasts may be overly optimistic (e.g., Bradshaw et al., 2006; Ke & Yu, 2006; Richardson et al., 2004). Because analysts only gradually reveal the optimistic bias in their forecasts over the fiscal period, we expect their downward forecast revisions to be less complete early in the fiscal period than at later times, and further expect stronger post-forecast drift for early downward forecast revisions than for later downward revisions. Our findings are consistent with these predictions. Specifically, industry-wide downward forecast revisions issued early in the fiscal year are the least complete and are associated with the strongest drift. By comparison, upward firm-specific forecast revisions issued early in the year reveal more than the underlying good news, that is, they are overoptimistic. We find that prices move in the opposite direction of these revisions, opposite to the typical post-forecast-revision drift and an indication that the completeness of analyst forecast revisions affects post-forecast revision returns.
Finally, we use analysts’ prior-year optimism as an indicator of their tendency to issue optimistically biased forecasts. We show that optimism is highly persistent and that downward forecast revisions by analysts who were optimistic in the prior year are less complete than those by other analysts, suggesting that these analysts only partially correct the optimism in their revisions. Importantly, we also find that post-forecast drift is more strongly associated with downward forecast revisions by optimistic analysts than with revisions by other analysts, consistent with the association of forecast revision completeness with drift. We link the results on analyst optimism, forecast direction, and the within-year timing of forecasts into a coherent narrative: Analysts with a history of optimism issue highly optimistic forecasts early in the fiscal year and only gradually reveal the optimistic bias in later revisions. Our findings suggest that investors are unable to identify optimistic analysts and thus do not correct the bias in their forecast revisions. This leads to a strong positive relation between these analysts’ downward forecast revisions and post-revision returns.
Our study makes three contributions to the literature. Prior research attributes post-forecast revision drift to investors’ slow assimilation of available news in the revisions (e.g., Givoly & Lakonishok, 1980; Gleason & Lee, 2003; Hui & Yeung, 2013; Stickel, 1991), consistent with the underreaction theory in Barberis et al. (1998), which proposes that representative investors do not fully update their beliefs when they receive new public information. In contrast, we show that analysts’ forecast revisions are incomplete and that the level of completeness is significantly associated with post-forecast-revision drift, suggesting that the drift is driven by analysts’ incomplete forecast revisions rather than by investors’ underreaction to available news in revisions. We focus on scenarios where the forecast revision completeness and the underreaction explanations lead to contrasting predictions for the drift. Our findings suggest that prices adjust slowly to forecast revision news because analysts gradually reveal available information (i.e., forecast revisions are incomplete) and investors cannot readily extract this information from publicly disclosed forecasts, consistent with Hong and Stein’s (1999)gradual information diffusion theory.
Second, we show that analysts’ forecast revisions are less complete with respect to industry-wide information than to firm-specific information. This difference is important because prior research suggests that analysts are industry specialists (e.g., Boni & Womack, 2006; Hui & Yeung, 2013; Hutton et al., 2012; Ramnath, 2002). Thus, their industry-wide information is likely to incorporate insights on macroeconomic events that are unavailable elsewhere. Estimating the underlying industry-wide and firm-specific information from forecast revisions is likely to pose a significant challenge to market participants, which could slow the diffusion of information in capital markets.
Third, we provide further insights on the diffusion of information to investors. We extend Hong et al.’s (2000) finding that firm-specific information diffuses gradually across the investing public by showing that a substantial part of analysts’ forecast bias is common to all firms in the same industry followed by the analyst. Moreover, we identify an ex ante analyst attribute, that is, optimism, that predicts the completeness of analysts’ forecast revisions. Our findings suggest that analysts who have a history of optimism issue highly optimistic forecasts early in the fiscal year and only gradually correct the optimistic bias in their revisions, resulting in incomplete downward forecast revisions.
Related Literature and Hypothesis Development
Related Literature
Prior research suggests that analysts may bias their forecasts for several reasons, including increasing access to managers’ private information (e.g., Lim, 2001), improving investment banking ties (Hong et al., 2000; McNichols & O’Brien, 1997; Scherbina, 2008), and enhancing their career prospects (Hong & Kubik, 2003; Scharfstein & Stein, 1990; Trueman, 1994; Welch, 2000). In a related study, Raedy et al. (2006) explain that analysts may rationally underreact to available information in issuing forecasts if their reputation suffers more when subsequent information causes a contrary (opposite-sign) revision than when it causes a consistent (same-sign) revision.
We develop a measure of the completeness of analyst forecast revisions to estimate the extent of bias in analyst forecasts. We measure forecast completeness using the association between forecast revisions and the news in upcoming earnings. We base this measure on Trueman’s (1994) conclusion that under certain circumstances, analysts release forecasts that are closer to prior earnings expectations than is warranted by their private information, thus inducing a positive relation between the forecast revision and the ex post forecast error. We use the strength of this relation to estimate how much of available information analysts incorporate in their forecast revisions. 4
Prior studies show that prices continue to drift in the direction of forecast revisions and attribute this to investors’ underreaction to available news in forecast revisions, that is, the underreaction explanation (e.g., Givoly & Lakonishok, 1980; Gleason & Lee, 2003; Stickel, 1991). We argue that the completeness of forecast revisions with respect to available information is likely to contribute to the delayed market response to forecast revisions because investors do not fully anticipate and correct for the biases in analyst forecasts (e.g., Basu et al., 2010; Bauman & Dowen, 1988; Bradshaw et al., 2006; Dechow et al., 2000; La Porta, 1996; So, 2013). 5 We expect investors to become aware of, and respond to, the incompleteness of analyst forecast revisions after the forecast date, causing post-forecast-revision returns to be positively associated with the information that analysts withhold from their forecasts. We label this the forecast revision completeness explanation of post-forecast-revision drift. Under the forecast revision completeness explanation, we expect the drift to be closely associated with the completeness of forecast revisions. These conjectures lead to our first hypothesis:
Industry factors play a large role in explaining firm performance, and prior research suggests that analysts are industry specialists whose forecasts provide rich industry-wide information (e.g., Boni & Womack, 2006; L. D. Brown et al., 2015; K. Chan & Hameed, 2006; Hutton et al., 2012; Piotroski & Roulstone, 2004; Ramnath, 2002). Furthermore, analysts are likely to have more reliable information about macroeconomic and industry-related news than about firm-specific events (Hutton et al., 2012). Motivated by these findings, Hui and Yeung (2013) decompose forecast revisions into firm-specific and industry-wide components and find that the association between forecasted and future earnings is greater for the industry-wide component of the forecast than for the firm-specific component. However, they find that stock prices behave as if investors underweight the industry-wide forecasts. Consistent with this, they find substantial drift associated with the industry-wide component but none with the firm-specific component and conclude that the drift is driven by investors’ underreaction to industry-wide information in forecast revisions. They do not, however, examine whether analysts themselves fully incorporate industry-wide and firm-specific information in their forecasts. The inherent assumption in their conclusion is that there is no difference in the completeness of industry-wide and firm-specific components of forecast revisions. The completeness of analysts’ industry-wide forecast revisions is especially important because analysts are widely viewed as experts capable of understanding and incorporating macroeconomic and industry-related news in their forecasts (Hutton et al., 2012). We conjecture that analysts may respond less completely to the industry component of industry-wide news than to the firm-specific component for two reasons. First, in spite of their expertise, analysts may suffer from functional fixation and incorporate the higher persistence of the industry-wide news incompletely in their revisions. A second possibility is that analysts respond to incentives to withhold private information and/or provide consistent (same-sign) revisions. Because analysts are likely to develop private information primarily at industry-level, this may result in forecast revisions that are less complete with respect to industry-wide information than to firm-specific information. We expect the complexity of the forecast decomposition to prevent investors from inferring the completeness of forecast revision components in practice. If so, Hui and Yeung’s finding that the drift is mainly driven by the industry-wide component would also be consistent with the forecast revision completeness explanation. These conjectures lead to our second hypothesis:
To further distinguish between the investor underreaction and forecast revision completeness explanations for drift, we identify circumstances in which analysts differentially withhold information from their revisions (the basis of our analysis) but where investors’ responses to analyst forecasts are consistent with forecast persistence (the basis of Hui and Yeung’s analysis). In these circumstances, Hui and Yeung’s framework would predict no association with post-forecast drift (because the association of forecasts with future earnings is consistent with investor responses), but our framework would predict a difference (because of differences in the completeness of analyst forecast revisions). We focus on the distinction between upward and downward forecast revisions for this purpose. Prior research suggests that analysts avoid delivering unfavorable news about the firms they cover because they are pressured both by the management of the firms they cover and by investment banking considerations (Hong et al., 2000; McNichols & O’Brien, 1997; O’Brien et al., 2005; Scherbina, 2008). Easterwood and Nutt (1999) conclude that analysts systematically underreact to negative information and overreact to positive information and suggest that this behavior explains the widespread finding that analysts tend to be optimistic. Furthermore, upward forecast revisions could be excessive (i.e., larger than is warranted by the analyst’s private information, and thus induce a negative relation between forecast revisions and the upcoming news). Hugon et al. (2016) find that analysts underreact to negative macroeconomic news, suggesting that forecast revisions for negative industry-wide information are likely to be incomplete. Thus, we expect analysts’ downward forecast revisions to be less complete than their upward forecast revisions. Under the forecast revision completeness explanation, this implies that the post-forecast-revision drift should be stronger for downward forecast revisions than for upward forecast revisions. 6 Together, these conjectures lead to our next set of hypotheses, expressed in alternate form:
We expect the association between downward forecasts and both forecast completeness and post forecast revision drift to be stronger early in the period because prior evidence suggests that analysts issue overly optimistic forecasts early in the fiscal year and gradually reveal their private information as they subsequently walk down their forecasts. 7 Consequently, we expect downward forecast revisions to be less complete early in the fiscal period than later on. We also expect a stronger association for analysts who tend to be optimistic, which we estimate using analysts’ prior forecast optimism. 8 We argue that investors do not fully anticipate the optimistic bias in forecasts issued by prior optimistic analysts. We expect optimistic analysts’ downward forecasts to be less complete than those of other analysts and expect stronger post-forecast-revision drift after their downward forecast revisions. We examine these conjectures empirically but do not propose formal hypotheses.
Conceptual Framework: The Completeness of Analysts’ Overall, Industry-Wide, and Firm-Specific Forecast Revisions
In this section, we develop a model of the relation among the publicly available information, the analyst’s forecast revision, and actual earnings, which researchers can use to infer the completeness of the analyst’s forecast revision. We refer to the total earnings news potentially available before an analyst i issues a forecast on day t for firm j as

where
The subscripts i and t are assumed below.
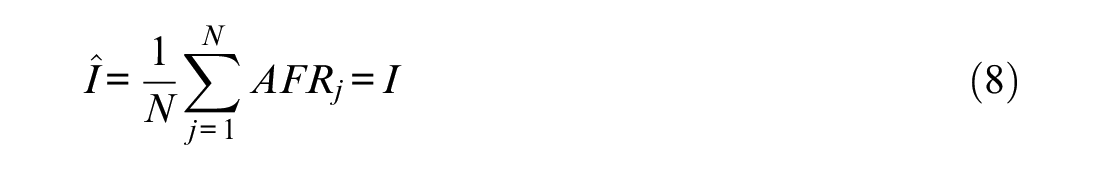
At the forecast date, the analyst implicitly separates the total available pre-forecast news, T, into the forecast revision news (AFR) and upcoming news measured on the forecast date (UpcomingNews F ), where the second component is the difference between total earnings news and the forecast revision news. If analysts incorporate the total news unbiasedly, then UpcomingNews will simply equal analysts’ random forecast error and therefore will be unrelated to their forecast revisions:

Prior studies find that analysts bias their forecasts, which we model as a multiplicative factor, p, on total news. A factor of 1 represents an unbiased forecast while a factor less than 1 indicates that the analyst incorporates only part of the private information in the forecast, leading to an incomplete forecast revision. Thus, the forecast revisions analysts provide are

where
p = proportion of the total available information the analyst incorporates in the forecast.
Upcoming news is related to the total news if analysts bias their forecasts:

Using

We cannot observe the news available to the analyst at the time of the forecast. Instead, we observe reported news that differs from Tj because of shocks that occur between the forecast revision and the earnings announcement dates. We assume that these shocks introduce random errors into UpcomingNews in Equation 5. For estimation purposes, we measure UpcomingNews for each analyst forecast revision using the firm’s announced earnings. Because UpcomingNews is our dependent variable, the shocks to UpcomingNews after the analyst forecast revision date lead to errors in the dependent variable that have no impact on the magnitude of coefficient estimates but increase their standard errors. We investigate the completeness of analyst forecast revisions by regressing UpcomingNews on the forecast revision:

The estimated slope coefficient is
We next extend our framework to estimate the completeness of the industry-wide and firm-specific information in analyst forecast revisions. We conjecture that analysts privately observe distinct news about industries and about firms and then decide how much of each component to reveal in their forecasts. If they incorporate the industry-wide and firm-specific information in their revisions unbiasedly, then their forecast revisions based on this information would be:

where
For ease of exposition, we omit the industry- and firm-specific errors in analyst forecast revisions, vI and vf, below, and also continue to exclude the i and t subscripts.
Researchers can estimate the industry-wide and firm-specific news components from the N forecasts that an analyst issues for firms in industry I on a given forecast date (Hui & Yeung, 2013): 10
and

Consistent with our discussion of bias above, we allow for distinct bias factors in industry-wide and firm-specific component of news, represented by k for industry-wide news and l for firm-specific news. Thus, the forecast revisions analysts provide are

The researcher estimates the components of news in the forecast revision as
As we note above, the total news potentially available just before the analyst announces a forecast is T. The analyst forecast separates this news into the forecast revision news (AFR*) and upcoming news measured on the forecast date (UpcomingNews F ) components, with the second component measured as the difference between total earnings news and the forecast revision news (or equivalently, the difference between the actual earnings the analyst anticipated on the forecast date and the analyst’s forecast) 11 :

We obtain the industry-wide and firm-specific components of the analyst’s forecast revision, I* and f*, using the Hui and Yeung averaging procedure. As we explain above, we assume that shocks to UpcomingNews after the analyst forecast revision date introduce random errors in Equation 11. Thus, we investigate the completeness of industry-wide and firm-specific information in analyst forecast revisions by regressing UpcomingNews on the forecast revision components:

The estimated slope coefficients are
Sample Selection and Variable Measurement
We obtain analysts’ annual earnings forecasts for the current year from 2004 to 2013 from the IBES detail file and obtain stock returns from the CRSP database through 2014. As in Gleason and Lee (2003), we measure forecast revisions (REV) as the difference between an analyst’s current and most recent prior forecasts for the same firm-year and scale this difference by stock price 2 days prior to the revision. 13 We include forecasts issued no later than 30 days before the fiscal year end (Clement & Tse, 2005). We restrict the sample to firms with December fiscal year-ends to ensure that our fiscal period data are aligned across the sample; eliminate forecast revisions with stock prices less than five dollars to ensure that our results are not induced by low-priced stocks; and drop observations in the top and bottom percentile of revisions.
Hui and Yeung (2013) identify their sample from an analyst’s simultaneous forecasts for firms in the same industry (analyst industry reports) in Investext. They use industry reports to minimize errors in estimating industry-wide and firm-specific forecast components and restrict their sample to firms in the manufacturing sector to facilitate manual matching of forecasts from industry reports with IBES forecasts. Unlike Hui and Yeung (2013), we use Standard Industry Classification (SIC) codes to identify industries and are therefore able to expand our sample beyond the manufacturing sector. 14
We next measure the industry-wide and firm-specific components of an analyst’s forecast revision (IndREV and FirmREV, respectively). Based on prior literature (Ayers & Freeman, 1997; P. Brown & Ball, 1967; Elgers et al., 2008; Hui & Yeung, 2013), we define the industry-wide forecast revision as the common component of an analyst’s forecast revisions for all firms in the same industry, measured as the average of the analyst’s forecast revisions within a 3-day interval for firms with the same two-digit SIC code. We define firm-specific revisions as the deviations of the analyst’s forecast revisions for individual firms from the industry average, the difference between REV and IndREV. To construct meaningful industry averages, we require that an analyst issues forecast revisions for at least three firms in the same two-digit industry over the 3 days we use to identify a set of industry forecast revisions. 15 We calculate upcoming news following a forecast revision as the difference between actual reported earnings and the revised forecast. We measure the post-forecast-revision drift using size-adjusted percentage excess returns starting 2 days after the revision and extending over 1 year (EXRET). Finally, we eliminate observations with missing market value (MV), book-to-market ratio (BM), and momentum (MOMENTUM), calculated as value-weighted market-adjusted returns over the 6 months prior to the forecast revision date. Our final sample contains 224,960 forecast revisions. 16
Table 1, Panel A provides descriptive statistics for the variables. We report the forecast revision (REV), upcoming news (UpcomingNews), total available news (TotalNews), firm-specific revision (FirmREV), industry-wide revision (IndREV), and returns as percentages of stock price for ease of presentation. The mean TotalNews is −0.467, indicating that analysts’ pre-revision forecasts are on average optimistic. The mean REV and UpcomingNews are −0.076 and −0.391, respectively, which indicate that analysts’ forecast revisions only partially reveal the total bad news, with the remainder revealed in upcoming news. Mean and median values for the components of forecast revisions are 0.000 and 0.013, respectively, for FirmREV and −0.076 and −0.015, respectively, for IndREV, so industry-wide news is on average negative. The mean of FirmREV is zero because it is measured as the deviation from mean forecasts. The quartiles and mean of IndREV are similar to those of REV, indicating that the means for the industry-groups have a distribution similar to that of firm-specific observations in the entire sample. 17 In Panel B, we report the correlations among key variables and find that UpcomingNews is positively correlated with analysts’ forecast revisions (REV) as well as with its firm-specific and industry-wide components (FirmRev and IndREV), suggesting that forecast revisions are on average incomplete. We also find that REV, FirmREV, and IndREV are positively correlated with subsequent excess returns (EXRET), indicating that prices continue to move in the direction of forecast revisions.
Descriptive Statistics and Correlations.
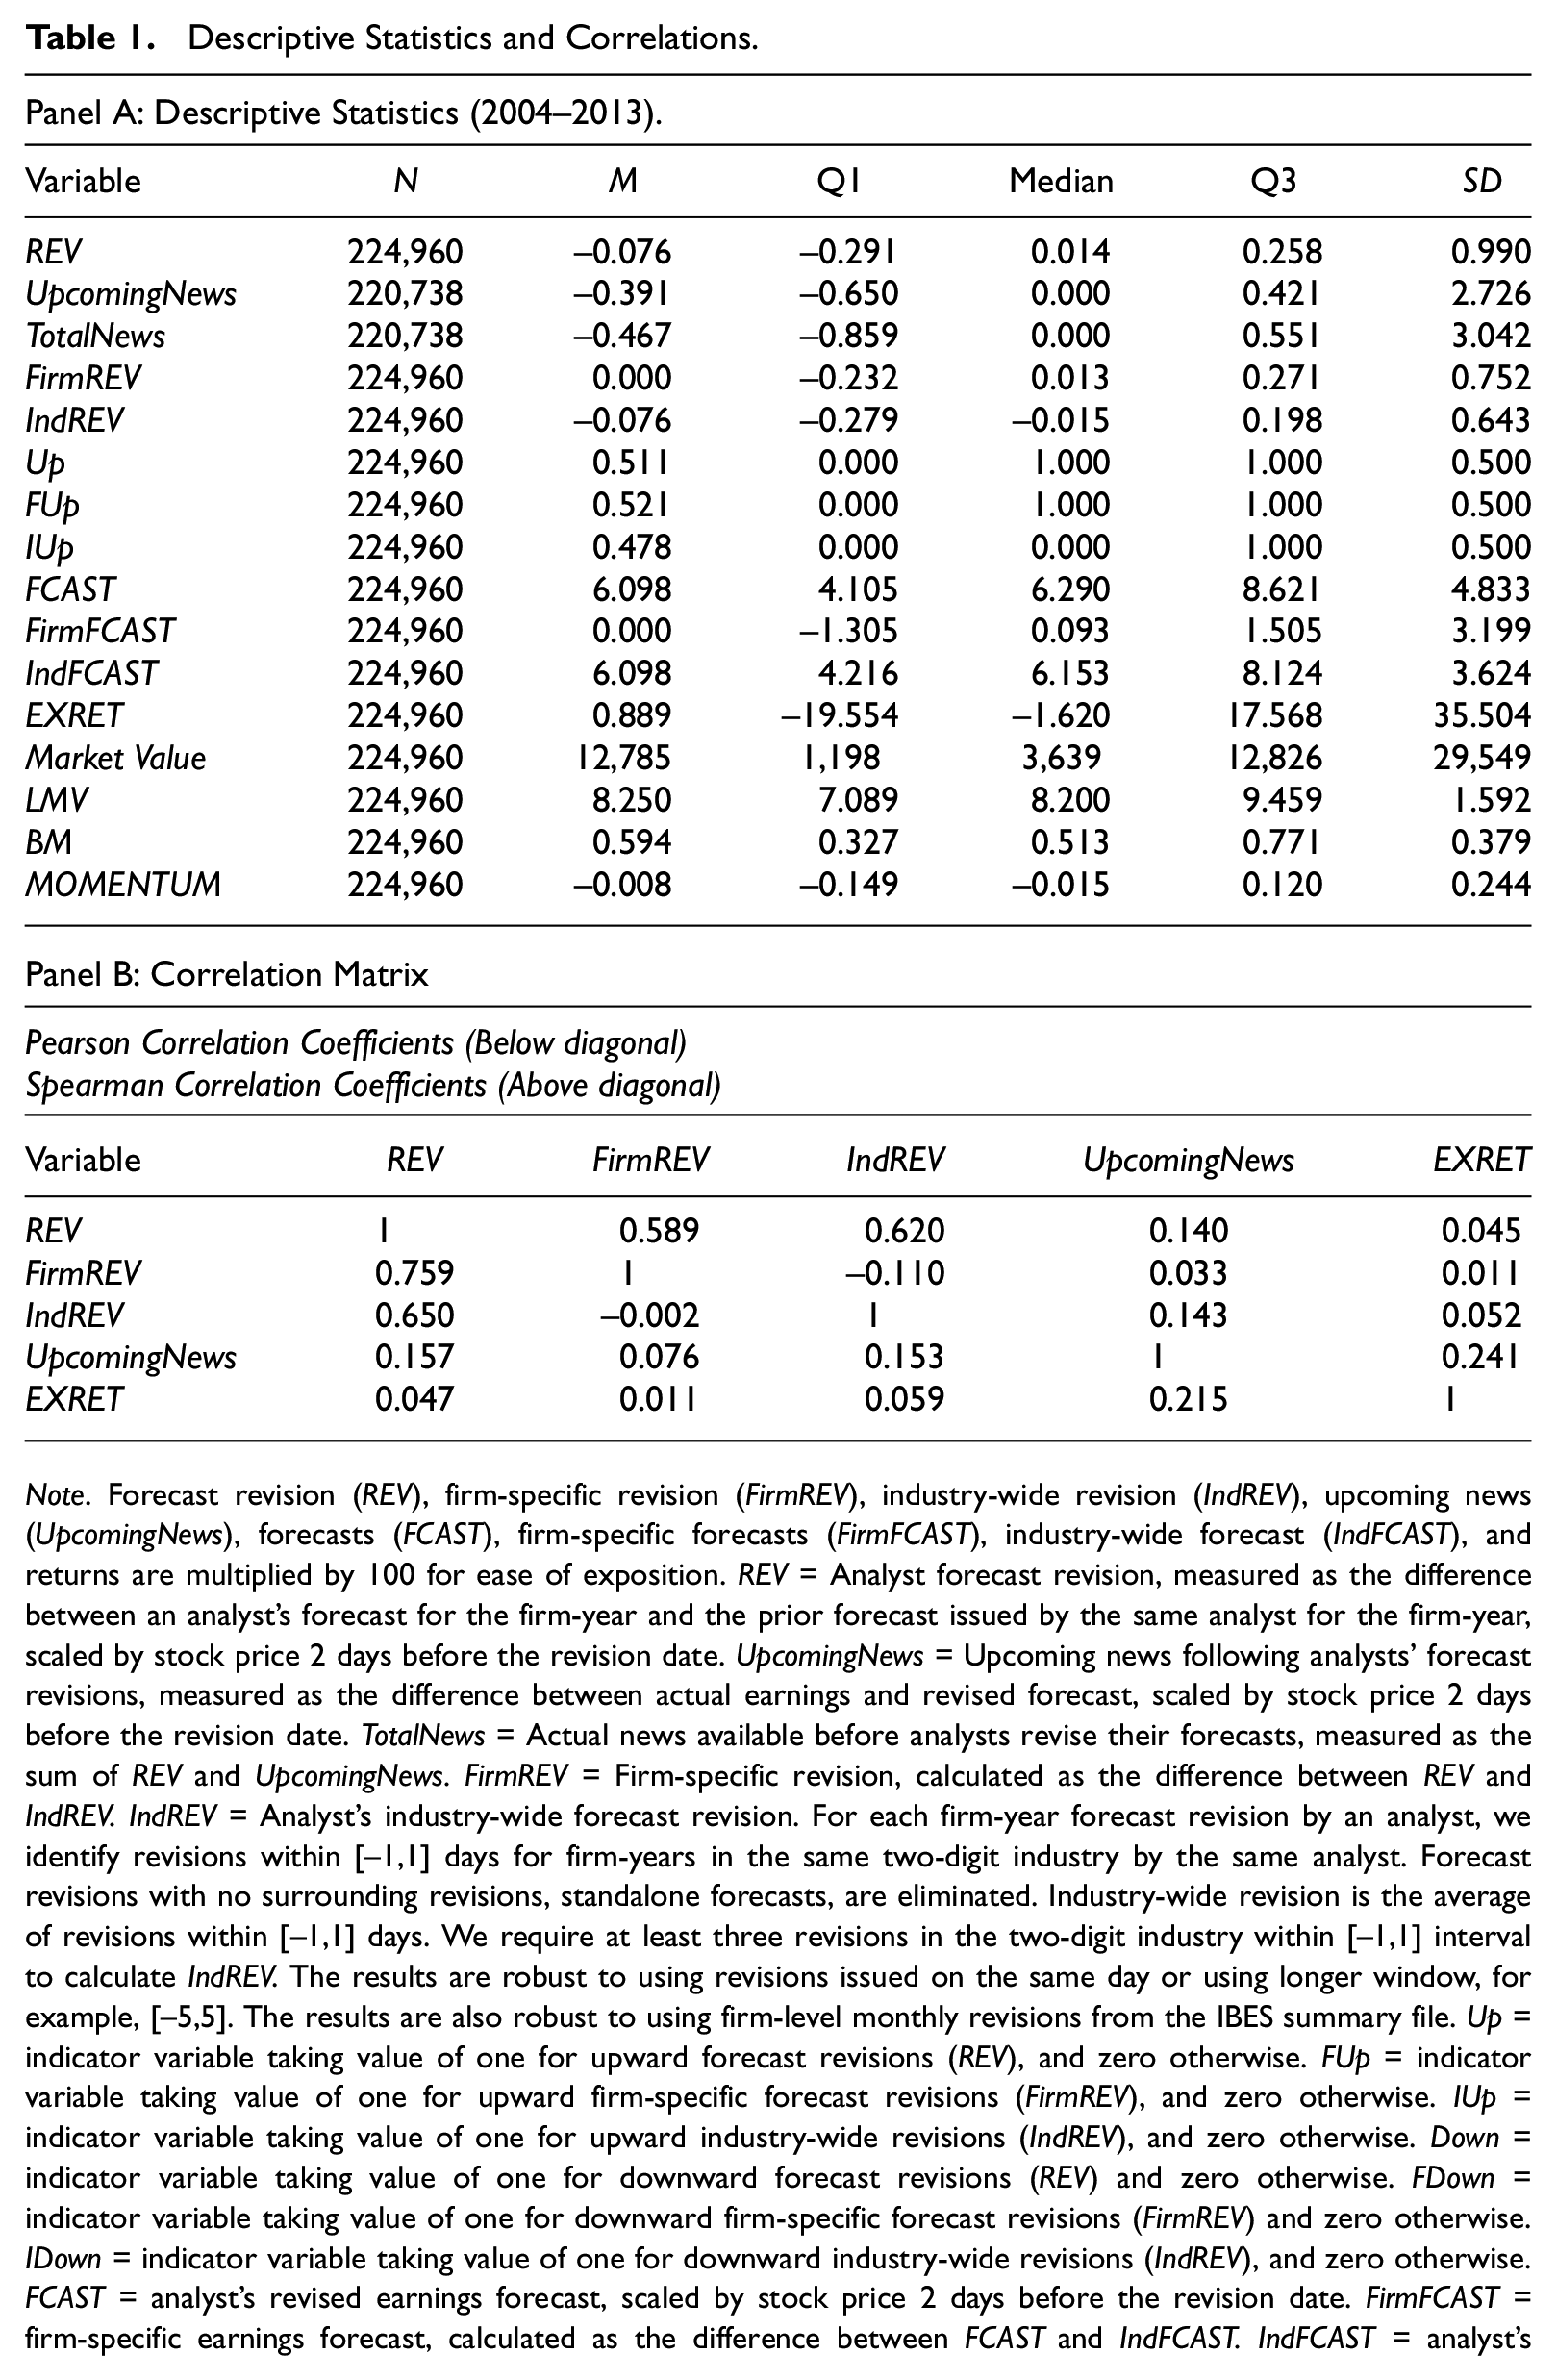
Note. Forecast revision (REV), firm-specific revision (FirmREV), industry-wide revision (IndREV), upcoming news (UpcomingNews), forecasts (FCAST), firm-specific forecasts (FirmFCAST), industry-wide forecast (IndFCAST), and returns are multiplied by 100 for ease of exposition. REV = Analyst forecast revision, measured as the difference between an analyst’s forecast for the firm-year and the prior forecast issued by the same analyst for the firm-year, scaled by stock price 2 days before the revision date. UpcomingNews = Upcoming news following analysts’ forecast revisions, measured as the difference between actual earnings and revised forecast, scaled by stock price 2 days before the revision date. TotalNews = Actual news available before analysts revise their forecasts, measured as the sum of REV and UpcomingNews. FirmREV = Firm-specific revision, calculated as the difference between REV and IndREV. IndREV = Analyst’s industry-wide forecast revision. For each firm-year forecast revision by an analyst, we identify revisions within [–1,1] days for firm-years in the same two-digit industry by the same analyst. Forecast revisions with no surrounding revisions, standalone forecasts, are eliminated. Industry-wide revision is the average of revisions within [–1,1] days. We require at least three revisions in the two-digit industry within [–1,1] interval to calculate IndREV. The results are robust to using revisions issued on the same day or using longer window, for example, [–5,5]. The results are also robust to using firm-level monthly revisions from the IBES summary file. Up = indicator variable taking value of one for upward forecast revisions (REV), and zero otherwise. FUp = indicator variable taking value of one for upward firm-specific forecast revisions (FirmREV), and zero otherwise. IUp = indicator variable taking value of one for upward industry-wide revisions (IndREV), and zero otherwise. Down = indicator variable taking value of one for downward forecast revisions (REV) and zero otherwise. FDown = indicator variable taking value of one for downward firm-specific forecast revisions (FirmREV) and zero otherwise. IDown = indicator variable taking value of one for downward industry-wide revisions (IndREV), and zero otherwise. FCAST = analyst’s revised earnings forecast, scaled by stock price 2 days before the revision date. FirmFCAST = firm-specific earnings forecast, calculated as the difference between FCAST and IndFCAST. IndFCAST = analyst’s industry-wide earnings forecast. For each firm-year forecast by an analyst, we identify earnings forecasts within [–1,1] days for firm-years in the same two-digit industry by the same analyst. Industry-wide forecast is the average of forecasts within [–1,1] days. We require at least three forecasts in the two-digit industry within the [–1,1] interval to calculate IndFCAST. EXRET = size adjusted percentage excess returns over 1 year beginning 3 days following the forecast revision date. Market Value = market value at the beginning of the year. LMV = logarithm of market value. BM = book to market ratio at the beginning of the year. MOMENTUM= Value-weighted market adjusted returns over 6 months prior to forecast revision date. Panel B reports the Pearson correlation coefficients (below diagonal) and Spearman correlation coefficients (above diagonal) among REV, FirmREV, IndREV, UpcomingNews, and EXRET. All correlations in the table are significant at better than the 1% level.
Specification of Empirical Tests and Results
The Completeness of Analyst Forecast Revisions and Post-Forecast Revision Drift
In this section, we examine the completeness of analysts’ forecast revisions (estimated using the association of upcoming news with analyst forecast revisions) and its association with post-forecast revision drift. We control for variables that prior studies find are associated with future returns because they may be correlated with forecast revisions and/or upcoming news. We estimate forecast completeness using the following model:

All variables are defined in Table 1.
We report the estimation results in Column 1 of Table 2. 18 We find that the coefficient on the forecast revision is 0.372 and is significant at the 1% level. This positive relation supports hypothesis H1a and suggests that analysts only partially reveal the underlying earnings news when they revise their forecasts. Using our analytic model, we estimate the completion proportion as 0.729, indicating that analysts incorporate about 72.9% of the available total news in their forecast revisions. 19
Analysts’ Forecast Revision Completeness and Post-Forecast-Revision Drift (N = 224,960).
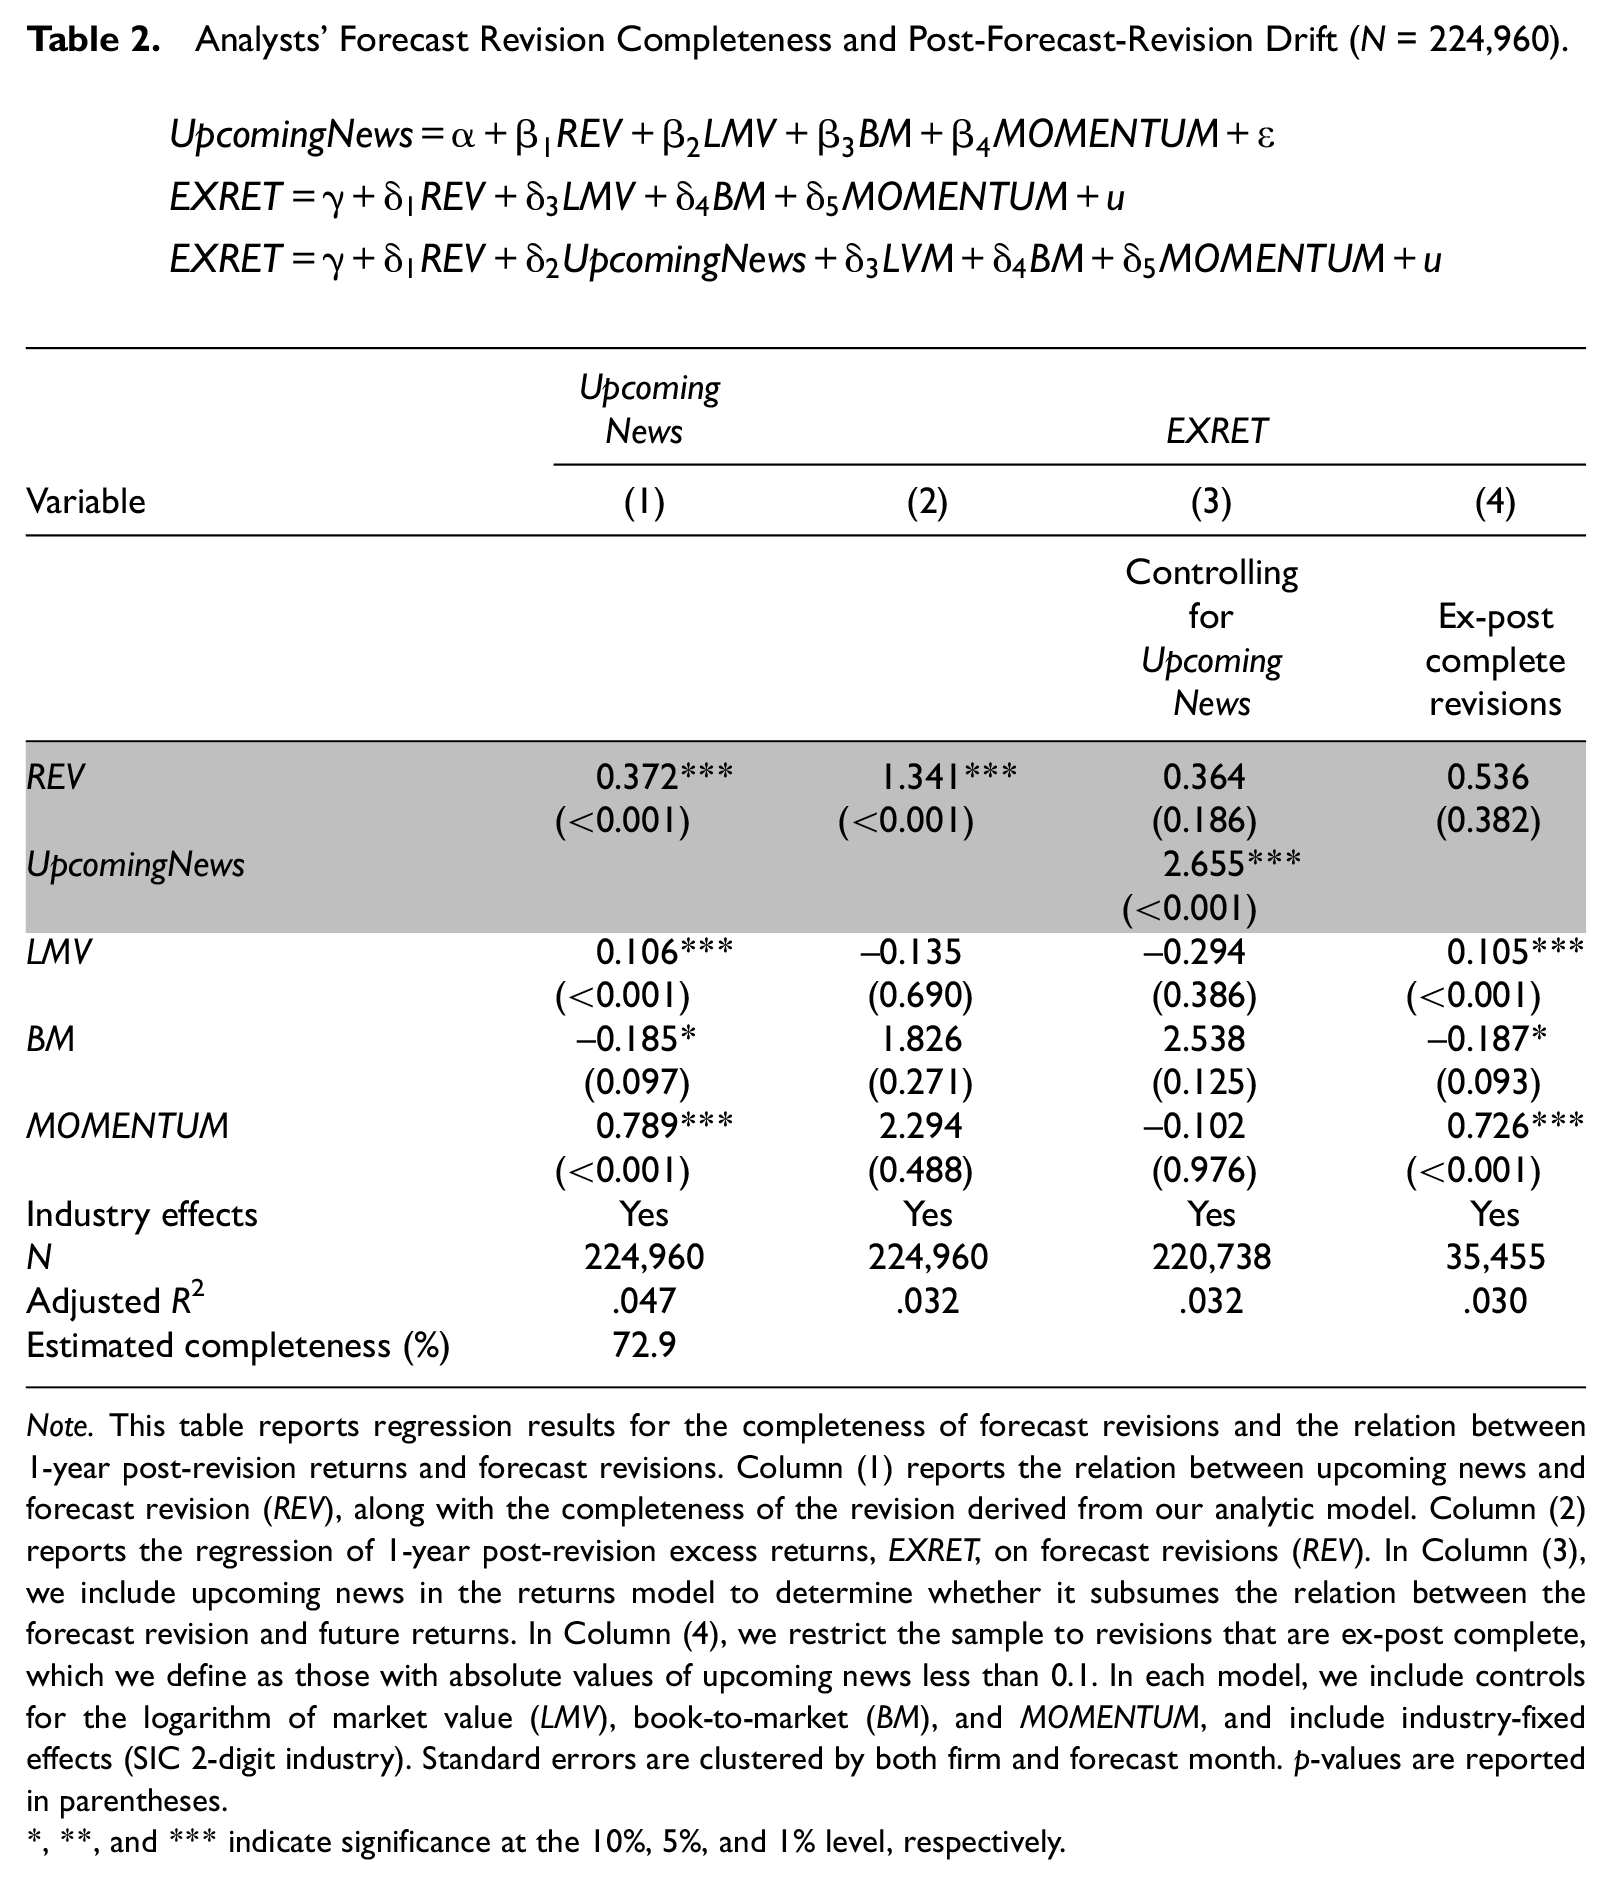
Note. This table reports regression results for the completeness of forecast revisions and the relation between 1-year post-revision returns and forecast revisions. Column (1) reports the relation between upcoming news and forecast revision (REV), along with the completeness of the revision derived from our analytic model. Column (2) reports the regression of 1-year post-revision excess returns, EXRET, on forecast revisions (REV). In Column (3), we include upcoming news in the returns model to determine whether it subsumes the relation between the forecast revision and future returns. In Column (4), we restrict the sample to revisions that are ex-post complete, which we define as those with absolute values of upcoming news less than 0.1. In each model, we include controls for the logarithm of market value (LMV), book-to-market (BM), and MOMENTUM, and include industry-fixed effects (SIC 2-digit industry). Standard errors are clustered by both firm and forecast month. p-values are reported in parentheses.
, **, and *** indicate significance at the 10%, 5%, and 1% level, respectively.
Next, we confirm that prices continue to drift in the direction of forecast revisions by estimating the relation between future returns and forecast revisions in Equation 14a:

All variables are defined in Table 1.
The results, reported in Column 2 of Table 2, show that analyst forecast revisions are positively associated with future returns, confirming prior evidence that prices continue to drift in the direction of forecast revisions. To determine the extent to which the drift is explained by incomplete revisions, we include upcoming news as an explanatory variable in Equation 14a to derive Equation 14b:

We report the results in Column 3 of Table 2, and find that the forecast revision coefficient decreases substantially from 1.341 in Column 2 to 0.364, which is statistically insignificant. These findings suggest that the positive relation between revisions and future returns is mainly driven by completeness of forecast revisions rather than investors’ underreaction to the news embedded in forecast revisions.
We further distinguish between the underreaction and forecast revision completeness explanations by examining the post-forecast-revision drift associated with revisions that are subsequently revealed to have been accurate (i.e., ex post complete revisions), which we define as forecasts with |UpcomingNews| less than 0.01% of the price. 20 Under the underreaction explanation, prices should continue to move in the direction of forecast revisions even when analysts provide complete revisions. Instead, the estimation results for Equation 14a reported in Column (4) show no association between forecast revisions and returns for complete forecast revisions, indicating that there are no overall price movements when analyst forecasts fully reveal earnings information. Overall, our results for the relation between forecast revisions and returns support hypothesis H1b, and suggest that the drift is associated with the completeness of forecast revisions, inconsistent with the underreaction explanation.
The Completeness of the Industry-Wide and Firm-Specific Revision Components
Hui and Yeung (2013) find that post-forecast-revision drift is primarily associated with the industry-wide component of analyst forecast revisions and attribute this finding to investors’ failure to understand the differential persistence of firm-specific and industry-wide components of forecasts. Under the incomplete forecast revision explanation, we argue that the stronger drift associated with the industry-wide component can also arise because analyst forecast revisions are less complete with respect to industry-related information than to firm-specific information. We examine this possibility by estimating the relation between upcoming news and the forecast revision components:

The results, reported in Column 1 of Table 3, show that both components of analyst forecast revisions are significantly associated with upcoming news. More importantly, the FirmREV coefficient (0.247) is significantly smaller than the IndREV coefficient (0.551). These estimates indicate that an industry-wide forecast revision of a given size is associated with larger same-sign upcoming news than a similar firm-specific forecast revision. Our analytic model indicates that the firm-specific component of the analyst forecast revision is 80.2% complete compared with 64.5% for the industry-wide component. These starkly different completion percentages support hypothesis H2. In Column 2 of Table 3, we estimate the drift associated with the forecast revision components by modifying Equation 14a to replace REV with FirmREV and IndREV. The IndREV coefficient of 2.536 is significantly higher than the FirmREV coefficient of 0.516, confirming that drift is mainly driven by the industry-wide component and consistent with the forecast completion levels in Column 1. Overall, our results extend Hui and Yeung’s (2013) study by identifying analysts’ tendency to withhold a larger proportion of the industry-wide component of earnings news as a contributor to the post-forecast-revision drift. 21

The Completeness of the Firm-Specific and Industry-Wide Components of Forecast Revisions.

Note. This table reports the regression results for the completeness of forecast revision components. In Column (1), we regress UpcomingNews on firm-specific (FirmREV) and industry-wide (IndREV) components of forecast revisions. We calculate the completeness of analysts’ forecast revisions (REV) and the completeness of firm-specific and industry-wide components by applying our analytical model to coefficient estimates. Column (2) reports the results regression of 1-year post-revision excess returns, EXRET, on firm-specific (FirmREV) and industry-wide (IndREV) components of forecast revisions. We include controls for the logarithm of market value (LMV), book-to-market (BM), and MOMENTUM, and include industry-fixed effects (SIC 2-digit industry). Standard errors are clustered by both firm and forecast month. p-values are reported in parentheses.
, **, and *** indicate significance at the 10%, 5%, and 1% level, respectively.
Revision Completeness and the Drift Associated With Good News and Bad News
In this section, we use differences in analysts’ incentives to reveal good news versus bad news to examine the relation between forecast revision completeness and drift. We expect analysts’ downward revisions to be less complete than their upward revisions (H3a) and therefore expect stronger post-forecast drift for downward revisions than for upward revisions (H3b). We first examine the completeness of analysts’ upward and downward forecast revisions and their components by estimating the following models:


All variables are defined in Table 1.
We next estimate the completeness of the firm-specific and industry-wide revision components for upward and downward revisions using Equation 16b. The results, reported in Column 2 of Table 4, Panel A, suggest that downward forecast revisions are less complete than upward forecast revisions for both firm-specific and industry-wide forecast components. Specifically, the coefficients on FDown×FirmREV and IDown×IndREV are significantly positive, indicating that analysts only partially reveal firm-specific news and industry-wide news when the underlying news is bad. The coefficient on the upward firm-specific revisions, FUp×FirmREV, is –0.017, which suggests that upward firm-specific revisions are larger than warranted by analysts’ underlying good news. Analysts’ downward firm-specific revisions incorporate about 70.3% of bad news while upward firm-specific revisions reflect about 101.7% of available firm-specific good news. We estimate that analysts reveal about 63.1% of industry-wide bad news and about 85.1% of industry-wide good news. These findings provide further support for hypothesis H3a.
Forecast Revision Completeness and the Drift for Upward Versus Downward Revisions (N = 224,960).
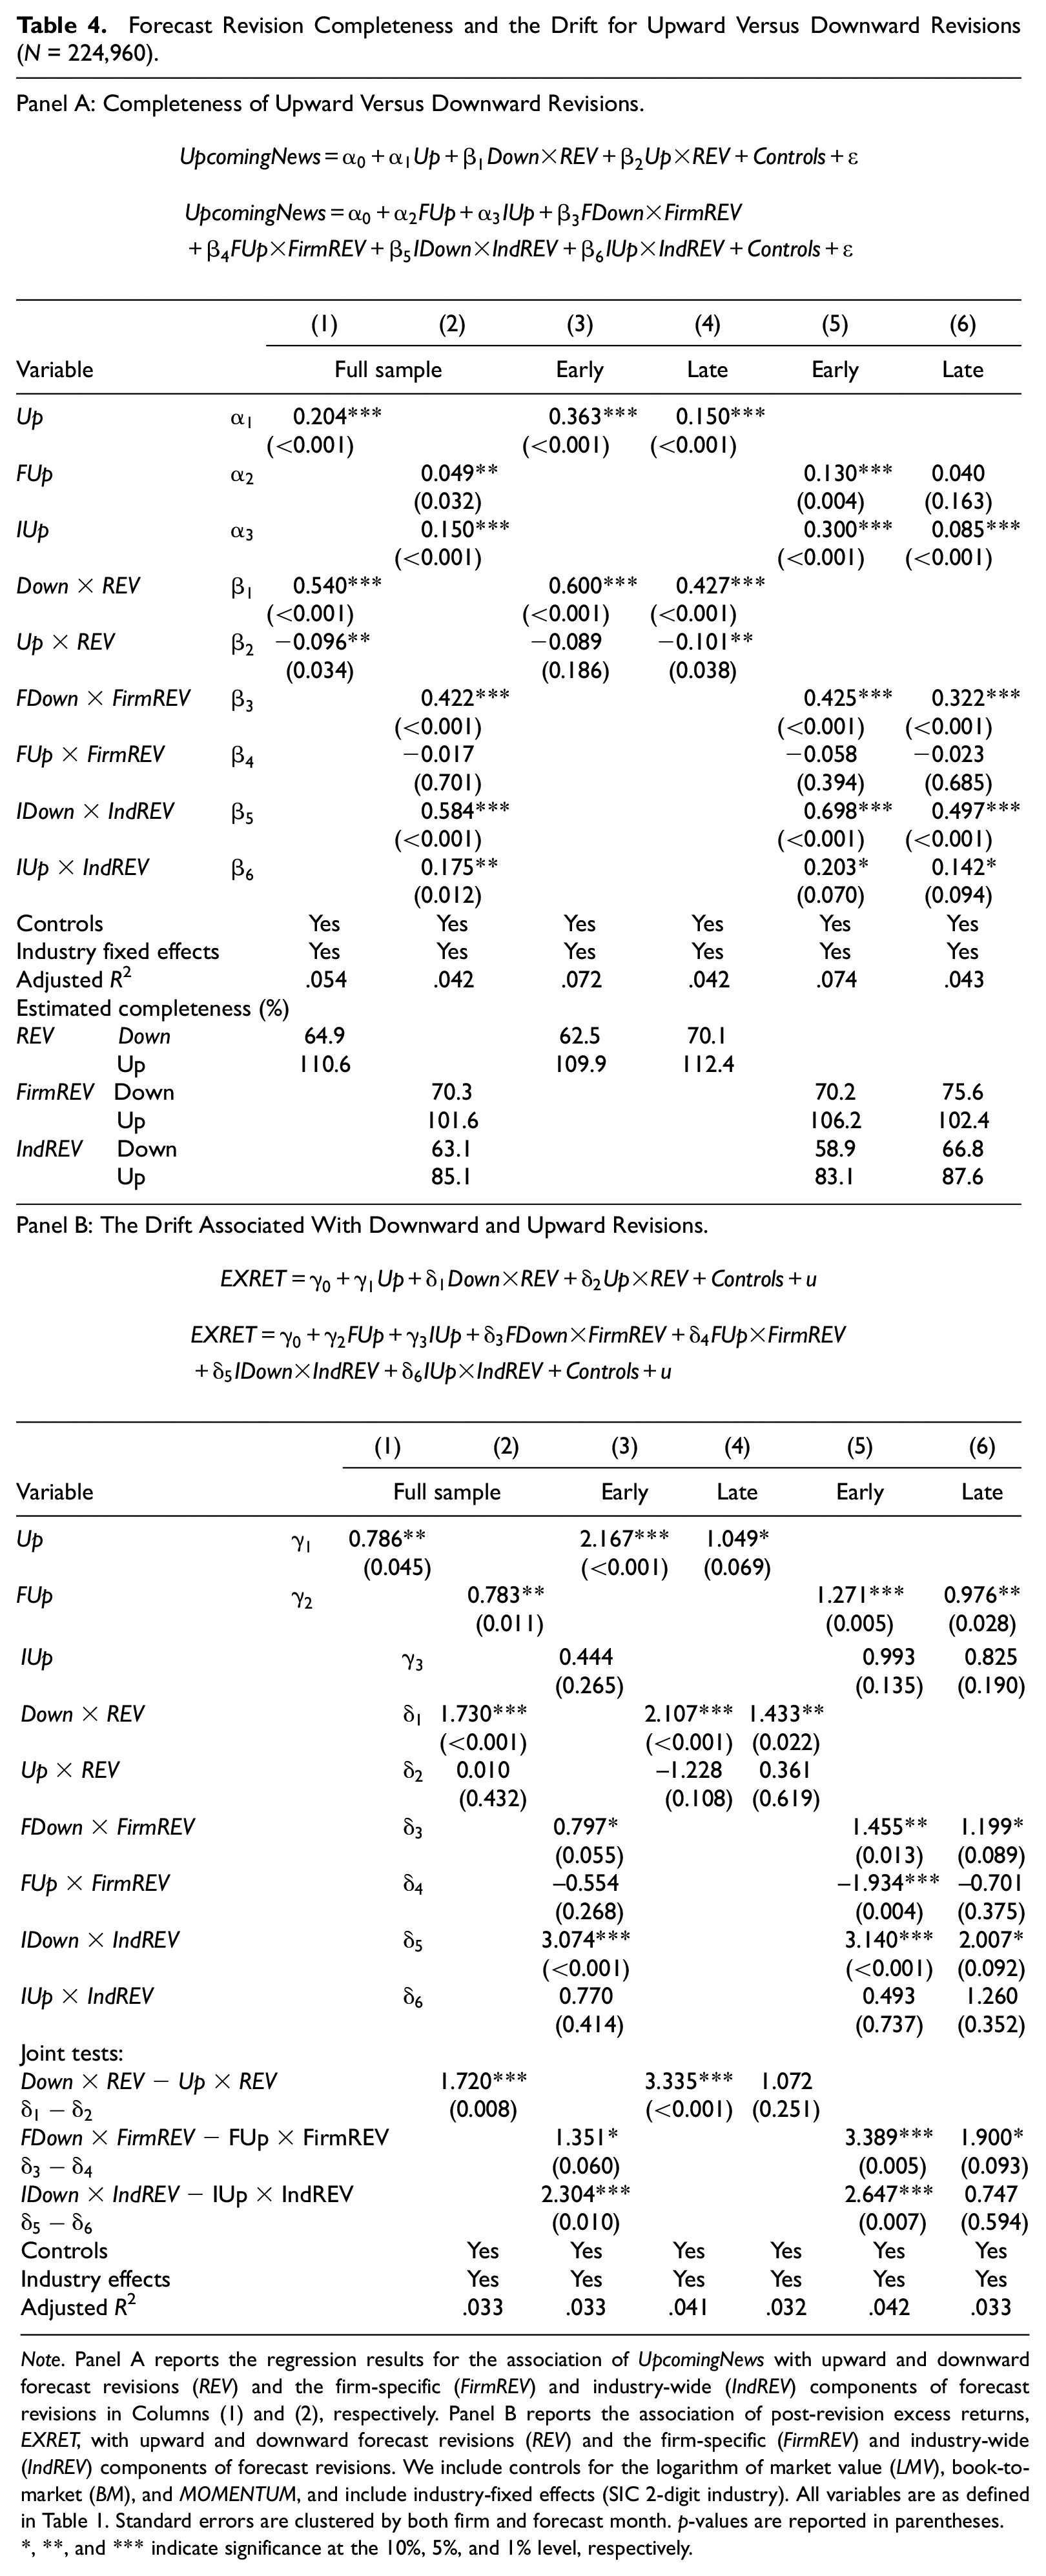
Note. Panel A reports the regression results for the association of UpcomingNews with upward and downward forecast revisions (REV) and the firm-specific (FirmREV) and industry-wide (IndREV) components of forecast revisions in Columns (1) and (2), respectively. Panel B reports the association of post-revision excess returns, EXRET, with upward and downward forecast revisions (REV) and the firm-specific (FirmREV) and industry-wide (IndREV) components of forecast revisions. We include controls for the logarithm of market value (LMV), book-to-market (BM), and MOMENTUM, and include industry-fixed effects (SIC 2-digit industry). All variables are as defined in Table 1. Standard errors are clustered by both firm and forecast month. p-values are reported in parentheses.
, **, and *** indicate significance at the 10%, 5%, and 1% level, respectively.
To investigate the relation between drift and forecast revision completeness, we next examine the excess returns associated with upward and downward forecast revisions and their firm-specific and industry-wide components by estimating the following models:

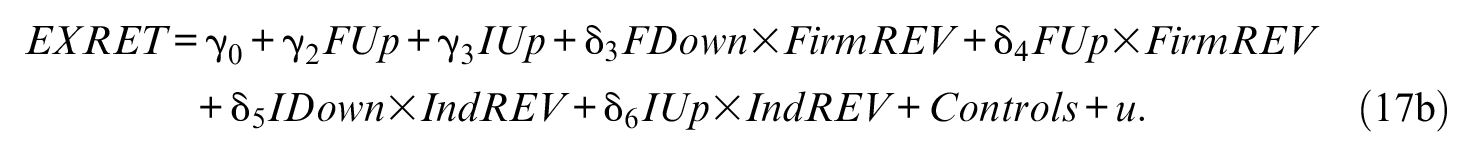
All variables are defined in Table 1.
We report the results in Panel B of Table 4. The results for Equation 17a in Column 1 show that the coefficient on DownREV is 1.730, significant at better than the 1% level, indicating significant drift following downward forecast revisions. The coefficient on upward forecast revisions is not statistically significant, indicating that there is no drift associated with upward forecast revisions. The results for Equation 17b in Column 2 yield similar inferences for the drift associated with firm-specific and industry-wide forecast revision components. Thus, consistent with H3b, we find stronger drift following downward revisions than following upward revisions, consistent with our conjecture that the post-forecast-revision drift is driven by investors’ failure to fully assess the completeness of analysts’ forecast revisions. In particular, we find that the drift is mainly driven by downward industry-wide revisions, which is the least complete component of forecast revisions.
Circumstances Where Forecast Revisions Are Likely to Be Less Complete and Forecast Revision Drift to Be Strong: Early Forecasts and Forecasts by Previously Optimistic Analysts
We classify forecasts as early versus late if they are issued in the second and fourth fiscal quarters, respectively. We estimate forecast completeness for each subsample using Equations 16a and 16b. The results, reported in Panel A of Table 4, Columns 3 and 4, are consistent with our predictions. Analysts’ downward revisions reveal about 62.5% and 70.1% of total available news in the early and late periods, respectively. In Columns 5 and 6, we find that analysts’ downward industry-wide revisions reveal about 58.9% and 66.8% of total available news in the early and late periods, respectively. Similarly, firm-specific downward revisions reveal about 70.2% and 75.6% of total available news in the early and late periods, respectively. Completeness is the lowest for downward industry-wide revisions, at 58.9% in the early period. In Panel B of Table 4, Columns 3 to 6, we find stronger drift for early downward forecasts than for late downward forecasts.
Turning to optimistic and non-optimistic analysts, in untabulated analyses, we find that upward revisions are complete regardless of analysts’ prior optimism. In contrast, the most optimistic analysts only reveal about 52.9% of available bad news. When we examine the industry-wide and firm-specific forecast components, we find that non-optimistic analysts’ downward revisions are complete for both components, but the most optimistic analysts’ downward revisions are 58.8% and 45.7% complete for the firm-specific and industry-wide components, respectively. 22 The results for drift are consistent with these patterns. Drift is most strongly associated with optimistic analysts’ downward total revisions and their downward revisions for the industry-wide forecast component, consistent with our findings that the most optimistic analysts only reveal about 52.9%, 58.8%, and 45.7% of the available bad news for the overall, firm-specific, and industry-wide news, respectively. These findings suggest that investors do not anticipate and correct for the related differences in revision completeness, leading to a strong positive relation between prior optimistic analysts’ downward forecast revisions and subsequent returns, consistent with the forecast revision completeness explanation.
Additional Analyses
In additional analysis, we examine the effect of the firm’s information environment on forecast revision completeness because prior research shows that the strength of post-forecast revision drift increases with information uncertainty (Jiang et al., 2005; Zhang, 2006b). Under the forecast revision completeness explanation, we expect forecast revisions to be less complete when information uncertainty is high. Using firm size as a proxy for firms’ information environment, we find results consistent with our expectations. Forecast revision completeness is 86.2% and 70.6% for large versus small firms, respectively (untabulated). Among small firms, forecast revisions reveal about 80.6% and 58.5% of the available firm-specific and industry-wide news, respectively. Furthermore, downward industry-wide revisions are the least complete category, revealing only about 52.2% of available news. Consistent with the completeness of forecast revisions, we find that the drift is concentrated among small firms and mainly driven by the downward industry-wide component.
We also examine discontinuity and non-linearity of forecast revision completeness and report the results in Table 5. We classify positive and negative forecast revisions as small if they are below the median for their respective groups and as large otherwise. We find that small upward revisions are about 83% complete while large positive revisions are 124% complete. Similarly, the completeness levels of small and large downward revisions are 52% and 70%, respectively. 23 Thus, our results indicate a discontinuity. Small upward revisions are almost complete while small downward revisions are only about 52% complete. The results also indicate non-linearity as we find that the completeness of downward revisions increases with the magnitude of revisions and that large upward revisions tend to be excessive (over 100% complete).
Nonlinearity in Analysts’ Forecast Revision Completeness.
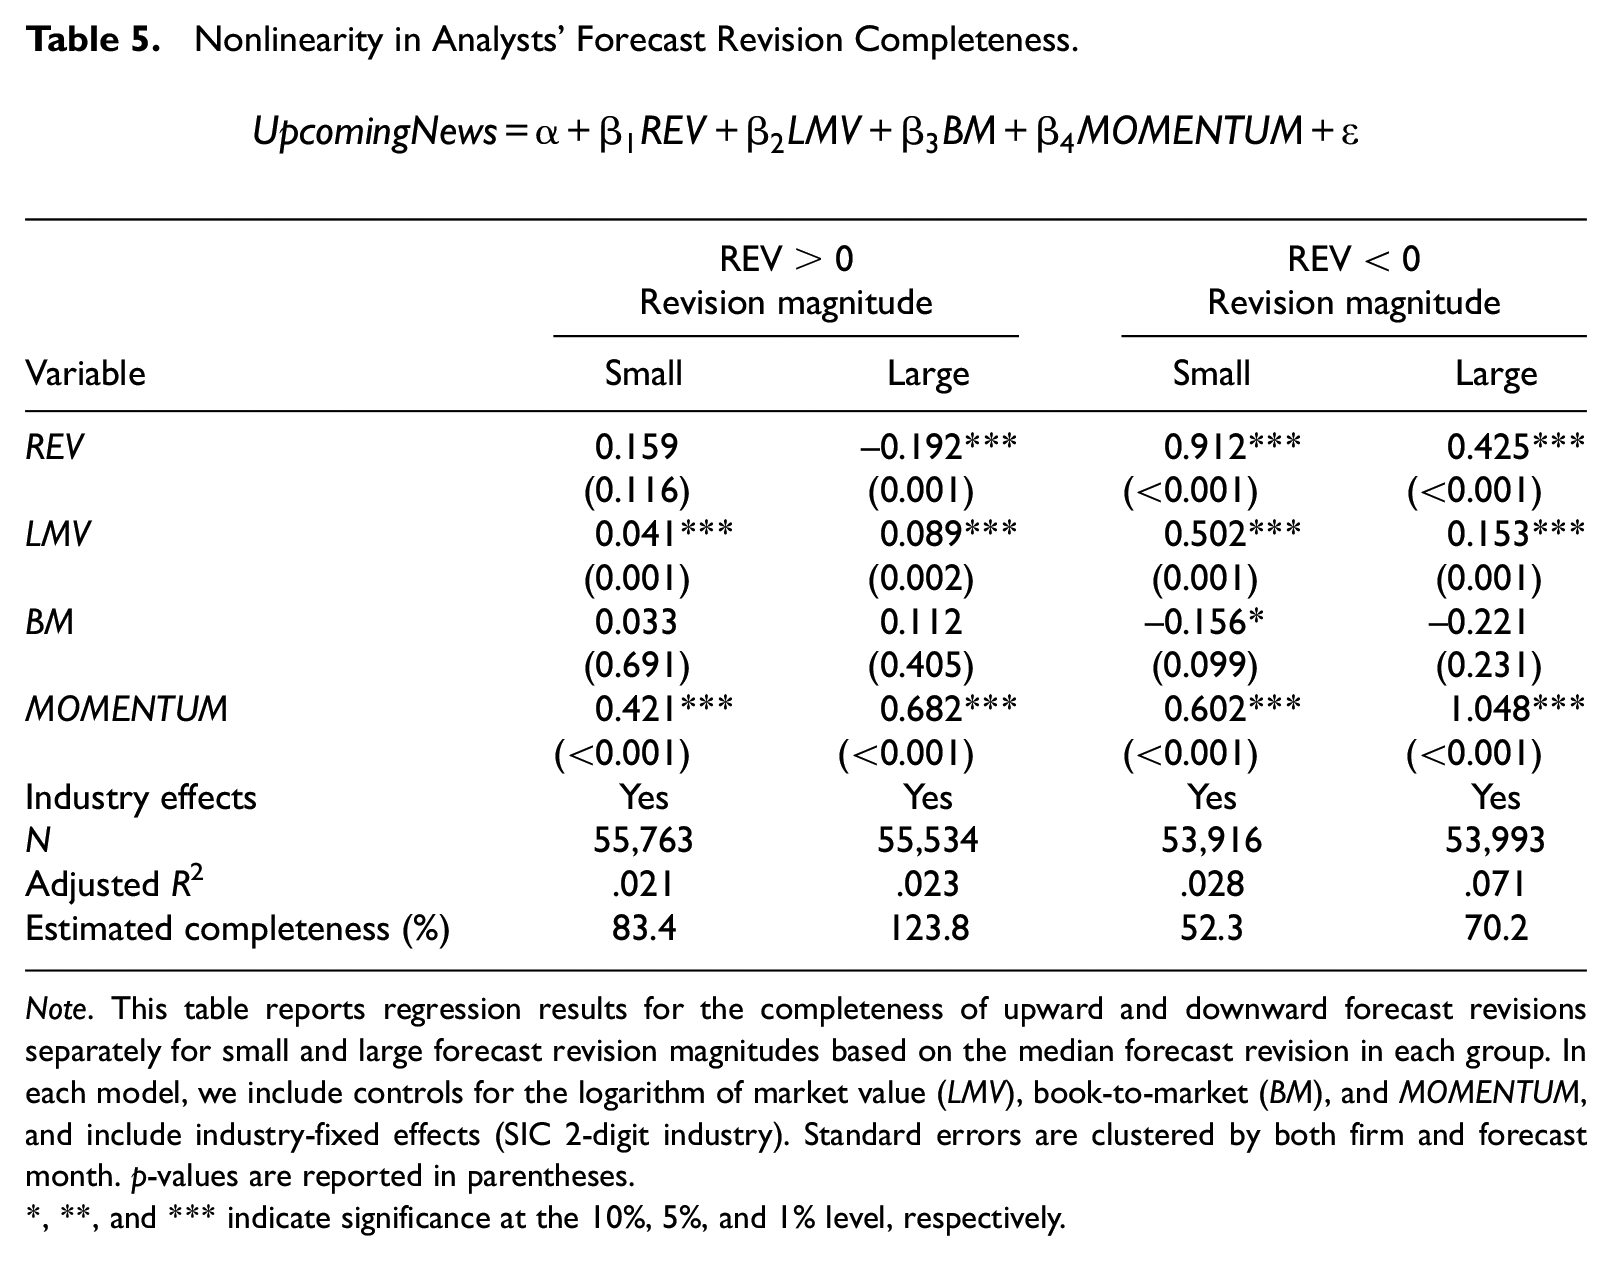
Note. This table reports regression results for the completeness of upward and downward forecast revisions separately for small and large forecast revision magnitudes based on the median forecast revision in each group. In each model, we include controls for the logarithm of market value (LMV), book-to-market (BM), and MOMENTUM, and include industry-fixed effects (SIC 2-digit industry). Standard errors are clustered by both firm and forecast month. p-values are reported in parentheses.
, **, and *** indicate significance at the 10%, 5%, and 1% level, respectively.
Is the Drift Pattern Consistent With the Underreaction Explanation?
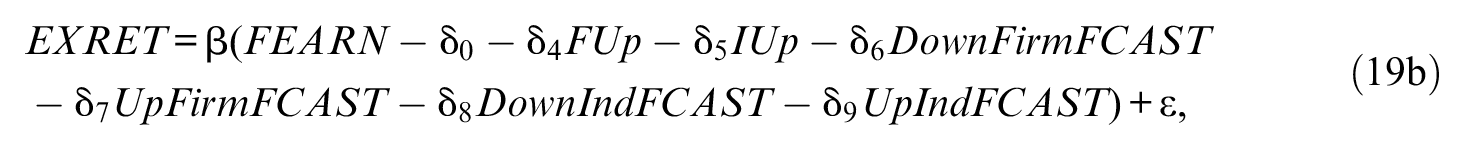
In this section, we use Hui and Yeung’s (2013) framework to examine investors’ response to forecasts to evaluate whether the drift pattern we observe is consistent with the underreaction explanation. In Hui and Yeung’s (2013) framework, the stronger drift associated with downward forecast revisions would be consistent with the underreaction explanation if investors respond less completely to forecasts with bad news than to those with good news. We examine this possibility by estimating the following persistence and pricing models:


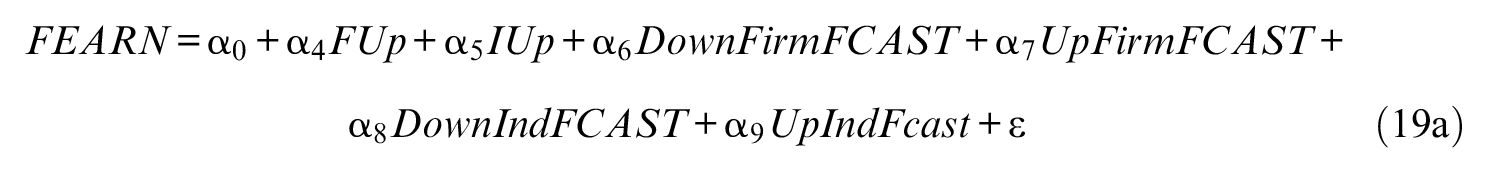
where:
FEARN = actual forecasted earnings.
DownFirmFCAST = FirmFCAST for downward firm-specific revisions, and zero otherwise.
UpFirmFCAST = FirmFCAST for upward firm-specific revisions, and zero otherwise.
DownIndFCAST = IndFCAST for downward industry-wide revisions, and zero otherwise.
UpIndFCAST = IndFCAST for upward industry-wide revisions, and zero otherwise.
All other variables are defined in Table 1.
Following Hui and Yeung (2013), we estimate the models using the Mishkin methodology in the early and late periods and report the results in Table 6. We measure underreaction as the difference in the coefficient on FCAST between the earnings and returns models. The results, reported in Panel A, show that the coefficient on analysts’ downward forecasts, DownFCAST, in Column 1 is 0.932, significantly higher than the coefficient implied by the returns model in Column 2, 0.804, suggesting that investors underreact to analysts’ forecasts with downward revisions. The persistence and pricing of forecasts with upward revisions are 0.959 and 0.733, and the difference of 0.226 is statistically significant at the 1% level, indicating that investors also underreact to forecasts with upward revisions. More importantly, the underreaction to forecasts with upward revisions is significantly larger than the underreaction to forecasts with downward revisions, so underreaction cannot explain the stronger drift associated with downward revisions. We also find that investors’ underreaction to downward revision forecasts is stronger in the late period than in the early period, with coefficient differences of 0.128 and 0.374 in the early and late periods, respectively. The difference is statistically significant at the 1% level (untabulated, p < .001). This pattern is inconsistent with the underreaction explanation because the drift is stronger for downward forecast revisions in the early than those in the late period.
Persistence and Pricing of Analyst Forecasts (FCAST) by Revision Direction and Period.
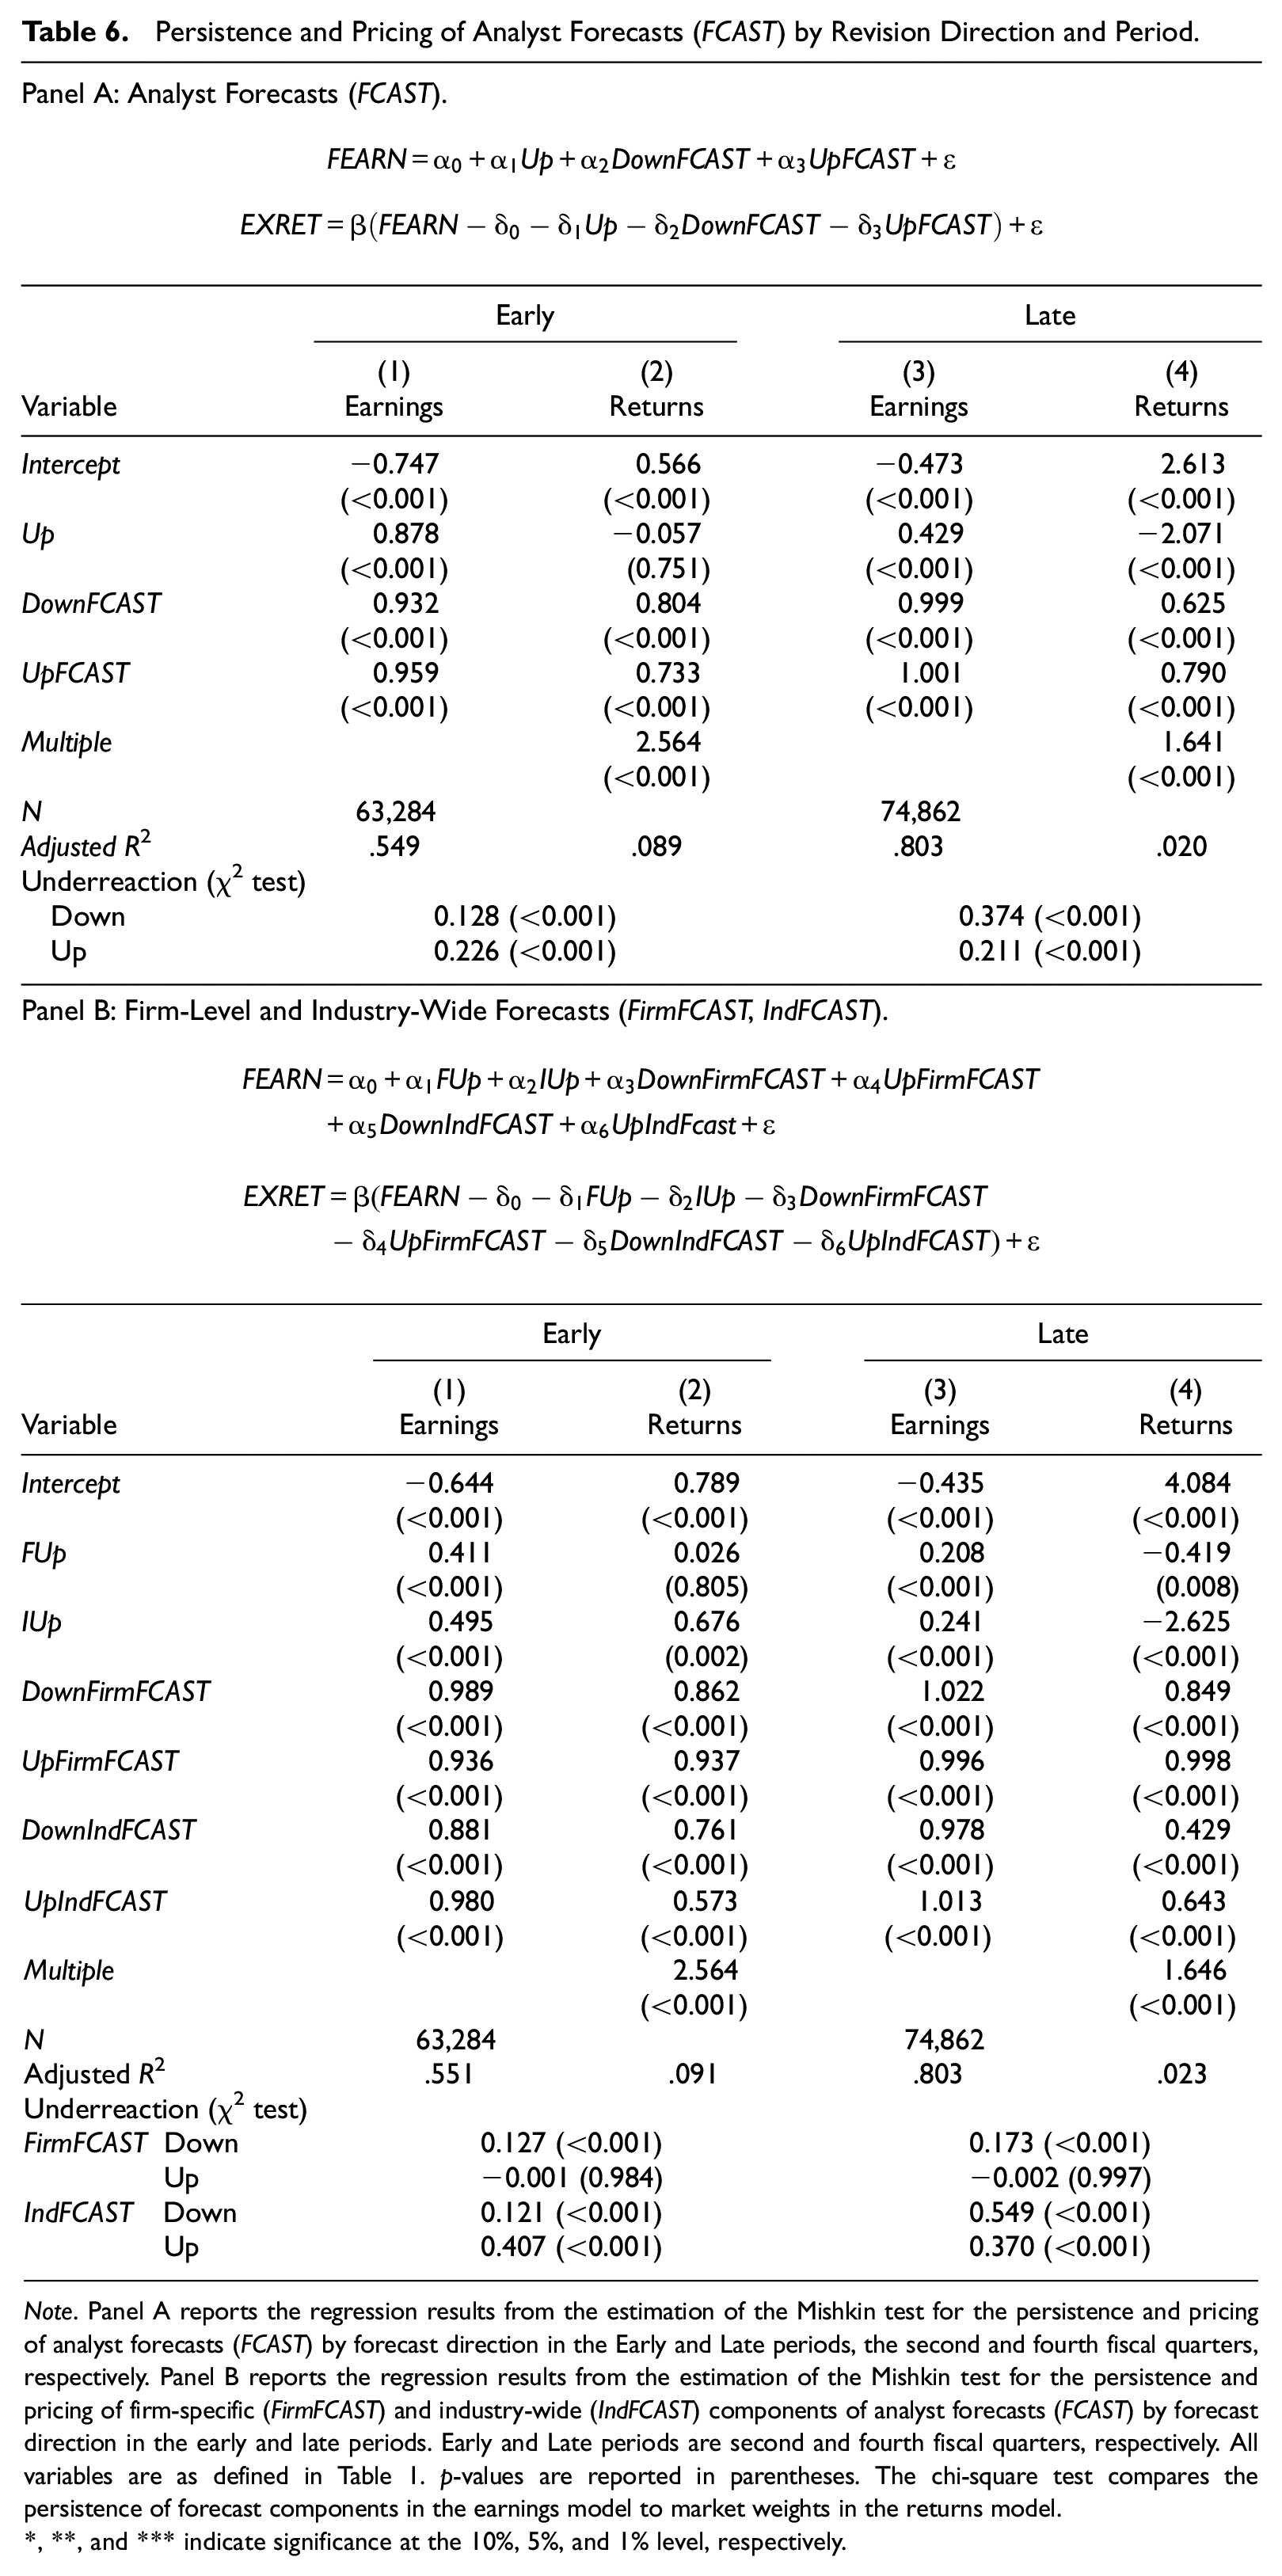
Note. Panel A reports the regression results from the estimation of the Mishkin test for the persistence and pricing of analyst forecasts (FCAST) by forecast direction in the Early and Late periods, the second and fourth fiscal quarters, respectively. Panel B reports the regression results from the estimation of the Mishkin test for the persistence and pricing of firm-specific (FirmFCAST) and industry-wide (IndFCAST) components of analyst forecasts (FCAST) by forecast direction in the early and late periods. Early and Late periods are second and fourth fiscal quarters, respectively. All variables are as defined in Table 1. p-values are reported in parentheses. The chi-square test compares the persistence of forecast components in the earnings model to market weights in the returns model.
, **, and *** indicate significance at the 10%, 5%, and 1% level, respectively.
We next report the results from estimating Equations 19a and 19b separately for firm-specific and industry-wide earnings in the early and late periods in Panel B. Similar to the results for overall earnings, our findings are inconsistent with the investor underreaction explanation. Specifically, investors underreact to downward revisions for both firm-specific and industry-wide forecast components, and do so more strongly in the late period than in the early period. Overall, our findings indicate that the post-revision drift is more consistent with the forecast revision completeness explanation than the underreaction explanation.
In untabulated analyses, we also examine investors’ immediate response to forecast revisions by revision component, direction, and period and find that the drift pattern we observe is inconsistent with the underreaction explanation.
Conclusion
In this study, we use Hui and Yeung’s (2013) methods to estimate the firm-specific and industry-wide components of analysts’ forecast revisions. Next, we use Trueman’s (1994) framework to estimate the completeness of analyst forecast revisions with respect to the private information underlying aggregate earnings forecast revisions as well as the firm-specific and industry-wide components of the revisions. We find that analysts’ forecast revisions are generally incomplete and that analysts incorporate a smaller proportion of the industry-wide component of their information in their forecast revisions than the firm-specific component.
We validate our analysis by showing that the completeness of analyst forecast revisions is inversely associated with the strength of post-forecast-revision drift. First, we show that drift is significantly associated with our measure of the completeness of forecast revision—the strength of the drift increases as forecast revision completeness declines. Next, we show that post-forecast-revision drift is primarily associated with the incomplete industry-wide component of forecast revisions. We further validate our analysis by showing that forecast revisions reflect analysts’ information more completely as the fiscal year progresses. Furthermore, analysts incorporate good news more completely in their forecast revisions than bad news. Both of these tendencies are associated with the magnitude of post-forecast-revision drift. Finally, we show that analysts’ prior-year optimism, an indicator of their incentives to withhold bad news, is strongly associated with current-period optimism, forecast incompleteness, and post-forecast-revision drift. Our results suggest that forecast completeness is associated with post-forecast-revision drift.
Our study contributes to the literature by showing that analyst forecast revisions are more complete for firm-specific information than for industry-wide information. This phenomenon is of interest because prior studies suggest that analysts provide market participants with valuable industry-related information. Second, our evidence that the level of completeness of analyst forecast revisions is associated with post-forecast-revision drift suggests that investors cannot fully extract analysts’ private information from their public forecasts. Finally, we show that industry-wide information diffuses more slowly to investors than firm-specific information, a likely consequence of analysts’ incomplete response to industry-wide information in formulating their forecasts.
Footnotes
Acknowledgements
We received useful comments from Ferhat Akbas, Kristian Allee, Ken Bills, Mark Bradshaw, Cory Cassell, C. S. Agnes Cheng (Associate Editor), Vernon Richardson, Stephen Rowe, Bharat Sarath (Editor), Jonathan Shipman, and Yuan Zhang (the discussant at the 2015 AAA FARS Midyear meeting), and two anonymous reviewers. We also benefited from comments by workshop participants at University of Arkansas, participants at the 2015 AAA FARS Midyear meeting, and participants at the 2019 JAAF Conference.
Declaration of Conflicting Interests
The author(s) declared no potential conflicts of interest with respect to the research, authorship, and/or publication of this article.
Funding
The author(s) received no financial support for the research, authorship, and/or publication of this article.