
Abstract
In the system of radiological protection, tissue reactions are characterized by the presence of a threshold dose. While the threshold dose is defined as the estimated dose for 1% incidence (ED1), it may be complicated by substantial baseline levels for diseases that develop with aging in the absence of radiation exposure. ICRP Publication 118 states that ED1 refers to effects just starting to rise above the baseline levels in unirradiated, age-matched individuals and in the case of circulatory diseases, to a dose which would increase the already high natural incidence or mortality by only 1%. This implicitly assumes that radiation has a unique mechanism of action in inducing circulatory disease. However, circumstantial evidence suggests that radiation is likely to act jointly with other risk factors to promote atherosclerosis. If radiation-induced subclinical damage is added to that resulting from other risk factors, the threshold dose could be decreased depending on the extent of the joint effect. This phenomenon might be observed in age-related diseases that result from the accumulation of subclinical damage, and it is inferred that radiation accelerates the development of these diseases in a dose-dependent manner.
INTRODUCTION
Radiation health effects in the system of radiological protection are classified into two categories: stochastic effects and harmful tissue reactions. This classification is based on theoretical considerations of the underlying mechanism. Stochastic effects, specifically cancer and heritable effects, are thought to result from damage in a single cell, and the incidence of these effects is assumed to increase with a small probability even at low doses. In contrast, tissue reactions are caused by injury in populations of cells, and they manifest only when the dose exceeds a certain threshold (ICRP, 2007, 2012).
Diseases of the circulatory system (DCS) are not considered to originate from a single mutated cell, indicating that it is not a stochastic effect. If DCS is not a stochastic effect, it is regarded as a tissue reaction according to the dualistic effect classification. However, the issue is not that simple. Recent epidemiological data suggest an increase in the risk of DCS even at doses lower than 1 Gy, and the threshold is not clear (Takahashi et al., 2017; Little et al., 2023). These findings have led to an ongoing debate over whether to include DCS in the detriment calculation (ICRP, 2022).
From a radiological protection point of view, the question is whether or not a small dose of radiation contributes to an increase in the incidence of DCS. If the answer is yes, we wonder how it is different from stochastic effects. If no, there should be a threshold dose. Attempting to answer the question leads to a paradoxical argument.
THRESHOLD DOSE FOR TISSUE REACTIONS
The dose–response relationship for tissue reactions conceptually takes the form of a sigmoid curve. It is characterized by a threshold dose below which the given effect does not occur. Defining the threshold based on the absence of the effect is challenging, and it is practically defined as the lowest dose at which the effect is detected, specifically the estimated dose for 1% incidence (ED1). ICRP Publication 118 (ICRP, 2012) notes that the definition of ED1 may be complicated by substantial baseline levels of specific tissue effects or diseases that develop with ageing in the absence of radiation exposure. It also states that ED1 refers to effects just starting to rise above the baseline levels in unirradiated, age-matched individuals and, in the case of circulatory disease, to a dose which would increase the already high natural incidence or mortality by only 1%.
The above description can be illustrated as in Fig. 1. The baseline of the sigmoid dose–response curve is not zero, and the incidence (frequency) increases by 1% at the threshold dose ED1. This delineation implies that radiation-induced diseases are different in nature from spontaneous cases. While many risk factors, such as age, smoking, hypertension, and diabetes, are associated with DCS, the implicit assumption here is that radiation acts independently of these factors to induce the disease. However, this premise is questionable. Risk factors for coronary heart disease are largely associated with oxidative stress, and an animal experiment demonstrated that radiation-induced reactive oxygen species promotes lipoprotein oxidation and vascular inflammation (Tribble et al., 1999). This finding suggests that radiation is likely to act jointly with other risk factors to promote atherosclerosis. Then, what does the dose–response curve look like if radiation-induced subclinical damage is added to that resulting from other risk factors? It is necessary to revisit the theoretical basis for radiation dose–response for tissue reactions to answer this question.
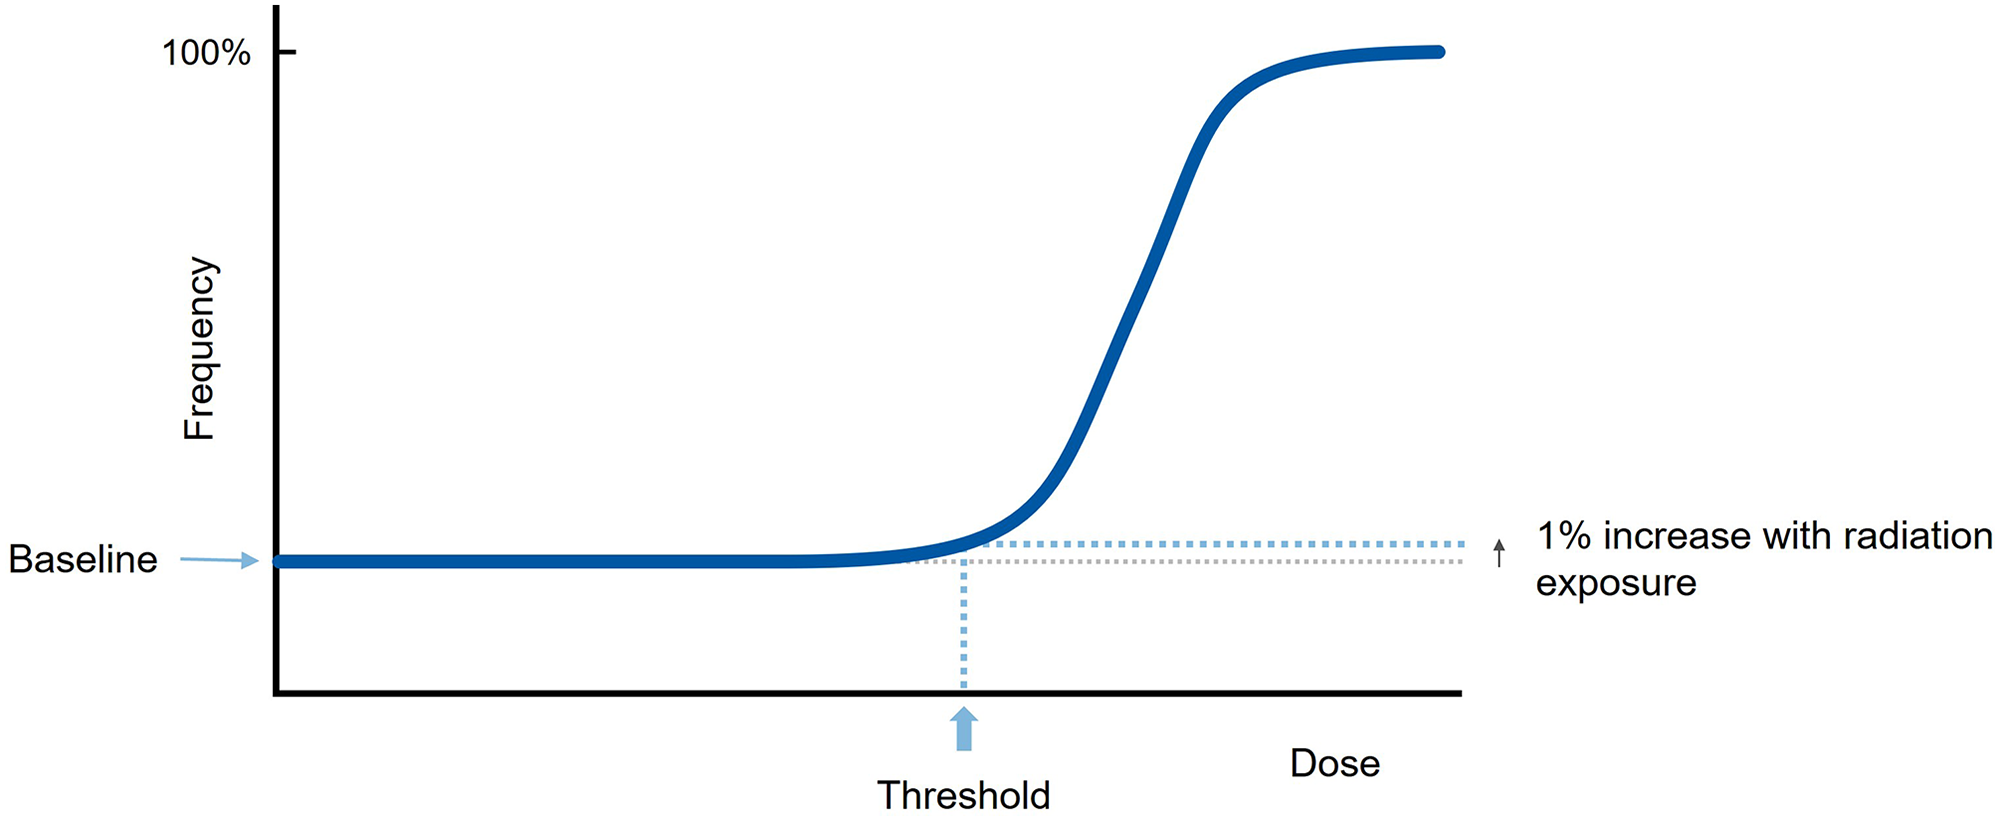
Dose–response curve for a tissue reaction added on a non-zero baseline.
Basic model
The typical sigmoid dose–response curve is explained by a dose-dependent increase in severity among a population of individuals with varying sensitivities. The left panel of Fig. 2 illustrates the relationship between radiation dose and severity of a particular tissue reaction. Three lines represent individuals with varying radiation sensitivity: “A” is the most sensitive in the population, and “C” is the least sensitive. The severity which represents the extent of damage in the cell population increases with dose, and a pathological condition appears when it exceeds a certain level. As shown in Fig. 2, individual “A” reaches the condition at a lower dose than other individuals, and this dose corresponds to the threshold for the tissue reaction of interest [see Fig. A.3.3 of ICRP Publication 103 (ICRP, 2007) for more details].
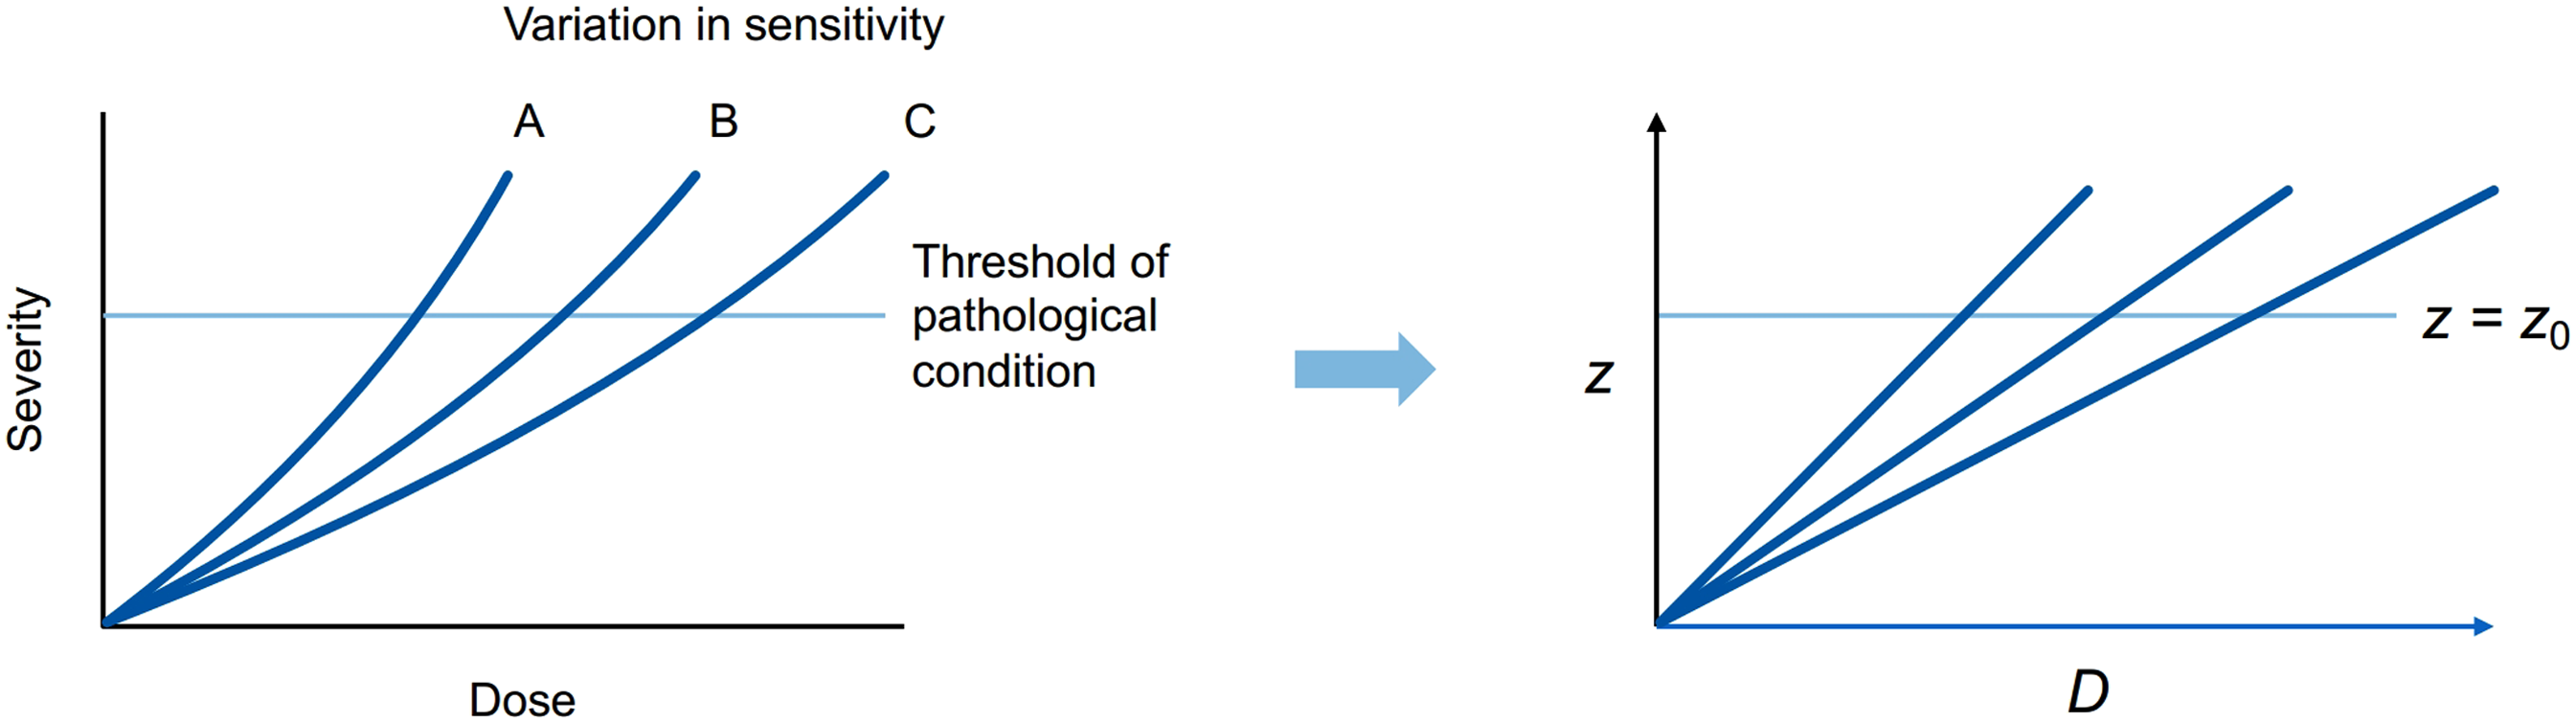
Illustration of the relationship between dose and severity.
To describe this idea in mathematical terms, let D and z represent radiation dose and the damage level (the extent of damage in the cell population), respectively. As shown in the right panel of Fig. 2, z is assumed to increase in proportion to D for simplicity, and clinical symptoms appear if z exceeds z0, the threshold of the pathological condition. Here, “damage” is used as an abstract term, in the sense that its accumulation leads to the disease.
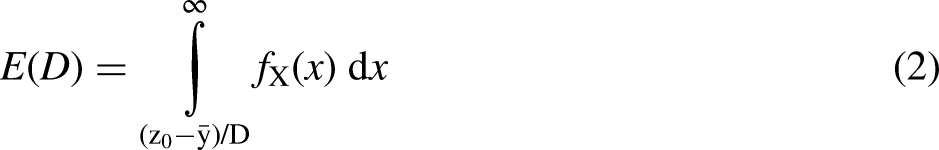
The variation in radiation sensitivity can be expressed by introducing a random variable X, which represents the damage per unit dose for each individual. The incidence of the disease at dose D is determined by the proportion of individuals with z > z0 in the population, where z = Dx. The incidence E of the disease at dose D is given by Eq. (1), where
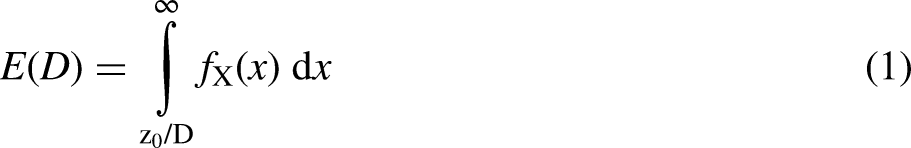
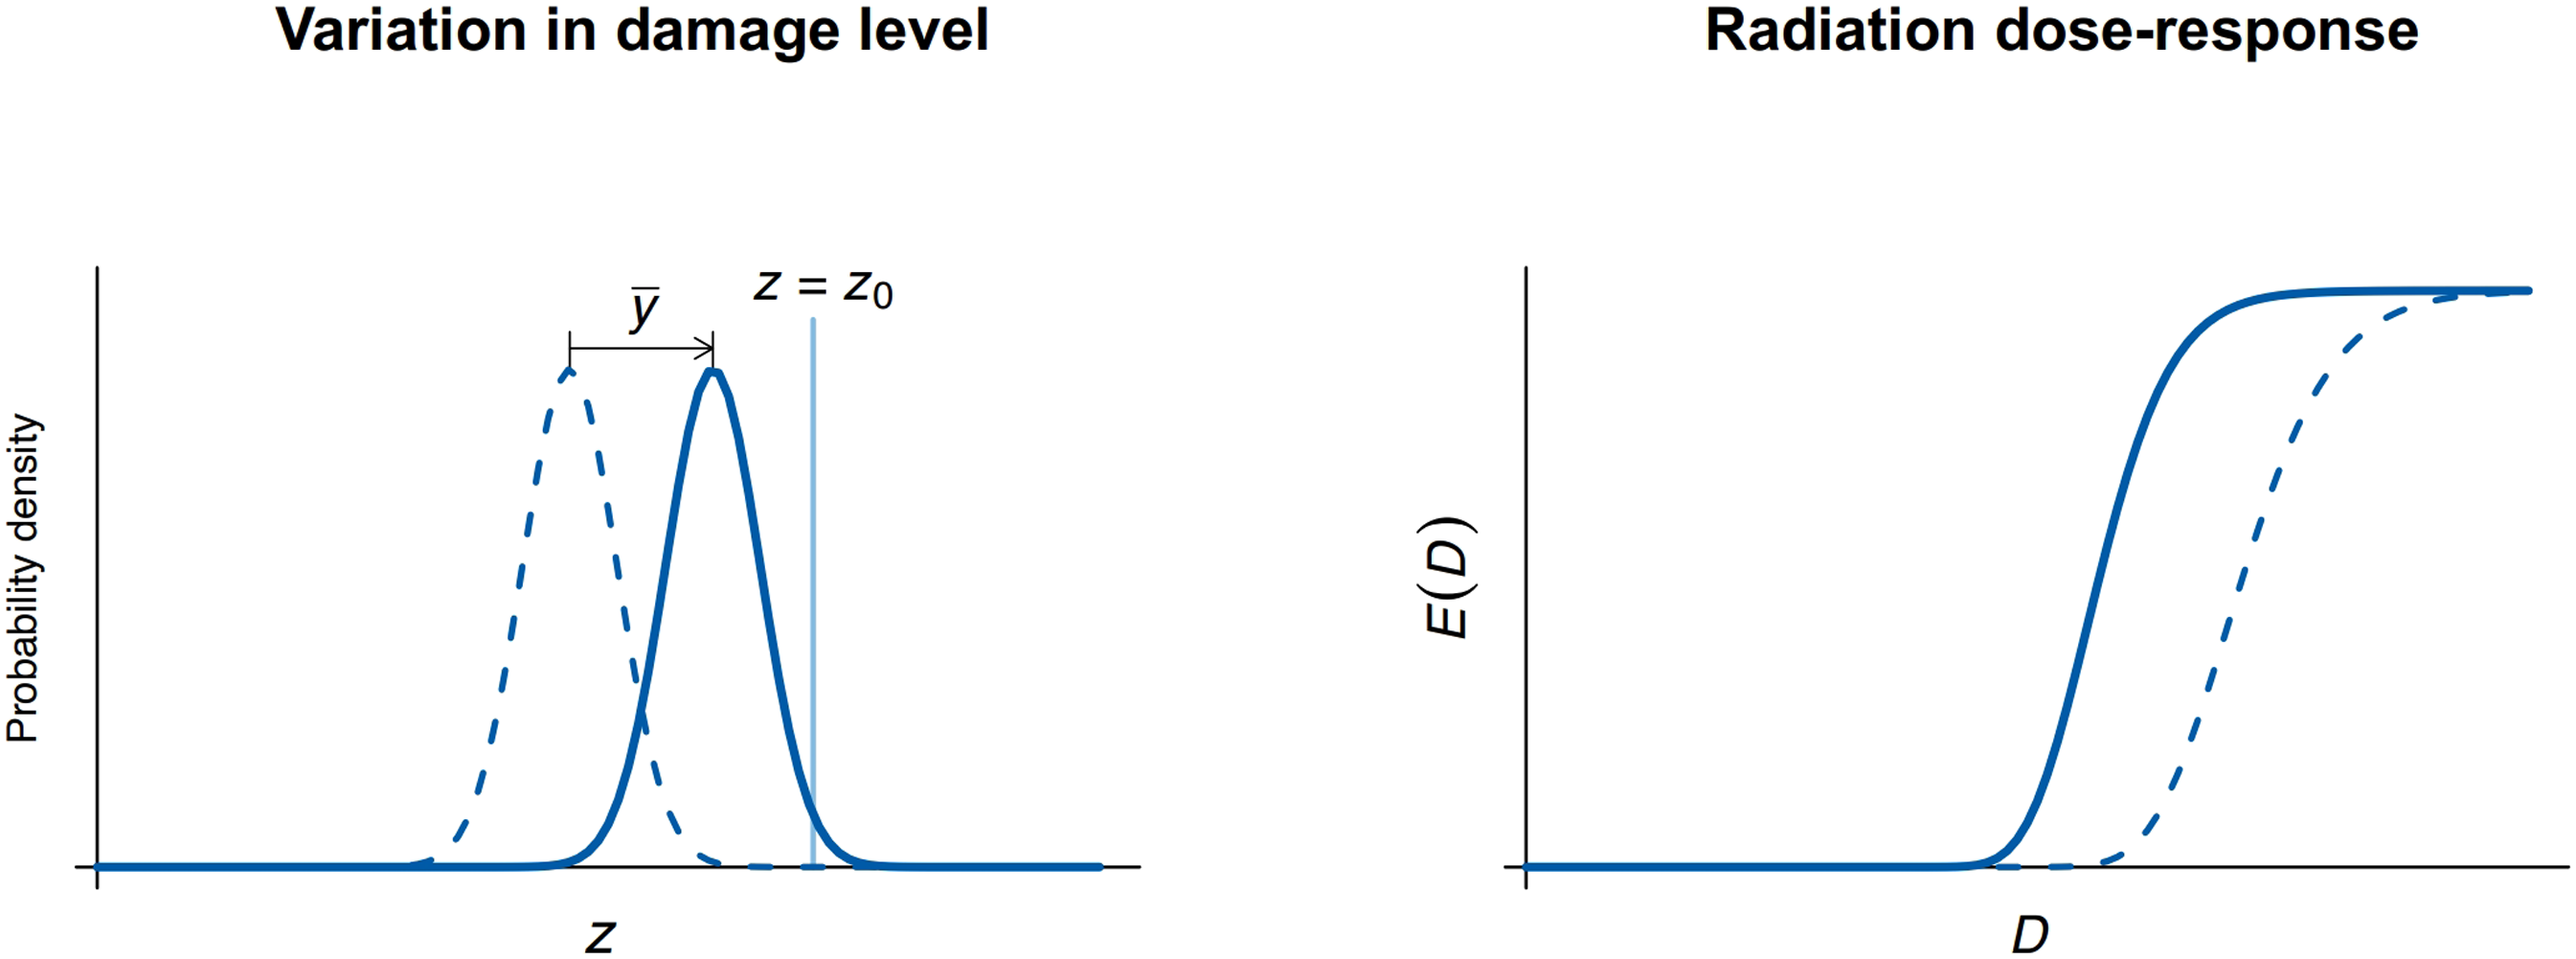
Figure 3 illustrates the behavior of this model, assuming a normal distribution for the variable X. The parameters are set arbitrarily for illustrative purposes. The left panel shows the variation in the damage level among individuals exposed to a certain dose. The shaded area represents those with z > z0. As the dose increases, the curve shifts to the right, and the shaded area becomes larger. Consequently, the typical sigmoid dose–response curve is obtained as shown in the right panel.
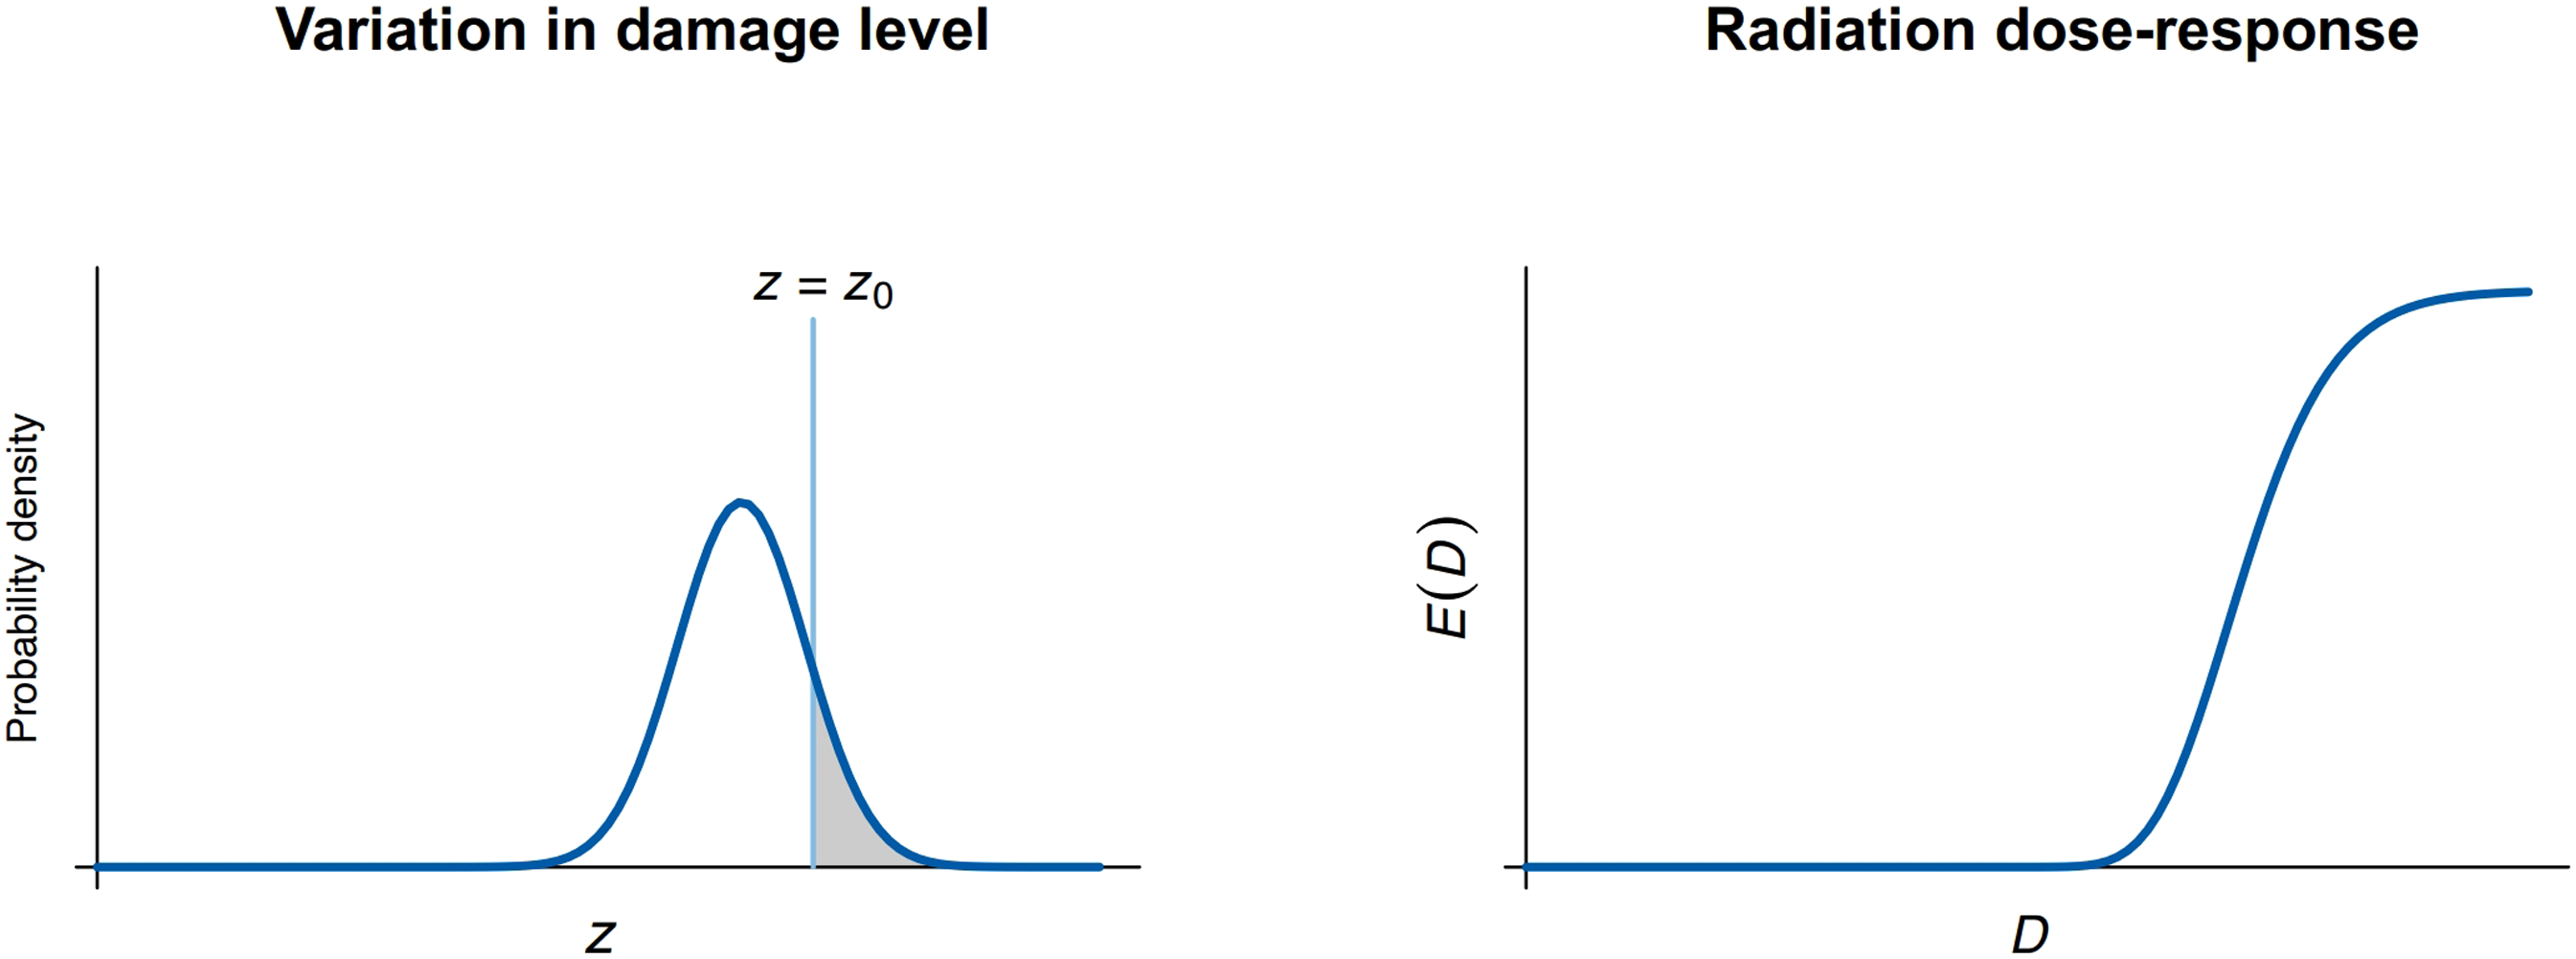
Radiation dose–response considering the variation in radiation sensitivity in individuals.
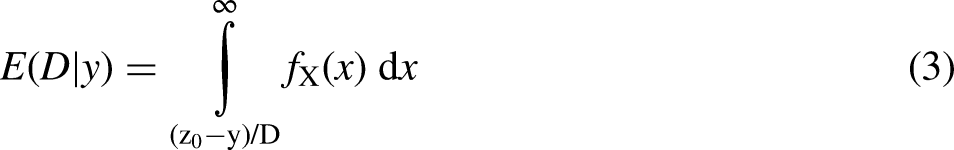
Then, the contribution of risk factors other than radiation is taken into account. As a first step, damage of
Under this assumption, the distribution of the damage level simply shifts right by
Change in dose–response curve, contribution of factors other than radiation taken into account as a constant value.
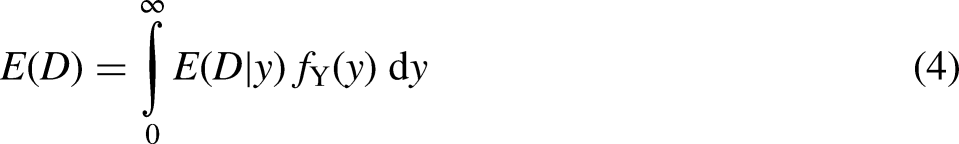
In reality, damage from other factors varies among individuals. It is described by replacing
To examine the behavior of this model, individuals have been assumed to receive a dose of radiation that brings much smaller damage than the threshold z0, as shown in the left panel of Fig. 5. Lifestyle risk factors show large variations among individuals as demonstrated in smoking and drinking habits. For this reason, a log-normal distribution is assumed for damage from risk factors other than radiation, as illustrated in the center panel. Again, the parameters are set arbitrarily for illustrative purposes. In this example, at the tail of the distribution, a small fraction of the population exceeds the threshold z0, which means they develop the disease without radiation exposure. In other words, the baseline incidence is not zero. The right panel of Fig. 5 illustrates the distribution for the combination of radiation and other factors. Compared to the center panel, the peak shifts right, and the distribution becomes wider, resulting in more individuals developing the disease.
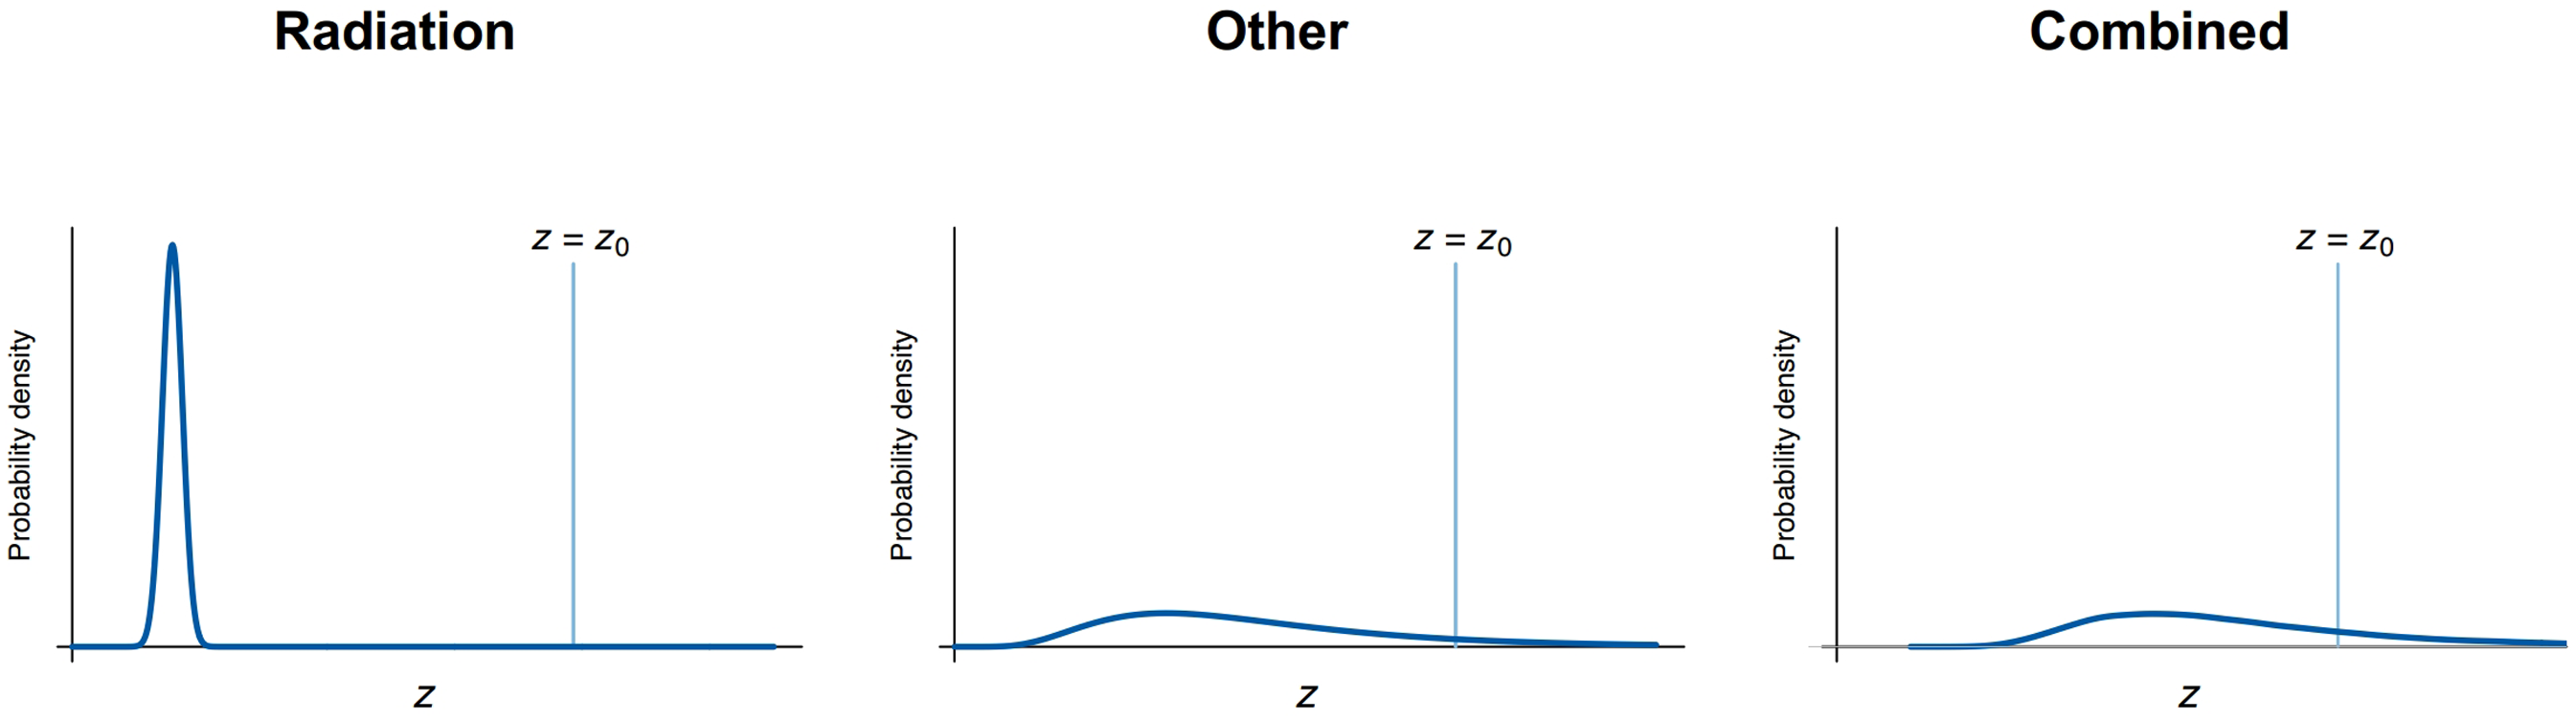
Distributions of damage level among individuals: for radiation exposure (left), other risk factors (center), and combined (right).
The dose–response curve can be obtained by changing radiation dose in this model. The left panel of Fig. 6 displays the dose–response curve for radiation exposure alone, while the right panel shows the curve for the combination of radiation and other risk factors. When combined with other factors, the dose–response curve shifts left, and it stretches out to the lower dose range with a shallower slope. This illustration is just an example; however, it should be noted that the threshold dose disappears when the baseline incidence that is attributed to other risk factors is taken into account.
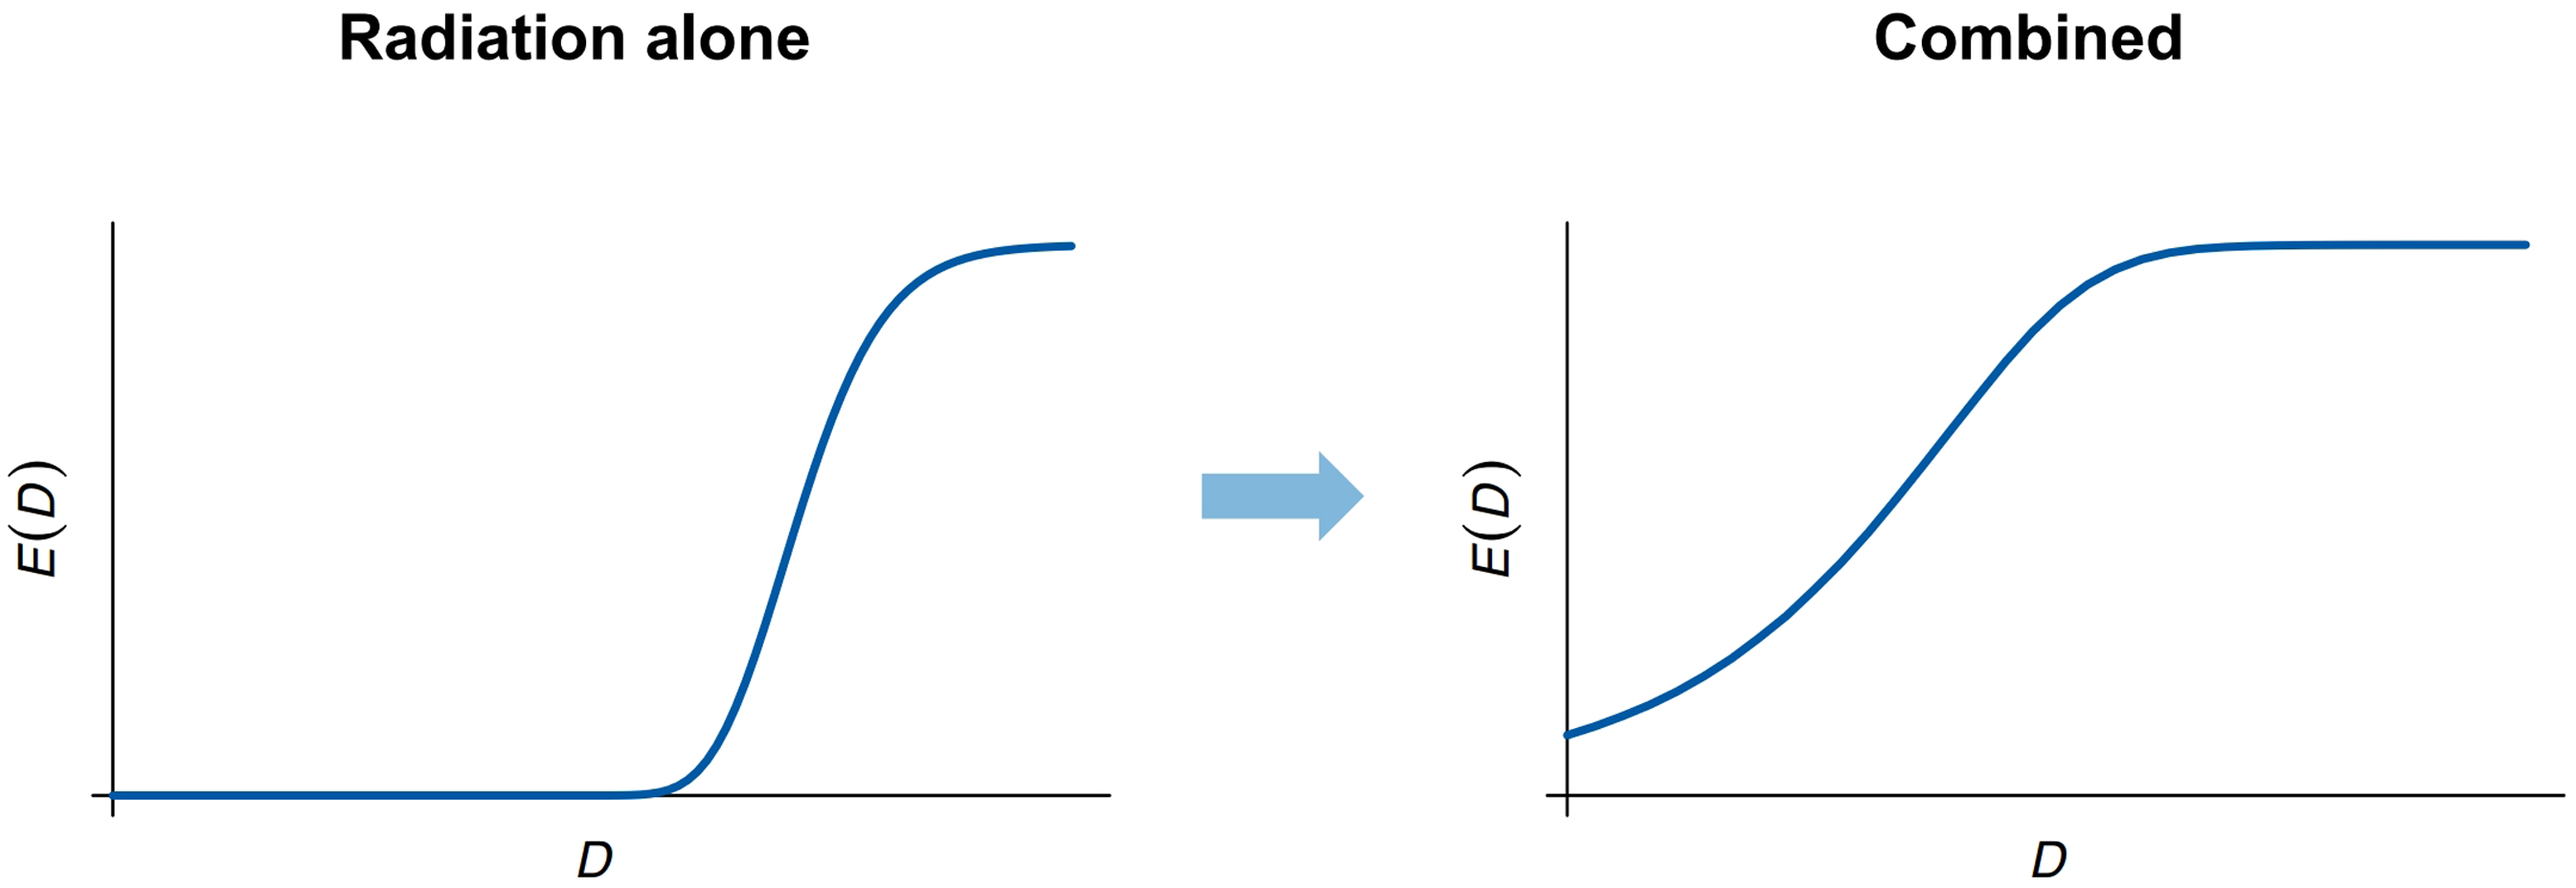
Change in the shape of radiation dose–response curves: radiation alone (left); combined with other risk factors (right).
While our primary focus is the radiation dose–response for DCS, it may be possible to broaden the scope. Three underlying assumptions here are (i) the accumulation of subclinical damage results in clinical symptoms, (ii) damage is irreversible, and (iii) radiation acts additively with other factors to cause damage. These assumptions are not strict requirements for the present analysis, and the discussion could be generalized with a slight modification. The deviation from the typical sigmoid dose–response curve will still occur even if we change the second assumption to “damage is accumulative,” and the third assumption to “radiation acts jointly with other factors to cause damage.” Age-related diseases could meet these conditions, and in fact, the dose–response for some of them is a controversial issue.
CONCLUSIONS
Based on theoretical considerations, we have shown that the shape of the sigmoid dose–response curve for tissue reactions could be modified by the presence of other risk factors. More specifically, where a tissue reaction involves risk factors that act jointly with radiation to induce subclinical damage, the threshold dose could be decreased depending on the extent of the joint effect. This phenomenon might be observed in age-related diseases that result from the accumulation of subclinical damage, including DCS and cataracts. It is inferred that radiation accelerates the development of these age-related diseases in a dose-dependent manner.