



Abstract
To determine the quality of radiation protection in a group, it is useful to analyse histograms of doses within the group. In this case, the distribution of individual doses is fundamental to the analysis of the group. We have shown that the hybrid lognormal (HLN) distribution is useful for this analysis. On the other hand, individual worker satisfaction with radiation protection is also an important evaluation factor, and this factor is thought to shape the HLN distribution. In this study, in addition to fitting the HLN distribution to actual worker data, we also examined whether satisfaction with radiation protection follows the HLN. The results showed that the distribution of individual satisfaction in the population also follows the HLN distribution with an upper bound. These results indicate that understanding the distribution characteristics in a group is useful for evaluating the function of radiation protection in a group.
Keywords
INTRODUCTION
Dose distribution is considered one of the main items for evaluating the overall effectiveness of a radiological protection system (ICRP Publication 60, para. S20) for a target group. The worker dose distribution is fitted with a lognormal function (Gale, 1965; ICRP, 1977; UNSCEAR, 1977), but the upper tail may deviate from the lognormal trend due to mid-year dose reduction control (Gale, 1965; UNSCEAR, 1977 (Annex E)). In this case, a hybrid lognormal distribution with a normal distribution for the upper tail has been reported (Kumazawa and Numakunai 1981; UNSCEAR 1982 (Annex H, paras. 20, 32); Kumazawa, Nelson et al., 1984). The hybrid lognormal distribution is a general probability distribution derived from a synergistic stochastic process with feedback suppression based on the central limit theorem of martingale (infinite-sum no-divergence condition) (Kumazawa and Ohashi, 1986). In this study, we will examine how the dose distribution is affected by the results of work motivation and its appropriate suppression management based on subjective protection satisfaction expressed on the Cantril scale. First, a dose distribution model that fits well the actual annual dose statistics is validated, and second, a probability distribution of well-being is identified based on a Japanese well-being survey, and then, assuming that it is applicable to workers’ protection satisfaction, the model of dose distribution modified by protection satisfaction is examined.
METHOD
2.1. Dose distribution models
In the dose accumulation process



Thus, it follows that the cumulative dose
The function
Subjective protection satisfaction is a fundamental item for workers who accomplish high cumulative dose work. This satisfaction is characterised by a continuous probability distribution approximation from cumulative relative frequencies, such as the subjective happiness survey (Cantril scale: 0 to 10). We verify the satisfaction S is represented by a hybrid SB (HSB4) distribution that can be estimated by a regression equation where the hybrid transformation
The higher the worker protection satisfaction S and the higher his cumulative dose XT, the larger his suppression factor ρ that controls feedback to the tolerable risk range. In this case, the dose distribution modified by the individual’s satisfaction should be the same collective dose (N×
RESULTS
Recent examples of the HLN dose distribution model
Log probability plots of four annual dose statistics (NUREG-0713 Vol.42) for US light water reactors (LWRs) are shown in Fig. 1a. The hybrid probability plots of these dose distributions (Fig. 1b) all show a good linear fit (R-squared or RSQ > 0.996), confirming the applicability of the HLN distribution. In addition, most of the plots above 1 mSv are in the pure hybrid region, where both dose-increasing and dose-suppressing factors in protection are at work.

Recent Examples of HLN dose distribution, cited from NUREG-0713 Vol. 42 (2022). (a) Log probability plots of data by year. (b) Hybrid probability plots of data by year. (c) A log probability plot of ρj by plant. (d) Hybrid probability plots of FY2020 data.
The log probability plots for the estimated dose reduction coefficients ρj from the HLN analysis of plant-specific dose statistics of US LWRs for the FY2020 are shown in Fig. 1c. The solid line shows the HLN fit (RSQ = 0.984) to the distribution of 57 estimates of ρj. The plant-specific dose distributions are LN approximations (about 20%) when ρj < 0.02, and HLN distributions (RSQ > 0.98) otherwise. The hybrid probability plot of the pooled plant-specific dose distribution (●: Fig. 1d) shows a good linear fit (RSQ = 0.989). Although this HLN fit (ρ = 0.078) is lower than the HLN fit (ρ = 0.139) for adjusted transients (○), most of the plots are in the pure hybrid region, indicating that dose-increasing and suppression factors are at work.
Assuming that workers’ subjective protection satisfaction is analogous to the level of happiness on the Cantril scale, we examined the probability distribution of Sj for the Nomura Research Institute (NRI) ‘Survey on the Happiness of Japanese people’ (Fig. 2a). As a regression model explaining the ascending ordered data Sj by its normal rank zj relative to its cumulative response rate, we found that the HSB probability plot of Sj (Fig. 2b) shows a good linear fit (RSQ = 0.999). We also confirmed the HSB linear fit (RSQ > 0.995) for distributions of satisfaction in life (all 4990 Japanese respondents, men, and women) (Murakami et al. 2018).
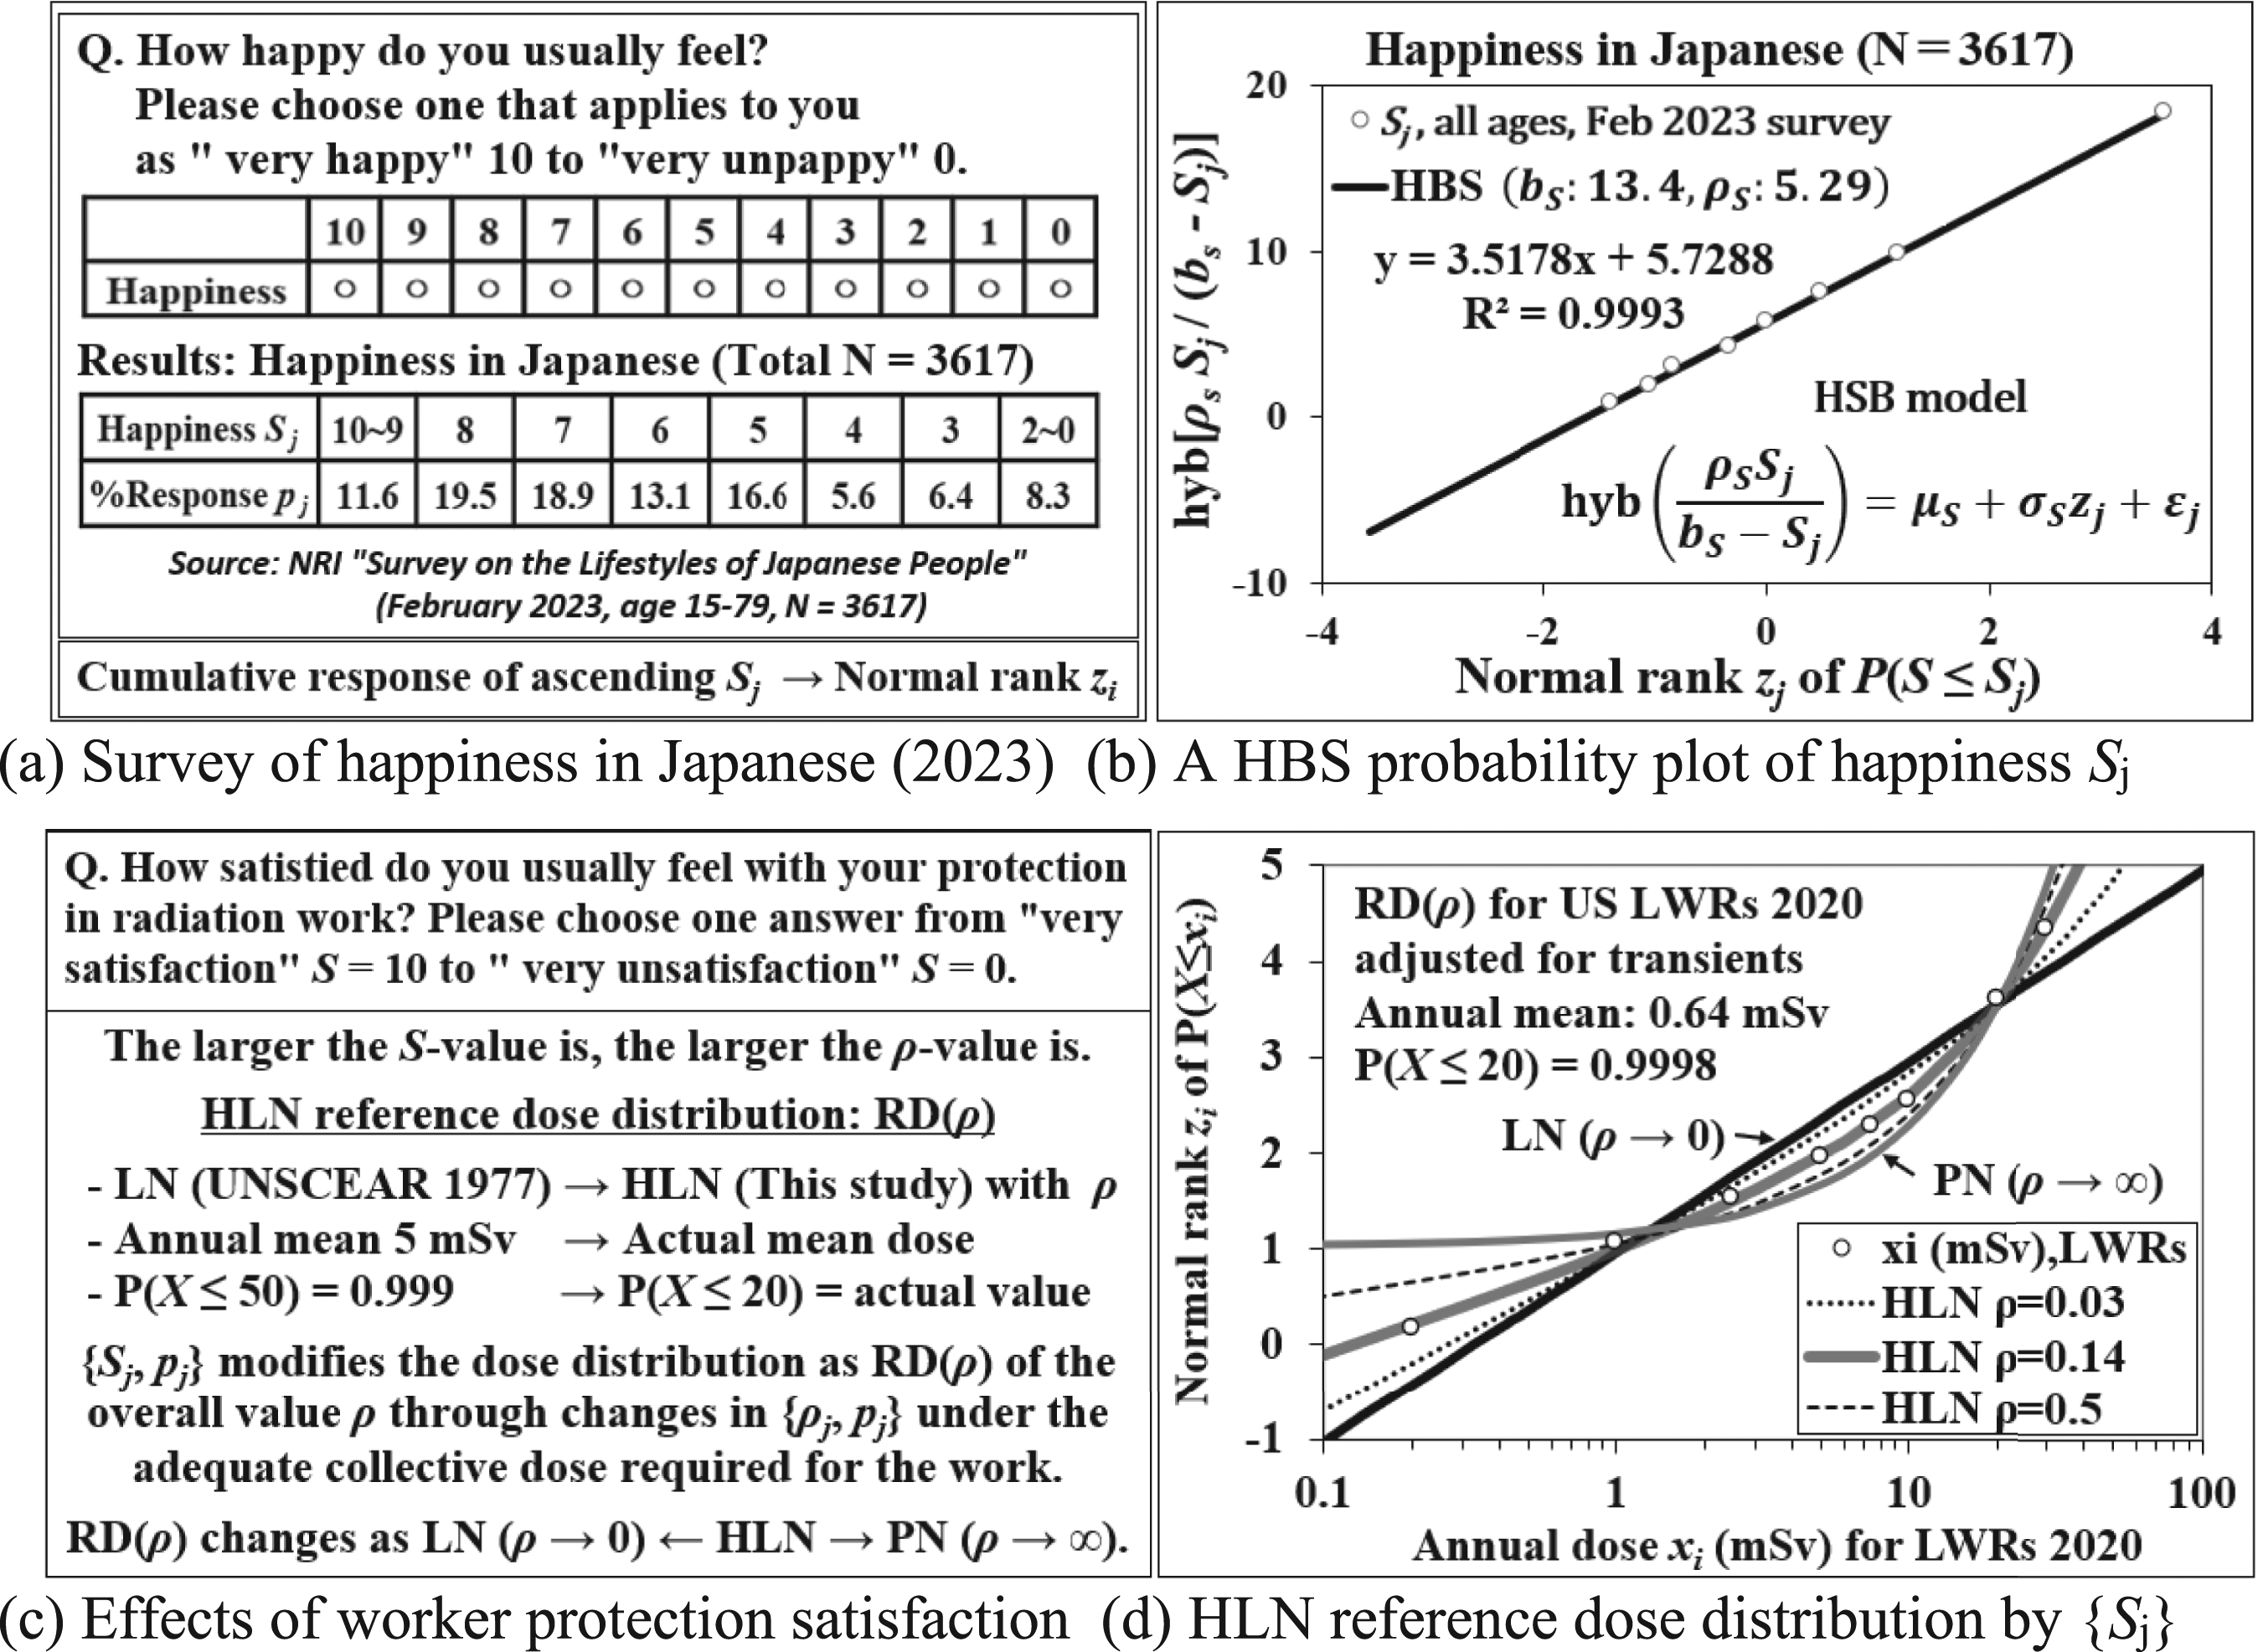
HLN reference dose distributions modified by individual protection satisfaction. (a) Survey of happiness in Japanese (2023). (b) A HBS probability plot of happiness Sj. (c) Effects of worker protection satisfaction. (d) HLN reference dose distribution by {Sj}.
Since workers with higher Sj tend to have higher doses and the dose reduction factor ρj works to a greater extent, we examined how the effect of protection satisfaction {Sj, pj} on the dose distribution can be represented by the HLN reference dose distribution RD(ρ) using the representative value of ρ for {ρj, pj} (Fig. 2c). The HLN distribution (ρ = 0.14) of the LWRS dose statistics (mean 0.64 mSv, P(X > 20 mSv) = 0.02%) approaches the LN distribution (ρ→0) when {Sj} is small overall and approaches the PN distribution (ρ→∞) when it is large overall. Within this range, examining the dose distribution RD(ρ) modified by protection satisfaction yields examples with dotted HLN(ρ = 0.03) or dashed HLN(ρ = 0.5) (Fig. 2d).
The higher the worker’s protective satisfaction, the higher the rise of the dose staircase in Yoshizawa’s staircase rubber strap theory (Kumazawa, Numakunai, 1991), but at the same time, the higher the dose staircase, the more the rubber strap attached to the worker works to reduce the dose. This corresponds to the fact that HLN_RD(ρ) quantitatively expresses that the dose is reduced because the rubber strap attached to the worker works harder as it rises.
From the viewpoint of evaluating the overall effectiveness of radiation protection in a certain group, the effect of the subjective satisfaction of workers with protection on the dose distribution was examined in the framework of a dose distribution model derived from a synergistic stochastic process in which an average feedback suppression effect acts on dose accumulation. The results show that (1) the hybrid lognormal (HLN) distribution fits well with recent dose distribution data from US light water reactors, (2) the HLN distribution with an upper bound fits well with the well-being of the Japanese people (2023) expressed on the Cantril scale, and (3) the HLN reference dose distribution can be applied to the analysis of dose distributions varying with the level of individual satisfaction with radiation protection (Cantril scale). This reference dose distribution has the same mean and upper limit exceedance rate (inverse of the number of workers) as the original dose distribution, and the individual satisfaction distribution is properly reflected in the parameter ρ.
Footnotes
ACKNOWLEDGMENT
The authors would like to thank Dr. Ichiro Yamaguchi for his helpful comments.