
Abstract
The most recent publicly available data on all solid cancer incidence from the Life Span Study (LSS) of Japanese A-bomb survivors provides colon dose contributions weighted with a relative biological effectiveness (RBE) of 10 for neutrons, relative to gammas. However, there is evidence from several investigations that the neutron RBE for A-bomb survivors may be higher than 10. The change in the shape of the corresponding dose–response curves was evaluated by Hafner and co-workers in a previous study by applying sex-specific linear-quadratic dose models to previous LSS data for all solid cancer incidence that include separate neutron and gamma absorbed doses for several organs, in contrast to the most recent data. The resulting curvature change became significantly negative for males at an RBE of 140 for colon, 100 for liver, and 80 for organ averaged dose. For females, the corresponding RBE values were 110, 80, and 60 for colon, liver, and organ averaged doses. The present study compares three different methods to calculate the 95% confidence intervals in an analysis of the curvature with increasing RBE. Further, the impact of a higher neutron RBE on the work of the International Commission on Radiological Protection, and the importance of including uncertainties and performing sensitivity analysis of different parameters in radiation risk assessment are discussed.
Keywords
1. Introduction
The Radiation Effects Research Foundation has mainly applied a fixed neutron relative biological effectiveness (RBE) of 10 to calculate the weighted colon doses used in the official analyses of all solid cancer radiation risk. Recently, however, different studies (e.g. Cordova and Cullings, 2019) reported indications that the neutron RBE for A-bomb survivors may be >10. In order to calculate all solid cancer risks with different neutron RBE weighted doses, the most recent published Life Span Study (LSS) dataset (Grant et al., 2017) containing solid cancer incidence data should be used. Unfortunately, this is not possible for evaluation of the impact of different neutron RBE values on all solid cancer risks, as this dataset does not include separate neutron and gamma absorbed doses. However, in a previous LSS dataset (Preston et al., 2007) with fewer years of follow-up, separate doses are included. This previous dataset was used by Hafner et al. (2023) to develop a ‘model for risk ratio variation with RBE’ that characterises how the risks change as a function of increasing RBE. Further, the change in the shape of the corresponding dose–response curves was evaluated by Hafner et al. (2023) by applying sex-specific linear-quadratic dose–response models. The resulting curvature change became significantly negative for males at an RBE of 140 for colon, 100 for liver, and 80 for organ averaged dose. For females, the corresponding RBE values were 110, 80, and 60 for colon, liver and organ averaged doses. The present study compares and discusses three different methods to calculate the 95% confidence intervals (CI) of the curvature.
2. MaterialS and methods
Similar to the method applied in Hafner et al. (2023), a linear-quadratic dose–response model [Eq. (1)] was fitted to the data (Preston et al., 2007):
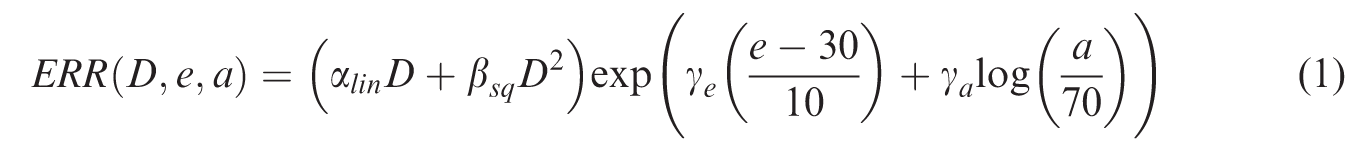
Eq. 1 was used to calculate the curvature
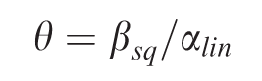
However, this method has some theoretical issues (Stuart and Ord, 1994) because, mathematically, the uncertainty of a ratio of two normal distributions (which is the case for the excess relative risk (ERR) fit parameters) is undefined. Fieller’s method (Fieller, 1940), described more recently by Beyene and Moineddin (2005), provides a novel way of expressing ratios as linear combinations of random variables, and makes the computation of CIs or standard errors of ratios relatively simple, circumventing the theoretical issue mentioned above.
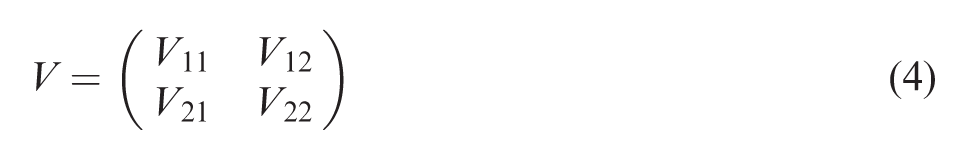
In the specific problem of the present study,
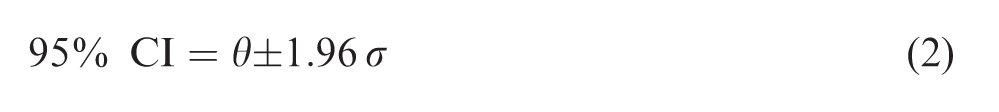
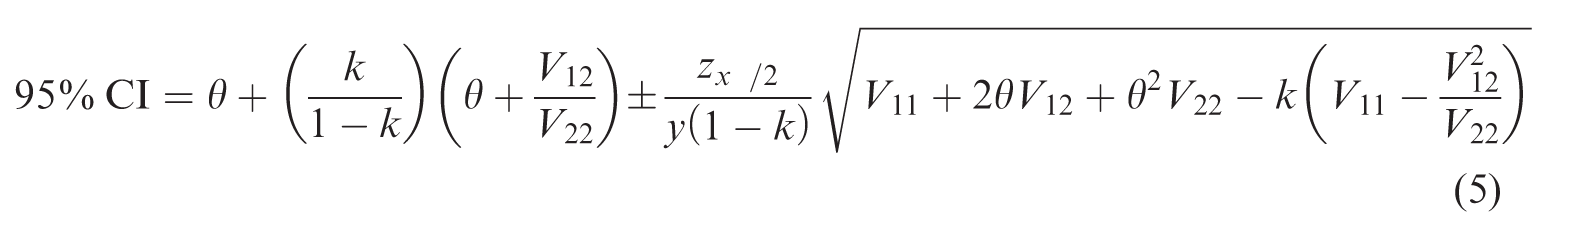
The 95% CI can be calculated by Eq. (5):
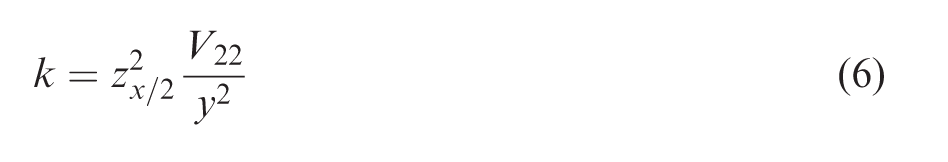
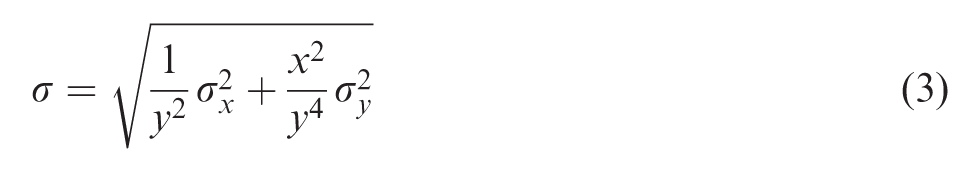
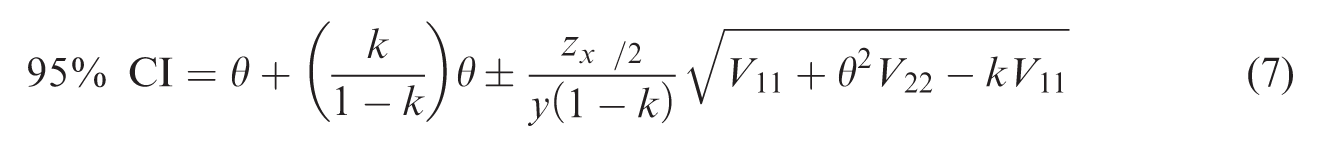
Assuming that the
To assess the magnitude of the difference when the two different methods are applied, a comparison of these methods is drawn here. Additionally, the results are compared with the profile likelihood bounds from Epicure, which are found using a constrained Newton–Raphson algorithm. The comparison is only drawn until a neutron RBE of 70, since the Epicure program (Preston et al., 1993) was unable to compute a lower bound for the curvature CI in models applying an RBE >70 because the maximum likelihood estimate occurred on a boundary of the parameter space.
3. RESULTS
In Fig. 1, the curvature of the dose–response curve is shown as a function of neutron RBE with respect to colon dose. The 95% CIs are calculated using three different methods: Fieller’s method, the Delta method, and using the profile likelihood bounds from Epicure. The 95% CIs resulting from Fieller’s method and the Delta method are almost the same, whereas the profile likelihood bounds from Epicure are larger, especially for the lower RBEs. When the RBEs get higher, the differences get smaller.
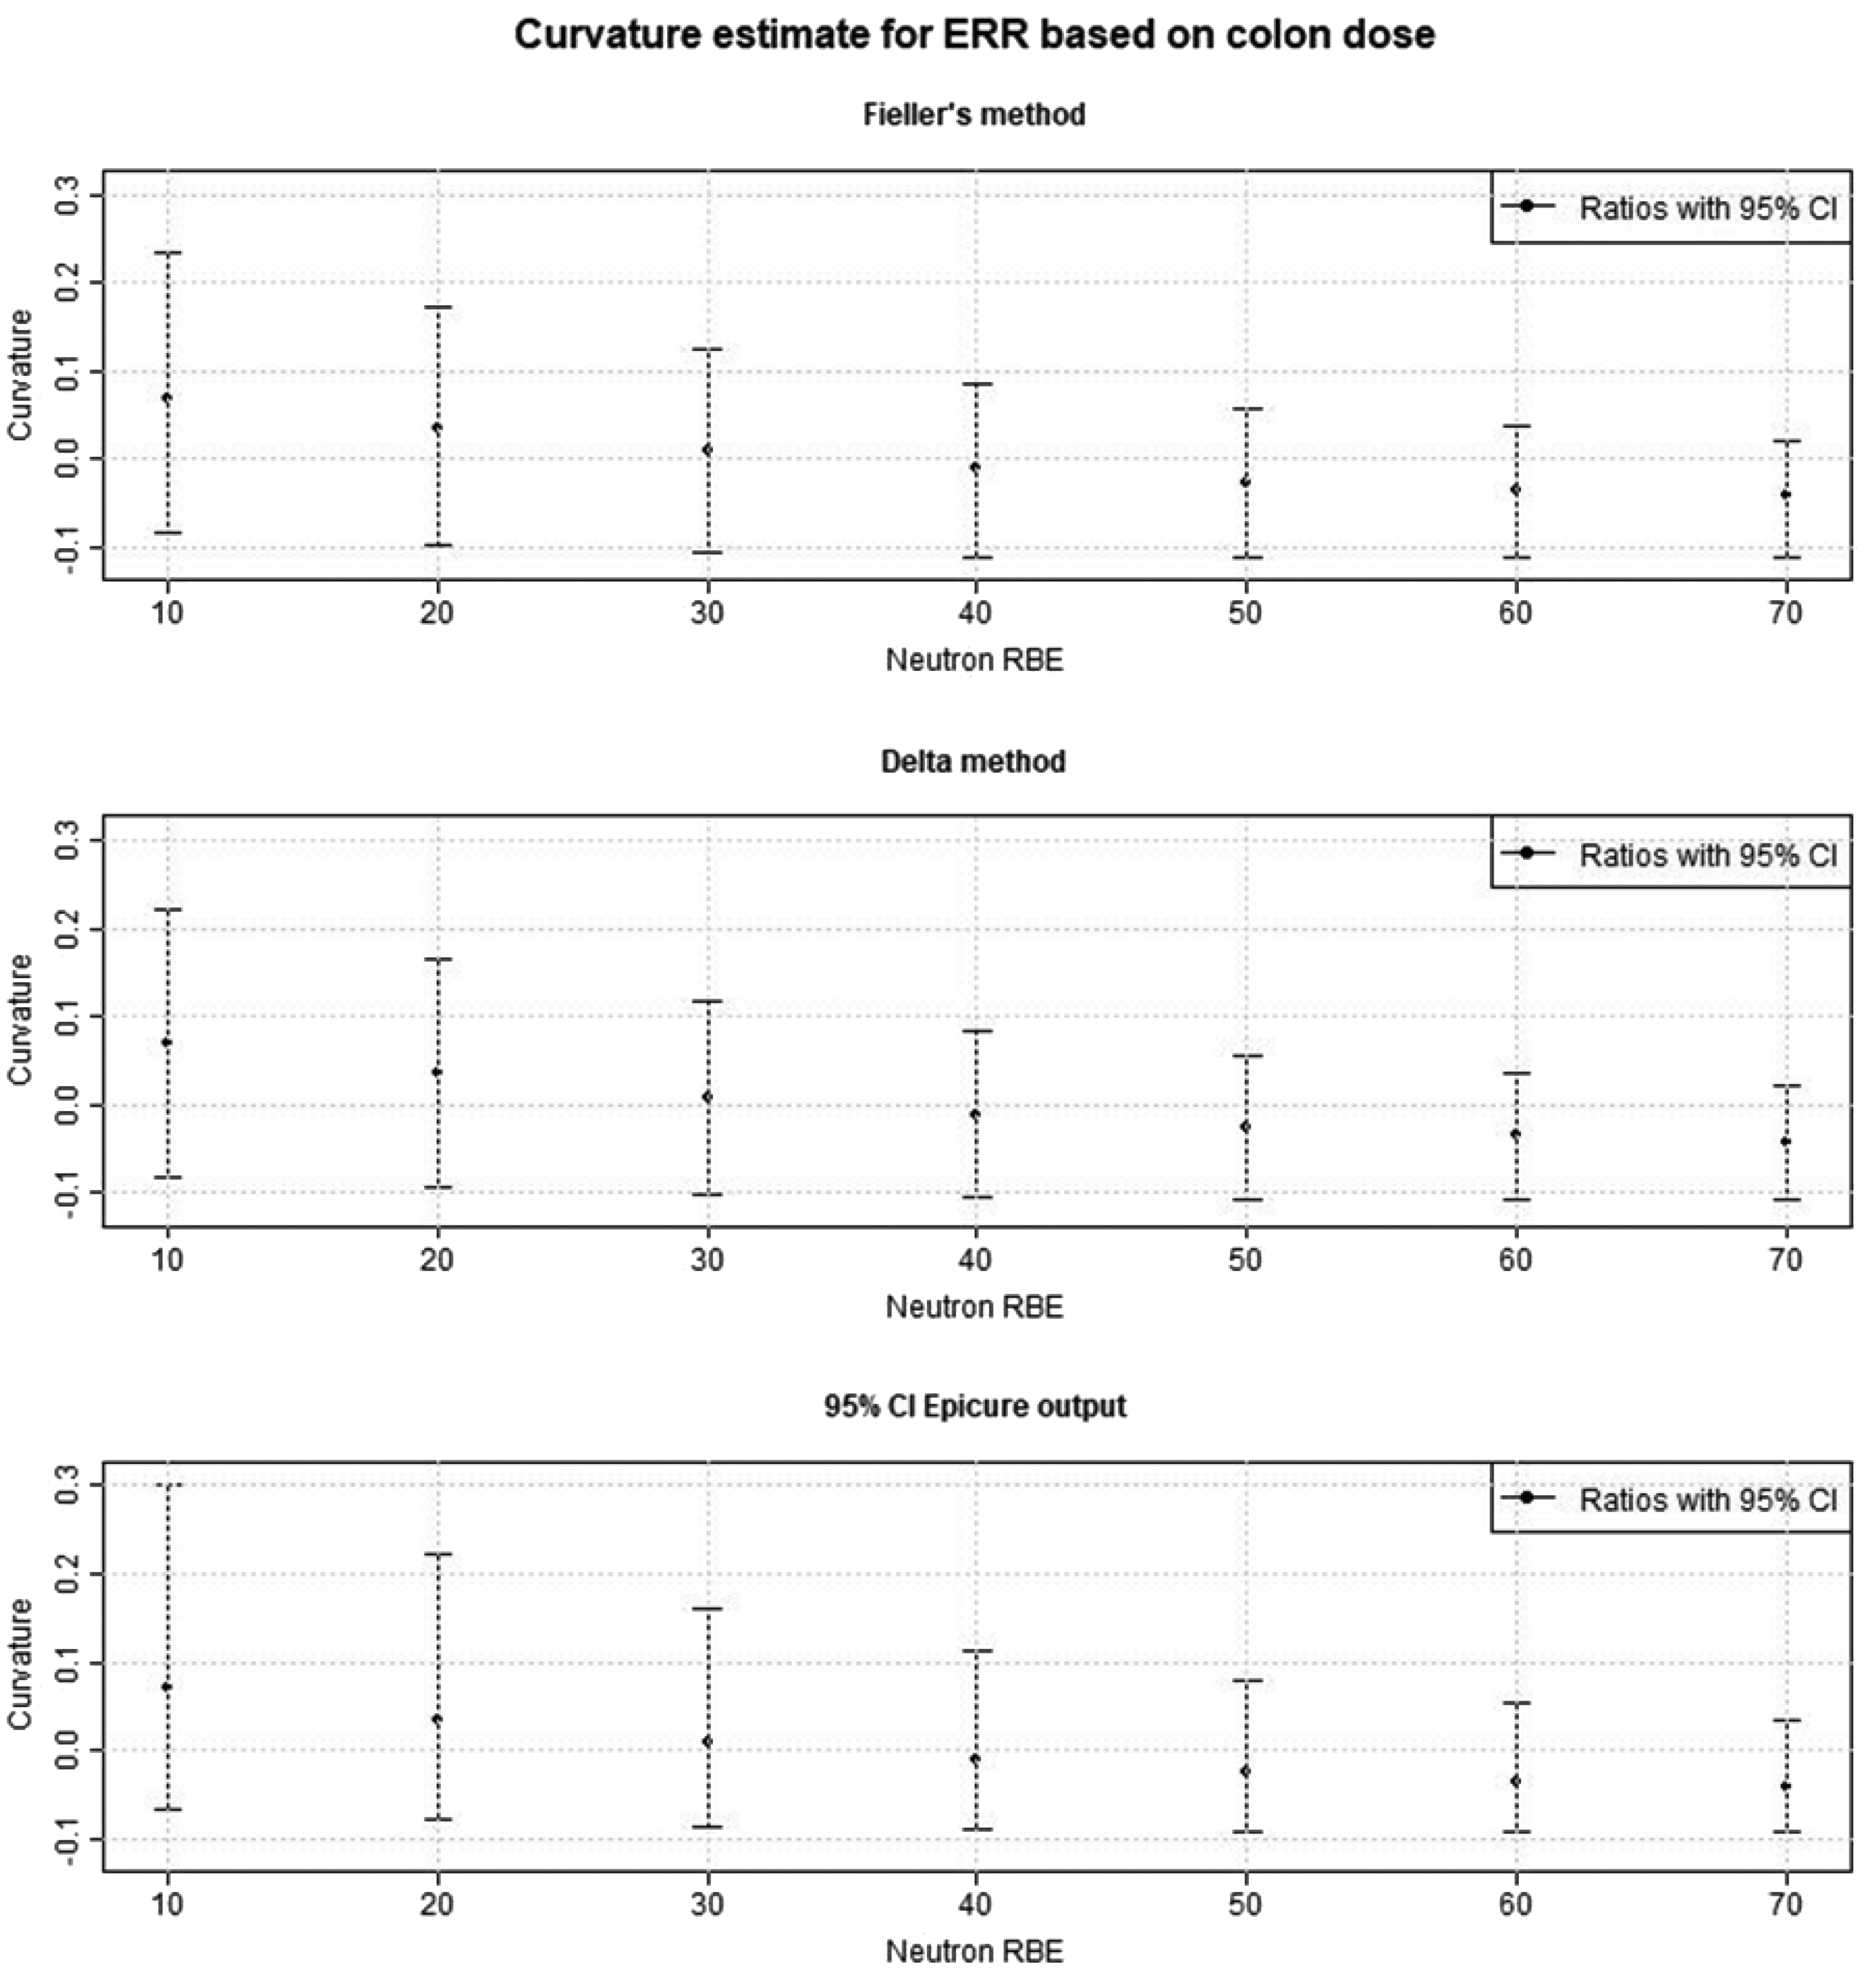
Comparison of three methods [Fieller’s method, Delta method, and profile likelihood from the Epicure program (Preston et al., 1993)] to calculate the 95% confidence intervals (CIs) on the curvature parameter (=
4. Discussion and conclusions
Hafner et al. (2023) used Fieller’s method (Fieller, 1940) to calculate 95% CIs in the analysis of the shape of the dose–response curve with increasing neutron RBE. In statistical theory, the ratio of two normally distributed variables can theoretically have unbounded CIs because of the possibility of zero being included in the distribution of the denominator (Stuart and Ord, 1994). Therefore, application of the more complicated Fieller’s method as in Hafner et al. (2023) is preferred in these cases, to address the 95% CI instead of the often-used Delta method. In Fig.1, the Delta method is compared with Fieller’s method. Interestingly, as the 95% CIs from Fieller’s method are only slightly larger than those from the Delta method, the concerns about applying the latter method do not appear to be critical for this application. Further, it can be observed that the 95% CIs from the profile likelihood bounds from Epicure are noticeably larger than those resulting from Fieller’s method and the Delta method at lower RBEs; for increasing RBEs, the differences get smaller. As the Epicure program could not identify a lower bound for higher RBEs than 70, the application of this method is not recommended when higher RBEs are considered in an analysis.
Generally, uncertainty and sensitivity analyses of parameters are very important in radiation risk assessment. For example, Hafner et al. (2023) reported recently that applying a neutron RBE >10 leads to a decrease in the risk for all solid cancers combined. For example, applying dose–response models for linear excess risks per unit organ averaged dose resulted in a reduction of approximately 50% in the risk per weighted dose when a neutron RBE of 110 was used instead of 10. A similar risk reduction occurred for the risk per unit liver dose using an RBE of 130, and for risk per unit colon dose using an RBE of 190. Further, Hafner et al. (2023) found that applying a neutron RBE >10 and considering the whole dose range, the shape of the dose–response shape changes from being tendentially rather linear to becoming progressively more linear-quadratic as RBE increases. Specifically, the curvature of the dose–response becomes significantly negative at higher RBEs. These results could have an impact on the future work of ICRP. In ICRP Publication 103 (ICRP, 2007), LSS models with a linear dose–response (Preston et al., 2007) were used to calculate all solid cancer detriment. If a neutron RBE >10 is applied, the application of a linear-quadratic dose–response allowing for a negative curvature might be preferred. Another possibility could be to keep the linear dose–response but truncate the doses to lower values. An analogous assessment of how the shape of the all solid cancer risk to dose–response varies with RBE based on mortality data is currently being undertaken.
It is concluded that the impact of higher neutron RBEs and their uncertainties on radiation incidence risks for specific cancer sites or for leukaemia should be studied systematically. Such studies are important because they may have an impact on the tissue weighting factors, as well as the shape of the dose–response models used to calculate radiation detriment, and therefore impact the whole detriment calculation. Furthermore, because of the high complexity and the many parameters involved in the detriment calculations, uncertainty and sensitivity analyses are necessary in order to allow for a broader understanding of the radiation protection system.