
Abstract
The article presents adaptive testing strategies for polytomously scored technology-enhanced innovative items. We investigate item selection methods that match examinee’s ability levels in location and explore ways to leverage test-taking speeds during item selection. Existing approaches to selecting polytomous items are mostly based on information measures and tend to experience an item pool usage problem. In this study, we introduce location indices for polytomous items and show that location-matched item selection significantly improves the usage problem and achieves more diverse item sampling. We also contemplate matching items’ time intensities so that testing times can be regulated across the examinees. Numerical experiment from Monte Carlo simulation suggests that location-matched item selection achieves significantly better and more balanced item pool usage. Leveraging working speed in item selection distinctly reduced the average testing times as well as variation across the examinees. Both the procedures incurred marginal measurement cost (e.g., precision and efficiency) and yet showed significant improvement in the administrative outcomes. The experiment in two test settings also suggested that the procedures can lead to different administrative gains depending on the test design.
Keywords
Introduction
Many testing programs nowadays use computers for test delivery and seek to include technology-enhanced items (TEIs). TEIs are the items that make use of computer functions and take nontraditional innovative formats. Items may use digital tools to present information efficiently (e.g., audio, graphics, video, and simulation) or ask dynamic user interaction to assess processing skills or complex knowledge (e.g., drag-and-drop, hot spot, cloze, and sequencing). Afforded by modern technology, TEIs demonstrate greater fidelity to real-world problems and can yield better measurement outcomes than traditional text-based items (e.g., enhanced construct validity and content coverage, reduced guessing).
While TEIs hold great promise for future assessments, much work is needed for reaping the full benefits. One area of special importance is item administration. In applied settings, TEIs are commonly presented with the existing items in small numbers. Items can be interspersed manually at desired locations or seeded automatically on a statistical criterion. In the latter case of stochastic assignment, common practice is to use an information measure. Computerized adaptive testing (CAT), for example, evaluates information that candidate items provide for the examinee’s latent proficiency and administers an item that provides maximal information at the currently estimated ability level. The maximum information (MI) criterion offers an optimal design for maximizing the measurement efficiency (i.e., minimizes the number of items needed for achieving the same measurement precision) and has been widely adopted in many operational testing programs.
The MI criterion, despite the virtue of measurement efficiency, can however entail an item usage problem. The criterion tends to select informative items exceedingly frequently while seldom or never choosing the items that contain relatively less information. Applying the MI criterion to TEIs faces the same usage problem but it occurs at a greater cost. Developing TEIs is more costly than developing standard text-based items, and underusing items will make the extended efforts fruitless while depriving the chance for future refinement. On the other hand, overuse of items not only exposes the items to security breach but it can also lead to inordinately time-exacting tests as informative items tend to require longer times.
Recognizing the concern on the usage problem of the information-based testing, the current study seeks to investigate item selection methods that can be alternatively used for TEIs. In real settings, TEIs are typically administered with regular items, and greater diversity in item sampling may be more preferred even when the items do not provide maximum information. For example, TEIs that tap various content areas, demonstrate high authenticity, or provide positive user experience may have operational values even when they provide less-than-optimal information. With this being noted, the current study explores item selection methods for TEIs that can achieve greater sampling diversity on a statistical criterion. 1 Our approach to item selection is to match items’ location to examinees’ ability levels such that items can be sampled in a wide variety, resembling the ability distribution. Since examinees typically have a wide range of ability levels, we surmise that location-matched item selection would achieve greater diversity in item sampling and lead to more balanced item pool usage.
The idea of location-matching item selection is not new and has been widely practiced in binary-response adaptive testing through the b-matching criterion. The b-matched selection is less greedy than the information-based selection and tends to make more exhaustive use of item pools. One issue with applying this criterion to TEIs is that TEIs are typically scored polytomously (Betts, Muntean, Kim, & Kao, 2021; Jiao et al., 2012; Kang, Han, Betts, & Muntean, 2022), and there is no specific index that can characterize the location of an item. In this study, we introduce location indices that describe the location of a polytomous item on the ability continuum and investigate probable testing outcomes of the location-matched item selection through Monte Carlo simulation. While formulating the selection criterion, we also contemplate utilizing time information so that the selection decision can be informed of examinees’ time-wise behavior and can accommodate working speeds.
We note that the current literature contains a wealth of studies that examine the item selection methods for polytomous-response CAT (e.g., Pastor et al., 2002; van Rijn et al., 2002; Veldkamp, 2003). As alluded to earlier, these studies mostly applied the information measures (e.g., Fisher information and Kullback–Leibler divergence) that are susceptible to the usage problem. The current study is aimed to explore other possible approaches to selecting polytomous items, giving special consideration to the administration of TEIs.
In the sections that follow, we expound on the proposed idea, details, and performance of the suggested item selection methods. In Section 2, we discuss measurement models for item responses and response times. We then present an inferential framework that jointly estimates parameters of the measurement models. Section 3 discusses adaptive item selection strategies suggested for polytomous TEIs. It begins with the MI criterion and a variant that integrates response time information. The section continues with the location-matching (LM) selection approach, followed by speed-moderated LM criteria. Sections 4 and 5 present simulation studies under two test settings: computerized adaptive testing (CAT) and variable-length computer-adaptive classification testing (VL-CCT). The paper concludes in Section 6 with a summary of findings, implications, and future research directions.
Model and Inference
Measurement Models
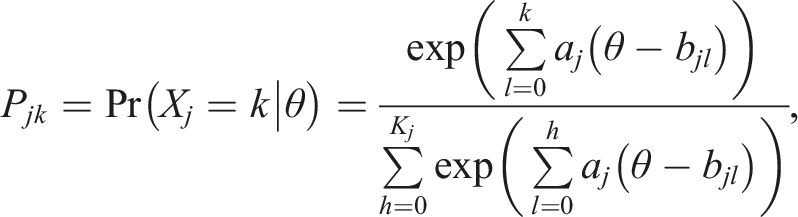
The study applies the generalized partial credit model (GPCM; Muraki, 1992) to model item response scores and the log-normal model (LNM; van der Linden, 2006) to describe response time behavior. GPCM describes the probability of an item score as
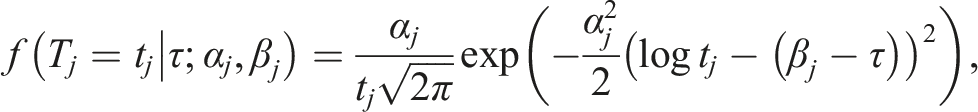
Response time on an item is modeled as
Joint Item Calibration
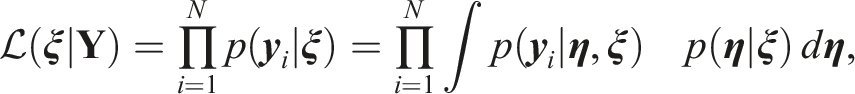
The parameters of GPCM and LNM can be estimated jointly under the hierarchical framework (van der Linden, 2007). This study extends the marginal maximum likelihood estimation of Kang, Zheng, and Chang (2021) to draw joint inference from GPCM and LNM. Let

In the case that priors are available for the item parameters,

Trait Inference Under the Joint Framework
Once item parameters are estimated with sufficient precision, examinees’ trait levels can be estimated based on the known item parameters. This study applies expected a posteriori (EAP) for the first item and maximum a posteriori (MAP) afterward. Applying Bayes prior p (θ, τ), a posterior probability of trait values is evaluated as

Item Selection Methods
The study investigates two criteria for selecting polytomous TEIs: (i) location matching and (ii) speed leverage. The location-matching selects items that match the examinee’s ability level in location. Since polytomous items have no specific index that represents location, we suggest two indices from Ali et al. (2015) that have potential for practical use. Both the indices characterize relative location of an item on the ability continuum. The item selection based on these indices can be seen as adapting item’s overall difficulty to an examinee’s ability level. As explained earlier, since examinees typically have a wide variety of ability levels, we anticipate that the location-matched item selection achieves greater diversity in item sampling than the maximum information criterion.
The attempt to leverage test-taking speed in item selection is guided by our observation from real assessment data. TEIs in real assessments vary substantially depending on the presentation format, answer type, and location on the test, and they show markedly different response time patterns. For example, items asking typed answers tend to require more time than the items asking mouse-clicked or dragged answers. TEIs that appear later tend to show shorter processing times as examinees become familiar with the item formats. These items may show little difference in the item response parameters (and thus in the item information) but can differ substantially in the time-wise parameters. Item selection that takes into account these distinct characteristics can not only help regulate examinees’ testing times but can also improve item pool usage as it can alleviate reliance on the item information.
With the above new approaches in view, below we present new selection criteria that match items’ location in overall difficulty and time intensity. We begin with existing methods that provide reference conditions—the MI criterion and its variant that leverages response time—and then continue with the proposed LM criteria and variations that leverage working speed. For illustration, this study uses Fisher information as a representative example of the information-based item selection. We leave extensions to, and comparison with, other information measures (e.g., Kullback–Leibler divergence, Shannon entropy, and mutual information) for future research.
Information-Based Item Selection
Maximum Information (MI)
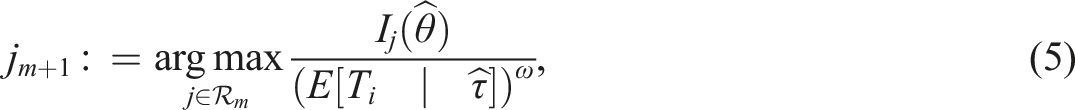
The MI criterion selects an item that provides maximum information about examinee’s latent ability. Suppose at stage m (i.e., the mth item on the test) an item is selected from a pool of eligible items. The MI criterion evaluates item information based on the examinee’s provisional ability estimate,

where jm+1 is the (m + 1)th item to be selected,
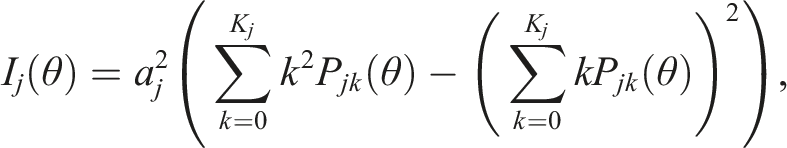
where P jk (·) is the item category response function for item j category k.
Maximum Information Per Time Unit (MIT)
The MI criterion provides an optimal item selection design in the sense that it can achieve the same measurement precision using a minimal number of items (i.e., length-wise measurement efficiency). It however gives little consideration to the time needed for answering an item. In real settings, items that contain large information often demand substantial time effort (van der Linden et al., 1999), and sole focus on the item information can lead to time-exacting tests. The information-centered item selection in particular can handicap capable examinees as the items that are matched to the high ability levels tend to be time-intensive (van der Linden & van Krimpen-Stoop, 2003).
With the notion that item information correlates with the time intensity, several studies considered modulating response times in item selection (e.g., Cheng et al., 2017; Choe et al., 2018; Fan et al., 2012). A pioneering work in this attempt is Fan et al. (2012), which proposed to select an item that maximizes information per time unit (MIT). The selection criterion uses the standard information measure but inversely weighs the expected response time of the prospective item. Again suppose that an item is sampled at stage m + 1. The MIT criterion then selects the next item as
where
Location-Matched Item Selection
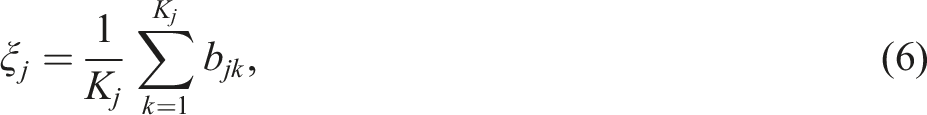
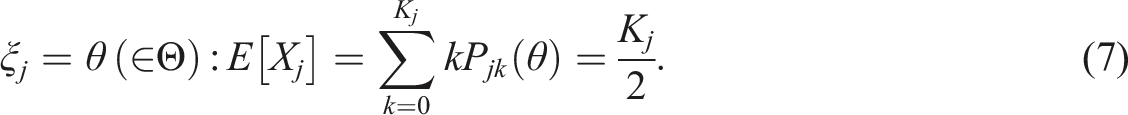
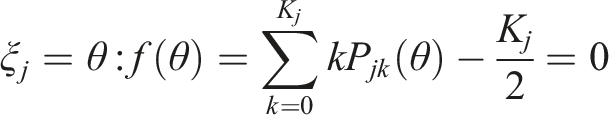
Both the MI and MIT rely on the item information measure and are subject to the item pool usage problem. In this study, we explore a location-matching approach that could lead to more balanced item pool usage. Two indices are considered to determine the location of a polytomous item: (i) an average of step difficulties and (ii) an intermediate ability point that leads to a half item score (i.e., K
j
/2).
2
The average point models the overall difficulty of an item through the average of the step difficulty parameters of the response categories
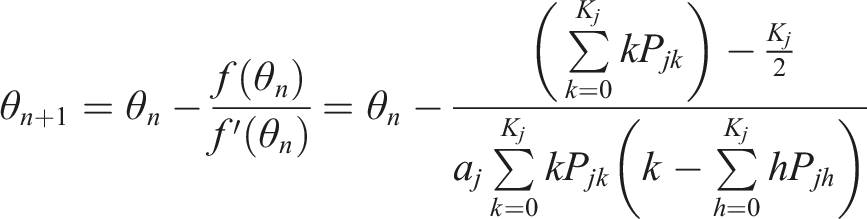

As was done in the MIT, the LM selection can integrate information from the response times. Instead of weighing the expected time, however, the criterion leverages examinee’s working speed to be in line with the location matching:

Simulation Study I: CAT
Monte Carlo simulation studies were conducted to evaluate the performance of the selection methods. The simulation was performed in two test settings: (i) fixed-length computerized adaptive testing (CAT) and (ii) variable-length computer-adaptive classification testing (VL-CCT). Many operational testing programs adopt these testing modes as a main delivery mode, and the choice of an item selection method can carry different implications. In this section, we present the CAT study, giving close attention to the trait recovery, item pool usage, and testing time. The following section presents the study under VL-CCT, examining final test lengths, classification performance, item pool usage, and testing times.
Design
Model
The study used the two models in Section 2.1 as main measurement models—GPCM for item response scores and LNM for response times.
Item Pool
For creating item pools, we simulated pseudo items assuming moderate correlation between the parameter domains, ρ = .3 (Cheng et al., 2017; Klein Entink et al., 2009). 4 We sampled (log a j , b jk , log α j , β j ) from a multivariate normal distribution with means (−.043, 0, −.043, 0) and variances (.086, 1, .086, 1) such that the item parameters have means of (1, 0, 1, 0) and variance of (.09, 1, .09, 1) on the original metric. Each item pool contained a set of 200 polytomous items that differ in the maximum item scores (2 ≤ K j ≤ 6). 5
It may be relevant to note that some previous studies applied different distributions for generating step difficulty parameters (e.g., Penfield, 2006; Sun et al., 2012). While this approach helps separate response score categories, it makes it difficult to simulate correlation between the parameter domains. Correlation between the item parameters is one of the important aspects that needs to be considered in the current simulation study because operational items in real assessments often exhibit nonzero correlation (van der Linden et al., 2010) and it affects item selection as well as item pool usage. In addition, since our simulation study assumed different ranges of item scores, it is more efficient to simulate items using the same generating distribution and exclude the items that have calibration issues. This was the strategy applied in this study. We simulated items in large numbers, calibrated prior to CAT simulation, and randomly selected 200 items among those that converged successfully. This strategy better mimics the real test practice and the simulation results will give closer approximations to real outcomes as they embody both the calibration and measurement error. The final item pools used in the CAT simulation contained constant numbers of 200 items that converged successfully in precalibration. For calibrating the items, we applied spiraled linking design with N = 1000 calibration samples per item. The item parameters were estimated jointly via marginal maximum a posteriori estimator (see Model and Inference).
CAT
Upon creating item pools, we simulated CAT mimicking real test settings. We drew random samples of N = 1000 examinees from a bivariate normal distribution (
In applied settings, testing programs typically arrange exposure control to regulate item overuse (e.g., Chang & Ying, 1999; Kingsbury & Zara, 1989; Sympson & Hetter, 1985) or to balance content coverage (e.g., Cheng & Chang, 2009; van der Linden, 2000). Deploying such procedures in the current setting will shield the original usage problem and limit the conclusions to the chosen method. To make our discussion adequately relevant to the current issue and to broader applications, we apply a rather simple exposure control scheme that constrains maximum item exposure rate. We define exposure rate as the frequency of item use over the number of test takers and constrain the maximum rate at .20 such that items can be used up to 20% of the sample. This approach can demonstrate the gravity of the usage problem and will provide a rough and yet realistic projection for real settings. For those situations with more refined or relaxed conditions (e.g., randomesque and higher maximum exposure rate), see Appendix B that provides supplementary simulation.
Trait Estimation
During CAT, examinees’ trait levels were estimated by applying standard estimators. When tests were operated based on the responses only, we applied a maximum likelihood or EAP estimator under GPCM. 6 When the information from the response times was utilized, MAP or EAP (first item) was applied under the GPCM and LNM.
Replication
All simulation conditions were replicated 100 times with unique generating parameter sets. Results from the replications were summarized by average and standard deviation (SD) of the evaluation statistics which are discussed below.
Evaluation
Simulation results were evaluated in three aspects: (i) accuracy of final ability estimates, (ii) item pool usage, and (iii) testing time. The trait recovery was evaluated by root mean squared error (RMSE), absolute bias (AbsBias), correlation (Cor) between the true and estimated ability values, and average standard error (SE). The item pool usage was examined by χ2 (Chang & Ying, 1999), test overlap rate, and percentages of items that reached the maximum exposure (i.e., retired items) and that are underutilized (less than 1%). The results related to the testing times were examined by descriptive statistics: average, maximum, and SD of log testing times. 7 When examining the evaluation statistics, we conducted significance tests and analyzed the variance of the outcome statistics to draw distinction between the selection methods and determine the effect of the design variables. Significance of difference was evaluated at α < .001 due to the large number of replications. Significance of an effect was assessed following the convention (Cohen, 1988)—the partial η2 less than .01 as small effect size, between .06 and .14 as medium, and greater than .14 as large effect size.
Results
Trait Recovery
Trait Recovery in CAT.
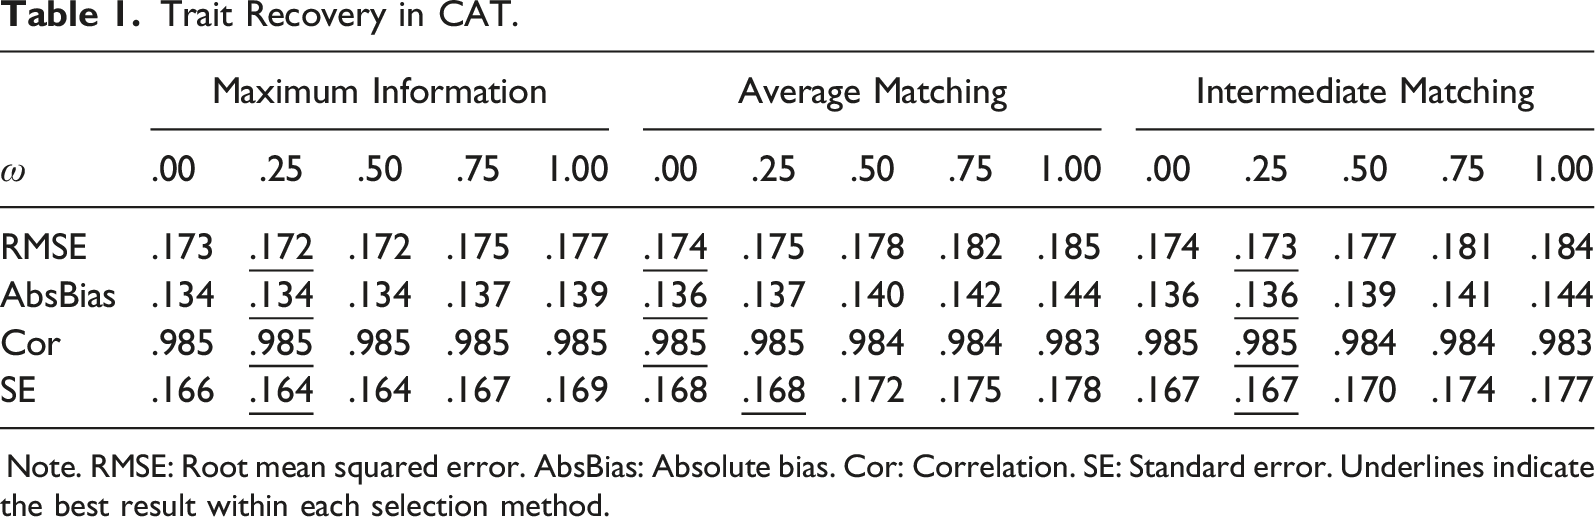
Note. RMSE: Root mean squared error. AbsBias: Absolute bias. Cor: Correlation. SE: Standard error. Underlines indicate the best result within each selection method.
Item Pool Use
Item Pool Usage in CAT.
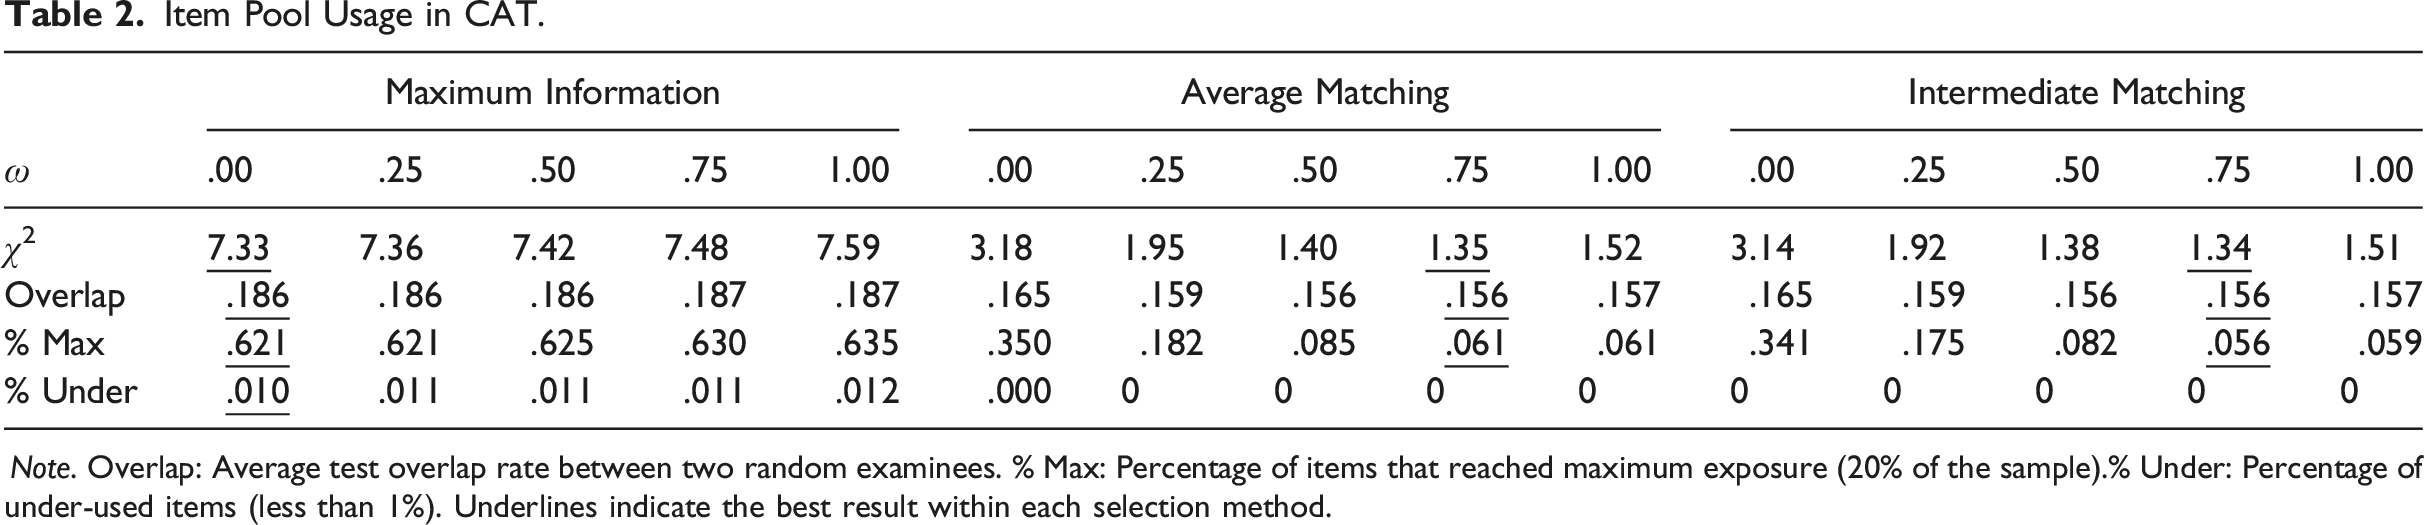
Note. Overlap: Average test overlap rate between two random examinees. % Max: Percentage of items that reached maximum exposure (20% of the sample).% Under: Percentage of under-used items (less than 1%). Underlines indicate the best result within each selection method.
The impact of leveraging time/speed differed by the selection method. Weighting response times in MI led to more skewed pool use (Δ χ2 = .255, Δ Overlap = .13%, Δ Max = 1.39%, Δ Under = .23%). In LM, the speed leverage induced more even pool usage (Δ χ2 = −1.645, Δ Overlap = −.82%, Δ Max = −28.56%). The different patterns in the selection methods seemed to be related to the characteristics of the items selected by the criteria (see figures in Appendix C for example illustration). In MI, introducing time leverage led to frequent use of less time-intensive items, slanting the item exposure distribution even more. The speed leverage in the LM criteria led to more diverse item sampling across the different location values and βs, entailing a more normal-like exposure distribution. It appears that using timing information generally conduces to more balanced item pool usage in LM, whereas it intensifies the asymmetry in MI.
The trends across the varying time weights similarly differed according to the selection criterion. In MI, increase in the time weight resulted in more imbalanced pool use (η2 > .158 except for
Testing Time
Logarithm of Testing Times in CAT.
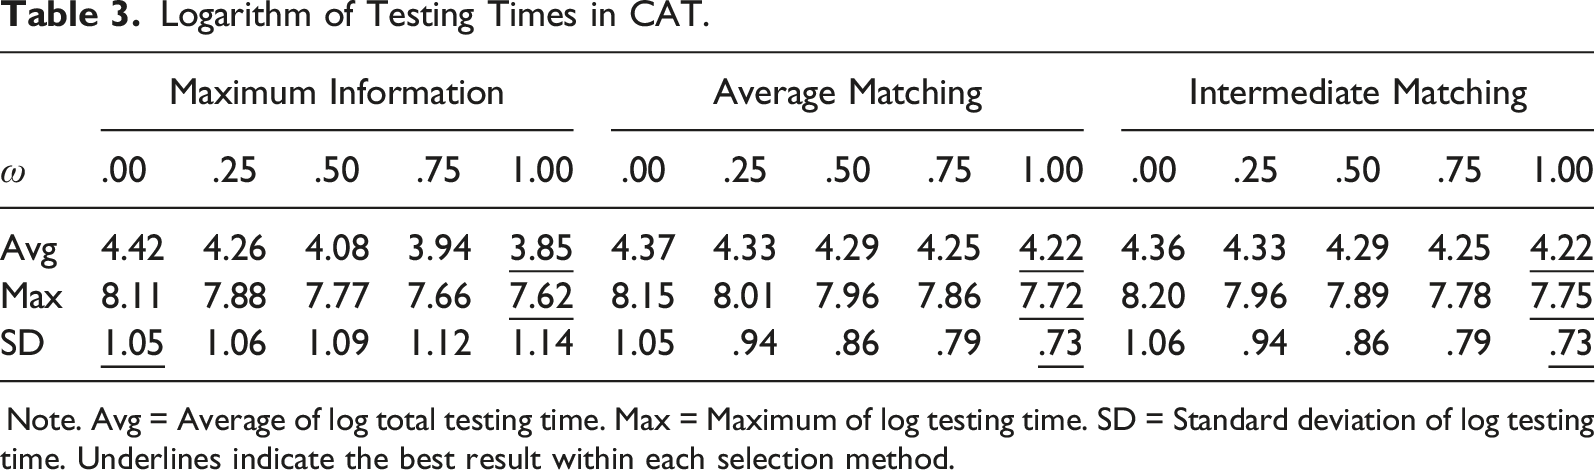
Note. Avg = Average of log total testing time. Max = Maximum of log testing time. SD = Standard deviation of log testing time. Underlines indicate the best result within each selection method.
Simulation Study II: VL-CCT
The second simulation study examined the performance of the selection methods in VL-CCT. Since the choice of an item selection criterion affects test length, we give close attention to the mediation effects of the test length.
Design
VL-CCT
The study applied similar settings with the preceding study. Using the precalibrated item pools, samples of N = 1000 simulees were tested based on the items that were adaptively selected according to the MI, AM, and IM criteria. When the information from the response times was leveraged, different weights were applied to modulate the impact of the time/speed leverage. The design variables unique to the VL-CCT were arranged to mimic licensure credential assessments. While in testing, simulees received tests in varying lengths until they are classified into one of the pass/fail groups at 95% confidence. Applying a threshold of θ = 0, if an examinee’s interval ability estimate does not include the threshold, testing was terminated and the examinee’s class membership was decided based on the location of the estimated ability value,
Evaluation
The testing outcomes were evaluated in four aspects: (i) the final test length, (ii) classification accuracy, (iii) item pool usage, and (iv) testing time. The test lengths were examined by the average across the examinees (i.e., average number of items assigned) and the proportion of examinees that reached the maximum test length (i.e., those that did not meet the termination criterion). The results relating to the classification accuracy were evaluated by four statistics: false positive rate (Type I error), false negative rate (Type II error), sensitivity (correct identification of true pass), and specificity (correct identification of true fail). The item pool usage and testing time efficiency were evaluated using the same criterion statistics as in the preceding study.
Results
Test Length
Test Length in VL-CCT.
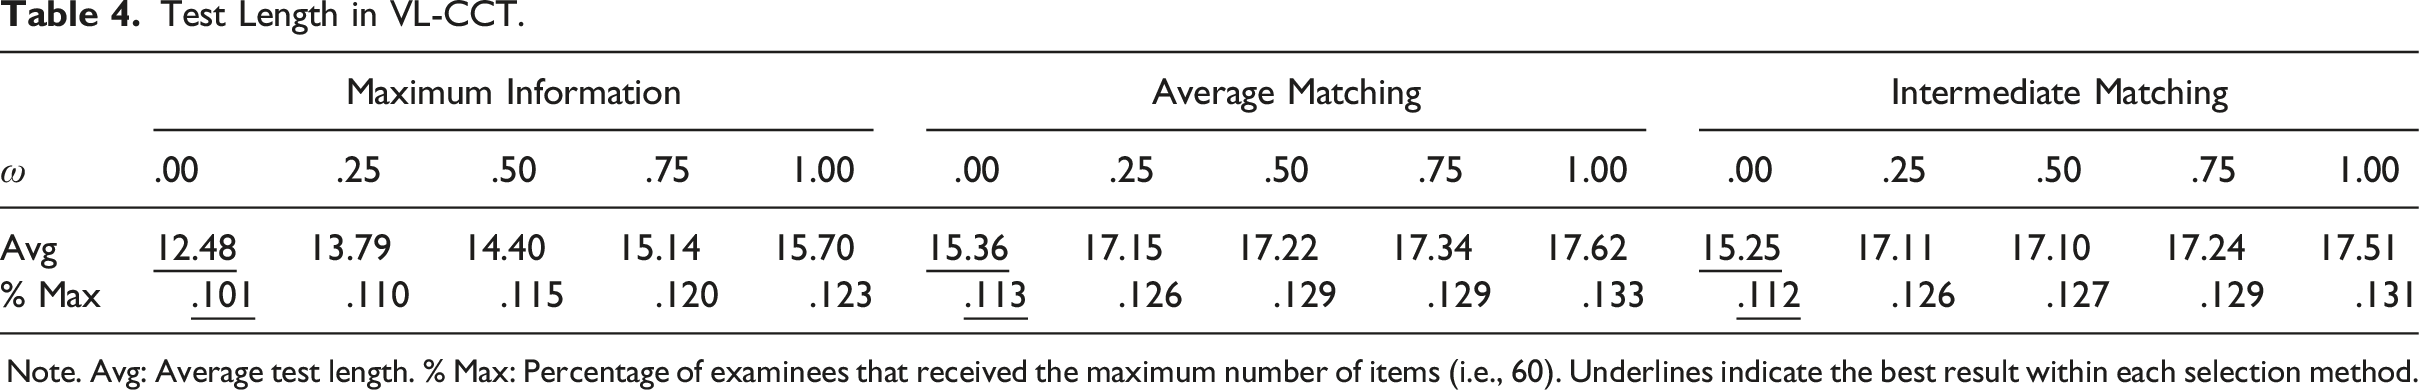
Note. Avg: Average test length. % Max: Percentage of examinees that received the maximum number of items (i.e., 60). Underlines indicate the best result within each selection method.
The different test lengths administered in each condition causally affect other testing outcomes, including classification accuracy, item pool usage, and testing time. Below, we evaluate these outcomes taking into account the effects of the different test lengths.
Classification Accuracy
Classification Accuracy in VL-CCT.
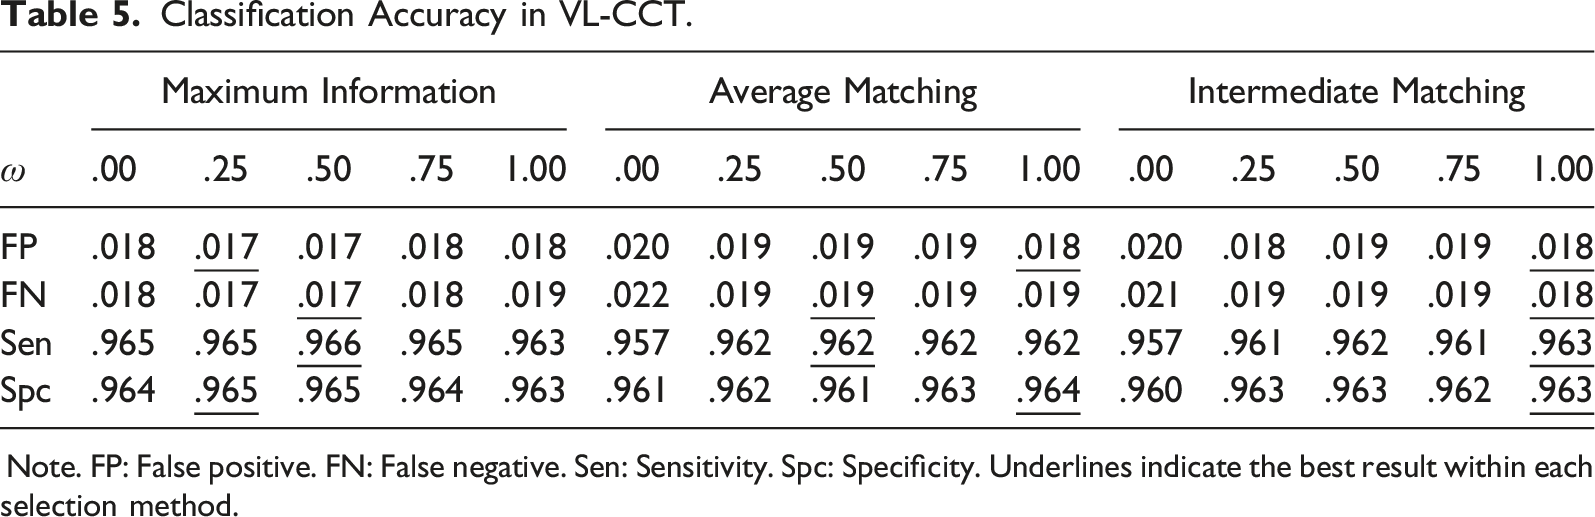
Note. FP: False positive. FN: False negative. Sen: Sensitivity. Spc: Specificity. Underlines indicate the best result within each selection method.
Table 5 also shows that the time leverage generally induced positive outcomes (η2 < .024). Although marginal, both the false decision rates and classification accuracy improved as the time/speed was considered in the item selection (Δ false classification = −.001, Δ correct classification = .003). The current pattern can be again explained by the different amounts of test information. With the use of more items (2.581 on average), the time-leveraged item selection showed smaller SEs (.343 (time leverage) versus .411 (no time leverage)) and tended to achieve higher classification accuracy. The impact of different time weights was generally impalpable because of the compound effects of the selection method and the test length (η2 < .008). Although there were certain weights that led to better or worse classification results, the observed values were mostly comparable and differed only in the third decimal place.
Item Pool Use
Item Pool Usage in VL-CCT.
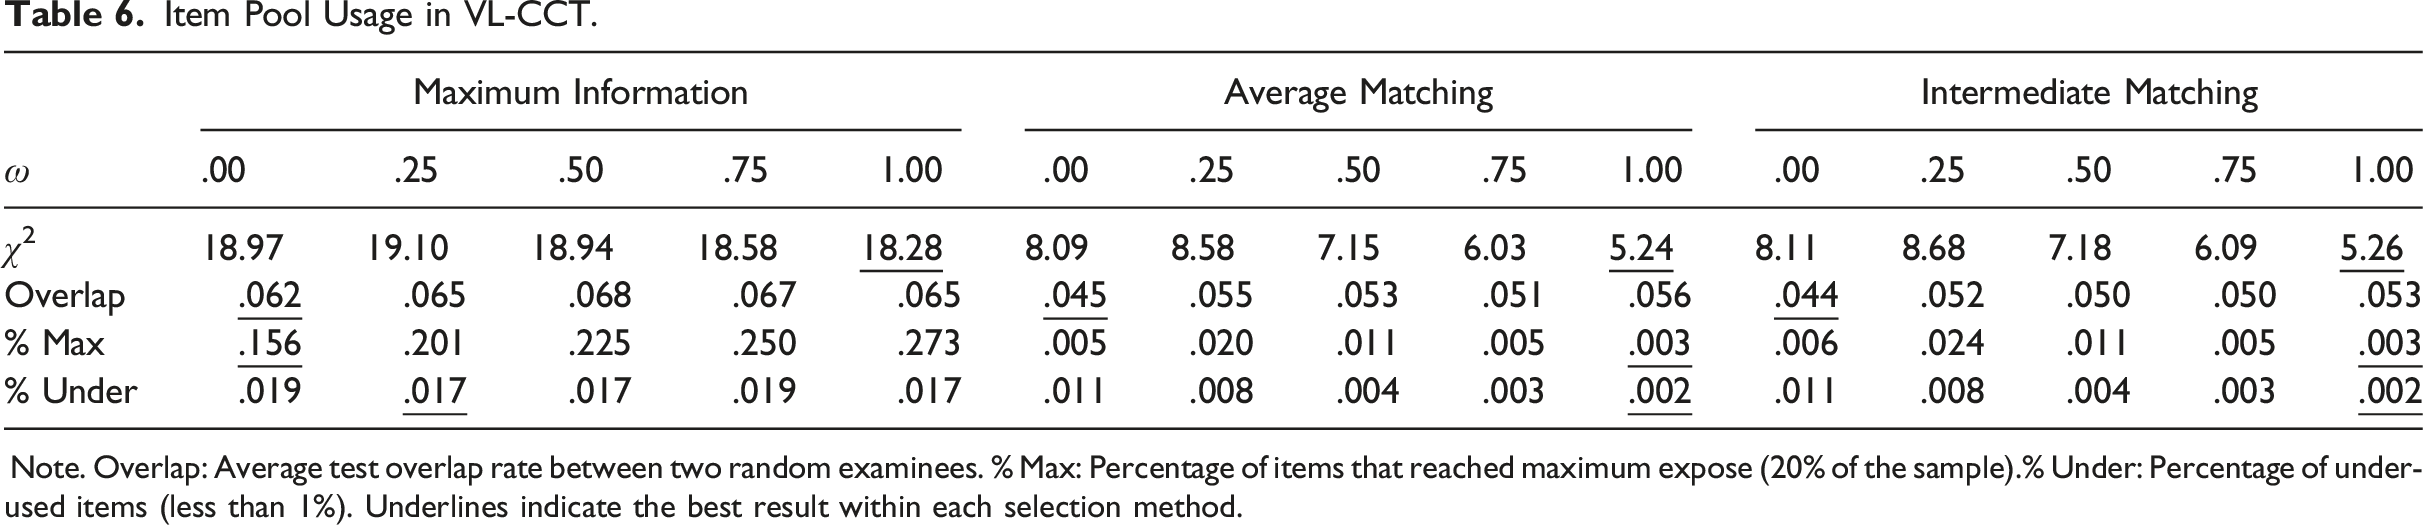
Note. Overlap: Average test overlap rate between two random examinees. % Max: Percentage of items that reached maximum expose (20% of the sample).% Under: Percentage of under-used items (less than 1%). Underlines indicate the best result within each selection method.
In Table 6, leveraging response times entailed somewhat different results depending on the selection method and the evaluation criterion. In MI, the time-leveraged selection (i.e., ω = 1) led to lower χ2 (Δ = −.690) but showed higher test overlap rate (Δ = .24%, p = .745) and more frequent item overuse (Δ = 11.67%). In LM, leveraging working speed improved χ2 (Δ = −2.850), item over- and under-use (Δ Max = −.28%, p = .003; Δ Under = −.89%) but intensified the test overlap (Δ = .96%, p = .009). We find that the distinct patterns in the pool usage are related to the characteristics of the selected items and the test lengths (see Appendix C for illustrative examples). When items were selected through MIT, items with little time intensity were inordinately preferred, frequently using facile items. Interestingly, the use of time leverage helped alleviate the strong preference for the discriminating items and led to better use of low-discriminating items. The net effect in the item over- and under-use made the exposure distribution more uniform-like, consequently improving the skewness. The items selected by the speed-leveraged LM, on the other hand, were dispersed across the wide ranges of item parameter values and tended to exhibit a normal-like exposure distribution. As items were selected to match the examinees’ ability and speed levels, the item exposure distribution tended to exhibit a strong central tendency, improving the evaluation statistics on the whole. In both the criteria, the increase in the test overlap rate appeared to be due to the increased use of items. Varying time weights similarly had mixed effects according to the selection method and the evaluation criterion. In MI, the greater time weight helped improve χ2 (η2 = .254) but deteriorated the test overlap rate (η2 = .000) and item over- and under-use (
Testing Time
Logarithm of Testing Times in VL-CCT.
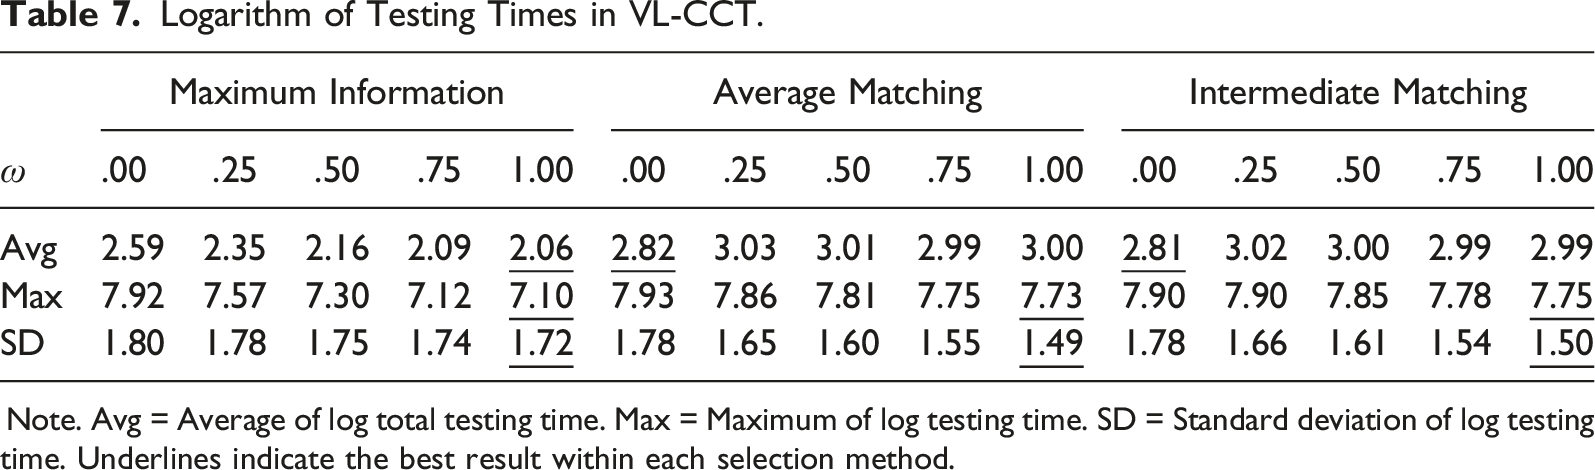
Note. Avg = Average of log total testing time. Max = Maximum of log testing time. SD = Standard deviation of log testing time. Underlines indicate the best result within each selection method.
Conclusion
The purpose of this study was to explore adaptive testing strategies for polytomous TEIs. Current approaches to administering polytomous items are mostly developed based on the information measures and tend to experience severe asymmetry in item usage. If the selection criterion considers item response times, the usage problem can exacerbate in preference for informative and facile items. Recognizing the concern on the skewed use of TEIs, the present study sought to explore alternative item selection methods that can lead to more balanced pool usage. Our approach was to match item locations to examinee’s trait levels so that items can be adapted in relative difficulty and time intensity. Since examinees have various trait levels, it was reckoned that location-matched item selection would lead to more diverse item sampling across the wide range of location values and use item pools more exhaustively and evenly.
Numerical experiments from the Monte Carlo simulation suggest that location-matched item selection indeed achieves significantly better and greater balance in item pool usage. The two LM methods, AM and IM, showed distinctly smaller χ2, lower test overlap rate and smaller percentages of over- and under-used items when compared with MI. Leveraging speed in LM also had clear effects, reducing the average testing times and regulating variation across examinees. The speed leverage also helped improve the item pool usage through additional matching in time intensities.
While the empirical evaluation showed that the location matching and speed leverage deliver significantly better administrative outcomes, it is important to note that they can also entail cost in the measurement outcomes. Both approaches depart from the optimal item selection and can increase measurement error or lose measurement efficiency. For example, when the test length is fastened at a constant value, the measurement cost can appear in the ability estimates and/or standard error. When the test length is allowed to vary, they can lead to longer tests, consequently increasing the test completion times. Our experiment in the two test settings suggests that although the procedures do come with some measurement cost, the magnitude of the loss is generally marginal and is likely to occur in a limited scale in real settings. Operational testing programs typically adopt sufficiently long tests and administer TEIs in small numbers along with the regular items in the existing formats. In such circumstances, the loss in the measurement—either in the precision or test length can be easily offset by the extant items.
We conclude the article with a final remark on the use of timing information in real assessments. Although our simulation study showed that leveraging time information in the item selection does effectively improve testing time efficiency, the application to real settings must carefully consider consequential validity of using timing information. Reliable modeling of behavioral data is often difficult to achieve in real assessments and utilizing auxiliary information during decision-making process can introduce fairness issues. For making capital of the response time information, sufficient research and careful decision process must be preceded. Our work in this study is an attempt to inform such decisions when compromise is needed between the measurement precision and administrational needs.
Supplemental Material
Supplemental Material - Location-Matching Adaptive Testing for Polytomous Technology-Enhanced Items
Supplemental Material for Location-Matching Adaptive Testing for Polytomous Technology-Enhanced Items by Hyeon-Ah Kang, Gregory Arbet, Joe Betts, and William Muntean in Applied Psychological Measurement
Footnotes
Declaration of Conflicting Interests
The author(s) declared no potential conflicts of interest with respect to the research, authorship, and/or publication of this article.
Funding
The author(s) disclosed receipt of the following financial support for the research, authorship, and/or publication of this article: This work was supported by the National Council of State Boards of Nursing; (UTA21-000242).
Supplemental Material
Supplemental material for this article is available online
Notes
References
Supplementary Material
Please find the following supplemental material available below.
For Open Access articles published under a Creative Commons License, all supplemental material carries the same license as the article it is associated with.
For non-Open Access articles published, all supplemental material carries a non-exclusive license, and permission requests for re-use of supplemental material or any part of supplemental material shall be sent directly to the copyright owner as specified in the copyright notice associated with the article.