
Abstract
The article compares the trajectories of students’ self-reported test-taking effort during a 120 minutes low-stakes large-scale assessment of English comprehension between a paper-and-pencil (PPA) and a computer-based assessment (CBA). Test-taking effort was measured four times during the test. Using a within-subject design, each of the N = 2,676 German ninth-grade students completed half of the test in PPA and half in CBA mode, where the sequence of modes was balanced between students. Overall, students’ test-taking effort decreased considerably during the course of the test. On average, effort was lower in CBA than in PPA. While on average, effort was lower in CBA than in PPA, the decline did not vary between both modes during the test. That is, students’ self-reported effort was higher if the items were easier (compared to students’ abilities). The consequences of these results concerning the further development of CBA tests and large-scale assessments in general are discussed.
Introduction
During the last decade, various periodic national and international large-scale assessments (LSAs) in educational research have changed their operational mode from paper-and-pencil assessments (PPA) to computer-based assessments (CBA). For example, the Programme for International Student Assessment (PISA) has administered computer-based tests since 2015 (OECD, 2017), the Trends in International Mathematics and Science Study (TIMSS) since 2019 (Robitzsch et al., 2020), and the Progress in International Reading Literacy Study (PIRLS) since the 2021 cycle (Mullis & Martin, 2019).
In general, LSAs measure students’ performance in selected subjects (e.g., Science or Mathematics) along with various socio-demographic, motivational, and other variables. Students’ scores are compared between participating countries to provide policymakers with valuable information about the capability of the educational system in their country (see, e.g., Rutkowski et al., 2014 for a comprehensive overview). Most LSAs are low-stakes for students, meaning they are neither rewarded for doing their best nor penalized for working carelessly on the test, which might limit students’ motivation. Test-taking motivation or test-taking effort, however, has repeatedly been shown to be associated with test performance (Baumert & Demmrich, 2001; Penk & Richter, 2016; Wise & DeMars, 2005; Wise & Kuhfeld, 2021). For policymakers, results from LSAs are high-stakes in that the test scores represent what students know and can do if they do their best. If students’ efforts vary during the test (taking a within-person-perspective, see, e.g., Weirich et al., 2017; Wolgast et al., 2020) or differ between participating countries (taking a between-person perspective, see, e.g., Debeer et al., 2014), the validity of test scores may be threatened. Therefore, test administrators are interested in ensuring a constant and preferably high level of effort both within students (i.e., effort should not decrease during the test) and between students. Results of previous studies have partly questioned whether these conditions are fulfilled in PPA tests. For example, Asseburg and Frey (2013) showed that the level of effort in a test situation is related to the difference between the test-takers ability and the difficulty of the items the test-taker worked on, that is, the “fit” between item difficulty and person ability. They found test-taking effort to depend linearly on the extent a students’ ability exceeds the difficulty of the items seen, except for the very upper and lower end. This is in line with related research in classroom contexts, where research shows that the difference between task difficulty and student ability is related to motivational variables. Krannich et al. (2019), for instance, found that overchallenge negatively affects academic self-concept, whereas underchallenge enhances academic self-concept. However, severe over- or underchallenge also increased students’ boredom. Thus, motivational variables like test-taking effort vary both between students (see also Baumert & Demmrich, 2001; Eklöf, 2010) as well as within students during the course of the test (Sachse et al., 2023) and depending on item characteristics (e.g., Asseburg & Frey, 2013; Goldhammer et al., 2017) as well as on the sequence of (sub-)tasks presented in the test battery (Wolgast et al., 2020).
Low, fading, or varying test-taking motivation may have detrimental consequences to the validity of test scores. For example, test-taking motivation can cause rapid guessing (Wise et al., 2009), increased omission rates (Köhler et al., 2015; Pohl et al., 2014), or quitting (Ulitzsch et al., 2020), among other factors, potentially shrinking the test scores of high-performing test takers due to motivational issues. Hence, establishing a consistently high level of student motivation has become an important aspect of validly interpreting low-stakes test scores (Baumert & Demmrich, 2001). In view of the gradual change from paper-and-pencil to computer-based assessments, the current study compares test-taking motivation between paper-based and computer-based (but otherwise equivalent) tests.
Test-Taking Motivation in Computer-Based Assessments
From the early beginning in the sixties of the 20th century, large-scale assessments were administered as paper-and-pencil tests. The most prevalent reason for changing the testing mode to a computer-based format is the possibility of adaptive testing, where tasks can be tailored to the exact level of students’ skills. This can increase measurement precision in the subsequent Item Response Theory (IRT) scaling models (Frey et al., 2016; Luecht & Nungester, 1998). Moreover, as students’ motivation also depends on item difficulty (Goldhammer et al., 2017), adaptive testing may enhance and sustain student effort during the test. For example, providing less capable students with easier tasks may prevent students’ motivation from dropping to feelings of resignation (Lane & Leventhal, 2015). At the same time, assigning more difficult tasks to high-performing students can prevent them from being underchallenged, completing the tasks superficially, and not performing up to their competence level.
Theoretically, computer-based tests offer possibilities to increase students’ motivation, for example, by providing a more engaging testing environment that promotes students’ intrinsic values, such as enjoyment more than (linear) PPA tests. In addition to external incentives or appeals (Baumert & Demmrich, 2001), Perkins et al. (2021) found in line with Pekrun’s (2006) theory of achievement emotions that test-taking effort is positively correlated with enjoyment and negatively correlated with emotions like boredom, anger, or anxiety. Similarly, Wigfield and Eccles (2000) Expectancy-value theory (EVT) claims four value components of achievement tests (importance, usefulness, enjoyment, and costs). At first glance, one would expect importance to be low due to low stakes for students, and usefulness to be low as well due to the lack of immediate feedback in paper-based, large-scale testing. Hence, enjoyment is the one factor that should be maximized to foster students’ engagement. However, in an experimental study, Liu et al. (2015) showed in computer-based settings and Baumert and Demmrich (2001) for PPA that appeals highlighting the importance of the study to educational administrators have positive effects on students’ motivation, even if the results have no direct consequences for them (for an overview, see Rios, 2021). As previous research has shown that low or declining motivation is likely to be the rule rather than the exception (Debeer et al., 2014; Eklöf, 2010; Perkins et al., 2021; Weirich et al., 2017), it is important to investigate which of these alternatives can be made most useful through the possibilities of computer-based tests.
Mode Effects Between Paper-Based and Computer-Based Tests
Empirical studies repeatedly showed that computer-based tests on cognitive traits (e.g., reading comprehension) are more difficult for students than paper-and-pencil tests (Fishbein et al., 2018; Robitzsch et al., 2017). This phenomenon is also known as mode effect. Mode effects can result from item properties (e.g., response formats, Bennett et al., 2008; Bodmann & Robinson, 2004; Parshall et al., 2002) and test features (e.g., navigation, layout, Lee et al., 1986) as well as individual characteristics (e.g., ICT-familiarity or -literacy, Zandvliet & Farragher, 1997). Computer use necessitates the deployment of further cognitive resources of the students—solving a reading literacy item not only involves reading competence (as usually presumed by the underlying model) but also technical skills, such as navigating through the text. Mode effects result in more difficult items and represent another source of construct-irrelevant variance that can affect the validity of test scores (Bürger et al., 2016; Fishbein et al., 2018; Kröhne & Martens, 2011; Robitzsch et al., 2020). Moreover, as item difficulty differs between PPA and CBA due to mode effects, also motivational effects (which has been shown to depend on task difficulty, see, e.g., Goldhammer et al., 2017; Wigfield & Eccles, 2000; Wise & DeMars, 2005) might differ between both modes. However, adaptive tests (if applied) or an interesting computer setting might affect motivation in favor of CBA test scores, mode effects might cause opposite effects.
It is reasonable to assume that mode effects may also occur in non-cognitive (e.g., attitudinal) measures, raising similar issues as for cognitive assessments. Fortunately, Thelk et al. (2009) have shown that self-reported measures of examinee motivation are invariant across assessment modes (paper-based vs. computer-based assessment) in terms of configural, metric, and scalar invariance.
Both mode effects and a drop in motivation over the course of the test can introduce construct-irrelevant variance into test scores (Debeer et al., 2014; Haladyna & Downing, 2004; Messick, 1984; Wise & DeMars, 2010) and thus be considered potential threats to the validity of test results (Borsboom, 2004; Messick, 1984, 1989, 1998; Zumbo, 2007). Changing the test mode from paper-based to computer-based tests could lead to mutual reactions between mode and students’ motivation. The estimation of valid test scores then becomes a complex challenge—especially if changes in the mode go along with changes in motivational constructs, which correlate with test performance. Whether test-taking effort depends on the test mode, it is still not clear. It seems possible that computer-based tests provide a more attractive testing environment for students and may stimulate stronger interest than paper-based tests. On the other hand, technical issues may distract students and cause annoyance or loss of interest in test-taking, which may hinder them from performing up to their competence level. Comparing effects of test-taking effort on test scores in PPA and CBA tests can shed light on whether and to what extent test developers shall make reasonable efforts to design tests and administration procedures that keep students’ motivation at a constantly high level.
Research Scope
The present study compares the intra-individual progression of test-taking effort during a large-scale test in PPA versus CBA test mode. Moreover, we investigate whether the progression of effort differs between low and high achieving students. As students’ motivation during test-taking has been shown to depend on whether item difficulty matches student ability (Asseburg & Frey, 2013; Krannich et al., 2019), we control for the difference between the two. Specifically, we examine the following research questions: 1. In a preliminary analysis, we first investigate whether mode effects occur in our English reading and listening comprehension tests. This analysis serves two functions: first, to replicate empirical findings from previous studies and second, to facilitate interpreting the results of research questions 2 and 3. 2. Does self-reported effort change differentially during the test as a function of PPA and CBA administration mode? 3. Does self-reported effort depend on the fit between item difficulty and person ability?
Method
Sample and Procedure
The data stem from a study conducted in spring 2019 with N = 2,676 German ninth-grade students (mean age = 15.1 years; 48% female; 35% academic track) from 123 classes. All students performed a 120 minutes test on English reading and listening comprehension. The tested students were learning English as a foreign language at school. The test consisted of two parts (PPA and CBA), with a scheduled processing time of 60 minutes each and an intermission of 15 minutes in between. We used a within-subject design, that is, each participating class was randomly divided into two parts; the first part labeled with the condition “CBA first” started the test in CBA mode for the first half of the test (blocks one to three) and switched to PPA mode for the second half of the test (blocks four to six). The second part of the class was labeled “PPA first” and started in reverse with PPA mode and then switched to CBA mode. Trained research assistants administered the test under standardized conditions. For the CBA test, students worked on school-owned desktop computers with conventional keyboard and mouse. In addition to the test, students answered a background questionnaire.
Measures
English Reading and Listening Comprehension
The test comprised of 513 dichotomously scored items (267 on reading comprehension and 246 on listening comprehension) administered in a multiple matrix sampling design (Shoemaker, 1973). That is, students only completed a subset of all items. The items were grouped into 23 disjoint blocks (i.e., items were nested within blocks; 12 blocks of reading comprehension, 11 blocks of listening comprehension). The time allocated for each block was 20 min. We constructed 53 booklets, each consisting of six blocks, according to a balanced incomplete block design (Frey et al., 2009; Gonzalez & Rutkowski, 2010; van der Linden et al., 2004), which was balanced regarding block position—that is, each block occurred at each of the six positions with approximately the same frequency. The test items were drawn from an item pool of the IQB Trends in Student Achievement study (Stanat et al., 2016). Thus, items assessed the extent to which students’ reading and listening comprehension in English at the end of secondary school meet the proficiency expectations of the educational standards (KMK, 2004).
Test-Taking Effort
We measured students’ test-taking effort (TTE) as a key element of the multidimensional test-taking motivation using a validated scale (Eklöf, 2010; Eklöf and Nyroos, 2013; Penk et al., 2014). The items referred to students’ effort in the current test situation (e.g., “I gave my best effort on this test.”) and ranged from 1 (strongly disagree) to 4 (strongly agree). All items were adopted (positive formulation only) and translated into German (Penk et al., 2014).
We measured students’ self-reported test-taking effort four times during the test, twice in each test mode (PPA and CBA): (1) at the beginning of the first part of the test (i.e., before students started the test in the first test mode; this condition corresponds to the “pre-test measurement of the first test half”), (2) at the end of the first part of the test (i.e., after 60 min, when students had completed the test in the first test mode; this condition corresponds to the “post-test measurement of the first test half”); (3) at the beginning of the second part of the test (i.e., after the intermission and before students started the second part of the test in the second test mode; this condition corresponds to the “pre-test measurement of the second test half”), and (4) at the end of the second part of the test (i.e., after 120 min when students had completed the second part of the test in the second test mode; this condition corresponds to the “post-test measurement of the second test half”). The wording of the TTE items varied slightly depending on the measurement condition. In each pre-test measurement condition, that is, when motivation is surveyed in relation to tasks that have yet to be completed, we used future tense (“I am motivated to give my best in this test”). In each post-test measurement condition, that is, when motivation is surveyed in relation to the tasks that had just been completed, we used past tense (“I gave my best effort on this test”).
Test-taking effort was measured in the same mode as the test students currently worked on—that is, in the PPA mode, test-taking effort was also measured with paper and pencil, and vice versa. The scale reliabilities of the four effort items yielded satisfactory results (PPA mode pre-/posttest: α = .82/.81; CBA mode pre-/posttest: α = .83/82). We computed the arithmetic mean for each measurement and mode and used them in the subsequent models.
Control Variables
We included self-reported gender, academic track (0 = non-academic track, 1 = academic track), students’ achievement score (θ), and the fit between item difficulty and person ability (i.e., θ–β) as control variables. Additionally, all two-way interactions between the variables were parametrized in the model in order to control for and to be able to detect differential effects with respect to school track and gender.
For construction of the ability-difficulty fit measure, we used the weighted likelihood estimate (WLE; Warm, 1989) as students’ achievement score θ. The WLE resulted from a unidimensional one-parameter Rasch scaling model of the dichotomous item responses (Adams & Wu, 2007; Hambleton et al., 1991). Reading and listening items as well as PPA and CBA items were modeled together in a unidimensional model, yielding a composite English language comprehension test score. As the latent correlation between reading and listening was r = .88 when we scaled the dimensions separately, modeling a composite measure seemed reasonable. The fit between item difficulty and person ability was set to zero for the pre-test measurement of the first test half (at this point, students had not yet performed any test items). For the post-test measurement of the first test half and the pre-test measurement of the second test half, the fit between item difficulty and person ability equals the difference θ–βth1pt. βth1pt is the average difficulty of the items the student has worked on up to this point. For the post-test measurement of the second test half, the fit between item difficulty and person ability equals the difference θ–βth2pt. βth2pt is the average difficulty of the items that the student worked on in the second half, that is, the second 60 minutes of the test.
Statistical Analysis
Model
We used linear mixed modeling (Bates et al., 2015; Dobson & Barnett, 2008; Dunn & Smyth, 2018) to model the change in test-taking effort during the test. Taking the clustered data structure into account (students nested in classes), we applied a multi-level extension of a linear mixed model (LMM) where person and class effects were assumed to be random. Considering the fixed effects, we modeled three within-subject factors, each with two levels (mode: PPA vs. CBA, test half: first vs. second; measurement occasion: pre-test vs. post-test). Additionally, the continuous variable person-test-fit (operationalized with the difference of person score and average item difficulty of the corresponding test part) also varies within students. The between-subject fixed effects were gender (male, female), overall test score (e.g., students’ θ), and the school track (academic track vs. non-academic track). Students’ self-reported effort was the dependent variable in all analyses. The lmer function of the R (R Core Team, 2020) package lme4 (Bates et al., 2015) was used for estimating the LMMs. For the computation of effect sizes in linear mixed models (Hedges, 2007; Westfall et al., 2014), we used the R package emmeans (Lenth, 2022).
Missing Data
The percentages of missing values of the four test-taking effort items varied between 1.2 and 1.9% in the PPA mode and between .7 and 3.6% in the CBA mode. In general, the missing percentage in the post-test exceeded the missing percentage in the pre-test. For the gender variable, only .1% missing values occurred. Assuming missing at random (MAR; Schafer & Graham, 2002), we applied multiple imputation (Rubin, 1987; van Buuren, 2007, 2018) with the R (R Core Team, 2020) package MICE (Multivariate imputation by chained equations; van Buuren & Groothuis-Oudshoorn, 2011) to generate 15 complete data sets. All available background information of the study (including variables not used in the current analysis, e.g., age, spoken language at home) were additionally used as auxiliary variables in the imputation model. The analyses were conducted separately for each imputed data set, and the results were pooled according to Rubin (1987).
Results
Regarding the preliminary analysis on mode effects, we found significant mode effects in both reading and listening comprehension (see Online Appendix Table A1 and A2), indicating that the items are more difficult in CBA than in PPA. In addition, mode effects were heterogeneous across domains and more pronounced for reading compared to listening comprehension.
Test-Taking Effort for the Four Measurement Occasions Within the PPA and CBA Test Mode.
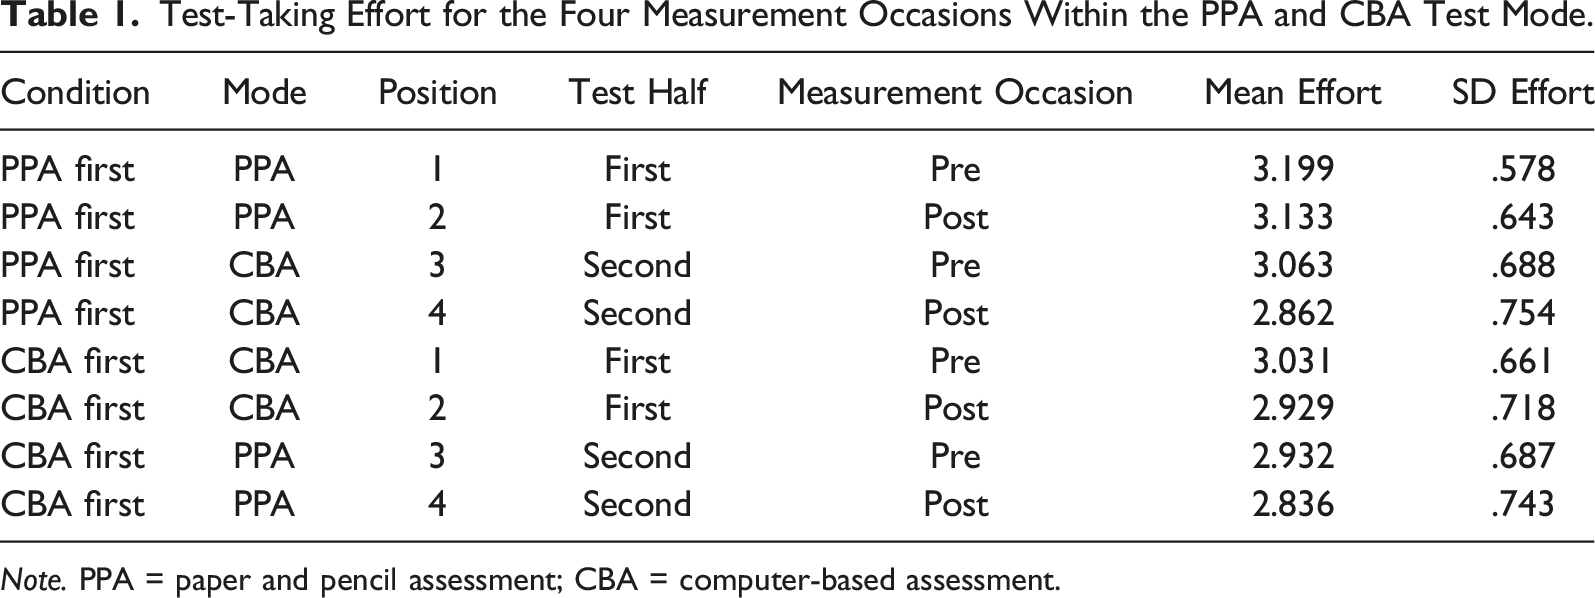
Note. PPA = paper and pencil assessment; CBA = computer-based assessment.
Estimates of Fixed and Random Effects for LMM 1 and LMM 2.
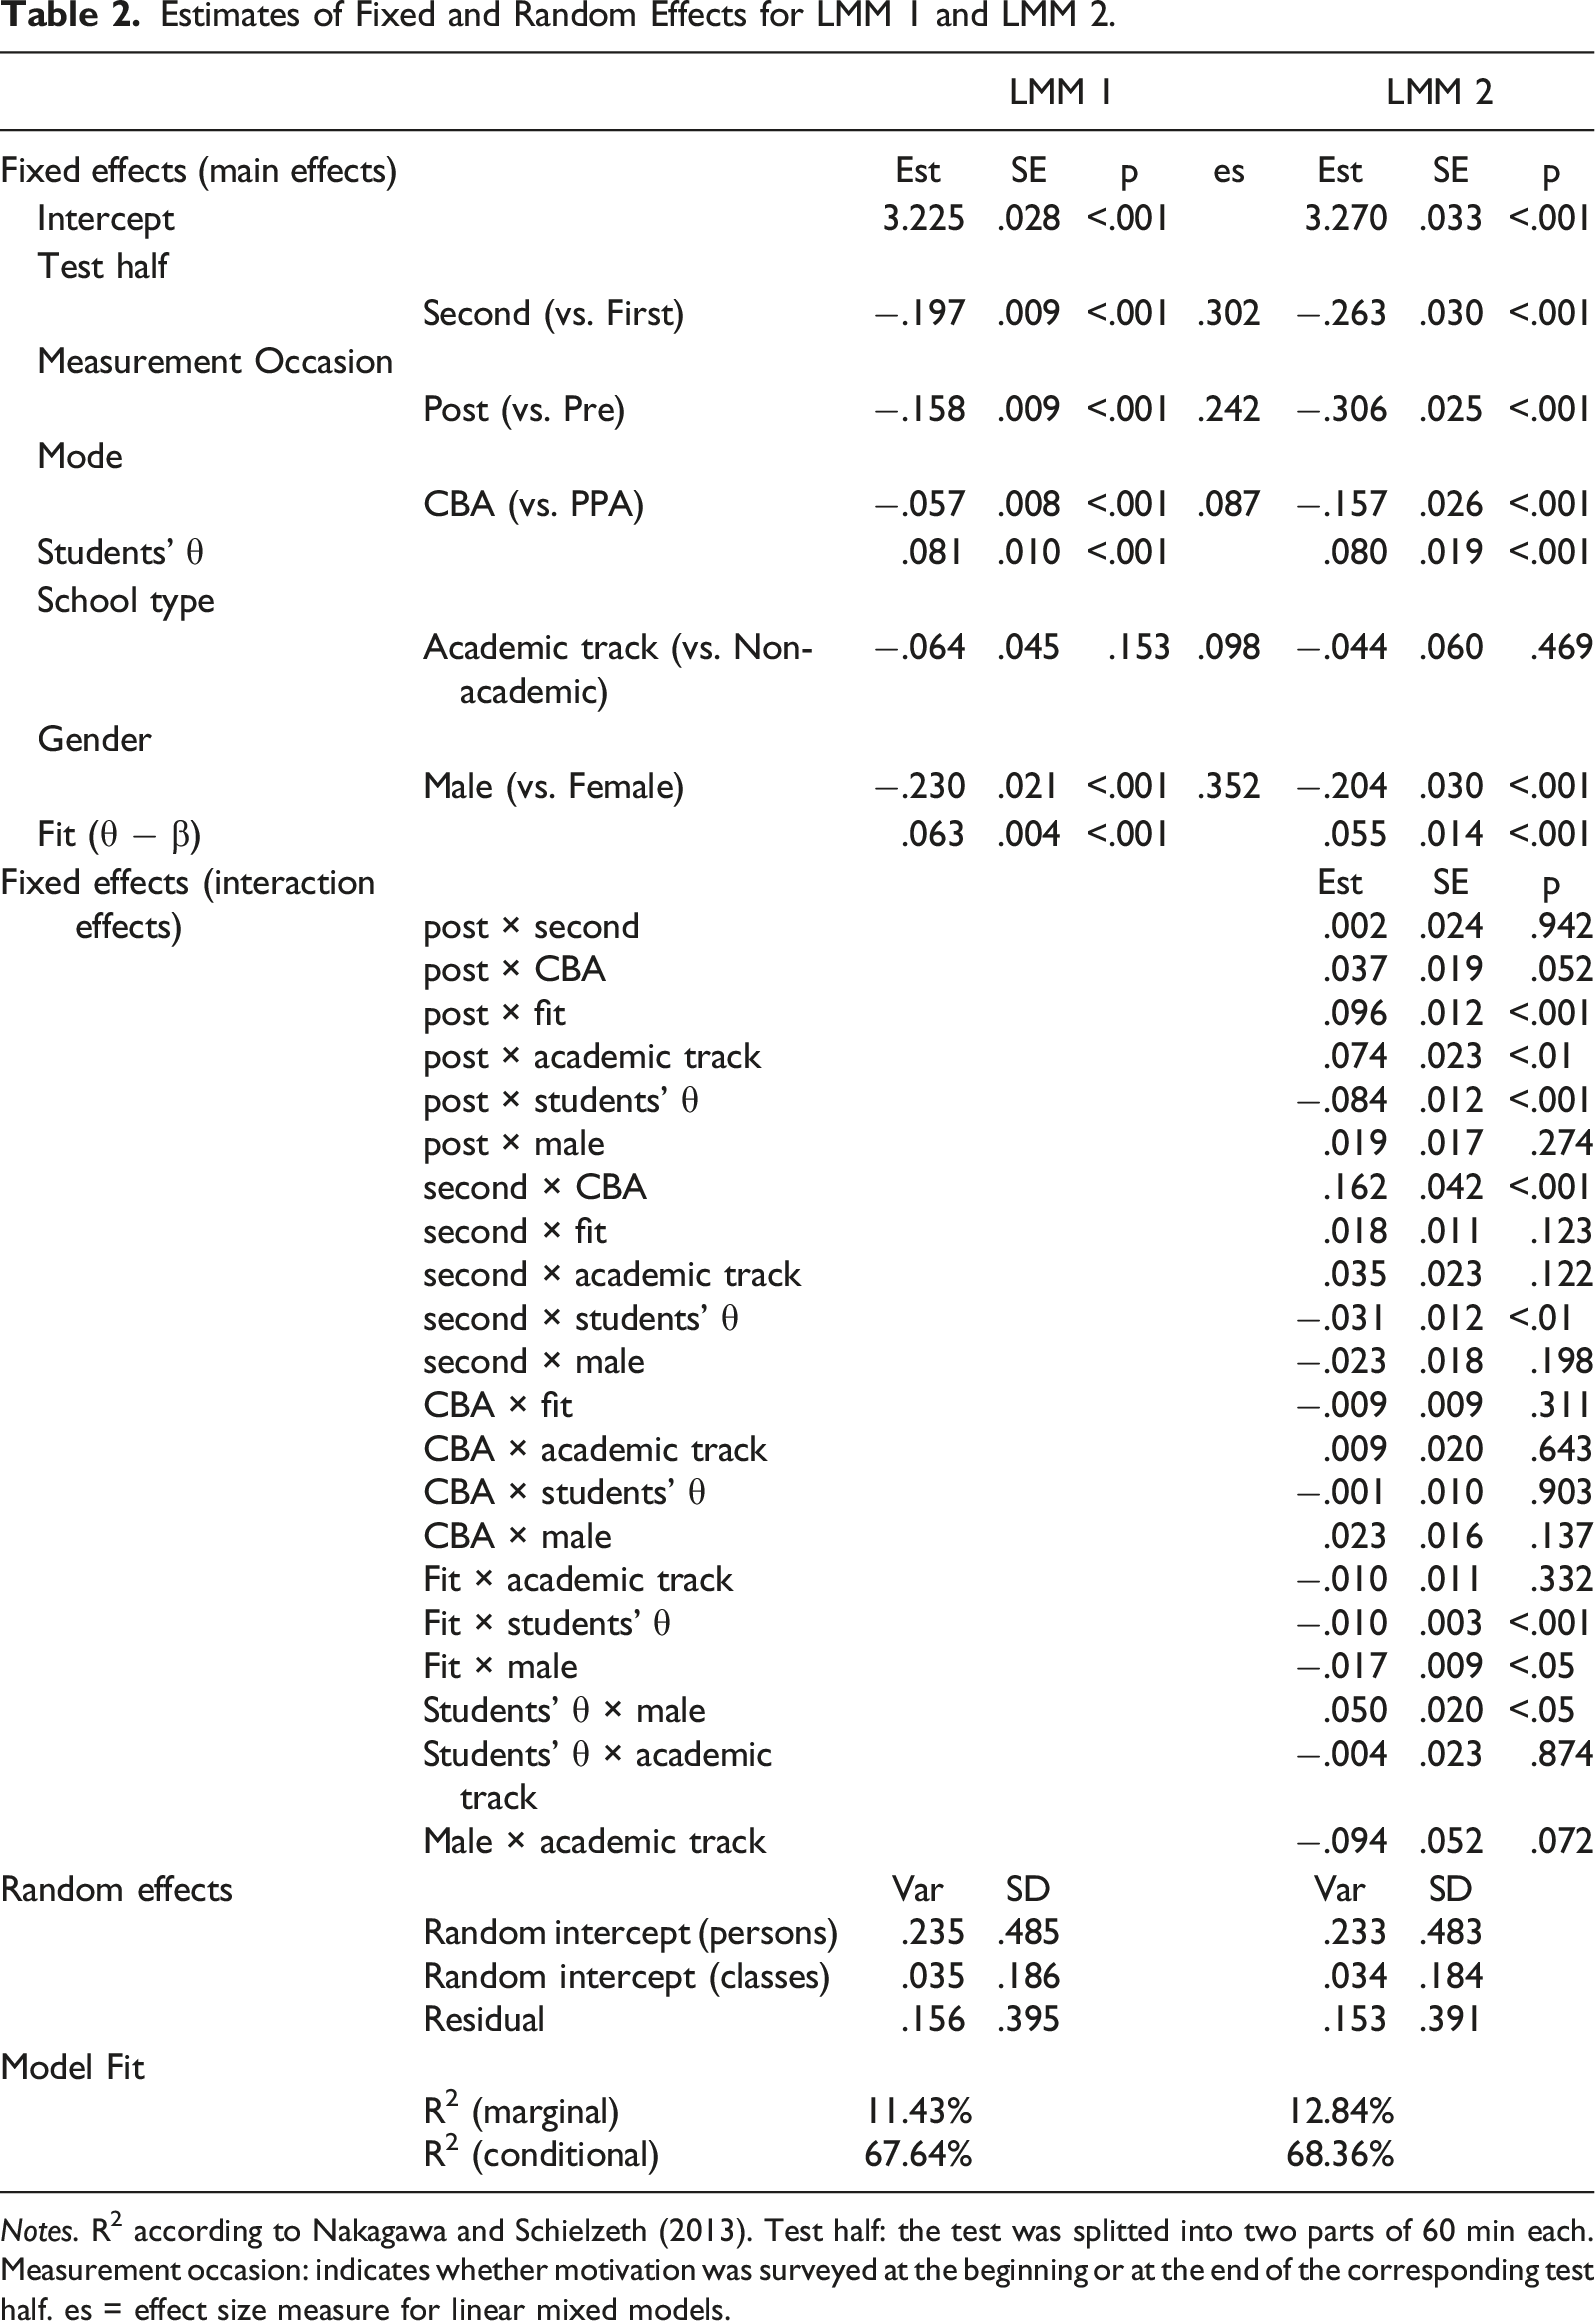
Notes. R2 according to Nakagawa and Schielzeth (2013). Test half: the test was splitted into two parts of 60 min each. Measurement occasion: indicates whether motivation was surveyed at the beginning or at the end of the corresponding test half. es = effect size measure for linear mixed models.
The first LMM shows that, overall, test-taking effort is significantly lower in the second half of the test (−.197) than in the first. Furthermore, overall, effort decreases significantly within each test half between pre-test and post-test (−.158). That is, the retrospectively self-reported (i.e., realized) effort after students had finished one test half in a given mode is overall lower than the prospectively (intended) test-taking effort students were willing to invest before starting the test in the respective test mode. Except for this, overall effort in CBA is lower (−.057) than in PPA mode, although the corresponding effect size is very small. Considering the marginal effects between individuals, higher achieving students report higher effort, and males invest less effort than females. Further, there was overall a tendency that the more a student’s θ exceeds the average item difficulty of the corresponding block, the higher a student’s effort results (.063).
The two-way interactions of the second LMM show that the difference between pre- and post-test is less pronounced if students’ θ exceed the average item difficulty of the corresponding block. However, the difference between pre- and post-test is more pronounced for high achieving students within both school tracks. In contrast, the difference between pre- and post-test is less pronounced for academic track students. The gender difference is less pronounced for high achieving students.
Concerning the first research question, the second LMM shows that the decrease of test-taking effort in PPA does not differ from the decrease of test-taking effort in CBA mode (non-significant interaction term “post × CBA”). However, there is almost no decrease in effort between the two halves of the test, when the mode changes from CBA to PPA, whereas effort decreases visibly between the two test halves when the mode changes from PPA to CBA (significant interaction term “second × CBA”).
Concerning the second research question, our results show that self-reported effort is higher when the items are easier relative to students’ abilities. This is in line with findings by Asseburg and Frey (2013).
Discussion
The current study compared self-reported effort in a large-scale assessment between paper-and-pencil and computer-based administration modes. Comparability of both administration modes is crucial if trends in students’ competencies are to be assessed over longer periods and if the administration mode changes during that time (Robitzsch et al., 2017). In addition, test scores correlate significantly with students’ test-taking effort, which generally decreases as the test progresses (Penk & Richter, 2016). Both changes in the test administration mode (PPA vs. CBA) and a decline in students’ test-taking motivation over the course of the test can introduce construct-irrelevant variance and, ultimately, compromise the validity of the test results. Against this background, we investigated whether a change in the test mode interacts with differential trajectories of test-taking motivation. Identifying factors influencing students’ test scores beyond their competencies is necessary for valid interpretation of changes in test scores.
Our results show that decreasing effort, which has repeatedly been shown in PPA tests (Penk & Richter, 2016), is also an issue in CBA tests. On average and somewhat unexpectedly, students’ self-reported effort during the CBA test is even lower than in the PPA test.
The CBA und PPA implementations of the tests were very similar in the present study: the same items with a similar presentation were used, and no additional features, which are only possible in a CBA environment (adaptive test design, multimedia features, such as videos) were implemented. In other words, there was no compelling need for a CBA implementation of the items administered in the present study.
Overall, our results do not support the assumption that computerized test settings are per se more appealing to students, which could lead them to invest a constantly higher level of effort compared to PPA tests. On the contrary, students’ effort was even lower in CBA than in PPA. While we cannot give a conclusive explanation for this result, students might have higher expectations in advance of the computer-based test that the current implementation could not fulfill. For example, typing short answers to open-ended items using the keyboard might be more exhausting and unfamiliar than writing with paper and pencil, which students are used to. Considering the wide range of possibilities for designing computer-based tests, further investigating which device (e.g., desktop, laptop, and tablet with on-screen keypad) and presentation of stimuli and related items (e.g., split screen, scrolling between, or turning pages) is most user-friendly for which age group of students while ensuring consistently high levels of effort during the test. In addition, computer-based settings offer further promising opportunities to support students’ motivation through flexibly presented design elements in the course of testing. According to the Expectancy-value theory (EVT; Eccles & Wigfield, 2002; Wigfield & Eccles, 2000), immediate feedback (after each half of the test, for example) might enhance the perceived usefulness of the test. If students’ test-taking behavior shows signs of careless responses—for example, if they skip several items in a row or answer within short response times (Lee & Jia, 2014; Pohl et al., 2019; Van der Linden, 2006), indicating rapid guessing behavior (Wise & Kuhfeld, 2021), the test system could encourage students through short appeals. Since Liu et al. (2012) showed that students tend to perform best when they see personal relevance of their test scores, further research should investigate whether emphasizing personal relevance through adaptive encouragement or rewards when students complete a part of the test could enhance their effort and engagement. In addition, analyzing non-linear item position effects can help to decide how much testing time is reasonable for students to receive reliable results and avoid overstraining. For primary school students working on an 80 minutes test which is comprised of four blocks of 20 minutes each, Weirich et al. (2014; Online Appendix) showed that students performance declined especially during the last block, indicating that a test of 60 minutes (i.e., three blocks) would be more reasonable for primary school students. With 120 minutes of testing time, the current study placed high demands on students’ persistence.
In line with Asseburg and Frey (2013), the current study found that students’ effort is higher if the items are rather easier relative to students’ competencies. Moreover, the shrinkage in effort between pre- and post-test is lower when the test is less challenging. Adaptive tests intend to optimize the statistical efficiency of the test (i.e., maximizing the test information function) by choosing the next item (or next stage with multiple items) according to the provisional score of the examinee (Luecht & Nungester, 1998). However, this strategy engendered that θ–β≈0 and therefore probably will not evoke optimal effort in examinees. Hence, designing (adaptive) educational tests should consider that an optimal solution according to efficiency may contradict an optimal solution according to motivation. Thus, a balanced tradeoff between both seems beneficial. Asseburg and Frey (2013) recommend that the expected mean probability of a correct answer across all items for one student should be placed around 70%. This is in line with our results. In order to achieve a high level of effort, students should be presented with items whose mean difficulty is clearly exceeded by their ability resulting in correct answer probabilities of 70% and above.
Limitations
When interpreting the results, the following limitations should be taken into account. First, we used self-report measures of students’ test-taking effort. While several studies support the validity of self-reported measures (Eklöf & Nyroos, 2013; Wise et al., 2006), they have been criticized for ambiguity. Wise and DeMars (2006) state that “examinees who believe they did not do well on the achievement test might underreport their effort” (p. 20) to provide an alternative justification for anticipated poor results. Additionally, LaFave et al. (2022) discussed ambiguity problems arising from the fact that students who feel competent in a specific subject area may have inherently higher levels of motivation. Their higher performance, in turn, is due to their higher abilities, where “motivation [is just] a natural byproduct of having higher abilities” (p. 19). Instead, Ulitzsch et al., (2021) suggest a model-based approach to simultaneously measure test speed, test accuracy, and engagement which uses response times. Such an approach was not feasible in the current study, as response times are not available on item level in PPA tests. Additionally, even the model-based approach suffers from ambiguity problems which may result in lower than expected agreement between different indicators of non-effortful test-taking behavior.
For the same reason, we could not use alternative (approximative) measures of effort, such as response time effort (RTE; Wise & Kong, 2005), a non-intrusive method to evaluate students’ test-taking effort. Reaction times measured at the response level can be used to identify rapid guessing behavior, which can also be used as an indicator of low motivation. RTE or (in a broader sense) response time behavior has been used, among other things, for motivation filtering (Swerdzewski et al., 2011), latent modeling of disengagement (Goldhammer et al., 2017), and separating two consequences of low motivation: guessing and omissions (Ulitzsch et al., 2019).
Second, we compared test-taking effort between an otherwise identical PPA and CBA implementation of an English language test. It is, however, plausible that students’ effort varies between devices (Rutkowski et al., 2022) or various implementations of a CBA test. Moreover, further development of devices (tablets, laptops, etc.) may improve their usability which should affect students’ motivation. Considering the high workload large-scale assessments demand from students without rewarding them, assessments should be designed to engage students’ interest and ensure a continuous high level of motivation. In order to achieve this, the targeted probability of success could be increased.
Supplemental Material
Supplemental Material - Comparing Test-Taking Effort Between Paper-Based and Computer-Based Tests
Supplemental Material for Comparing Test-Taking Effort Between Paper-Based and Computer-Based Tests by Sebastian Weirich, Karoline Sachse, Sofie Henschel, and Carola Schnitzler in Applied Psychological Measurement.
Footnotes
Acknowledgments
The authors would like to thank two anonymous reviewers and the editor for their thorough and constructive comments in improving the manuscript.
Declaration of Conflicting Interests
The author(s) declared no potential conflicts of interest with respect to the research, authorship, and/or publication of this article.
Funding
The author(s) received no financial support for the research, authorship, and/or publication of this article.
Supplemental Material
Supplemental material for this article is available online.
References
Supplementary Material
Please find the following supplemental material available below.
For Open Access articles published under a Creative Commons License, all supplemental material carries the same license as the article it is associated with.
For non-Open Access articles published, all supplemental material carries a non-exclusive license, and permission requests for re-use of supplemental material or any part of supplemental material shall be sent directly to the copyright owner as specified in the copyright notice associated with the article.