
Abstract
Diagnostic classification models (DCMs) have been used to classify examinees into groups based on their possession status of a set of latent traits. In addition to traditional item-based scoring approaches, examinees may be scored based on their completion of a series of small and similar tasks. Those scores are usually considered as count variables. To model count scores, this study proposes a new class of DCMs that uses the negative binomial distribution at its core. We explained the proposed model framework and demonstrated its use through an operational example. Simulation studies were conducted to evaluate the performance of the proposed model and compare it with the Poisson-based DCM.
In operational tests, examinees may be scored based on their completion of a series of small and similar tasks. For example, students are asked to read out loud 50 words; children are asked to memorize the sequence of 10 animals; patients are asked to select from a list of 20 symptoms. If the purpose of those tests were to classify examinees as master/non-masters of a group of abilities or bearer/non-bearer of a group of disorders, diagnostic classification models (DCMs) could be candidate scoring models. When responses on those types of tasks are scored, they are usually treated as count variables. For the 50 words that students read out loud, we typically do not treat them as 50 items because they are quite similar. They were typically given to students, for example, in five blocks of 10 words each. When students’ responses are scored, we count how many words in each block they answer correctly. For this example, each student would get five counts, one for each block. Those five counts are used to estimate their latent trait characteristics. If DCMs were applied to score count data, one could use the Poisson-based DCM (PDCM; Liu et al., 2021) that has recently been proposed. A feature of the PDCM, or any statistical model that uses a Poisson distribution, is that the mean and variance have been fixed to be equal. This constraint may be unnecessary and sometimes unrealistic given that the variance is often greater than the mean. To relax this constraint, this study proposes a more flexible DCM framework for scoring count data that comes from a series of small, and sometimes repetitive tasks. The proposed framework uses the negative binomial distribution at its core, which allows the mean and variance of the count variable to be separately estimated. In the next section, we first introduce the necessary theoretical foundations before presenting our proposed modeling framework.
Theoretical Framework
Diagnostic Classification Models
Diagnostic classification models are multidimensional confirmatory latent class models. They could be appropriate scoring models when a researcher’s primary goal is to classify examinees into pre-defined groups (aka latent classes). To form those groups, one needs to first hypothesize at least two latent traits (commonly known as attributes), and treat them as categorical variables, which can be either binary (0 or 1, representing non-possession and possession of attributes) or polytomous (e.g., 0, 1, 2, representing non-possession, partial possession, and full possession of attributes). For K attributes, the combination of attribute possession groups forms
Although many DCMs have been proposed with different parameterizations of the measurement component and/or the structural component, we can use a general form of DCM as an example to introduce the specification of a DCM. When item responses are scored in a binary fashion, the general form of DCMs is the log-linear cognitive diagnosis model (LCDM; Henson et al., 2009). Let

Poisson Distribution and the PDCM Framework
The Poisson distribution is commonly used to analyze count variables. It expresses the probability that the number of events

The framework of PDCMs uses the Poisson distribution at their core, which expresses the probability of examinees with a given latent class obtaining a count score of s on item i as

Negative Binomial Distribution and Its Use in Item Response Theory Models
When we use Poisson-based models to analyze count variables, the data must conform to equidispersion where the mean and variance are equal because there is only one parameter

In the item response theory (IRT) framework, the negative binomial distribution has also been applied in studies such as Hung (2012), and Magnus and Thissen (2017). Following the parameterization used in Equation (3), the one-parameter form of a negative binomial IRT model can be written as

A Framework of Count Diagnostic Classification Models
The framework of Count Diagnostic Classification Models (CDCMs) is developed based on 1) applying the negative binomial distribution to the general form of DCMs in a similar fashion to how it is applied to IRT models; and 2) the relationship between the general form of DCMs and its special cases.
Like the PDCM framework, we extract the core of the LCDM:
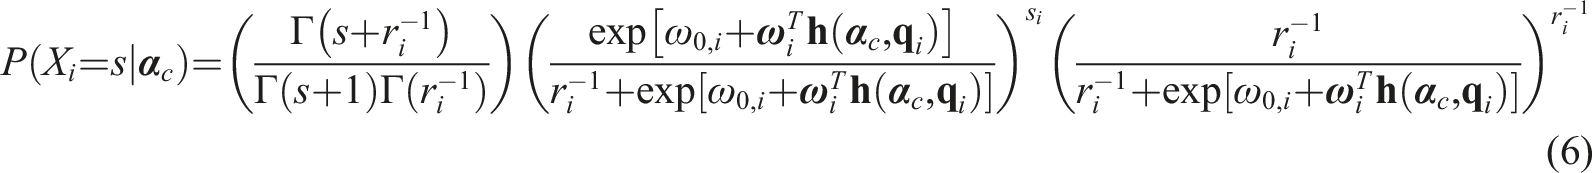
Comparing equation (6) to equation (5), we can see that the negative binomial distribution is applied to the DCMs in a similar fashion to that in IRT models where we replaced
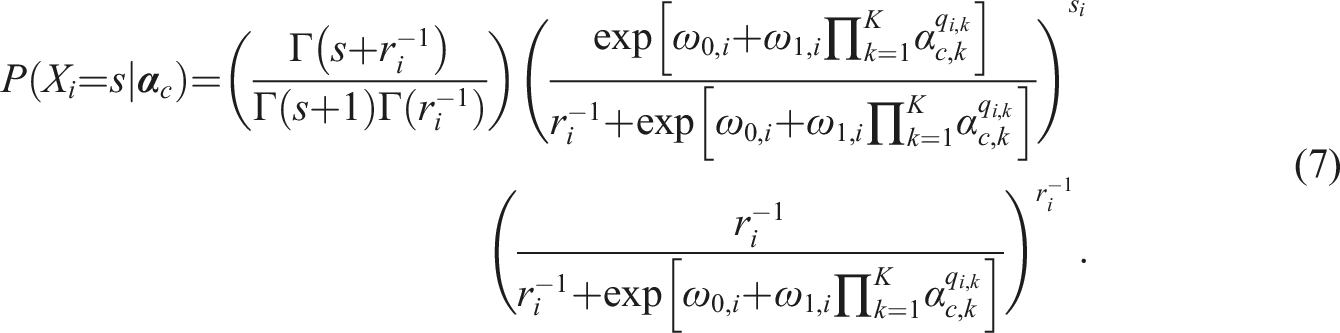
After deriving the general form of the CDCM framework from the LCDM, we can re-parameterize the
Similarly, if we replace the
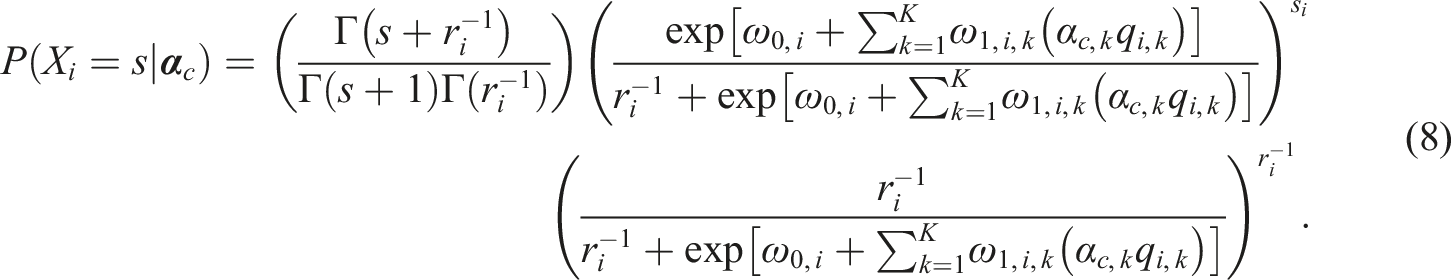
Through these two examples, we hope readers can see how other DCMs may also be formulated within the CDCM framework to analyze count data.
Operational Study
We aim to achieve two purposes through conducting this operational study. The first is to demonstrate the use of the CDCM, and the second is to compare its performance with the PDCM. The dataset was used in Liu et al. (2021) which contains 808 examinees’ responses to 24 item blocks that measure three attributes. Item blocks 1–8 measure number recognition, item blocks 9–16 measure color recognition, and item blocks 17–24 measure object recognition. As a result, a simple-structure Q-matrix was developed based on the content specification. In the Q-matrix, each item measures one attribute. In each item block, there are 10 numbers, colors, or objects, meaning that the maximum count score in each block (aka item) is 10. A preliminary review of the dataset shows that most examinees got most of the items correct. Therefore, we chose to model the incorrect count in each item. If other researchers choose to do this in their studies, they want to make sure that the interpretation of the attribute possession status
Fitting the CDCM
We used the Stan (Carpenter et al., 2017) program for parameter estimation. The Stan code used to estimate the CDCM is shared in the Supplemental Appendix. In the measurement model, we estimated 24 intercepts
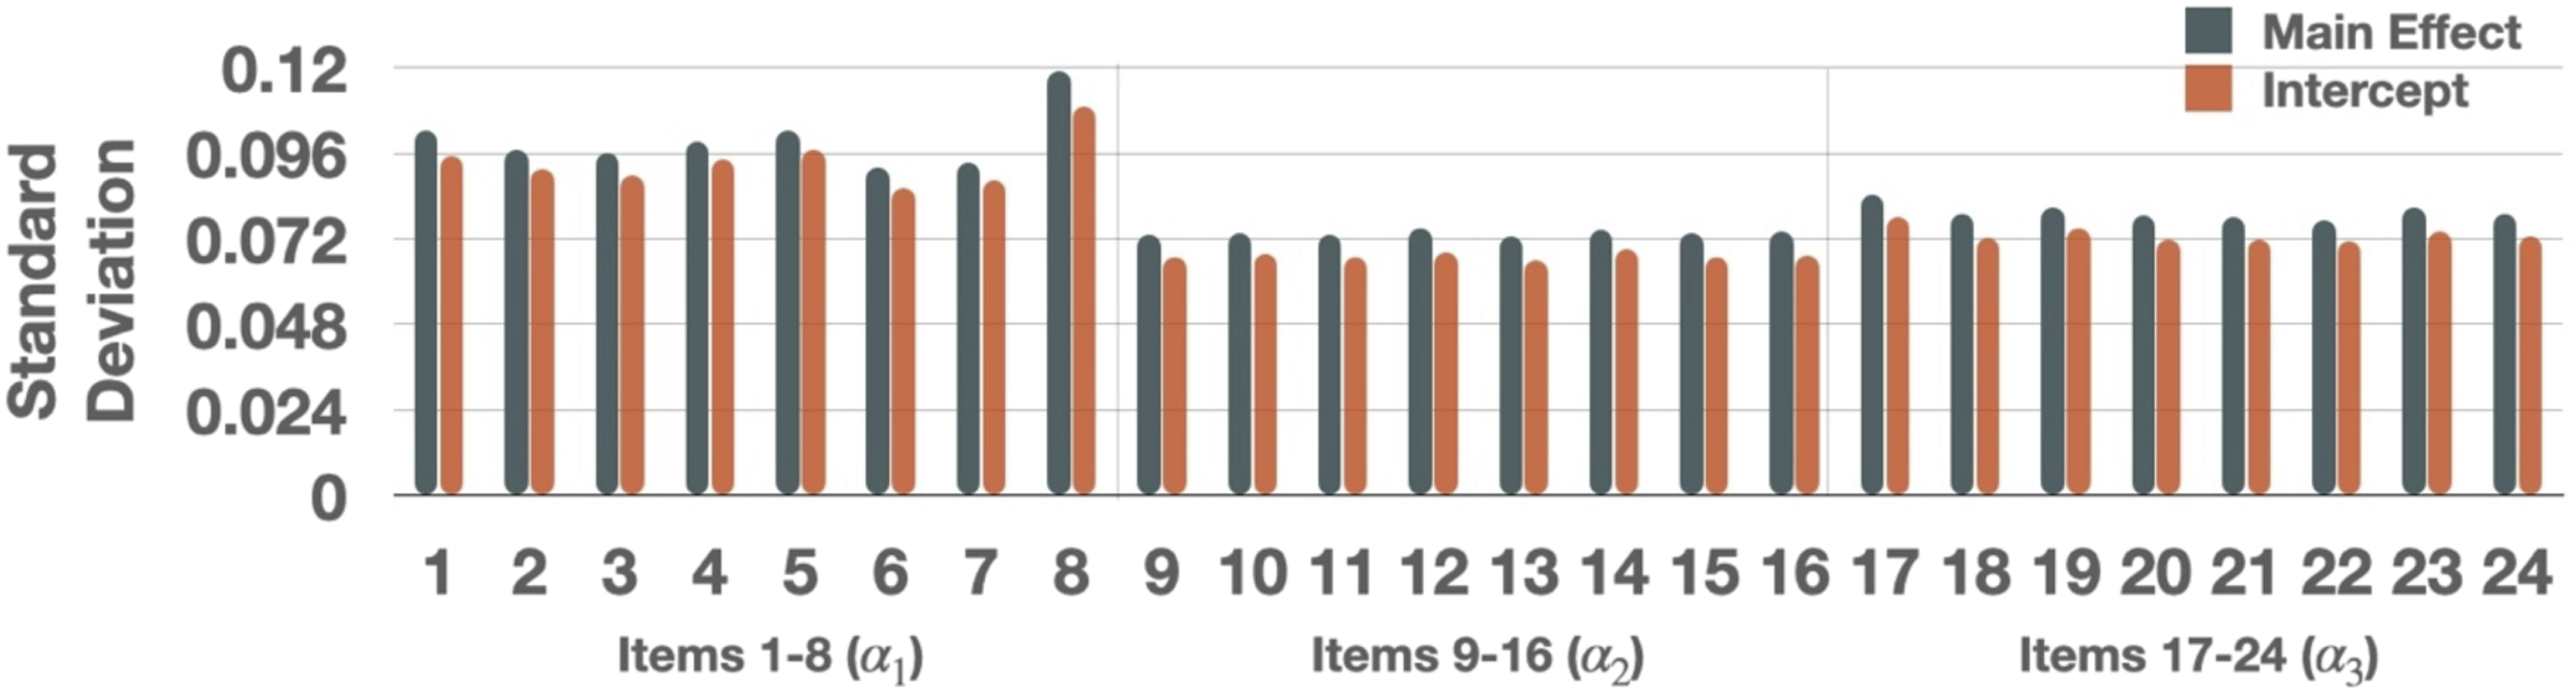
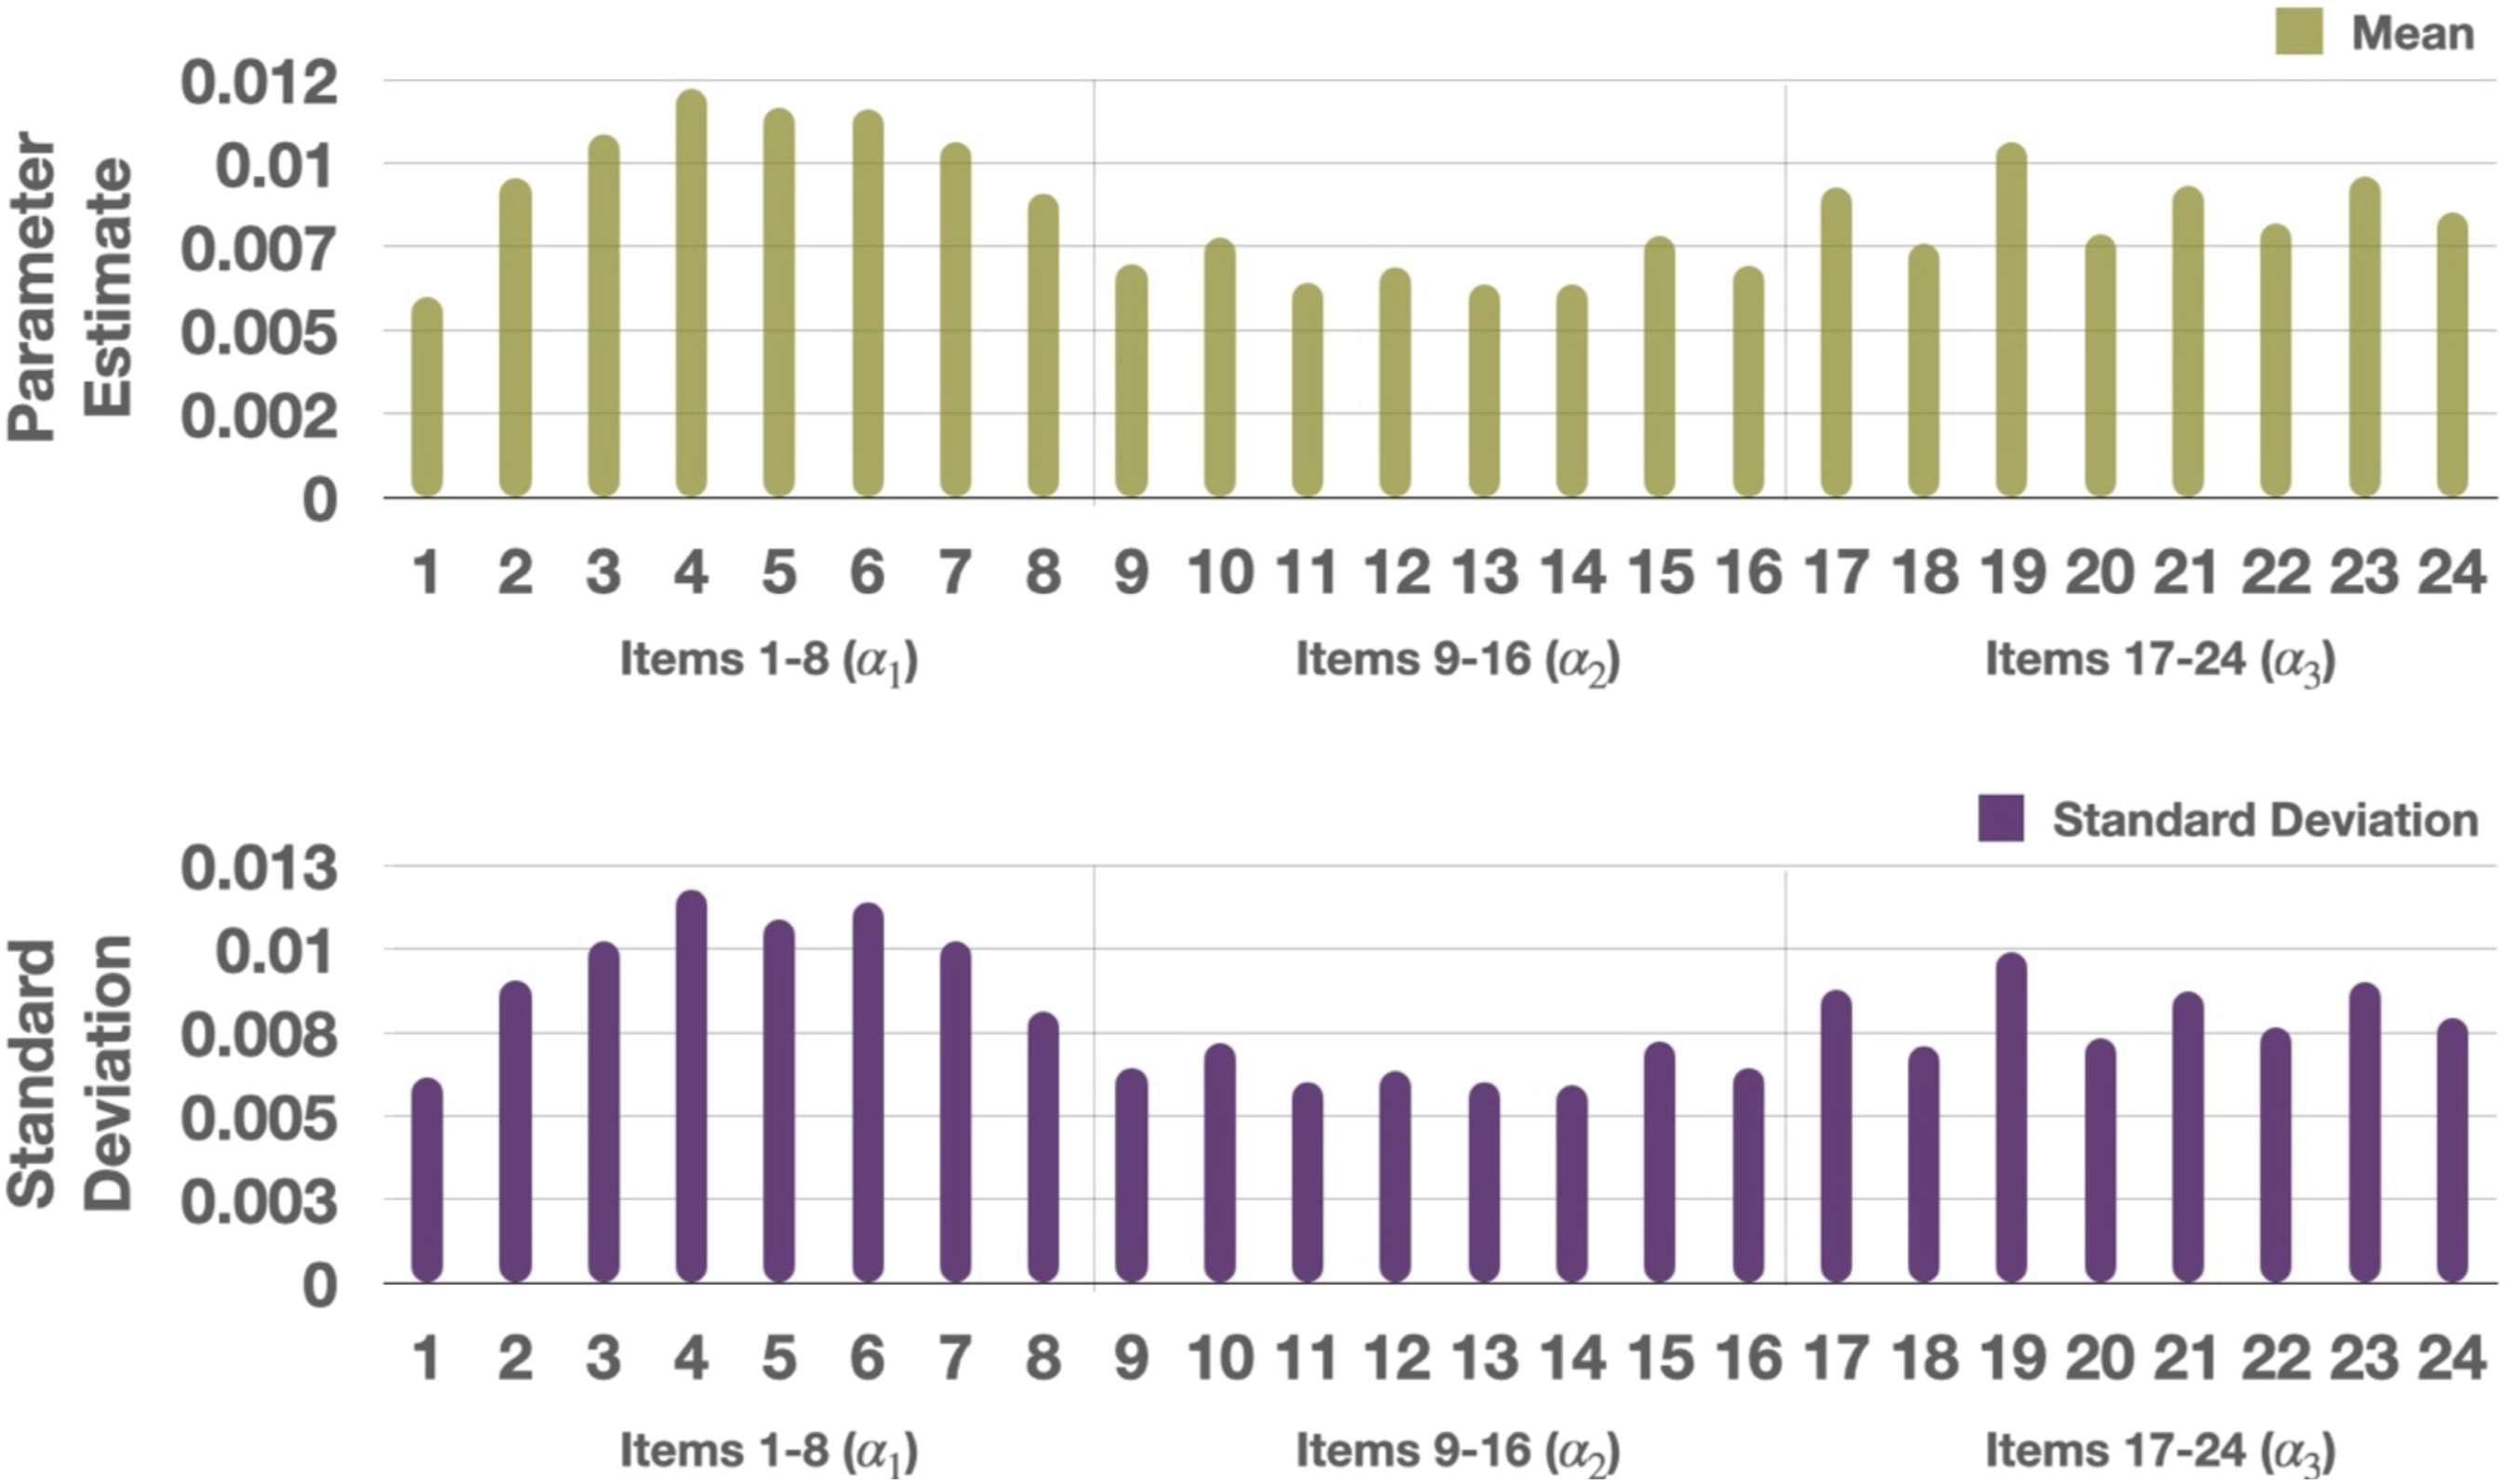
Mean of the posterior distribution for each parameter was used as a point estimate and displayed in Figure 1. All the intercepts were below 0 and all the main effects were (constrained to be) above 0. Typically, we say that an item is good when it has high discrimination where small intercepts and large main effects help differentiate between those who possess and not possess an attribute. The parameter estimates show that items in this dataset are of good quality. Items 1–8 (measuring Mean of the posterior distribution for the intercept Standard Deviation of the posterior distribution for the intercept Mean and standard deviation of the posterior distribution for the inverse of the dispersion parameter 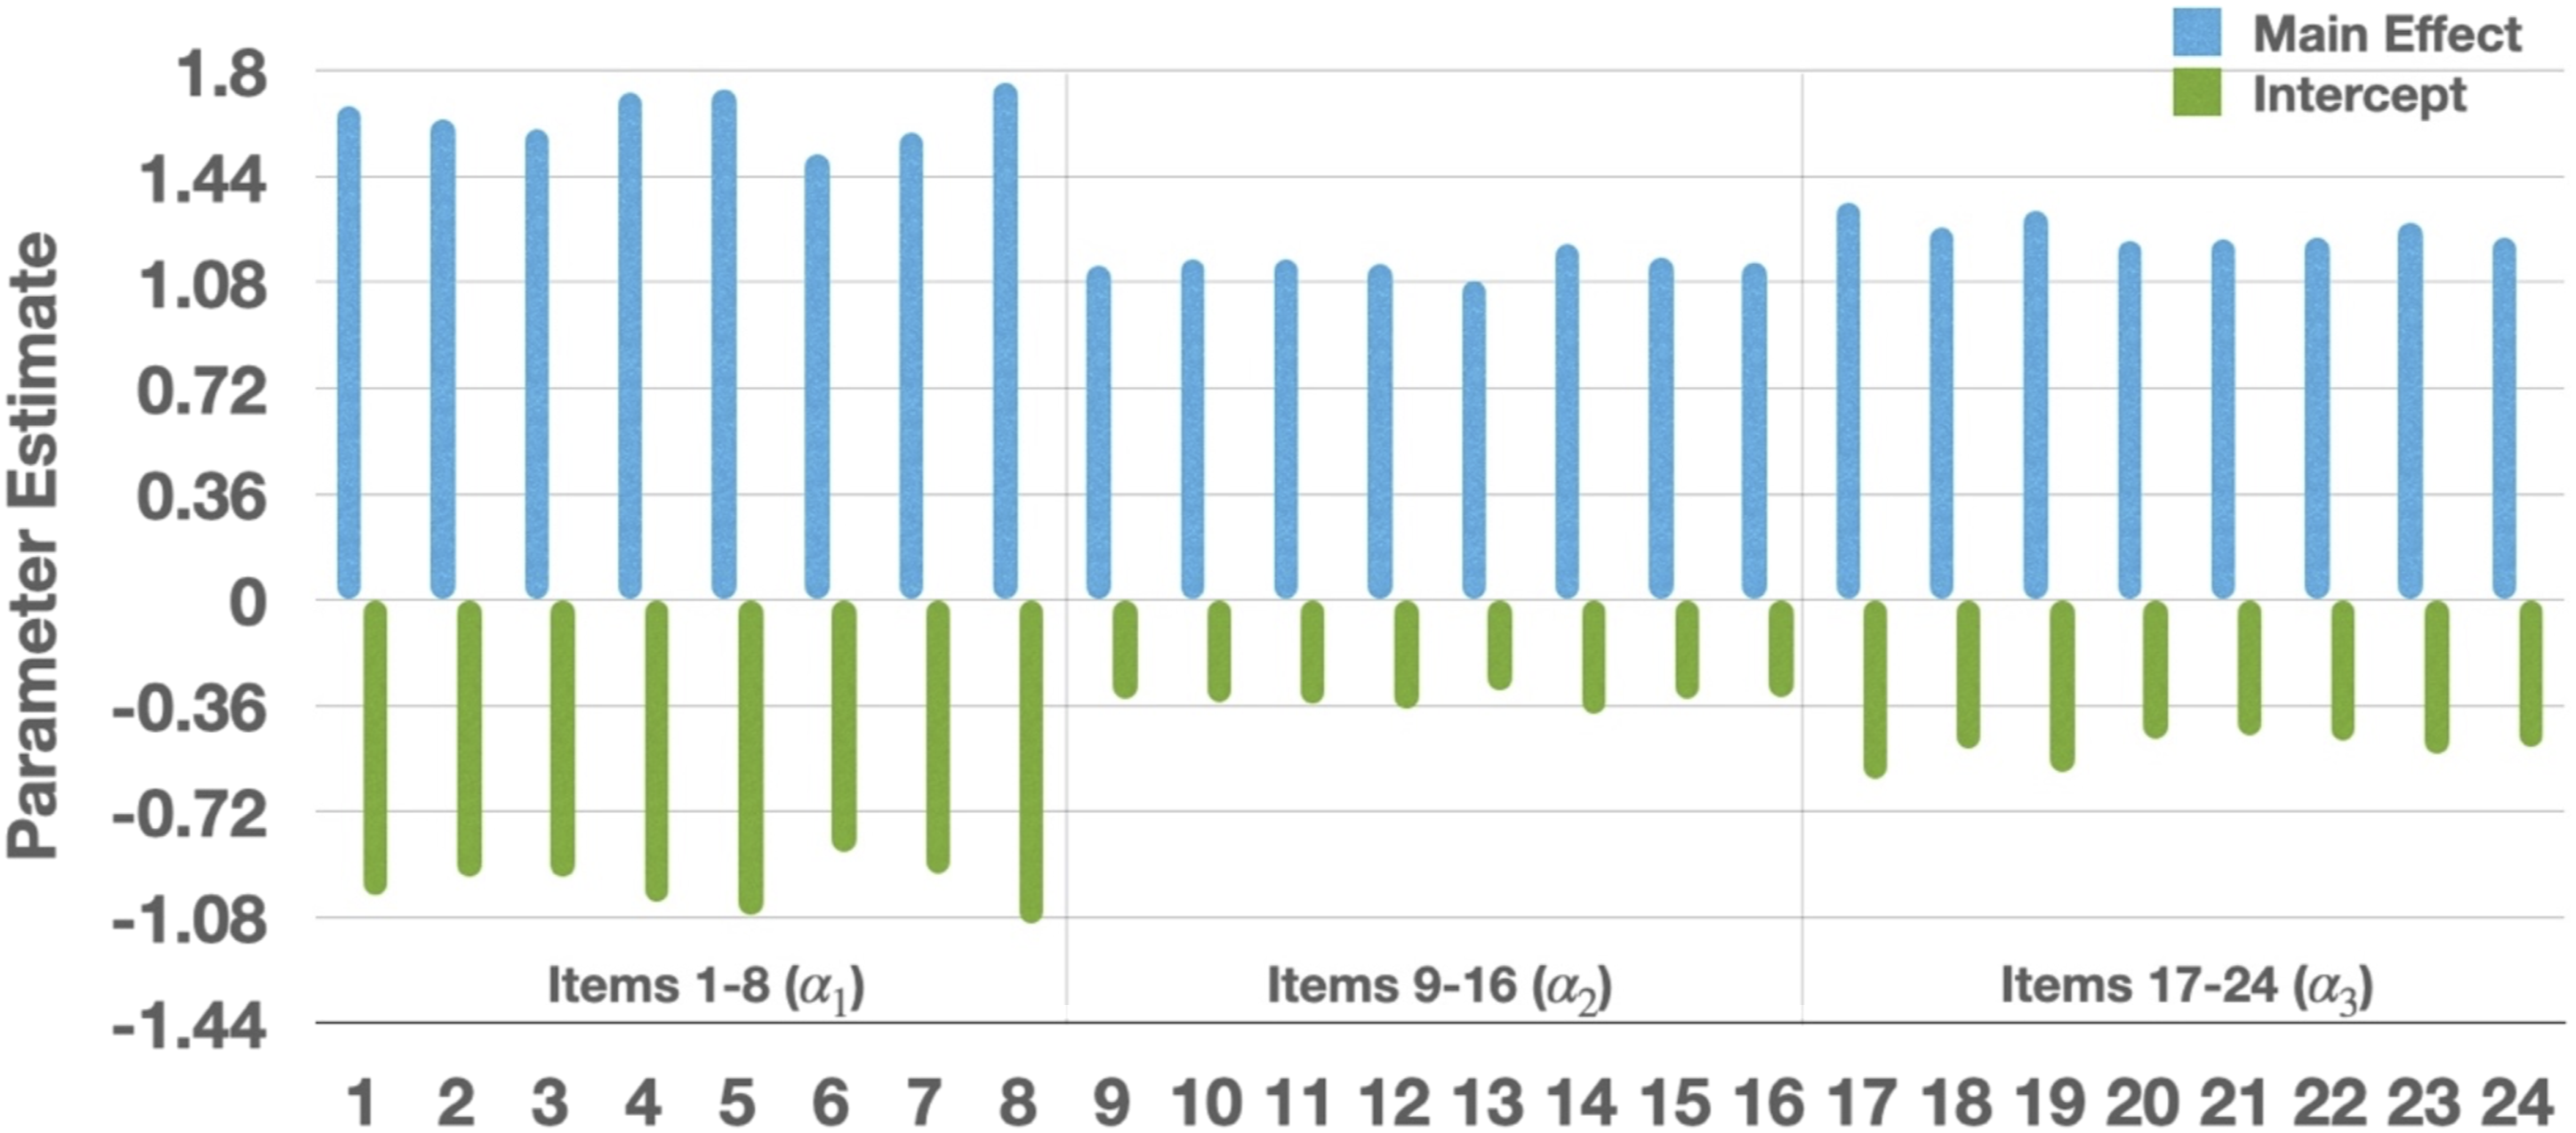
Comparing the Results Between the CDCM and the PDCM
If the difference between the variance and the mean was small enough under the CDCM, we could also fit the PDCM to the dataset and examine the differences. Therefore, we also fit the PDCM to the dataset, using the same Stan specifications. Although parameter estimates are not directly comparable, we compared model fit and classification agreement between the CDCM and the PDCM. Regarding relative model fit, we computed the leave-one-out cross-validation information criterion (LOOIC; Vehtari et al., 2017), where smaller values indicate better fit. The LOOIC values for the CDCM and the PDCM were 72.3 and 72.5, respectively. Using the standard errors of the difference in their expected predictive accuracy estimates, we found that the two models did not fit significantly differently. Consider that the PDCM is more restrictive than the CDCM, the results suggest that the item-level variance of examinees’ responses was not much different from the mean. This lack-of-difference is supported by the small
But what if there were relatively larger differences between the mean and the variance (i.e., larger
Simulation Study
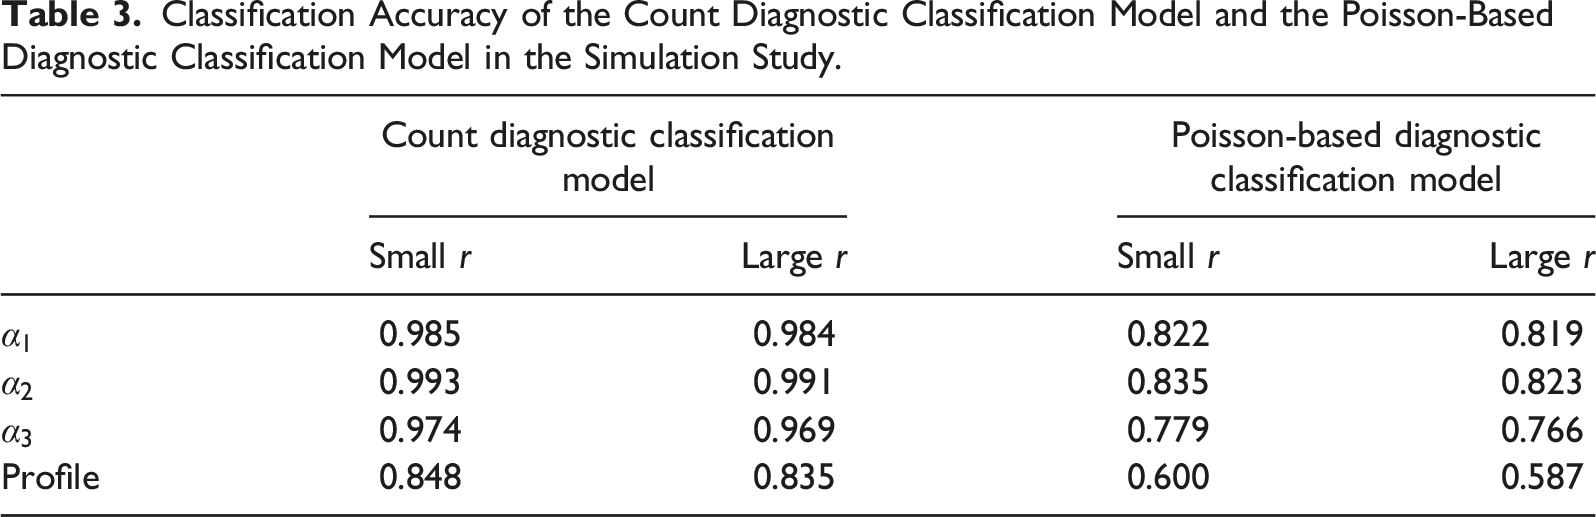
The above operational study demonstrated similar performance of the PDCM and the CDCM when the data dispersion is small with
Data Generation
To simulate 808 examinees’ responses to 24 item blocks, we used the mean of each parameter’s posterior distribution that we obtained through the CDCM in the simulation study as the true parameter values. We varied the dispersion parameter at two levels: small and large. For small dispersion conditions, we sampled
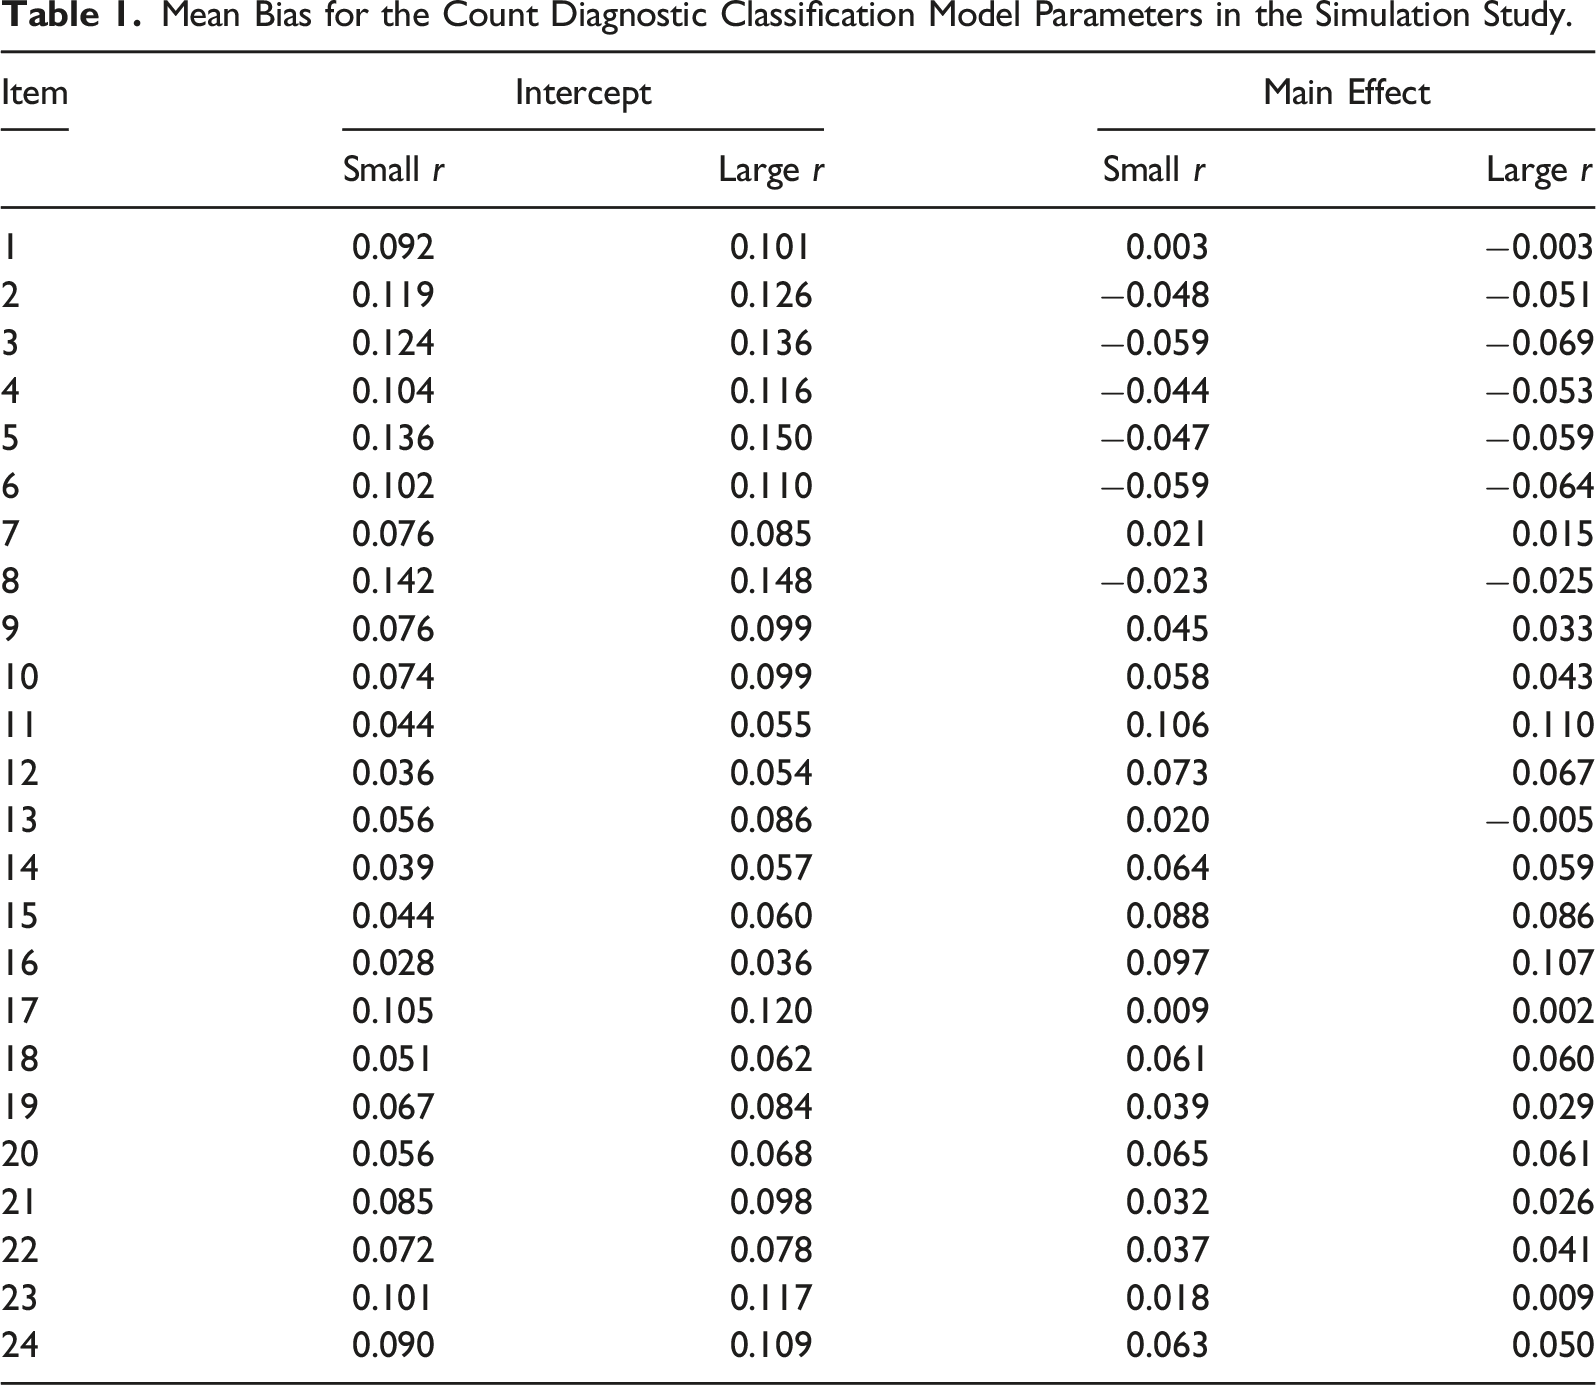
Results 1: Parameter Recovery of the CDCM
Mean Bias for the Count Diagnostic Classification Model Parameters in the Simulation Study.
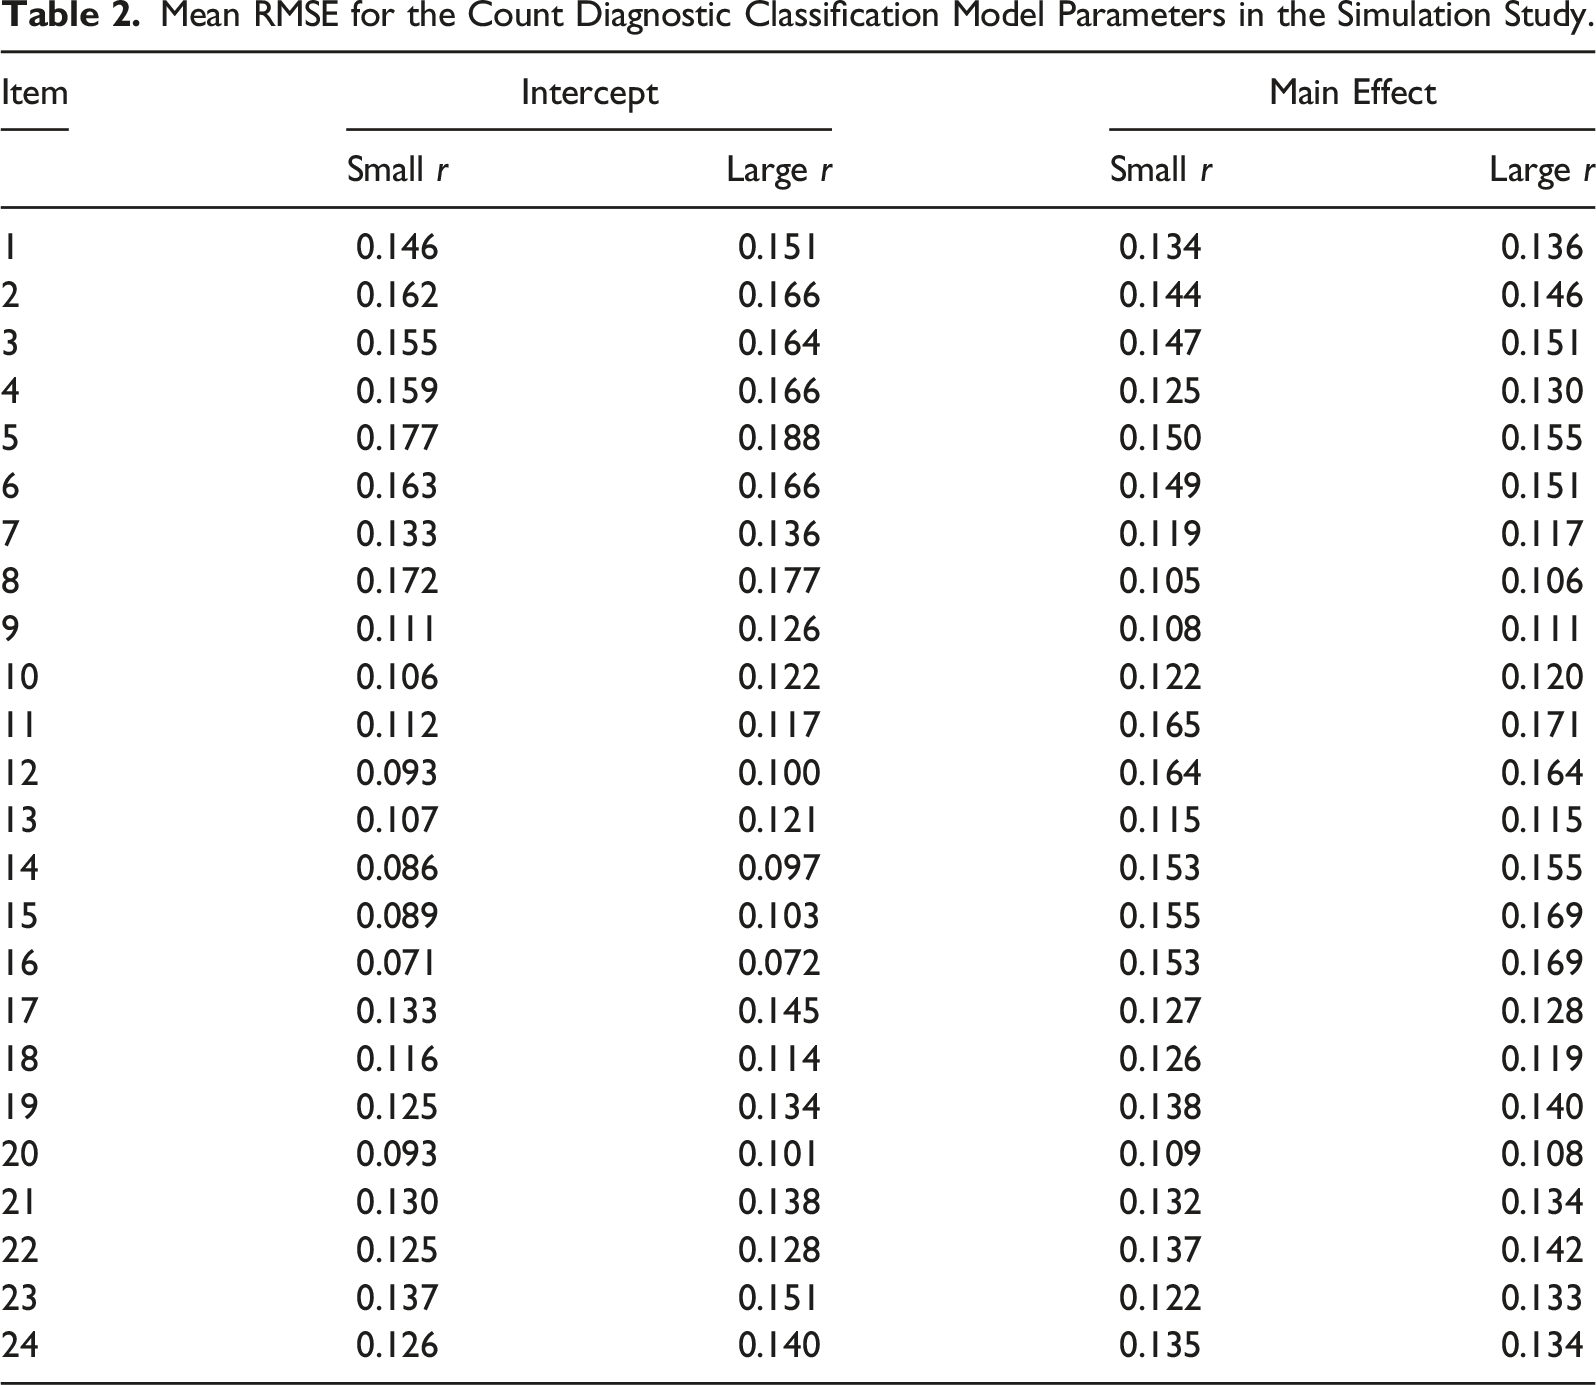
Mean RMSE for the Count Diagnostic Classification Model Parameters in the Simulation Study.
Results 2: Comparing the CDCM to the PDCM
Classification Accuracy of the Count Diagnostic Classification Model and the Poisson-Based Diagnostic Classification Model in the Simulation Study.
Discussion
Although measurement models with the negative binomial distribution involved are less commonly seen than those with the Poisson distribution, they are more flexible and may provide more accurate parameter estimates if mean and variance are not equal.
The proposed CDCM framework may be used when: 1) multiple attributes are being tested through a series of similar tasks, and 2) the purpose of the test is to classify examinees as mastery/non-mastery or possession/non-possession of those attributes.
In that situation, we first recommend computing the mean and variance of the responses on each item block. This could be an easy first step to get a sense of what we could expect for the mean-variance differences. Then we recommend fitting both the PDCM and the CDCM to the dataset and comparing model fit and classification agreement. If one obtains small
Although the CDCM seems more complicated than the PDCM, the number of parameters being estimated is about the same between the two models. As demonstrated in the model formulation, the number of CDCM parameters equals the number of PDCM parameters plus the number of item blocks (one r for each item block). If there were 10 item blocks, the CDCM has 10 more parameters. In many situations, examinees’ responses to each item block that measure the same attribute are very similar, we could also consider fixing the
For future research, the following directions may be considered. First, one could investigate the effects of different prior distributions for
Supplemental Material
Supplemental material - Applying Negative Binomial Distribution in Diagnostic Classification Models for Analyzing Count Data
Supplemental material for Applying Negative Binomial Distribution in Diagnostic Classification Models for Analyzing Count Data by Ren Liu, Ihnwhi Heo, Haiyan Liu, Dexin Shi, and Zhehan Jiang in Applied Psychological.
Footnotes
Declaration of conflicting interests
The author(s) declared no potential conflicts of interest with respect to the research, authorship, and/or publication of this article.
Funding
The author(s) received no financial support for the research, authorship, and/or publication of this article.
Supplemental Material
Supplemental material for this article is available online.
References
Supplementary Material
Please find the following supplemental material available below.
For Open Access articles published under a Creative Commons License, all supplemental material carries the same license as the article it is associated with.
For non-Open Access articles published, all supplemental material carries a non-exclusive license, and permission requests for re-use of supplemental material or any part of supplemental material shall be sent directly to the copyright owner as specified in the copyright notice associated with the article.