
Abstract
In analyzing responses and response times to personality questionnaire items, models have been proposed which include the so-called “inverted-U effect.” These models predict that response times to personality test items decrease as the latent trait value of a given person gets closer to the attractiveness of an item. Initial studies into these models have focused on dichotomous personality items, and more recently, models for Likert-type scale items have been proposed. In all these models, it is assumed that the inverted-U effect is symmetrical around 0, while, as will be explained in this article, there are substantive and statistical reasons to study this assumption. Therefore, in this article, a general inverted-U model is proposed which accommodates two sources of asymmetry between the response times and the attractiveness of the items. The viability of this model is demonstrated in a simulation study, and the model is applied to the responses and response times of the Temperament and Character Inventory–Revised, covering a broad range of personality dimensions.
Personality assessment is commonly conducted using self-report questionnaires in which subjects have to indicate to what extend a number of statements (items) describe their personality. To make inferences about personality, properties of the item statement are separated from the properties of the person. Next, the person and item properties can be quantified on the same underlying personality trait dimension (e.g., Kuncel, 1977). Kuiper (1981) demonstrated that the discrepancy between the person and the item is related to the time needed by the subject to answer the item. Specifically, it was shown that response times decrease for an increasing distance between the item and person position on the underlying trait dimension. Kuiper referred to this distance–time relation as the inverted-U effect. To investigate the inverted-U effect in dichotomous personality items, researchers relied on Item Response Theory (IRT) models (e.g., Ferrando, 2006) to infer the person positions on the trait (i.e., the latent trait parameter) and the item positions on the trait (i.e., the item attractiveness parameter). Next, the absolute difference between the latent trait and the item attractiveness was used in a separate, more traditional statistical analysis to test whether the hypothesized inverted-U effect holds. For instance, Ferrando (2006) correlated the item-person distances to the response times of a neuroticism and an extraversion scale and found all correlations to be negative which supports the inverted-U effect.
In approaches like these, individual differences in overall speed are not accounted for as the response times lack a general measurement model. Therefore, Ferrando and Lorenzo-Seva (2007a) proposed a multistep modeling approach to test the inverted-U effect using measurement models for both the response times and the (dichotomous) responses. In Ferrando and Lorenzo-Seva (2007b), a similar approach was presented for Likert-type scale personality items by treating the ordinal responses as approximately continuous. Using these IRT approaches, support for the inverted-U effect was found for both a dichotomous and a Likert-type scale questionnaire measuring neuroticism and extraversion.
The inverted-U approaches above are multistep procedures that first estimate the IRT parameters from the responses and then use these in subsequent modeling of the response times. Ranger (2013) and Molenaar et al. (2015) proposed single-step modeling approaches to test the inverted-U effect where, in the case of Likert-type data, the ordinal nature of the responses is explicitly taken into account. Both Ranger (2013) and Molenaar et al. (2015) applied the models to neuroticism and extraversion data and found support for the inverted-U effect.
Models for the inverted-U effect can be related to unfolding models (Coombs, 1964). Unfolding models are suitable for dichotomous or polytomous disagree-agree items in which the response process is proximity based (Roberts et al., 1999). That is, subjects are assumed to evaluate how closely a given statement matches their own opinion. Proximity-based items provide information on the absolute distance between the person and the item, but not on the direction of this distance. That is, if the distance between person and item is small, the probability of an “agree”-response is large, while if the distance is large (i.e., either the person is located above or below the item location), the probability of an “agree”-response is small. Earlier work has focused on the hyperbolic cosine model for dichotomous items (Andrich & Luo, 1993), but later, a generalized modeling framework was developed for polytomous items (Roberts et al., 2000).
Unfolding models and the inverted-U models considered here have in common that, from the observed data of a given item, the location of the person with respect to the location of the item can only be inferred if the response is (strongly) agree, or if the response time is small. That is, in an unfolding model, if the response is (strongly) agree, the person location is close to the item location. Similarly, in an inverted-U model, if the response time is large, the person location is close to the item location. However, if the response is (strongly) disagree (in an unfolding model) or the response time is small (in an inverted-U model), it can only be concluded that the person location is off the item location, but it cannot be concluded whether the person location is above or below the item location. As a result, the expected response function in the unfolding model, and the expected response time function in the inverted-U model are both symmetric and single peaked. Therefore, the inverted-U model is in essence an unfolding model for continuous items. 1
Symmetry of the Inverted-U Effect
Although the inverted-U effect seems to be well established (at least for extraversion and neuroticism), in all approaches above it is assumed that the inverted-U effect is symmetrical. This assumption implies that (a) the response times decrease with the same rate to the left and right of the inflection point of the distance–time relation; and (b) the inflection point of the distance–time relation is located at 0. In the literature, this assumption has not been explicitly discussed or studied before. However, this assumption deserves attention for both substantive and statistical reasons as is argued below.
Substantive Perspective
There are a number of theories in which the question of asymmetry is interesting for our understanding of the processes underlying personality measurement. Below are some examples.
Bipolar traits
Fekken and Holden (1992) discuss how personality traits are most often bipolar with the one end of the dimension representing the opposite of the other end of the dimension (e.g., dependent—independent). Subjects can have two separate prototypes about the self, one for “dependent” and one for “independent”, formed on the basis of past experiences (Markus, 1977). Although this theory does not include the notion of “distance”, it can be inferred that if the decision processes of responding according to the “dependent”-prototype are the same as the decision process of responding according to the “independent”-prototype, similar response times are expected across the two processes. However, if the processes differ, different response times may arise for items that are located more toward the “independent”-end of the personality dimension as compared with the items that are more located toward the “dependent”-end of the dimension. This results in asymmetry in the inverted-U effect as the sign of the difference between person and item (i.e., whether the subject’s trait position is above or below the attractiveness) does matter. The exact direction of this effect (i.e., whether positive distances are associated with faster or slower responses) depends on the properties of the two decision processes.
Dual processing
A related idea is the theory on dual processing (Shiffrin & Schneider, 1977). According to this theory, faster responses reflect more automated processes that are proceduralized, parallel, and do not require active control, while slower responses reflect more controlled processes that are serial and require attentional control. This theory has been successfully applied to cognitive abilities (e.g., Goldhammer et al., 2014), but it may also be applied to personality. That is, if the inverted-U effect is explained from the dual processing theory, the dual processing theory implies that subjects are more likely to use controlled processes if the distance between item and person is small, while subjects may be more likely to adopt an automated process if the distance between the person and the item is large. Again, this explanation assumes that the automated processes for subjects on the higher end of the personality dimension are exactly the same as the automated processes for subjects on the lower end of the personality dimension, and it would be interesting to study this assumption to get insight in the processes underlying the responses to personality questionnaire items.
Diffusion model
Tuerlinckx and De Boeck (2005) and Tuerlinckx et al. (2016) showed how the diffusion model (Ratcliff, 1978) can account for the decision processes underlying personality questionnaire items. In this model, it is assumed that subjects use memory retrieval to accumulate evidence to justify either endorsing a personality statement (e.g., “I like meeting new people”) or rejecting it. This process is terminated, and a decision is made, if the amount of evidence retrieved exceeds a threshold. The diffusion model for personality includes the inverted-U effect naturally (see Tuerlinckx et al., 2016) as the rate of evidence accumulation (memory retrieval) is defined as the distance between the person and the item. If this distance is large (i.e., a high rate of evidence accumulation), retrieving relevant information from memory is easier and faster, and if the distance is small (i.e., a low rate of evidence accumulation), memory retrieval is more challenging and takes longer. Tuerlinckx and De Boeck (2005) and Tuerlinckx et al. (2016) explicitly assume the process to be symmetrical, that is, in deriving their model, they assume that an equal amount of evidence needs to be accumulated to reject the statement or to endorse the statement. However, it might be that for some personality constructs, it requires more evidence before a statement can be endorsed than before a statement can be rejected. This could be due to the sensitivity of the topic (e.g., insecurity, social desirability, neuroticism; some things are hard to admit but easy to deny), due to a reject response being associated with a different process than an endorse response, or due to differences in prototypes as discussed above (then the reject and endorse options correspond to the “independent”–“dependent” options). Nevertheless, different thresholds in the diffusion process model will result in an asymmetric process: different response times for responses endorsing the personality statement as compared with responses rejecting the personality statement. As a result, the presence of different thresholds introduces asymmetry in the inverted-U effect. Studying this asymmetry will thus inform us about the nature of the decision process as operationalized by the diffusion model. Note that although the diffusion model for personality as discussed above was developed for dichotomous personality items, the same predictions follow for Likert-type items.
Statistical Perspective
As discussed above, in modeling personality data, the inverted-U approach assumes symmetry of the effect. Statistically, it is valuable to be able to test this assumption (a) to ensure that the symmetric inverted-U model is appropriate for the data; (b) to quantify the size of possible violations; (c) to test the robustness of the results in the presence of any violations; and (d) to account for violations if they are significantly affecting the results. As the authors will demonstrate in the simulation study, bias may occur in the standard errors and parameter estimates of the symmetric inverted-U model if unmodelled asymmetry is present in the data. In practice, to be able to detect such unmodelled asymmetry and to investigate what effects it has for the application at hand, the methodology presented in this article is of importance.
The Present Study
Thus, statistical approaches are desired that enable studying asymmetry in the distance–time relation (a) to elaborate on theories of response processes in personality measurement and (b) to statistically test for the assumption of symmetry and account for possible violations. Therefore, in this article the viability of a one-step Bayesian implementation of a general inverted-U model is studied inspired by Ferrando and Lorenzo-Seva (2007a), Molenaar et al. (2015), and Ranger (2013) for Likert-type personality data. Within this model, two specific tests on the symmetry of the inverted-U effect are proposed and the biasing effects of neglecting asymmetry is demonstrated. In addition, the model from this article is applied to the responses and response times of the Temperament and Character Inventory–Revised (TCI-R; Cloninger, 1999) to test inverted-U effect and its symmetry in a broad range of personality constructs.
The outline of this article is as follows: First, the existing approaches to study the time–distance relation are formally presented. Next, a modeling approach to test the inverted-U effect and its symmetry is proposed in a Bayesian framework. Then, the viability of this approach and the effects of neglecting departures from symmetry are investigated in a simulation study. Finally, the approach is applied to the TCI-R and discussed in a general discussion.
Existing Modeling Approaches for the Inverted-U Effect
As discussed above, at first, the inverted-U effect was tested using more traditional statistical approaches. For instance, Holden and Fekken (1991) correlated the sum scores of a personality test with the response times of the endorsed items (which are expected to be positive in the case of an inverted-U effect), and with the rejected items (which are expected to be negative in the case of an inverted-U effect). In addition, Ferrando (2006) and Kuncel (1977) used IRT models to estimate the distance between the item and the person, and analyzed the relation between these distances and response times using correlations and the nonparametric sign-test.
Although valuable, the above approaches are suboptimal as they either do not separate measurement error, person effects, and/or item effects from the responses and/or response times, and they do not account for the uncertainties in the model parameter estimates in analyzing the relation between model-based distances and the response times (but see Ferrando, 2006, for a correction). To improve upon these aspects in studying the inverted-U effect, Ferrando and Lorenzo-Seva (2007a) proposed a simultaneous modeling approach in which (a) person and item effects are explicitly separated in the responses and response times; and (b) the response times are regressed on the distances between the person and the item in the same model. Specifically, if


with
Likert-type Data
As it stands, the model above is only applicable to dichotomous personality items (yes-no). In the case of Likert-type items, Ferrando and Lorenzo-Seva (2007b) proposed an inverted-U model for the reciprocal response times and the ordinal items scores. In this model, the ordinal item scores are treated as approximately continuous to enable linear factor modeling. In this study, the focus is on the approach by Ranger (2013) and Molenaar et al. (2015) who used the Graded Response Model (GRM; Samejima, 1969) for the responses. That is, the item scores are explicitly treated as ordinal, that is,

where

where
Focusing on quadratic distances in Equation 4 instead of absolute distances as in Equation 2 has the advantage that the resulting model has the form
Testing the Symmetry of the Inverted-U Effect
In the present article, the following specification for the traditional (symmetric) inverted-U model from Equation 2 with

In addition, for the ordinal responses, the GRM from Equation 3 will be adopted. Within this symmetric inverted-U model for responses and response times a test on the symmetry assumption underlying the inverted-U effect will be proposed. Note that using the log-transformation for the response times in Equation 5 is intended to linearize the relation between the response times and the underlying speed variable
In the top left plot in Figure 1, the expected log-response times of the model in Equation 5 are plotted as a function of the difference between the item and the person,
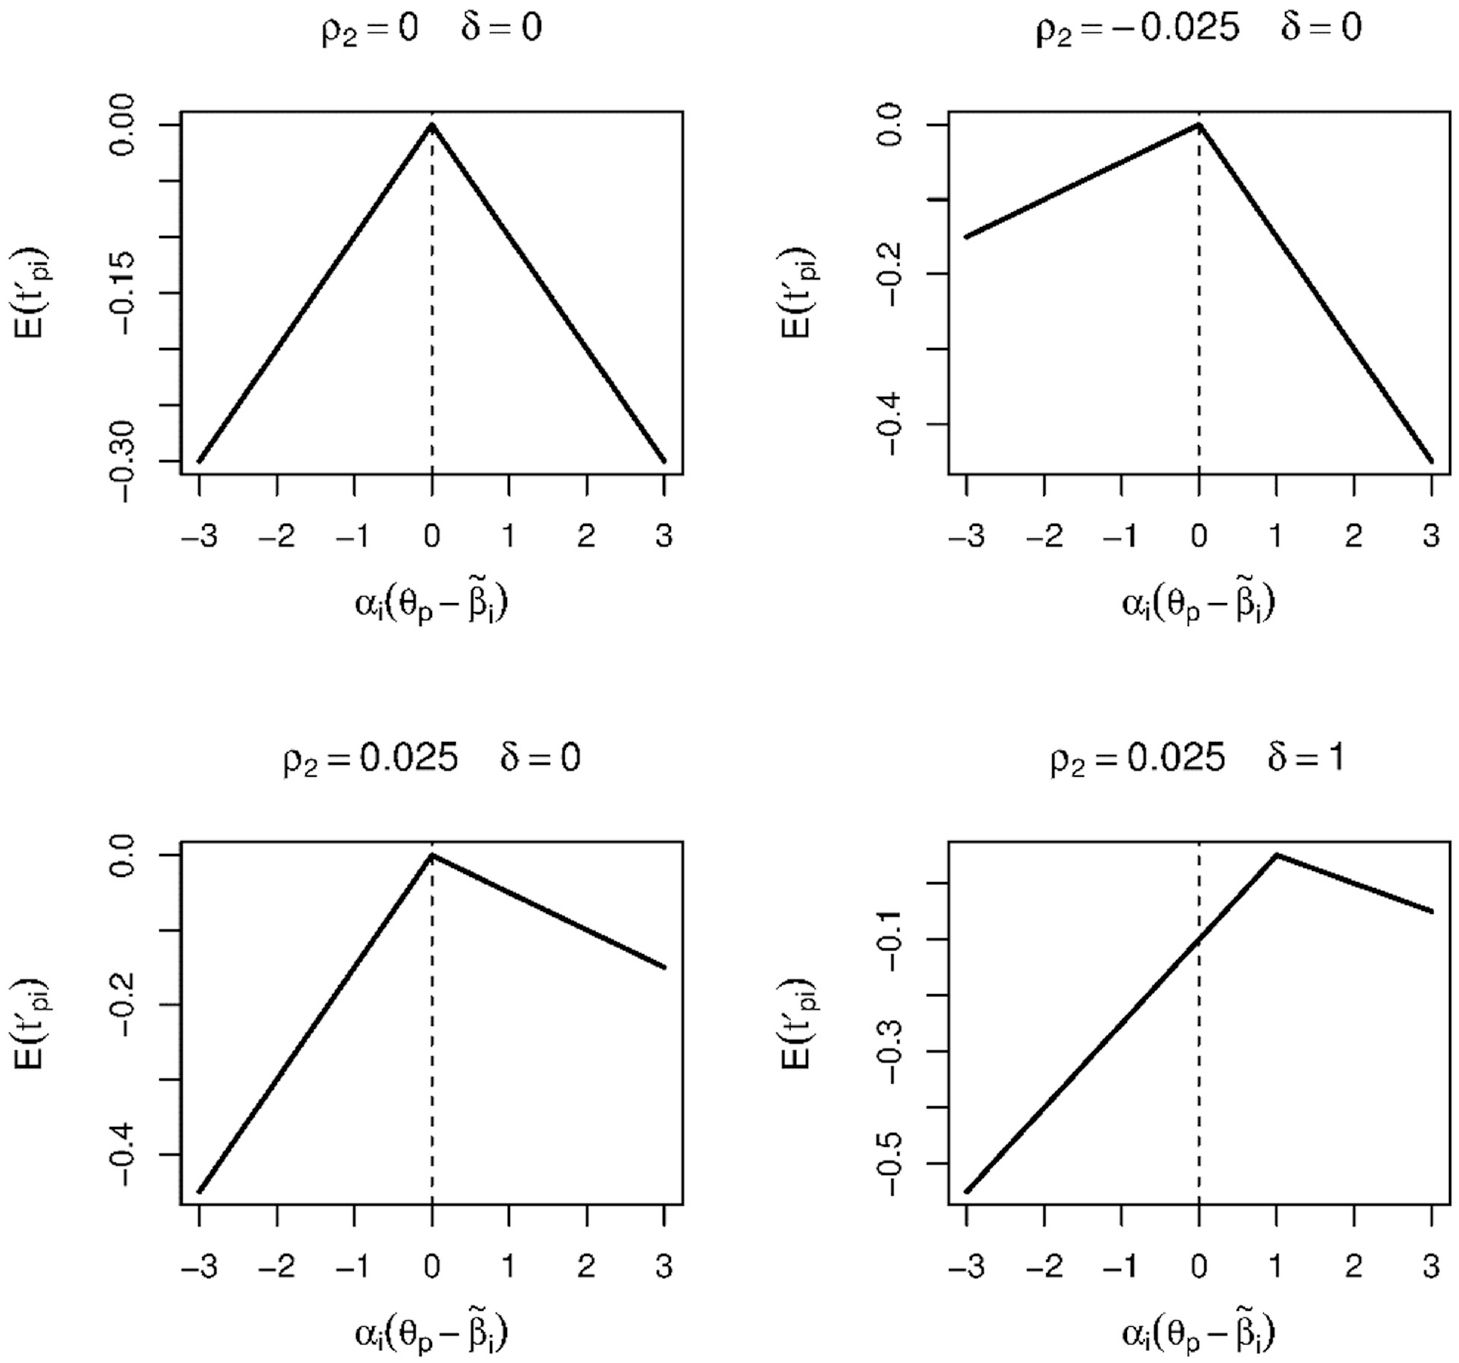
Illustration of the distance–time relation for different configurations of the
Therefore, an explicit statistical model is proposed which can be used to formally test whether the distance between the person and the item is symmetrical around
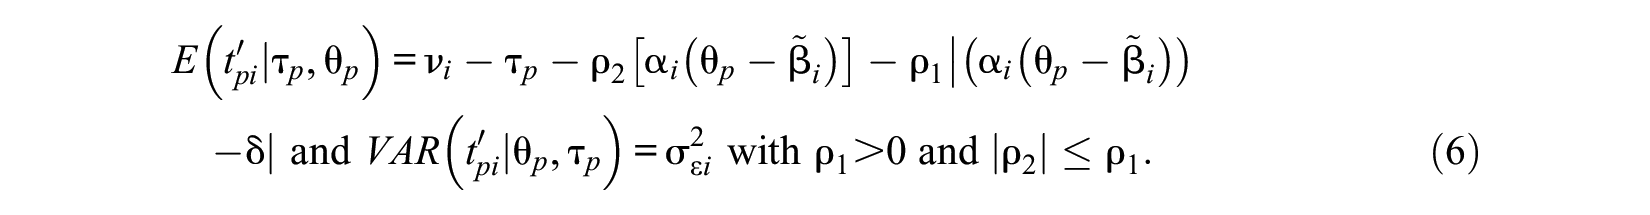
In this model,

In Equation 6, two inequality constraints apply:
In the model above, the latent variables
Thus, using the two new parameters
Estimation of the Model
Below, a procedure to fit the symmetric and the asymmetric inverted-U models to data is outlined. First, the item parameter in vector

where
The model above can be fit in a frequentist item response theory framework by specifying prior distributions for the random person parameters in


This parameterization can be derived by a Cholesky decomposition of the covariance matrix of
For the item parameters in
Simulation Study
Design
Responses and response times were simulated for 20 items using Equations 3 and 6 with 5 response categories
For the response time parameters in Equation 6,
Fifty replications were conducted within each condition. To the data within each replication, the symmetric and asymmetric inverted-U models are fit. Bayesian implementation discussed above is used to draw 10,000 samples from the posterior parameter distribution of which 5,000 are omitted as burn-in. Pilot simulations have demonstrated that this number was enough to ensure convergence of the sampling algorithm.
Results
Parameter Recovery: Symmetric Inverted-U Model
The results concerning parameter recovery of the symmetric inverted-U model in Equations 3 and 5 can be found in Online Supplemental Materials #2. Parameter recovery is generally good. The discrimination parameters and attractiveness parameters show a slight shrinkage effect. That is, for these parameters, the estimates are slightly pulled toward their prior means. This shrinkage effect for the item parameters has previously been found for the graded response model in Equation 3 by Kieftenbeld and Natesan (2012).
Parameter Recovery: Asymmetric Inverted-U Model
The results concerning parameter recovery of key parameters ρ1, ρ2, and δ from the asymmetric inverted-U model in Equations 3 and 6 can be found in Table 1. The parameters seem unbiased. Most importantly, the new parameters
Mean (and Standard Deviations) of the Posterior Mean Estimates of the Inverted-U Parameters for the Asymmetric Inverted-U Model and the Symmetric Inverted-U Model.
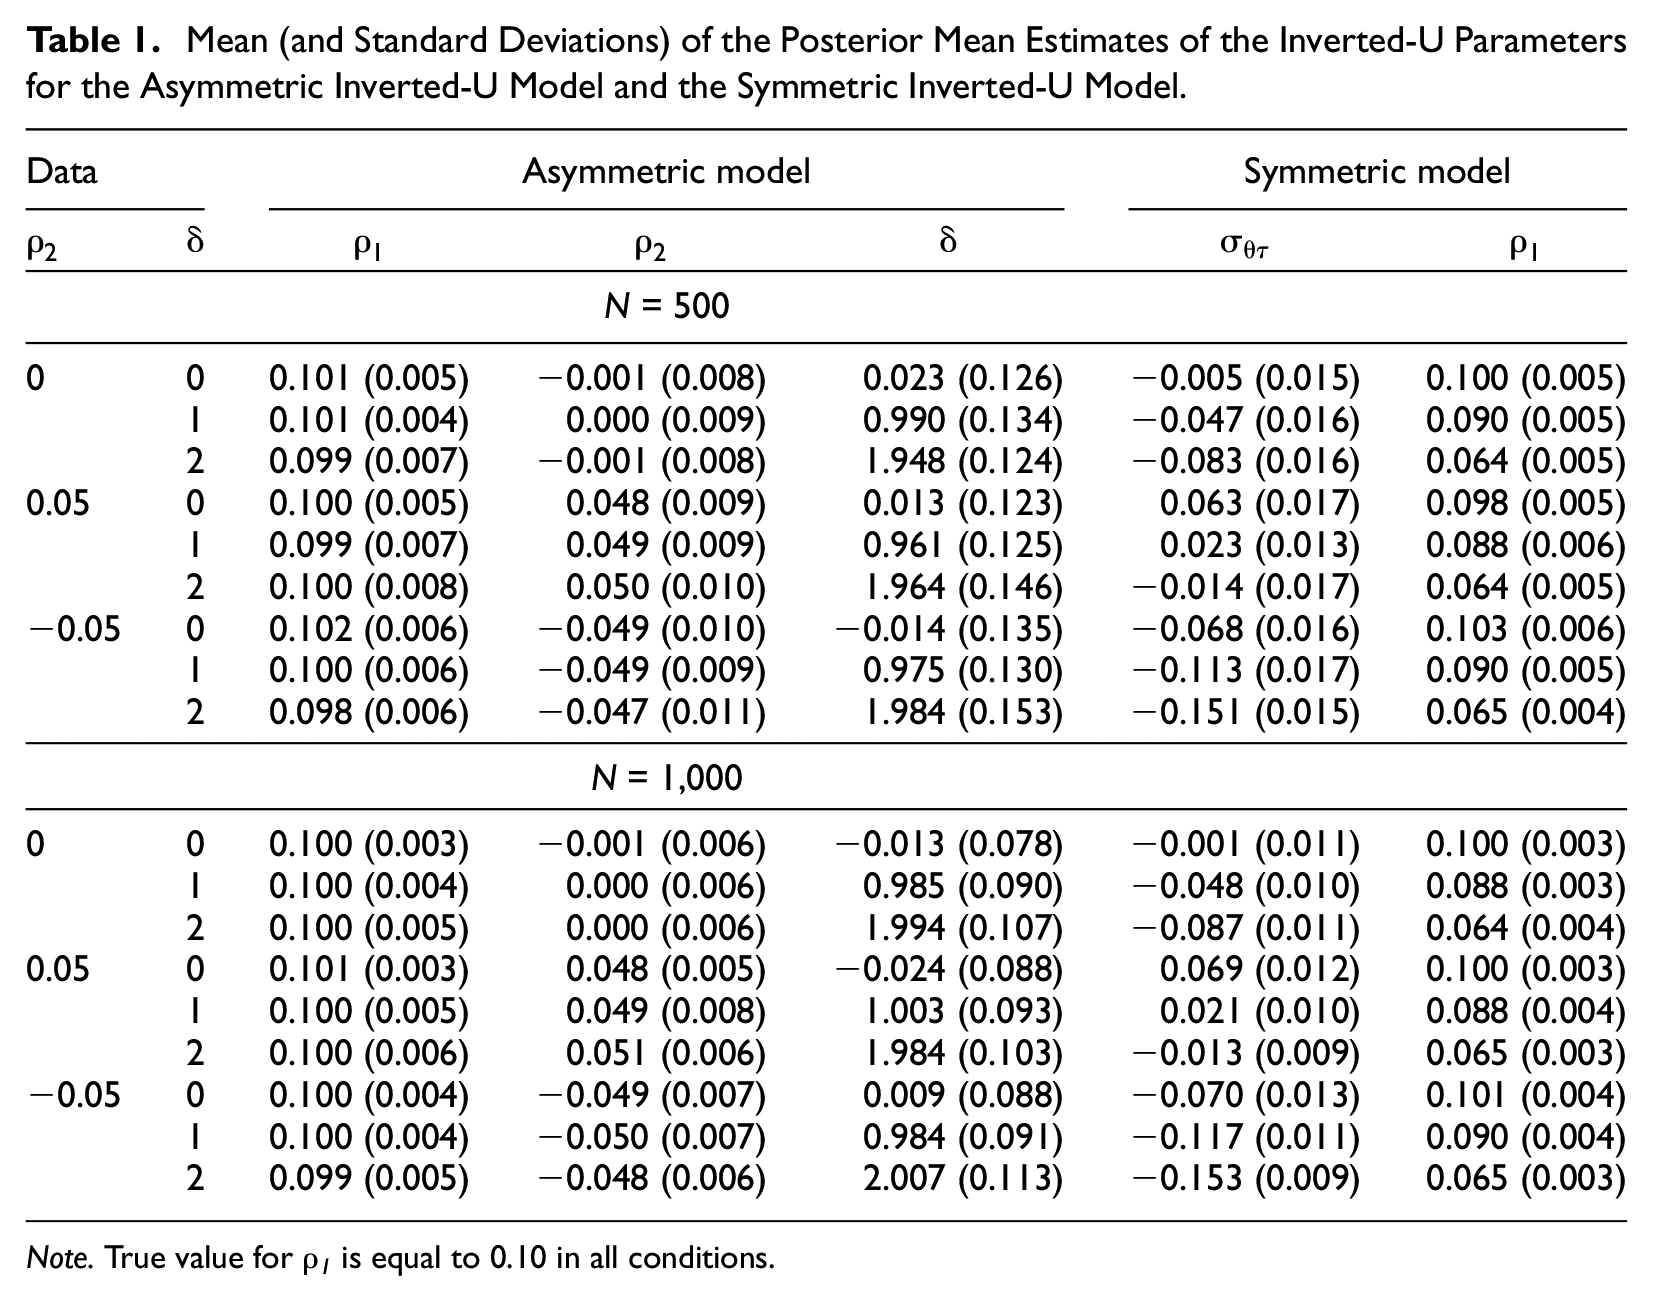
Note. True value for ρ 1 is equal to 0.10 in all conditions.
Bias in the Symmetric Inverted-U Model
To study the biasing effects of neglecting asymmetry in the inverted-U effect, the parameter estimates of the symmetric inverted-U model in the different conditions of the simulation study are considered. First, with respect to the inverted-U parameter
With respect to the parameter estimates of the latent variables
The discrimination parameters are an important determinant of the standard errors of
Model Fit
Finally, results (not shown) suggest that the DIC (Spiegelhalter et al. (2002) can validly be used for model selection. That is, in all conditions in which the symmetric model was used to generate the data, the symmetric model was correctly identified as the best fitting model. In the conditions in which the asymmetric model was used to generate the data, the asymmetric model was identified as the best fitting model in all or most cases (e.g., in 72% of the cases for
Conclusion
Besides a slight shrinkage effect on the item parameters, parameter recovery seems to be adequate for both the symmetric and asymmetric inverted-U models. Most importantly, key parameters
Application
Data
The data comprises the responses and response times of 1,901 subjects to a computerized online administration of the 235 items of the TCI-R (Cloninger, 1999). The subjects are between 14 and 80 years of age with a mean of 27.50 (SD: 11.96). In addition, 63.9% of the participants are female.
The TCI-R is based on a seven-dimensional psychobiological personality theory (Cloninger et al., 1993) in which four temperament dimensions are distinguished: novelty seeking (NS), harm avoidance (HA), reward dependence (RD), and persistence (PS) and three character dimensions: self-directedness (SD), cooperativeness (C), and self-transcendence (ST). Each dimension consists of 3 (ST), 4 (NS, HA, RD, and PC), or 5 (SD and C) subscales. Most of the subscales are bipolar, for example, NS1 (the first subscale of the novelty seeking scale) measures “exploratory excitability” versus “stoic rigidity.” Each subscale on its turn consists of 5 to 11 items with a 5-point Likert-type scale. Response times are generally between 4 and 60 s. Response times smaller than 1 s and larger than 60 s were excluded, which constituted 1.1% of the total data.
Analysis
As each subscale consists of few items, the analysis was conducted at the scale level. That is, the symmetric model from Equations 3 and 5 and the asymmetric model from Equations 3 and 6 are fit to the items of each of the seven scales separately. The model specification as discussed above is used. In addition, similarly as in the simulation study, 10,000 iterations are used with 5,000 iterations as burn in. To ensure convergence of the sampling algorithm, the trace plots of the parameters are consulted together with the Gelman-Rubin statistic for each parameter (Gelman & Rubin, 1992) based in two independent chains.
Results
All chains seemed converged with trace plots that varied randomly around a stable average. The largest Gelman-Rubin statistic that was observed equaled 1.01 (commonly values above 1.05 are taken as an indication of nonconvergence). Table 2 contains the posterior means and 95% highest posterior density (HPD) intervals for parameter
Posterior Means (and the 95% Highest Posterior Density Intervals) of ρ1, ρ2, and δ in the Asymmetric Distance Model for the Different Subscales of the TCI-R Together With the DIC Fit Indices for the Asymmetric Model (DICAS) and for the Symmetric Model (DICS).
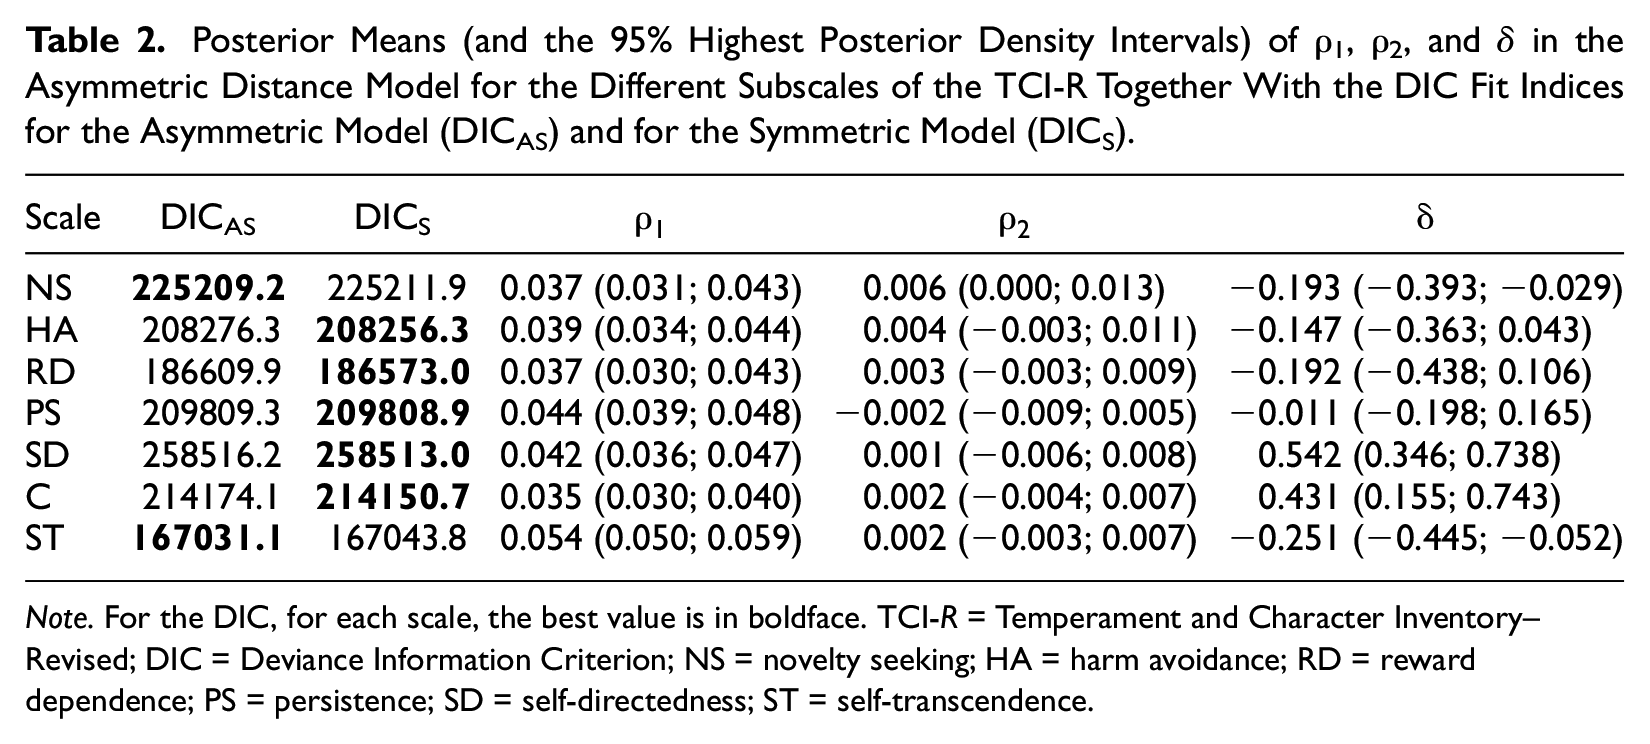
Note. For the DIC, for each scale, the best value is in boldface. TCI-R = Temperament and Character Inventory–Revised; DIC = Deviance Information Criterion; NS = novelty seeking; HA = harm avoidance; RD = reward dependence; PS = persistence; SD = self-directedness; ST = self-transcendence.
For scales SD and C, the
Conclusion/Discussion
For two scales, evidence for asymmetry of the inverted-U effect was found. For these subscales, it can be included that the response process for the one end of the scale differs from the response process of the other end of the scale. For instance, respondents on the lower end of Novelty Seeking (the NS scale) have been characterized by “stoic rigidity”, “reflection”, “reserve”, and “regimentation”, while respondents on the upper end of Novelty Seeking scale have been characterized by “exploratory excitability”, “impulsiveness”, “extravagance”, and “disorderliness” (see Mochcovitch et al., 2012). As our results indicate that there is asymmetry in the inverted-U effect, this suggests that the underlying response process is different for impulsiveness, extravagance, and so on, on the one side and rigidity, reflection, and so on, on the other side. On the other hand, Reward Dependence (the RD scale), for instance, is characterized by “indifference”, “aloofness”, “distance”, and “independence”, on the one side and “sentimentality”, “open to warm communication”, “attachment”, and “dependence”, on the other side. For this scale, no asymmetry was found, indicating that for this construct, there is no important (detectable) difference in the response process across its scale.
General Discussion
In the present study, the assumption of symmetry in the inverted-U effect underlying response times to personality items was tested. To enable these tests on symmetry, the modeling focussed on the absolute distance formalization by Ferrando and Lorenzo-Seva (2007a, 2007b). However, other formalizations have also been proposed in the literature. That is, Ranger and Ortner (2011) proposed a model in which the log-response times are not regressed on the absolute distance between person and item, but on the probability of the given response. In addition, Meng et al. (2014) regressed the log-response times on the sum of the squared category probabilities. Although these models have some desirable properties (see Ranger & Ortner, 2011), testing for symmetry in such models is more challenging as the relation between the probability of a given response and the log-response times can be multimodel for ordinal item responses. As a result, the focus of this study was on the formalization by Ferrando and Lorenzo-Seva. However, the approaches by Ranger and Ortner and Meng et al. (2014) are amenable to the present ideas in principle.
Most of the existing approaches to model the inverted-U effect have focused on item invariant inverted-U parameters (i.e., in this study:
In this article, bias was found in the discrimination parameters if there is unmodelled asymmetry in the time–distance relation. As the discrimination parameters are in essence parameters in the response model, and not in the response time model, question arises whether a two-stage procedure shouldn’t be adopted in which the response model is fit first, and those results are then being used in the response time model. Advantage is that the discrimination parameters will not be biased. However, disadvantage is that estimation of the model parameters in general, including the standard errors, do not optimally benefit from the relation between the response and the response times. Therefore, the present approach would be ideally preferred as parameters are unbiased, and parameter estimation utilizes all information available in the responses and responses times
Supplemental Material
sj-docx-1-apm-10.1177_0146621621990756 – Supplemental material for Modeling Asymmetry in the Time–Distance Relation of Ordinal Personality Items
Supplemental material, sj-docx-1-apm-10.1177_0146621621990756 for Modeling Asymmetry in the Time–Distance Relation of Ordinal Personality Items by Dylan Molenaar, Sandor Rózsa and Natasa Kõ in Applied Psychological Measurement
Footnotes
Declaration of Conflicting Interests
The author(s) declared no potential conflicts of interest with respect to the research, authorship, and/or publication of this article.
Funding
The author(s) disclosed receipt of the following financial support for the research, authorship, and/or publication of this article: The research by Dylan Molenaar was made possible by a grant from the Netherlands Organization for Scientific Research (NWO VENI- 451-15-008).
Supplemental Material
Supplementary material is available for this article online.
Notes
References
Supplementary Material
Please find the following supplemental material available below.
For Open Access articles published under a Creative Commons License, all supplemental material carries the same license as the article it is associated with.
For non-Open Access articles published, all supplemental material carries a non-exclusive license, and permission requests for re-use of supplemental material or any part of supplemental material shall be sent directly to the copyright owner as specified in the copyright notice associated with the article.