



Abstract
Self-presentation theory suggests people strategically adjust trait displays to meet evaluative goals, meaning faking can sometimes enhance the link between scores and real-world performance. We tested this in a large-scale military selection field experiment (N = 1,133) by manipulating the salience of self-presentation motives during personality assessment. We examined how varying the salience of self-presentation affects personality trait levels, convergent validity with low-stakes scores, and the ability to predict performance and career outcomes. Participants completed the same personality inventory under low, moderate, or high self-presentation. Despite trait score inflation, convergent validity with low-stakes benchmarks remained largely equivalent, and predictive validity was preserved or even enhanced under high-salience conditions. Notably, traits such as conscientiousness and extraversion showed stronger predictive utility when self-presentation motives were made explicit. These findings challenge the common view that response distortion inherently undermines test validity and instead suggest that motivated self-presentation may reflect context-relevant trait expression.
Introduction
Self-presentation theory starts with the premise that personality test responses are not neutral readouts of inner traits but contextualized identity claims, strategic bids to project a version of the self that fits salient evaluative standards (Goffman, 1959). According to Johnson and Hogan (1981), the nature of personality is essentially self-presentational. In personnel selection settings, applicants read situational cues, form hypotheses about the traits the organization values, and modulate their answers accordingly. Models of socially desirable responding distinguish between impression management, the deliberate tailoring of responses to create a favorable impression, and self-deceptive enhancement, a more unconscious positive bias in self-perception (Paulhus, 1984, 1991). In high-stakes selection contexts, both processes may operate, but impression management is especially likely when evaluation criteria are salient and consequences are explicit. Accordingly, what many practitioners and psychometricians label faking may, in part, reflect adaptive social signaling processes in which applicants selectively emphasize traits they perceive as role-relevant, rather than indiscriminate or purely opportunistic distortion of all socially desirable items (Marcus, 2009). Importantly, such signaling enhances predictive validity only when it is enacted by individuals who both accurately infer job demands and possess the underlying dispositions required to translate those traits into effective performance.
The literature on socially desirable responding and response distortion has long debated whether such effects represent construct-irrelevant bias or context-dependent adaptation (MacCann et al., 2012), and how self-presentation guided response modulation unfolds has major implications for personality theory and for the construction and use of assessments in practice. The impact can be negative, null, or positive effects on the predictive validity of personality tests. If the applicant’s aspirational selves align with the with role requirements, the trait scores can increase in validity (R. Hogan & Shelton, 1998). Predictive validity falls when the projected self fails to match role demands. Mismatches are most common when situational cues are unclear, when candidates show little interest or skill in decoding those cues, and when they misjudge the level of each trait that the role truly values. Social acuity, self-monitoring, and job knowledge guide accurate calibration (Marcus, 2009).
From the self-presentation perspective, response modulation may not necessarily represent construct-irrelevant distortion at all, but rather a meaningful act of self-presentation. Motivated candidates are not faking in a deceptive sense, but enacting a version of the self they believe to be appropriate or effective for the situation, what Markus and Nurius (1986) referred to as a possible self. This perspective reframes the meaning of high-stakes personality testing. Proponents of this perspective argue that well-constructed personality assessments predict job performance precisely because they tap into reputation, not private self-concept (R. Hogan, 2005; J. Hogan et al., 2007). Similarly, socially skilled individuals produce more coherent and valid profiles, even when engaging in impression management (Johnson & Hogan, 2006). From this view, self-presentation is not measurement error to be eliminated, but a natural and potentially informative part of the assessment process. Supporting this view, research has shown that applicants who engaged in impression management behaviors did not show reduced criterion validity (Ingold et al., 2015). In fact, impression management was positively related to job performance when aligned with situational demands, suggesting that strategic self-presentation may reflect adaptive, role-aligned signaling. Such signaling can include selective amplification of desirable traits without necessarily implying wholesale fabrication or low-integrity misrepresentation.
However, this optimistic view is not universally accepted. Tett et al. (2022), defending the faking-is-bad position, argued that response distortion poses a serious threat to validity by decoupling test scores from actual behavioral tendencies. They argued that faking undermines the integrity of personality assessment by producing inflated but inaccurate trait profiles that do not reflect a candidate’s actual behavioral tendencies. They cited evidence showing that faking is positively associated with counterproductive work behaviors (Peterson et al., 2011) and contributes to poor person–environment fit over time (Charbonneau et al., 2021; Christiansen et al., 2014; Tett et al., 2013). From this perspective, self-presentation in high-stakes contexts may often reflect opportunistic or misaligned portrayals that, while strategically motivated, ultimately lead to weaker work motivation, reduced job satisfaction, and higher risk of withdrawal or poor performance. Decades of research have examined whether faking undermines the predictive validity of personality tests (Morgeson et al., 2007; Tett & Christiansen, 2007). Recent meta-analytic findings suggest that the answer is yes: under motivated conditions, personality measures retain only about 68% of their predictive validity compared to low-stakes conditions (Dunlop et al., 2025; Loy et al., 2025; Speer et al., 2025). This has led many to conclude that faking represents a fatal flaw in personality testing, corrupting the trait-based inferences upon which selection decisions rely.
However, the results of high versus low stakes can be attributed to many factors. Specifically, studies that compare high-stakes applicants with low-stakes incumbents manipulate far more than motivation. Applicants and incumbents differ in job knowledge, trait-relevance insight, as well as the salience of self-presentation. Applicant scores may predict less well simply because newcomers guess which traits matter, whereas incumbents calibrate their responses through lived experience. Self-presentation theory thus accounts for the applicant–incumbent gap without invoking measurement error or trait distortion.
The faking and self-presentation argument is not merely a technical disagreement but a foundational issue about the nature of personality measurement and its role in applied settings. Understanding the role of self-presentation in high-stakes testing has direct consequences for the interpretation, construction, and use of personality assessments in selection contexts. Determining how self-presentation affects test validity requires experiments that vary both testing stakes and the salience of self-presentation motives. We provide such evidence. In a large field study with real applicants, we randomly varied self-presentation instructions between experimental conditions to evaluate how salience shapes trait scores and validity. This design answers recent calls for tests of the theory, as well as tests using real applicants (Dunlop et al., 2025). We assess both convergent validity and predictive validity to answer the following research questions:
Addressing these questions is essential both practically and theoretically. From a practical standpoint, organizations rely on personality tests to make high-stakes decisions, and understanding whether these tests reflect stable traits or strategic self-presentation has major implications for hiring accuracy and fairness. Theoretically, the findings speak to core assumptions about the nature of personality, the meaning of self-report responses, and the boundary between performance and identity in psychological assessment.
Method
The following section first describes the study sample, experimental design, and data-collection procedure. It then outlines the personality measures and performance outcomes used in the analyses. Finally, the statistical analytic strategy is described, including tests of mean differences, convergent validity, and predictive validity across experimental conditions.
Sample, Design, and Procedure
This study employed a longitudinal field-experimental design embedded within the Norwegian Armed Forces’ annual officer-selection process. The Time 1 data (baseline personality assessment, experimental manipulation, and manipulated personality assessment) were collected during the personnel selection procedure in 2009, under standardized testing conditions used for all applicants. Participants first completed a low-stakes baseline personality inventory, followed immediately by the randomly assigned self-presentation instruction and a second personality inventory. Five years later (Time 2), archival records of military admission decisions, yearly performance evaluations, and rank attainment were retrieved from the Armed Forces’ personnel database. Thus, although the experimental manipulation occurred entirely at Time 1, the criterion variables reflect longitudinal career outcomes collected approximately 5 years after the initial assessment.
The sample consisted of 1,133 candidates in the 4 branches of the Norwegian Armed Forces. Most applicants were civilians, although some had completed a 1-year conscription period. The majority of admitted candidates completed the officer training and continued their careers within the armed forces afterward. There was no gender quota, and all participants who appeared for selection were eligible for the study. Participants completed the experiment in the first part of the selection process. After the experimental procedure, candidates were debriefed about the nature of the experiment and given the option to opt out before continuing the selection process. Only three candidates opted out. Participants were informed verbally and in writing that the study was approved by the Armed Forces and the Social Science Data Service. The sample included 962 males (85%) and 171 females (15%). The mean age was 19.41 years (SD = 1.88), with a range of 18 to 35.
There were three experimental conditions of self-presentation salience: low, moderate, and high. Participants were randomly assigned digitally to one of these conditions. They were seated with sufficient space around them to prevent communication or the possibility of reading others’ instructions. In all groups, participants first completed a low-stakes baseline measure of personality with the following instruction: “Your answers will not be used in the selection process and will only be used in a research project. Your answers will be anonymized before statistical analysis with other respondents. Please answer as honestly and accurately as you can.” The baseline measure was included to facilitate analyses of convergent validity with the experimentally manipulated personality measures. After completing the baseline measure, participants in the low condition were presented with similar instructions before completing another personality measure: “The following forms will also not be used in the selection process. All analyses are at a group level and as part of a research project.” After completing the baseline measure, participants in the moderate self-presentation condition were presented with different instructions: “In contrast to your answers on the first form, all following forms from now on will be used in the decision-making process to evaluate whether you will be admitted to the officer program or not. Answer as accurately and honestly as you can.” Participants in the high self-presentation condition were presented with instructions that contained an encouragement to present themselves positively, to increase the salience of the self-presentation: “In contrast to your answers on the first form, all following forms from now on will be used in the decision-making process to evaluate whether you will be admitted to the officer program or not. It is important that you respond in a way that creates a good impression of you and that you respond as accurately as you can.”
The experimental instructions were designed to increase the salience of self-presentation while avoiding ethically problematic or unrealistic demands on participants. In a real, high-stakes selection context, explicitly instructing applicants to engage in unequivocal faking would create an ethical dilemma and produce responses that are difficult to interpret in relation to actual assessment practices. Accordingly, all participants were instructed to respond accurately, ensuring that responses remained grounded in what they perceived as defensible and realistic. The critical manipulation concerned whether participants were additionally prompted to consider how their responses would create a favorable impression, thereby isolating the salience of self-presentation while holding response accuracy constant.
The ethical implications of the experimental manipulation, including the use of partial deception, were carefully considered. Any potential risk to participants was deemed minimal, as the study was embedded in an existing selection process that participants had voluntarily entered. Importantly, none of the military personnel responsible for selection had access to participants’ responses on the experimental personality measures, and these responses had no impact on selection decisions in any way.
The 5-year interval between the experimental procedure and the collection of performance and career development outcomes was intentional. Meaningful variability in military career trajectories, such as promotion potential, supervisory evaluations, and differential retention, emerges only over multiple years, as individuals accumulate role experience and are observed across varied operational contexts. From a theoretical standpoint, personality effects are expected to manifest through many small, repeated behavioral tendencies rather than immediate performance snapshots. Capturing such aggregated effects requires sufficient time for stable patterns to translate into role-relevant outcomes. Accordingly, a 5-year window allowed us to observe variation in rank attainment, yearly evaluations, and career paths that would not be detectable immediately after selection. During this period, candidates followed diverse pathways: some were admitted and progressed through non-commissioned or commissioned officer training, whereas others either served as specialists or completed only the mandatory service period. Importantly, personality test scores were not used in the actual selection process, ensuring that subsequent career development unfolded independently of the experimental assessments.
Measures
NEO Five-Factor Inventory (NEO-FFI) (Costa & McCrae, 1995) was used to measure the five traits as a baseline measure before the experimental manipulation. The translated Norwegian inventory consists of 60 items, and trait scores are composite means of 12 items each (Martinsen et al., 2011). The NEO-FFI items were scored on a 5-point scale (1 = Very inaccurate to 5 = Very accurate). The neuroticism scale was reversed and scored to reflect emotional stability (ES). Omega reliability scores for the factors were ES = 0.79, E = 0.78, O = 0.73, A = 0.67, and C = 0.84, indicating acceptable reliability within each scale, except for agreeableness.
International Personality Item Pool (IPIP) Inventory
A translated version of the IPIP personality inventory by Heggestad et al. (2006) were used to measure the five traits after the experimental instructions. The IPIP inventory was chosen instead of the same NEO inventory to minimize recall bias. While the two batteries are conceptually aligned, they are not equivalent in terms of questions and wording of the items. The IPIP personality tests consisted of 50 Likert items rated on a six-point scale (1 = Totally disagree to 6 = Totally agree). Trait scores are computed as composite mean scores. Across groups, omega reliability for the factors were N = 0.79, E = 0.87, O = 0.79, A = 0.76, and C = 0.85. The reliability was deemed sufficient for all factors.
Performance measures were evaluated with three indicators: Admission to the basic military officer school, military rank after 5 years, and mean yearly service appraisals and evaluations also after 5 years. After selection, 45% of the candidates were admitted and started a 1-year process to become non-commissioned officers. Admission to the officer school is based on scholastic aptitude and leadership ability. Scholastic aptitude is assessed with standardized tests, and leadership ability is measured with interviews and a leadership field exercise in which candidates are assessed in the role of squad leader. After selection, admitted candidates continue a career as an officer in the Armed forces. Some candidates who are not admitted after the selection process do not serve at all, resulting in no reported military rank or yearly evaluation score. The missing data on military rank (12%) and mean yearly evaluation (19%) is largely due to this and but is also subject to random loss of archival data. The missing data are equally distributed across experimental groups and not subject to any known associations with personality dispositions.
After 5 years, 50.9% of the sample had achieved the rank of private, 27.0% the rank of sergeant, 9.7% the rank of second lieutenant, 11% the rank of lieutenant, and 1.4 % the rank of captain. Lastly, all personnel within the Armed Forces receive a yearly service evaluation on a five-point scale (1 = below average to 5 = above average). The measure is a composite mean of several aspects of service including leadership, task performance, and contextual performance. The records obtained reflect the candidates’ grand mean in the previous 3 years. The mean score was 3.04, with a standard deviation of 0.81. Although we could not estimate the reliability of this measure, a previous study in which the scale was used for self-assessment showed that the alpha reliability was .80 (Johansen et al., 2014). In another study using the scale for officer evaluations of subordinate officers’ performance (as in the present context), the alpha reliability was .91 (Fosse et al., 2015). Thus, there were good reasons to assume that internal consistency would also be adequate in the present context.
Statistical Analysis
The first research question, how personality test scores differ across conditions that vary in the salience of self-presentation motives, was evaluated with tests of group difference in mean trait scores. We used a general linear model with the IPIP traits as the dependent variable and the experimental group as a categorical predictor. A significant mean difference in trait scores indicated successful experimental manipulation. The magnitude of the effect informs the practical consequences of response distortion. The model included the NEO baseline measure as a covariate to identify within changes in personality and to adjust for group differences due to possible failure of randomization and the group marginal effects represent adjusted means. We calculated standardized mean differences by dividing the group coefficients with the root mean square error. This normalizes the scale of the coefficients making them directly comparable across different groups, similarly to Cohen’s d. We also examined group differences in variances. In general, faking is associated with a loss of variance because it leads to more candidates endorsing extreme alternatives which result in an item-by-item ceiling effect (Kluger & Colella, 1993).
The second research question, whether self-presentation framing influenced the convergent validity of personality scores, was evaluated using a regression approach and the interaction between experimental condition and the IPIP score. We tested convergent validity by regressing the pre-test NEO trait on its corresponding IPIP trait, as well as an interaction term and main effect of experimental condition. The results are presented as standardized coefficients for each condition as well as the interaction test of statistically significant difference in convergent validity. We compared the moderate and high conditions to the low self-presentation conditions. We also compared the low and high self-presentation conditions to the moderate condition by changing the reference group in the interaction term setting the moderate group as the baseline. We also evaluated the equivalence of the convergent validity coefficients between groups. Given that nonsignificant effect cannot be interpreted as evidence of absence of a difference, we calculated differences in the convergent validity slopes with a 90% confidence interval. These intervals were compared to equivalence bounds that signify statistically equivalent coefficients. The equivalence bounds were set to ±0.15, representing a compromise between the study’s statistical power to reliably detect differences of 0.23 (given a baseline correlation of r = .60 and 80% power) and the desire for narrower, more practically meaningful equivalence thresholds.
The final research question, whether the predictive validity of personality scores for job performance differ depending on whether self-presentation is made salient, was tested with a regression approach. First, we evaluated the overall predictive criterion validity of each trait on the three outcomes. For job performance, bivariate correlations were used. Military rank was analyzed with ordinal ordered logistic regression and probability of admission as analyzed with logistic regression. These coefficients were converted to r-equivalent effect sizes (Rosenthal & Rubin, 2003), that converts the z-scores to a bivariate correlation equivalent metric. The strength of the observed correlations was evaluated using effect size guidelines proposed by Bosco et al. (2015). According to their benchmarks, correlations of approximately .07 represent small effects (25th percentile), .16 indicates a medium effect (50th percentile), and .29 corresponds to a large effect (75th percentile). Additionally, correlations exceeding .22, which fall above the 67th percentile, are considered to reflect particularly strong predictive relationships. Second, we used trait by condition interaction models to detect differences in predictive criterion validity across experimental conditions on the three performance variables. A significant interaction means that the predictive validity differs between conditions. In this bivariate analysis, each trait was analyzed separately. We used three regression models to investigate the simultaneous unique effect of each of the five traits, the experimental condition, as well as the group/trait interaction. Job performance was analyzed with simple regression, and military rank and probability of admission was analyzed with ordinal ordered logistic regression and logistic regression.
Because the primary inferential focus of the predictive validity analyses was whether the strength of the relationship between personality traits and performance outcomes differed across self-presentation conditions, these analyses involved a large number of statistical tests that could inflate the risk of false positive findings. To address this, we applied a false discovery rate (FDR) correction to the p-values associated with the group × trait interaction terms in the predictive validity analyses, including both the bivariate and multiple regression models. Specifically, we used the Benjamini–Krieger–Yekutieli sharpened two-stage linear step-up procedure, which adjusts rejection thresholds based on the estimated proportion of true null hypotheses and is appropriate in settings where effects are expected to show systematic structure rather than being isolated (Benjamini et al., 2006). All other statistical tests (e.g., main effects, mean differences, and descriptive analyses) are reported for completeness but were not included in the FDR adjustment, as they do not directly address the central moderation question.
Transparency and Openness
The studies research questions were not preregistered. Partly because of the exploratory nature of the study, but also because the study was, in part, designed and conducted to answer a practical question of personnel selection procedures in the Armed Forces. As a field experiment with real-world applicants, the sample size was not determined a priory but rather reflects the number of applicants. No other experimental manipulation was performed. The experiment also included a counterbalanced forced choice measure of personality that was removed from further analysis due to missing data. IPIP and NEO personality scores, job performance data, admission outcomes, and reproducible analysis code are available at the following link: https://osf.io/t2zns/?view_only=5cc5a4341d674334bdc5376a5acac1ba. Military rank data are available upon request, as their categorical structure makes them partially identifiable.
Results
The results from tests of group differences in trait means can be viewed in Table 1. As shown, experimental manipulation led to inflated scores in both the moderate and high self-presentation conditions and serves as a manipulation check in the current study. The high self-presentation group showed the most pronounced inflation. The most inflated trait was conscientiousness, but inflation was observed in every trait, and notable inflation was observed in traits that are not typically associated with performance within a military leadership context, such as agreeableness and openness. The standard deviations showed that the moderate and high self-presentation conditions had less variation in trait scores, compared to the low. Mean inflation and loss of variance are typically viewed as indications of response manipulation (Kluger & Colella, 1993). Two traits showed both inflated traits and notably reduced variance: Extraversion and conscientiousness. Both traits, in addition to ES, are likely perceived as relevant traits in a military leadership context. Taken together, the impact of the experimental manipulation indicates a significant response to the change in self-presentation salience.

Note. n = 350 in the low group, n = 401 in the selection group, and n = 382 in the self-presentation group. SMD = Standardized Mean Difference.
Observed group means adjusted for pre-experiment NEO trait scores.
Unstandardized regression coefficient divided by root mean squared error.
p < .01.
Convergent Validity
The results from the interaction test of differences in convergent validity are shown in Table 2. The results showed that conscientiousness followed by extraversion had the highest convergent validity. Openness and agreeableness showed the lowest convergent validity. The results somewhat mirror test re-test reliability over short time intervals that show higher values for conscientiousness and extraversion, and lowest for openness and agreeableness (McCrae et al., 2011). The results also mirror the current study’s internal consistency measures showing the highest reliability for conscientiousness and lowest for agreeableness.
Standardized Coefficients and Significance Test Comparing Convergent Validity of Personality Traits With Low to Moderate and High Self-Presentation.

Note. All main effect coefficients are significant at p < .01.
Denotes statistically significant differences (p < .05) from low self-presentation.
Denotes statistically significant differences (p < .05) from moderate self-presentation.
The results from the interaction analysis showed that only one of the convergent validity coefficients significantly differed between low and moderate/high self-presentation conditions. Openness showed a significantly higher convergent validity (β = .13, SE = 0.06, p = .038; 95% CI [0.01, 0.25]) in moderate conditions, but not in the high self-presentation condition. Three convergent validity coefficients in the high or low conditions differed from the moderate self-presentation condition. The convergent validity of openness was lower in both low (β = −.13, SE = 0.06, p = .038; [−0.25, −0.01]) and high- (β = −.20, SE = 0.06, p = .001; [−0.33, −0.08]) compared to moderate self-presentation conditions. In addition, the convergent validity of ES was lower in the high (β = −.14, SE = 0.06, p = .014 [−0.25, −0.03]) compared to the moderate self-presentation condition. The mean standardized regression coefficients were highest in the moderate condition (β = .71), and very similar in the low condition (β = .63) and high condition (β = .61) self-presentation conditions. Overall, the results show only small changes between the three experimental conditions, and especially between low and high self-presentation. As such, the results show that convergent validity is not affected strongly by the difference in self-presentation salience, despite moderate to large trait score inflation.
Evaluating the equivalence of the convergent validity coefficients using the 90% confidence intervals revealed that all convergent validity coefficients were equivalent between low and moderate and high self-presentation conditions, except for openness and ES. For openness, the differences in convergent validity between the low and moderate, as well as the low and high self-presentation conditions, exceeded the predefined equivalence bounds. ES also failed to meet equivalence between the low and moderate conditions. The convergent validity coefficients for the two focal traits, extraversion and conscientiousness, did not differ significantly between self-presentation conditions and met the criteria for statistical equivalence (Figure 1).
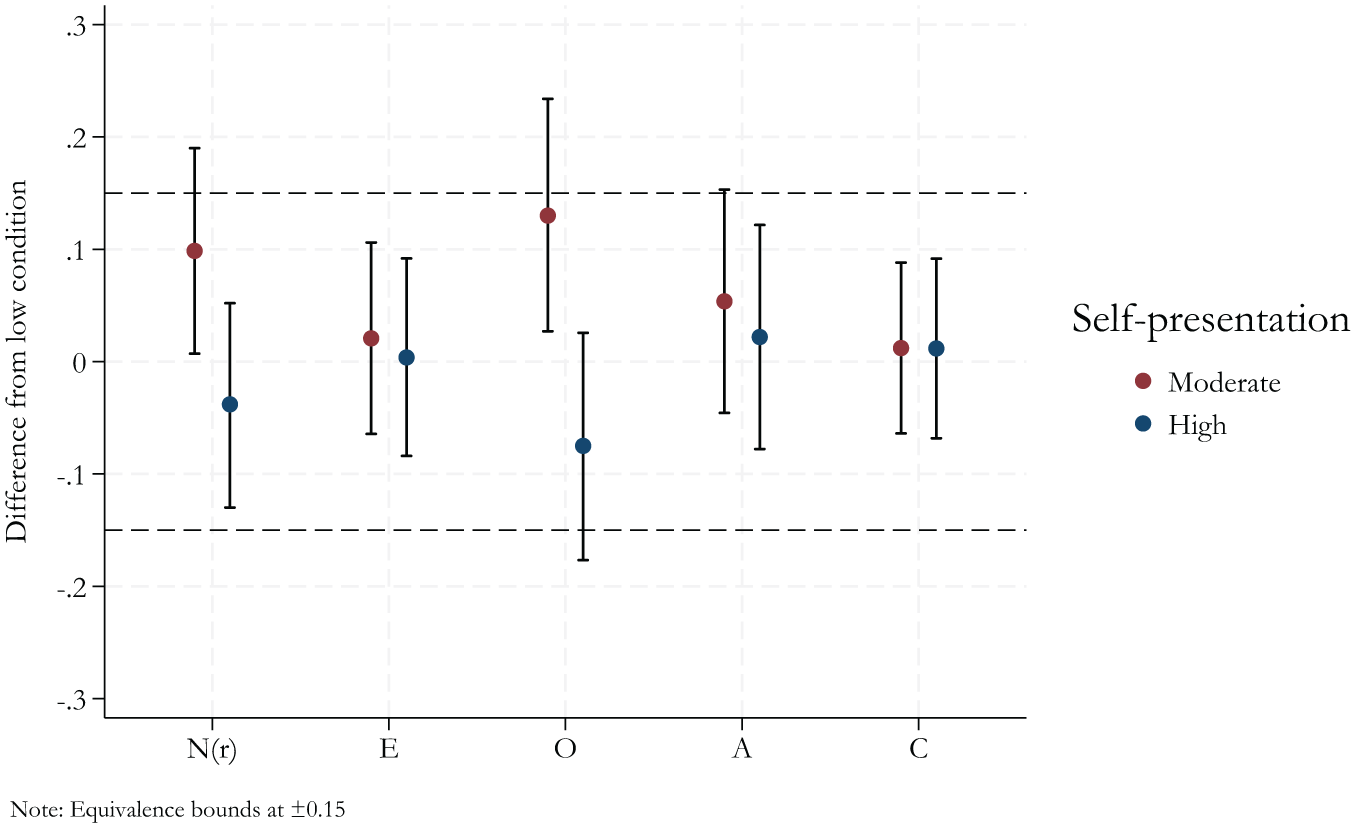
Differences in convergent validity relative to the low self-presentation condition, with 90% confidence intervals.
Predictive Validity
The overall predictive criterion validities, converted to correlations, are shown in Table 3. As shown, extraversion and conscientiousness emerged as consistent and significant predictors of all three outcomes, job performance, military rank, and admission. The magnitude of the effects can be characterized from small to moderate (Bosco et al., 2015). Openness and agreeableness showed very small and many nonsignificant smallest effects. ES showed significant, but small effects. This finding is likely influenced by considerable restriction of range, as candidates self-selecting into military leadership education are characterized by being emotionally stable (Nordmo et al., 2020; Skoglund et al., 2021). Extraversion showed the highest criterion validities, especially for likelihood of admission.
Standardized Criterion Validity Coefficients of Big Five Traits on Three Performance Outcomes.

Note. Correlations from on military rank and likelihood of admission are converted from ordinal logit and logistic regression coefficients as described by Rosenthal and Rubin (2003).
p < .05. **p < .01.
The results of the trait–condition interaction models are presented in Table 4. Two significant interaction effects confirmed that predictive validity differed between conditions, with the highest overall validity observed in the high self-presentation group. In contrast, the low and moderate self-presentation groups were more similar, and no significant differences in predictive validity were observed between them. While extraversion and conscientiousness demonstrated robust relationships with performance across contexts, other traits showed more variable patterns. Openness and agreeableness significantly predicted admission only under high self-presentation. These findings suggest that self-presentation salience can influence the predictive criterion validity of personality traits, especially for traits with weaker baseline associations. The results also show that the mean validities are highest in the high self-presentation group, and lowest in the low self-presentation group.
Bivariate Criterion Validity Coefficients of Personality Scores in Low, Moderate, and High Self-Presentation Conditions.

Note. Coefficients in bold are statistically significant from the low self-presentation conditions.
p < .05. **p < .01.
Figure 2 presents the results of multiple regression models estimating the unique predictive validity of each personality trait across low, moderate, and high self-presentation conditions for three outcomes: yearly evaluation, military rank, and admission. The figure shows coefficient estimates with 95% confidence intervals, representing each trait’s unique contribution when all five traits were included simultaneously. The overall pattern mirrors the bivariate results discussed earlier, with conscientiousness and extraversion emerging as the most consistent predictors across outcomes. Importantly, two significant interactions with condition were observed: conscientiousness predicted both yearly evaluation and military rank more strongly in the high self-presentation condition compared to the low and moderate conditions. These interactions replicate the differences found in the bivariate models, where validity coefficients for conscientiousness were notably higher in the high self-presentation group. No other significant differences in predictive validity between conditions emerged for the remaining traits. This indicates that, while the overall pattern of trait contributions is stable, the predictive power of conscientiousness appears particularly sensitive to self-presentation demands, whereas the validity of the other traits remained consistent across experimental groups.

Coefficient plot of multiple regression coefficients across self-presentation conditions for three outcomes.
To assess the robustness of the predictive validity findings, we applied an adaptive FDR correction to all group × trait interaction tests. Using the Benjamini et al. (2006) sharpened two-stage FDR procedure, all interaction effects remained statistically significant at q < 0.05. The complete set of raw p-values and corresponding BKY-adjusted q-values is reported in Table A1. This pattern indicates that the observed interaction effects are not driven by isolated nominal findings but reflect a broader, non-sparse structure across traits, outcomes, and analytic specifications. Consistent with the exploratory nature of the study, these results are interpreted in conjunction with effect sizes and confidence intervals rather than as definitive confirmatory tests.
We also tested the robustness of the experimental manipulation on the baseline NEO measure to test for the possibility of baseline contamination. The results are presented in Appendix B. We conducted two sets of analyses. First, we tested whether baseline NEO trait means differed across experimental groups using regression models with group as a categorical predictor. No systematic mean differences emerged, indicating that baseline scores were comparable prior to the manipulation. Second, we estimated baseline trait × group interaction models predicting each outcome variable (yearly evaluation, admission, and military rank) to assess whether baseline predictive validity differed across conditions. These analyses did not reveal a coherent or monotonic pattern of differential slopes across groups. Taken together, the absence of mean differences and the lack of systematic interaction effects provide no clear empirical indication of differential baseline contamination across experimental conditions.
Discussion
This study set out to address three central questions: (a) how personality scores change when self-presentation motives are made salient, (b) how this salience affects convergent validity with a low-stakes benchmark, and (c) whether predictive validity for job performance and career outcomes is altered by self-presentation framing. As expected, trait scores were significantly inflated in both moderate and high self-presentation conditions, with the largest effects observed for conscientiousness and extraversion, traits likely seen as desirable in a leadership context. Despite this inflation, convergent validity remained largely stable, especially for traits with high internal consistency such as conscientiousness, suggesting that inflated scores may still meaningfully reflect underlying dispositions. Interestingly, moderate self-presentation resulted in the highest overall convergent validity, challenging the assumption that low-stakes conditions are inherently more valid. Most strikingly, predictive validity was not reduced by self-presentation; on the contrary, it was overall stronger under high self-presentation, particularly for conscientiousness.
The combined pattern of results places important constraints on how the observed mean differences should be interpreted. Differences in convergent validity between the low and moderate conditions are small and inconsistent and notably absent for extraversion and conscientiousness, the traits most normatively salient in this selection context. In contrast, these two traits show the strongest differences in predictive validity across conditions. This dissociation makes an interpretation based on indiscriminate or unconstrained distortion unlikely.
At the same time, it is important to clarify the nature of the self-presentation manipulated in the present study. Participants were instructed to respond in a way that created a favorable impression while remaining accurate and realistic, within a structured, multi-method selection system for a long-term military career. Under such conditions, extreme or fabricated responding may be less likely than calibrated impression management aligned with aspirational selves. Thus, the present findings may best be understood as reflecting impression management under accountability rather than deception in its strongest form. From this perspective, heightened self-presentation salience appears to prompt motivated candidates to evaluate themselves more favorably on traits they perceive as central to success in the role. Such responding may involve both strategic signaling and elements of distortion, but it need not imply wholesale fabrication of trait levels. Instead, it may reflect role-aligned identity enactment within institutional constraints.
Accordingly, the present findings do not imply that all forms of faking preserve validity. Rather, they suggest that in structured, identity-relevant, high-accountability selection contexts, certain forms of impression management may retain predictive meaning. This interpretation aligns with socioanalytic perspectives that view personality test responses as context-dependent identity claims (Marcus, 2009), while remaining compatible with research showing that more extreme or unconstrained distortion can undermine validity (e.g., Tett et al., 2022).
Viewed through a signaling framework (Bangerter et al., 2012), applicants may engage in strategic behavior to align their expressed traits with perceived organizational demands. In the present context, where assessment was embedded within cognitive testing, interviews, and field exercises, such signaling may have been constrained by accountability and realism. The contrast between the current findings and prior meta-analytic evidence of validity attenuation in high-stakes settings (Loy et al., 2025; Speer et al., 2025) therefore suggests that the impact of self-presentation on validity depends critically on contextual features of the selection system. Inflation observed in well-structured, multi-method systems may reflect calibrated signaling that retains predictive relevance, whereas inflation in less structured or lower-accountability contexts may more readily decouple scores from performance.
From a practical standpoint, the results of the current study also demonstrate that personality tests may be used in real-world selection settings, with predictive power regarding later career achievement. Although the strength of the predictive associations can be described as small to moderate, a simple cost–benefit analysis based on the results of the current study shows substantial benefits as personality tests can be administered at an early stage at a fraction of the cost of other selection tools.
Limitations and Future Directions
There are four limitations in this study. First, there is likely much noise in the outcome variables. The three outcome variables are criterion outcomes and do not lend themselves to reliability estimates. Although the mean yearly evaluation has been shown to have acceptable internal consistency in previous studies (Fosse et al., 2015; Johansen et al., 2014), none of these outcomes were actually designed for use in empirical research. In addition, they likely contain nesting. For example, the annual evaluation may be nested within occupational fields and military ranks. In addition, we do not know if or when the participants resigned from the armed forces. The data do not reflect whether a lower military rank is due to highly qualified personnel who may be more likely to end their military careers. Thus, the main source of noise is the huge number of factors that influence career performance over a period of 5 years, where several of these are not caused by individual differences. Second, we cannot rule out the possibility of participants communicating about the prompts, although instructed not to. It is also important to note that the current study was not pre-registered and should therefore be interpreted as an exploratory rather than confirmatory finding. To establish whether heightened self-presentation salience reliably enhances predictive validity, future research should employ a pre-registered, confirmatory design.
Third, baseline mean levels did not differ meaningfully across experimental groups, and analyses of baseline trait × group interactions predicting later outcomes did not reveal a coherent or monotonic pattern of differential predictive validity across conditions. Together, these findings provide no clear empirical indication of systematic baseline contamination. Nevertheless, although baseline instructions emphasized confidentiality, we cannot definitively rule out the possibility that some participants engaged in anticipatory impression management at Time 1. If present, such bias would likely have attenuated contrasts between conditions, rendering the observed differences conservative rather than inflated.
Lastly, there are limitations in the generalizability of the findings. Although the high-stakes setting gives the results more external validity than laboratory-induced faking or applicant-incumbent studies, the sample emerged from a highly structured military selection context, which differs in important ways from typical civilian or business environments. Applicants to officer training are embedded in a hierarchical system characterized by strong normative expectations, clearly defined role demands, and an explicit emphasis on leadership, discipline, and collective performance. Motivation to perform well in selection is often tied not only to employment outcomes but also to identity, service commitment, and long-term career trajectories. These features may influence how self-presentation is enacted and interpreted, potentially making socially desirable responding more normatively acceptable or strategically calibrated than in less formalized settings. As such, the results are most directly applicable to high-stakes, structured selection systems and should be generalized to civilian contexts with caution. An additional limitation on generalizability concerns the age, career stage, and self-selection of the sample. Participants were predominantly young adults, with a mean age of approximately 20 years and an upper bound of 35. Many were at an early stage of their working lives, with limited prior leadership or organizational experience. This may affect both the strategies used for self-presentation and the extent to which personality traits translate into observable performance outcomes. Consequently, the findings may not generalize to older, more experienced applicant populations or to later career stages where impression management norms and performance criteria may differ. The candidates were also self-selected. Applicants for military officer training are likely to differ systematically from the broader population of job applicants in terms of motivation, values, and career orientation. Entry into such training can reflect prior interest in military service, willingness to accept hierarchical structures, and commitment to long-term organizational careers. These characteristics may shape both personality expression and self-presentation strategies during assessment. Consequently, the present findings may not generalize to more heterogeneous or less formal civilian recruitment settings. At the same time, this self-selection should not be overstated, as applicants vary widely in background and prior experience; most are civilians with no previous military service and limited knowledge of what a career in the Armed Forces entails.
Footnotes
Appendix A
Benjamini et al. (2006) Sharpened Two-Stage q-Values of Group Interactions in Predictive Validity as Described in Anderson (2008).

| Outcome | Trait | Contrast | Model | p-Value | q-Values |
|---|---|---|---|---|---|
| Yearly evaluation | N | Moderate | Bivariate | .997 | 1 |
| Yearly evaluation | N | High | Bivariate | .477 | 1 |
| Yearly evaluation | E | Moderate | Bivariate | .942 | 1 |
| Yearly evaluation | E | High | Bivariate | .719 | 1 |
| Yearly evaluation | O | Moderate | Bivariate | .94 | 1 |
| Yearly evaluation | O | High | Bivariate | .874 | 1 |
| Yearly evaluation | A | Moderate | Bivariate | .631 | 1 |
| Yearly evaluation | A | High | Bivariate | .561 | 1 |
| Yearly evaluation | C | Moderate | Bivariate | .602 | 1 |
| Yearly evaluation | C | High | Bivariate | .014 | 0.103 |
| Military rank | N | Moderate | Bivariate | .604 | 1 |
| Military rank | N | High | Bivariate | .776 | 1 |
| Military rank | E | Moderate | Bivariate | .239 | 1 |
| Military rank | E | High | Bivariate | .001 | 0.009 |
| Military rank | O | Moderate | Bivariate | .862 | 1 |
| Military rank | O | High | Bivariate | .41 | 1 |
| Military rank | A | Moderate | Bivariate | .604 | 1 |
| Military rank | A | High | Bivariate | .776 | 1 |
| Military rank | C | Moderate | Bivariate | .239 | 1 |
| Military rank | C | High | Bivariate | .001 | 0.009 |
| Admission | N | Moderate | Bivariate | .604 | 1 |
| Admission | N | High | Bivariate | .776 | 1 |
| Admission | E | Moderate | Bivariate | .239 | 1 |
| Admission | E | High | Bivariate | .001 | 0.009 |
| Admission | O | Moderate | Bivariate | .862 | 1 |
| Admission | O | High | Bivariate | .41 | 1 |
| Admission | A | Moderate | Bivariate | .604 | 1 |
| Admission | A | High | Bivariate | .776 | 1 |
| Admission | C | Moderate | Bivariate | .239 | 1 |
| Admission | C | High | Bivariate | .001 | 0.009 |
| Yearly evaluation | N | Moderate | Multiple regression | .997 | 1 |
| Yearly evaluation | N | High | Multiple regression | .719 | 1 |
| Yearly evaluation | E | Moderate | Multiple regression | .942 | 1 |
| Yearly evaluation | E | High | Multiple regression | .874 | 1 |
| Yearly evaluation | O | Moderate | Multiple regression | .94 | 1 |
| Yearly evaluation | O | High | Multiple regression | .874 | 1 |
| Yearly evaluation | A | Moderate | Multiple regression | .631 | 1 |
| Yearly evaluation | A | High | Multiple regression | .561 | 1 |
| Yearly evaluation | C | Moderate | Multiple regression | .862 | 1 |
| Yearly evaluation | C | High | Multiple regression | .41 | 1 |
| Military rank | N | Moderate | Multiple regression | .604 | 1 |
| Military rank | N | High | Multiple regression | .776 | 1 |
| Military rank | E | Moderate | Multiple regression | .239 | 1 |
| Military rank | E | High | Multiple regression | .001 | 0.009 |
| Military rank | O | Moderate | Multiple regression | .862 | 1 |
| Military rank | O | High | Multiple regression | .239 | 1 |
| Military rank | A | Moderate | Multiple regression | .604 | 1 |
| Military rank | A | High | Multiple regression | .776 | 1 |
| Military rank | C | Moderate | Multiple regression | .862 | 1 |
| Military rank | C | High | Multiple regression | .41 | 1 |
| Admission | N | Moderate | Multiple regression | .604 | 1 |
| Admission | N | High | Multiple regression | .776 | 1 |
| Admission | E | Moderate | Multiple regression | .239 | 1 |
| Admission | E | High | Multiple regression | .001 | 0.009 |
| Admission | O | Moderate | Multiple regression | .862 | 1 |
| Admission | O | High | Multiple regression | .41 | 1 |
| Admission | A | Moderate | Multiple regression | .604 | 1 |
| Admission | A | High | Multiple regression | .776 | 1 |
| Admission | C | Moderate | Multiple regression | .239 | 1 |
| Admission | C | High | Multiple regression | .001 | 0.009 |
Appendix B
Differences in predictive validity coefficients for the baseline NEO measure Extraversion (E) and Conscientiousness (C) and Group × Trait interaction effect.

| Outcome | Trait | Term | B | SE | p-Value | CI-low | CI-high |
|---|---|---|---|---|---|---|---|
| Job performance | E | E | 0.41 | 0.12 | .00 | 0.18 | 0.64 |
| Job performance | E | Moderate | 1.60 | 0.66 | .02 | 0.31 | 2.90 |
| Job performance | E | High | 0.27 | 0.66 | .68 | −1.03 | 1.56 |
| Job performance | E | Moderate × E | −0.39 | 0.16 | .02 | −0.70 | −0.07 |
| Job performance | E | High × E | −0.06 | 0.16 | .70 | −0.38 | 0.25 |
| Job performance | C | C | 0.17 | 0.11 | .12 | −0.04 | 0.37 |
| Job performance | C | Moderate | −0.27 | 0.61 | .65 | −1.47 | 0.92 |
| Job performance | C | High | −0.53 | 0.61 | .39 | −1.73 | 0.67 |
| Job performance | C | Moderate × C | 0.08 | 0.15 | .59 | −0.21 | 0.38 |
| Job performance | C | High × C | 0.14 | 0.15 | .35 | −0.15 | 0.43 |
| Admission | E | E | 3.09 | 0.84 | .00 | 1.81 | 5.27 |
| Admission | E | Moderate | 5.50 | 8.31 | .26 | 0.29 | 106.27 |
| Admission | E | High | 1.52 | 2.42 | .79 | 0.07 | 34.26 |
| Admission | E | Moderate × E | 0.64 | 0.24 | .23 | 0.31 | 1.33 |
| Admission | E | High × E | 0.86 | 0.33 | .71 | 0.41 | 1.85 |
| Admission | C | C | 1.65 | 0.39 | .03 | 1.05 | 2.62 |
| Admission | C | Moderate | 0.98 | 1.28 | .99 | 0.08 | 12.70 |
| Admission | C | High | 0.64 | 0.89 | .75 | 0.04 | 9.68 |
| Admission | C | Moderate × C | 1.00 | 0.32 | .99 | 0.53 | 1.87 |
| Admission | C | High × C | 1.09 | 0.37 | .80 | 0.56 | 2.11 |
| Military rank | E | E | 1.17 | 0.27 | .00 | 0.64 | 1.70 |
| Military rank | E | Moderate | 4.80 | 1.53 | .00 | 1.81 | 7.80 |
| Military rank | E | High | 0.96 | 1.58 | .54 | −2.13 | 4.05 |
| Military rank | E | Moderate × E | −1.21 | 0.37 | .00 | −1.95 | −0.48 |
| Military rank | E | High × E | −0.30 | 0.38 | .43 | −1.05 | 0.45 |
| Military rank | C | C | 0.26 | 0.24 | .27 | −0.20 | 0.73 |
| Military rank | C | Moderate | −0.74 | 1.36 | .59 | −3.40 | 1.93 |
| Military rank | C | High | −2.53 | 1.43 | .08 | −5.32 | 0.27 |
| Military rank | C | Moderate × C | 0.16 | 0.33 | .62 | −0.49 | 0.82 |
| Military rank | C | High × C | 0.57 | 0.35 | .10 | −0.11 | 1.25 |
Note. Job performance coefficients are from linear, admission coefficients are from logistic and military rank is ordered logistic regression.

Author Contributions
M.N. did all the analyses and wrote the first draft. Ø.L.M. designed the study, contributed to the writing, and suggested further analyses. A.F. edited drafts and contributed to the discussion. O.C.L.-R. helped in the study design and editing of the article.
Funding
The authors received no financial support for the research, authorship, and/or publication of this article.
Declaration of Conflicting Interests
The authors declared no potential conflicts of interest with respect to the research, authorship, and/or publication of this article.