
Abstract
Virtual dating has become popular, but how do people feel about potential romantic partners on virtual versus in-person first dates? In Study 1, a sample of online participants predicted that in-person dates would be markedly better than virtual dates. Study 2 examined whether this prediction received support in a dataset of 4,542 real-life blind dates. We examined first-date outcomes (e.g., date enjoyment and attraction) and partner trait-perceptions (e.g., ambitious and confident) reported after each date. In-person dates were generally longer, but otherwise, virtual and in-person dates were highly similar across the full sample, and virtual dates outperformed in-person dates when controlling for date length. We conducted a one-with-many Social Relations Model analysis on a subsample of Study 2 daters (n = 1,833 dates) and documented a modest amount of actor and partner variance, and a large amount of relationship variance. Virtual dates may be an underappreciated screening strategy for potential partners.
Introduction
“Technology is a good way to continue something from a distance. But it’s a hard way to start something.”
In recent years, finding potential romantic partners has become increasingly difficult (Brown, 2020), yet the majority of single people report some desire for a romantic relationship (Park et al., 2023). Virtual communication channels have become valuable tools for supporting interpersonal and socialization needs (Antheunis et al., 2019; Canale et al., 2021; French et al., 2024; Gruber et al., 2022; Hall et al., 2021), and virtual interactions seem to allow individuals to read new acquaintances’ personalities with a level of accuracy that matches in-person first impressions (Mignault et al., 2024). Nevertheless, the general public seems skeptical of virtual dating as a method of forging romantic connections in particular (Taylor, 2020). Given challenges to dating in-person during the early days of the COVID-19 pandemic, dating apps encouraged virtual dating through services such as Zoom as a temporary alternative (Gibson, 2021; Myles et al., 2021). But as the pandemic recedes, it remains unclear whether people believe that virtual dates are somehow lesser than real-life ones, and importantly, whether this belief is true on average. The current article addresses these research questions.
Potential Benefits of Virtual First Dates
Virtual dating may provide a more intimate and valuable experience than the standard online dating approach, which typically involves viewing pictures of potential dates, reading their profiles, and perhaps texting with them. This standard approach to online dating has several downsides. For example, when creating dating app profiles, individuals often alter their image in hopes of attracting more people (Kalinowski & Matei, 2011). Similarly, profiles contain limited information and may encourage users to form unrealistically positive expectations of new partners, which ultimately leads to first-date disappointment and discourages the formation of a romantic relationship (Ramirez et al., 2014; Sciara et al., 2021).
Virtual dates may not share these limitations: Virtual dates using personalized avatars and real-time text communication combat the expectancy violation experienced during face-to-face first dates and increase partner liking (Frost et al., 2007, 2008), and video dates prior to meeting in-person do not encourage partner idealization at the same rate as text-based communication (Antheunis et al., 2019; Sumner et al., 2024). Thus, virtual dating may enhance the online dating experience by mimicking the experiences of in-person dating and avoiding the expectancy costs associated with the standard online dating approach.
In fact, virtual first dates may even have fewer downsides than in-person first dates, especially if they feature realistic interpersonal processes. Virtual reality and virtual speed-dating elicit motivations, attraction to partners, and matching rates (i.e., mutual “yessing”) that are comparable to existing studies of in-person dates and speed-dating (French et al., 2024; Frost et al., 2008). In nonromantic settings, individuals in Zoom interviews reported feeling more comfortable discussing personal matters in a setting of their choosing, rather than one chosen for them (Gray et al., 2020). Finally, in-person first dates initiated through dating apps pose a safety risk (Gillett, 2021). Thus, virtual first dates should encourage comfort and decrease communication apprehension (Hammick & Lee, 2014).
Potential Costs of Virtual First Dates
However, virtual communication may lack some key components of a meaningful in-person conversation. Physical touch plays a critical role in physiological well-being and coupling, attachment, and regulating mental health (Cascio et al., 2019; Debrot et al., 2014; Jakubiak & Feeney, 2016; Triscoli et al., 2017). In addition, individuals often use touch to communicate romantic attraction on first dates (Cohen, 2015), and so it may be more difficult to gauge date success virtually. Furthermore, virtual communication does not typically allow individuals to see each other's full bodies, which may also detract from their ability to read behavioral cues (Grammer, 1990; Veenstra & Hung, 2011).
Individuals may feel the need to compensate for issues with nonverbal communication, thereby creating an exhausting and unenjoyable date experience. For example, individuals conversing over Zoom exert extra effort on nonverbal cues (e.g., nodding head, smiling) and volume control (Bailenson, 2021; Croes et al., 2018). Furthermore, virtual communication encourages prolonged eye contact because the individual’s face is the focus of the frame. This virtual-dating feature may heighten self-awareness and prevent individuals from fully engaging in the conversation (Aagaard, 2022). As a result, video dating interactions might interfere with daters’ ability to build trust and fluently communicate ideas (Duarte & Snyder, 2011; Gupta, 2024; Symons & Stenzel, 2007).
Virtual communication relies on an internet connection, and this requirement introduces a host of unique connectivity issues. Promptness in communication is tightly linked to communication quality and satisfaction (Loode, 2021), and individuals tend to interpret response delay negatively (Roberts et al., 2011). Therefore, delays caused by connectivity issues might decrease date success. In addition, virtual meetings follow a turn-taking conversation pattern, whereas live interactions feature more spontaneous shifts in conversation topics and expressions of new ideas (Aagaard, 2022; Oliffe et al., 2021). These disruptions to conversation flow may detract from key conversational dynamics (e.g., engagement, vocal mirroring) and make the interaction feel unsuccessful (Bernhold & Giles, 2019; Curhan & Pentland, 2007).
The Current Research
The current research, for the first time, directly compares in-person and virtual dates on several key outcomes. To better understand initial romantic impressions and date enjoyment, we analyzed (in both studies) a set of evaluative variables (e.g., liking for the date, attachment to the date, and perceptions of the date’s attributes) that are commonly assessed in initial attraction contexts (Eastwick et al., 2023; Tidwell et al., 2013).
In Study 1, we explored whether online participants predict that in-person first dates fare better than virtual first dates. Given the mixed evidence reviewed above, there are reasons to be agnostic about whether virtual dates or in-person dates are associated with better attraction and matching outcomes. Nevertheless, if the negative impressions of virtual dating articulated in Vogue reflect a general sentiment, then people might harbor the abstract belief that virtual dates are inferior, analogous to the way they predict that interactions with strangers are less enjoyable or that deep conversations are more awkward than in reality (Epley & Dunning, 2000; Epley & Schroeder, 2014; Epley et al., 2022; Kardas et al., 2022). To test this idea, we adapted Epley and Schroeder’s (2014) Experiment 1 procedure. In this study, Epley and Schroeder asked participants to predict whether talking to a stranger on the train would be enjoyable, and their predictions underestimated the extent to which other participants reported that talking to a stranger on the train was actually enjoyable. Our Study 1 captures participants’ predictions in a similar manner: We asked a sample of online participants to imagine going on dates both on Zoom and in-person to see if they predicted that date outcomes would be superior in-person.
To capture the virtual versus in-person dating reality, Study 2 drew from a set of real-life blind dates who met through a matchmaking service. Some of these daters met face-to-face at traditional dating locations, whereas others met using Zoom or a similar interactive video platform. All of these daters had access to very minimal information about their prospective partners ahead of time (i.e., no dating profiles were available). Following their dates, participants reported on their date outcomes (using the same measures as in Study 1), which enabled us to compare whether in-person dates are actually superior to virtual dates.
Study 1: Lay People’s Predictions
Methods
Transparency and Openness
We preregistered an analysis plan for this experiment, including the planned sample size and exclusion criteria; we did not record a priori hypotheses. Data, materials, and the preregistration document are posted on OSF: https://osf.io/pkf9x/overview?view_only=e420f876a3d64eed9c0f3ca970787557
Participants
We recruited 200 participants via CloudResearch in early November of 2024. Participants were 41 years old on average (SD = 10.7). Participants identified as male (n = 115), female (n = 84), and non-binary (n = 1). Sexual orientation was distributed as heterosexual (n = 180), bisexual (n = 14), graysexual (n = 3), asexual (n = 2), and pansexual (n = 1). Additionally, participant race/ethnicity was distributed as white (n = 158), Black (n = 19), Asian (n = 15), Hispanic/Latinx (n = 12), Native American (n = 4), bi/multiracial (n = 4), and Middle Eastern (n = 1). Participants were able to select multiple races/ethnicities to best describe their identity. Furthermore, 33% of participants reported being single (n = 66), and the remaining participants reported being in a relationship (n = 134). On average, these relationships were 8.16 years in length (SD = 7.80). Lastly, as specified in our preregistered analysis plan, 39 participants were removed from the analyses because they incorrectly responded to either the attention check questions or the comprehension check questions, yielding a final N of 161.
Procedure and Materials
This study used a within-subjects experimental manipulation: Participants answered questions about both (a) a Zoom first date (Zoom condition) and (b) an in-person first date (In-person condition), presented in a counterbalanced order. The prompts for the two conditions encouraged participants to imagine themselves on a generic first (blind) date: Imagine that you are set up on a blind first date with someone online. You know very little about your date and agreed to have a date on Zoom to get to know each other [. . .agreed to have a date at a local restaurant or café in-person to get to know each other]. You pick a comfortable spot, set up your laptop, and join the Zoom call. [You arrive at the restaurant and. . .] You act as you normally would on a date. You try to make a good first impression, share life stories, and laugh. Once the date ends, you consider how it went overall and how much you liked your partner. Imagine your date just ended, and the folks who set you up on the blind date have asked you the following questions. If you are unsure of your response to any of these questions, take your best guess.
Following each prompt, participants completed a series of questions where they predicted how they would rate their dates’ attributes and overall date outcomes. After answering these questions, they completed the other condition.
Date Type Comprehension Check
Participants were asked, “To check, were you imagining a Zoom date or an In-Person date just now?” for both condition prompts. Participants could respond “Zoom” or “In-person,” and we removed all participants who incorrectly responded to this question (n = 33).
Date Length
Participants were asked, “Approximately how long do you think your date was (in minutes)?” The average predicted date length for in-person dates was 86 minutes (SD = 39.34), whereas the average for Zoom dates was 49 min (SD = 30.64).
Second Date Agreement
Participants were asked, “Would you be interested in or have you already had a second date with X?” Participants responded “no” or “yes,” and these responses were dummy coded 0 and 1, respectively.
Overall Rating
Participants responded to a 5-point item asking about their overall experience (1 = awful, 2 = bad, 3 = fine, 4 = good, 5 = great).
Date Enjoyment, Attraction, and Great Partner
Participants responded to three items on a 5-point scale (1 = strongly disagree, 5 = strongly agree). We measured date enjoyment using the item, “I enjoyed spending time with my date.” To assess date attraction, we used the item, “I was attracted to my date.” The great partner item was, “My date seemed like a great romantic partner for me.”
Partner-Specific Attachment
Participants completed items on a 5-point scale (1 = strongly disagree, 5 = strongly agree) to measure partner-specific attachment avoidance and partner-specific attachment anxiety while on their dates. Partner-specific avoidance was reverse coded in all analyses below and was measured with the item “I felt comfortable opening up to my date.” Partner-specific anxiety was measured with the item “I worried that my date didn’t like me as much as I wanted.”
Safe Haven and Secure Base
We measured safe haven and secure base using one item each on a 5-point scale (1 = strongly disagree, 5 = strongly agree). To assess safe haven, we used the item “My date has the potential to become someone who helps me feel better when something bad happens to me or I feel upset.” To measure secure base, we used the item “My date has the potential to become someone I would want to tell if I achieved something good.”
Date Attributes
Participants rated the extent to which 14 different traits characterized their date on a 5-point scale (1 = strongly disagree, 5 = strongly agree). These traits were: physically attractive, sexy/hot, good career prospects, ambitious/driven, fun/exciting, funny, responsive, dependable/trustworthy, friendly/nice, charismatic, confident, assertive, smart, and intellectually sharp (Tidwell et al., 2013).
Attention Check
Participants were asked to answer two text interpretation questions as a part of a Winograd-like schema attention check (Levesque et al., 2012): “A ragdoll cat is hungry after playing with his favorite toy. His owner feeds him salmon, but he prefers tuna. To retaliate, he rips her books. In response, she takes away his scratching post.” The two questions included, “What is the cat’s favorite food?” and “Whose books were ripped up?” We excluded from analyses participants who incorrectly responded to one or both of these questions (n = 14).
Results
Table 1 displays the averages across all variables for participants’ predictions about their first dates in both the Zoom and in-person conditions. Overall, participants seemed to believe that dates in the in-person first-date condition would fare better than dates in the Zoom condition: Other than anxious attachment, participants predicted that the in-person dates would be better than the Zoom dates (average d = 0.33), and 19 of the dependent measures remained significant after a Bonferroni correction. Furthermore, participants predicted that in-person dates would last roughly twice as long as Zoom dates. In other words, participants generally believed that an in-person date would fare better than a Zoom date across a variety of first-date outcomes.
Paired Samples t-Test for Expected In-Person and Zoom First-Date Outcomes.
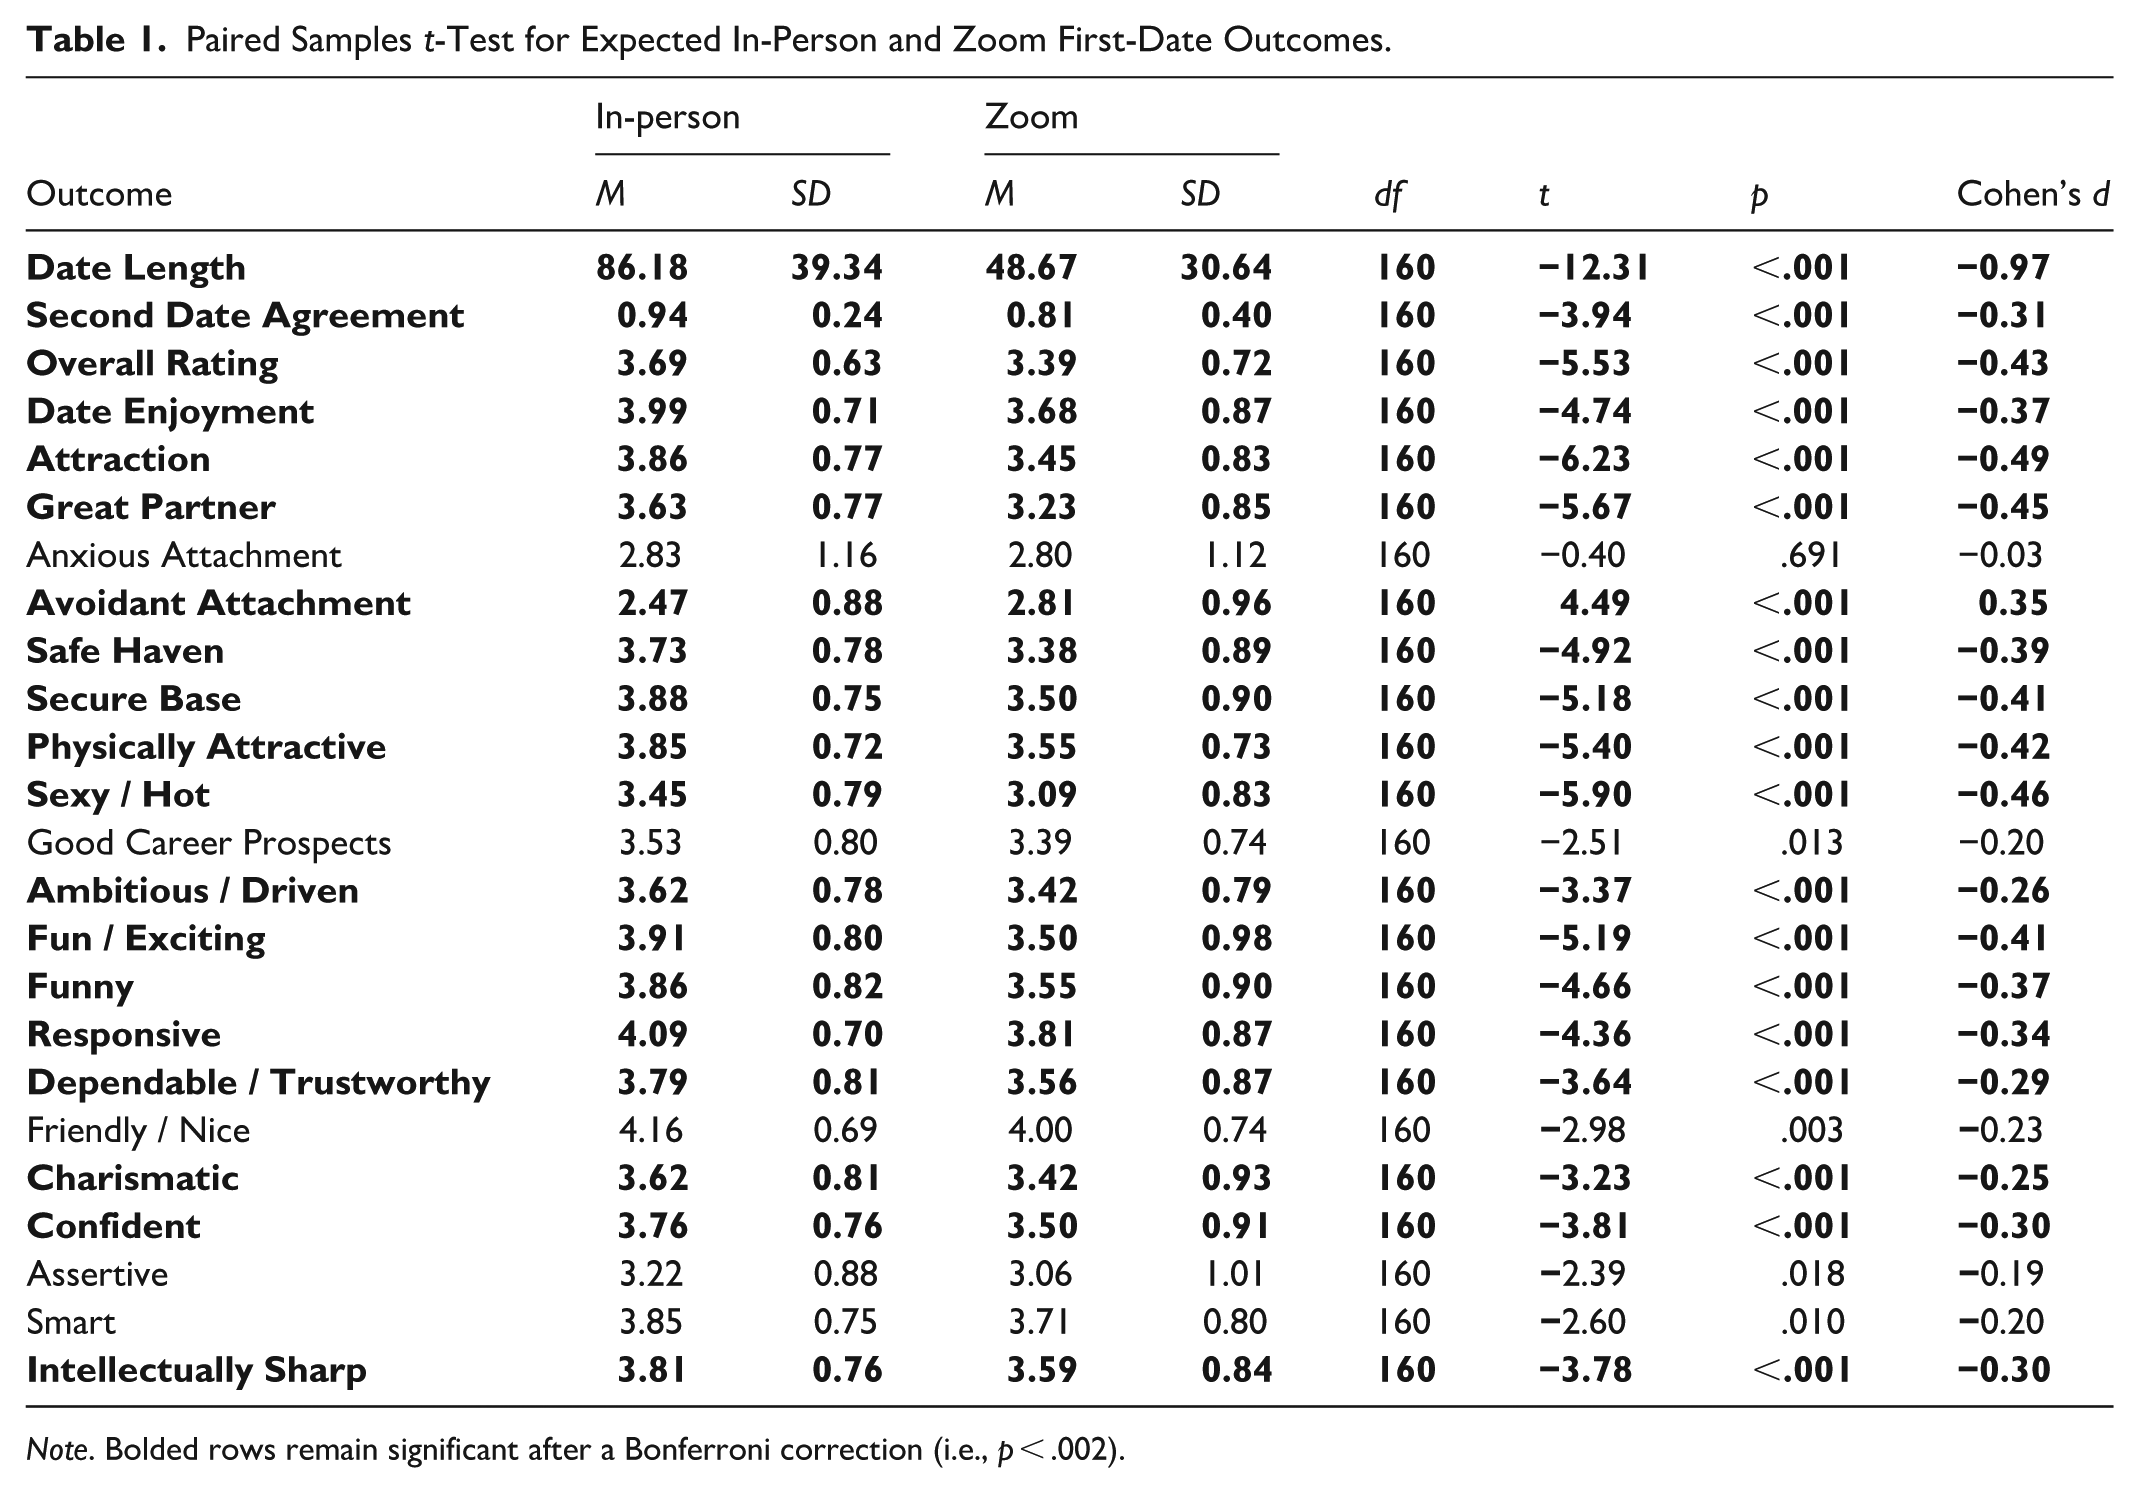
Note. Bolded rows remain significant after a Bonferroni correction (i.e., p < .002).
Additionally, we asked participants where they anticipated a second date to occur. If the first date were held on Zoom, were individuals expecting a second date to be on Zoom or in-person? The majority of participants imagined second dates would be held in-person for both in-person (M = 0.99, SD = 0.11) and Zoom first dates (M = 0.83, SD = 0.38), but these estimates were significantly higher for the in-person condition, t(160) = 5.31, p < .001.
Lastly, we conducted a repeated measures ANOVA in R to test whether the in-person versus Zoom manipulation was moderated by participants’ relationship status (i.e., single vs. in a committed romantic relationship). It was possible, for example, that partnered participants predicted that Zoom dates would be especially unpleasant. However, relationship status (coded 1 = partnered, 0 = single) did not significantly interact with condition when predicting any of the 24 outcomes in Table 1. Thus, we concluded that our manipulation worked similarly regardless of participants’ relationship status.
Discussion
We prompted each participant with a short paragraph describing a blind first date for two conditions (i.e., in-person and Zoom). Following each condition, participants completed a questionnaire that inquired about how well they predicted the date would go. Participants imagined that in-person first dates would be significantly longer, more successful overall, more likely to lead to a second date, and would allow for more favorable first impressions of their date’s attributes. In other words, participants’ predictions more or less matched the apparent public sentiment that virtual dates are considerably inferior to in-person ones.
Previous research has established that humans harbor incorrect beliefs about certain forms of social interaction (Epley & Schroeder, 2014; Kardas et al., 2022). So, when people predict in-person first dates to have better overall outcomes than virtual first dates, are their predictions accurate? Extant research has identified virtual interactions as a meaningful substitute for in-person communication (Canale et al., 2021; French et al., 2024; Mignault et al., 2024), thus virtual first dates may hold more advantages than participants in this study seemed to expect. To investigate this idea, we collected data using an established matchmaking service to identify actual differences in first-date outcomes across in-person and virtual date settings.
Study 2: Daters’ Experiences
Methods
Transparency and Openness
We did not record a preregistration for this study; several of the authors were already familiar with this dataset before analyses began. Data and materials are posted on OSF: https://osf.io/pkf9x/overview?view_only=e420f876a3d64eed9c0f3ca970787557
Participants
Participants were 6,262 individuals who were either clients (n = 1,737) or members (n = 4,525) of an established matchmaking service operating in the United States. Clients paid to be set up on dates with a set number of different partners, and members paid a smaller amount to be in a pool of potential dates for the clients. (The client vs. member distinction did not moderate the core findings; see the supplemental material for details.) Between October 2023 and January 2024, this matchmaking service paired users up on N = 4,542 blind dates (generating a dataset of N = 9,084 dyadic reports). In total, n = 4,286 participants attended one date, n = 1,330 attended two, and n = 646 attended three or more dates (for more details, see also Eastwick et al., 2025).
On average, participants were 46.8 years old (SD = 11.6). Participants identified as male (n = 3,163), female (n = 3,070), transgender (n = 9), and gender queer (n = 8). The race/ethnicity of participants was distributed as white (n = 4,365), Black (n = 532), multiracial (n = 514), Asian (n = 287), Hispanic/Latinx (n = 247), South Asian (n = 209), Middle Eastern (n = 59), no response or another race not listed (n = 37), Pacific Islander (n = 11), and American Indian (n = 1). Lastly, participants specified their relationship status as single (n = 3,037), divorced (n = 2,677), widowed (n = 292), dating (n = 94), separated (n = 91), in the process of divorcing (n = 54), and another status not listed (n = 5).
Procedure
Participants first completed questionnaires on the matchmaking service website, including items about their demographics and romantic preferences. Matchmakers then drew from these preferences to set participants up on blind dates with each other, and the matchmakers also arranged the format, timing, and location of the date. Dates were set up on Zoom, rather than in-person, if the participants’ schedules were not consistent enough to organize a date in-person, if the participants lived in different states, if participants indicated wanting to meet over Zoom before meeting in-person, or if a participant canceled an in-person date and opted to have a brief Zoom call instead. Participants received very minimal information about their date in a message from their matchmaker beforehand (e.g., a list of interests or hobbies, an approximate age range, and basic details such as number of children). After each date, both participants completed a follow-up questionnaire about the date (required by the service), which included many of the same measures from Study 1.
There were two optional, supplemental surveys that some participants opted to complete. The first was an optional survey that included several individual difference measures, including the Big Five, attachment style, sociosexuality, and self-reports of the Tidwell et al. (2013) traits from Study 1. A total of n = 1,965 participants (comprising n = 3,015 reports) completed at least one item on this first survey. The second was an optional survey that participants could complete after they completed the required follow-up questionnaire about each date. On this survey, participants rated their date on the 14 Tidwell et al. (2013) date attributes from Study 1. A total of n = 3,807 participants (comprising n = 4,914 reports) completed at least 1 of the items on this second survey.
Measures
Date-Specific Measures
The second date agreement, overall rating, date enjoyment, attraction, great partner, partner-specific anxious and avoidant attachment, safe haven, secure base, and the (optional) 14 date-attribute items were identical to those in Study 1. The date type and date length measures differed slightly from those used in Study 1. For date type, participants were able to select “Zoom,” “In-Person,” or “Other.” For the purposes of our analyses, we only included participants who indicated Zoom or in-person date type (only n = 44 selected “other” or left the question blank). About 83% of the dates were in-person (n = 7,499) and roughly 17% were via Zoom (n = 1,541). For date length, participants were asked how long their date was in hours. The average date length for in-person dates was 2.14 h (SD = 0.91), whereas for Zoom, dates averaged 1.04 h (SD = 0.55). In addition, a subset of the Zoom dates (n = 94) was limited to exactly 25 min, likely because the free version of Zoom timed out. For participants who reported a range of hours for date length (e.g., “2–3 hours”), we used the lesser reported value (e.g., 2); for participants who reported an inexact value or educated guess (e.g., “more than 1.5,” “less than 1.5,” “maybe 1.5?”) we took the reported value (e.g., 1.5). Values were left blank when participants responded “0” or indicated a fractional date length (e.g., 0.07291666) which was challenging to interpret.
Individuals responded to the same item measuring “Overall Rating” of the dates, as in Study 1. However, if participants in this study indicated a date rating less than “fine” (i.e., awful or bad), they were asked for further information by the matchmaking service to aid with planning future dates.
Individual Difference Measures
All participants reported their birthday during the signup process (and it was used as part of a criminal record check); we used this information to calculate each person’s age on the day they went on the date, rounded down to the nearest whole number. Participants who completed the optional individual differences questionnaire also completed a 20-item measure Big Five (Donnellan et al., 2006) capturing extraversion (α = .76), agreeableness (α = .64), consciousness (α = .69), neuroticism (α = .60), and openness (α = .66); a 12-item measure of attachment avoidance (Wei et al., 2007; α = .64) and attachment anxiety (α = .70), a 3-item measure of sociosexual attitudes (Penke & Asendorpf, 2008; α = .74), and self-reports of the 14 Tidwell et al. (2013) attributes from Study 1. The Big Five, attachment style, and sociosexuality were measured using 1 to 11 scales, and the 14 self-report attributes were measured using 1 to 5 scales.
Results
Primary Analyses
Table 2 depicts the means for in-person and Zoom dates across all variables. The largest difference by far was that Zoom dates were shorter than in-person dates—by about an hour on average, and this effect size roughly matched the Study 1 predictions. Otherwise, the effect sizes for the evaluative variables (i.e., variables other than date length) were very small, with an average d = 0.01. Participants were slightly more likely to say “yes” to seeing their date again on the Zoom dates than the in-person dates (i.e., the opposite of the direction anticipated by the Study 1 participants), and the few remaining significant differences did not remain significant after a Bonferroni correction. These findings are inconsistent with participants’ predictions from Study 1 but consistent with previous research, which has established that virtual dating encourages interpersonal processes, development of liking, and partner evaluations to unfold similarly to in-person interactions (Antheunis et al., 2019; French et al., 2024; Frost et al., 2008). Furthermore, we ran additional analyses excluding the portion of participants whose dates appear to be cut short due to Zoom restrictions (n = 93). When these dates were removed from the analysis, effect sizes changed by an average of d = 0.02, with the largest shift being only d = 0.04.
Participants’ Experiences on In-Person Versus Zoom First Dates.
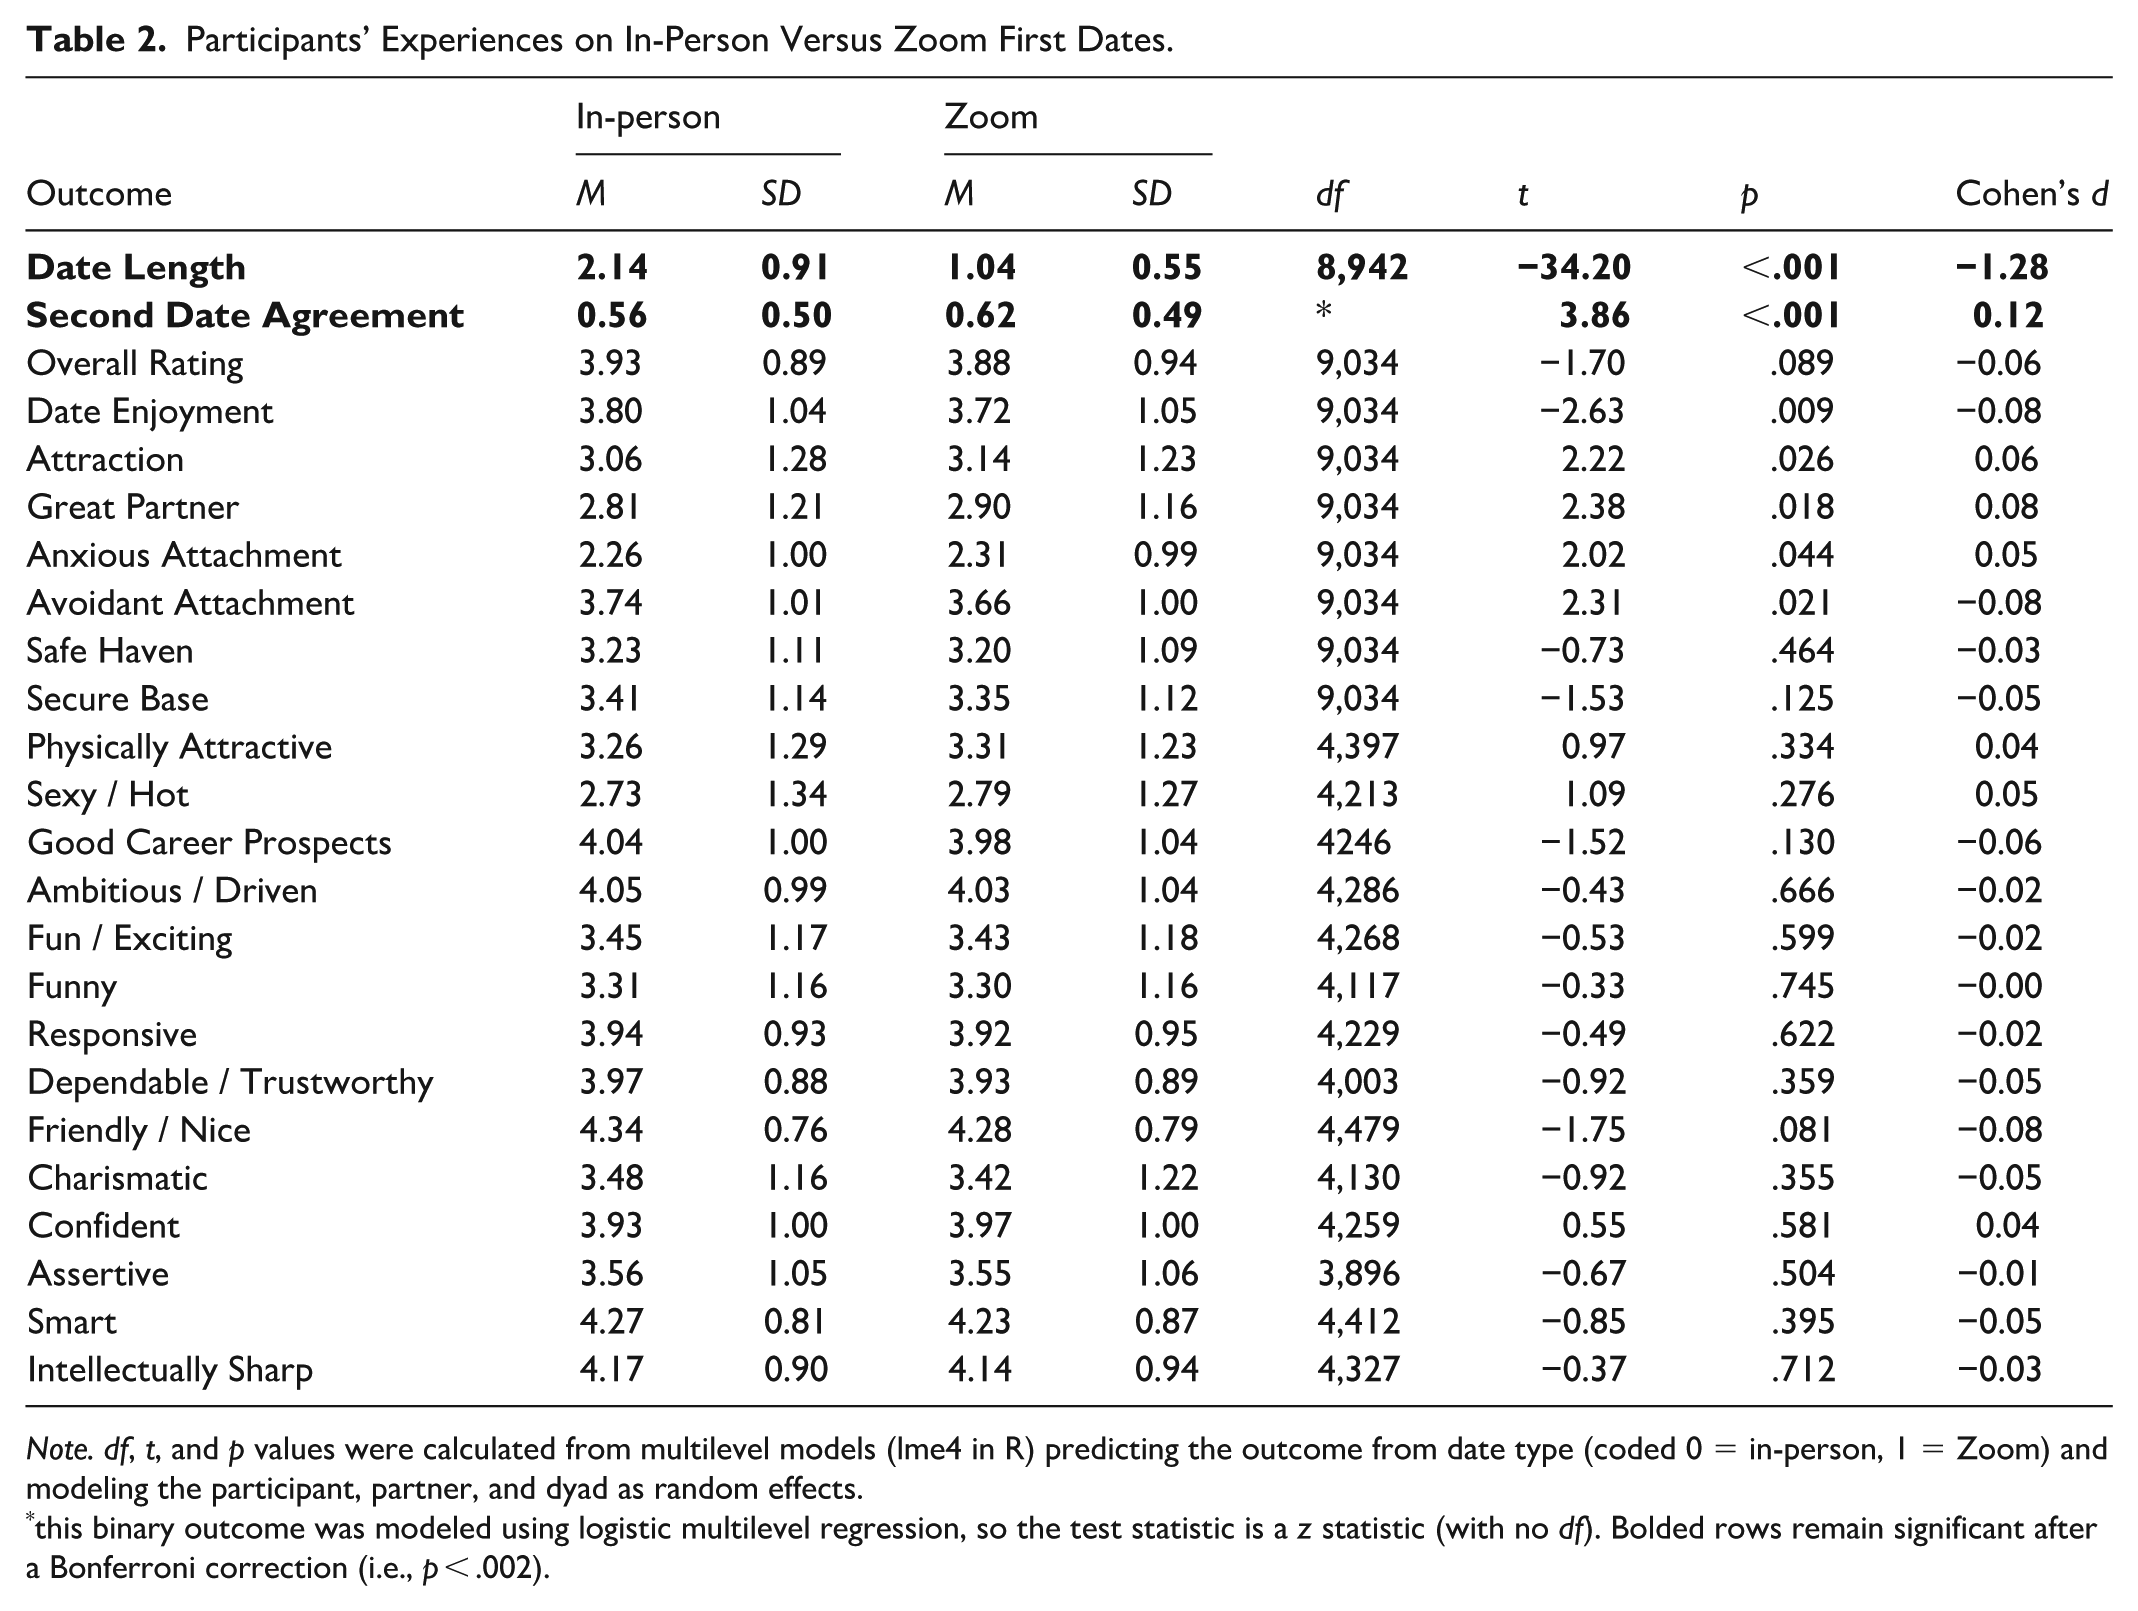
Note. df, t, and p values were calculated from multilevel models (lme4 in R) predicting the outcome from date type (coded 0 = in-person, 1 = Zoom) and modeling the participant, partner, and dyad as random effects.
this binary outcome was modeled using logistic multilevel regression, so the test statistic is a z statistic (with no df). Bolded rows remain significant after a Bonferroni correction (i.e., p < .002).
Table 3 displays correlations between date length and all variables separately across in-person and Zoom dates. On average, correlations between each variable and date length appear slightly higher for in-person dates (average r = 0.22) than Zoom dates (average r = 0.17). However, the correlation coefficients were small-to-medium sized on both kinds of dates and—with the exception of anxious and avoidant attachment—positive. Thus, despite the difference in date setting, individuals on longer dates appeared to be more likely to enjoy the date itself and more likely to have a favorable impression of the date partner.
Date Length Associations Across In-Person and Zoom Dates.
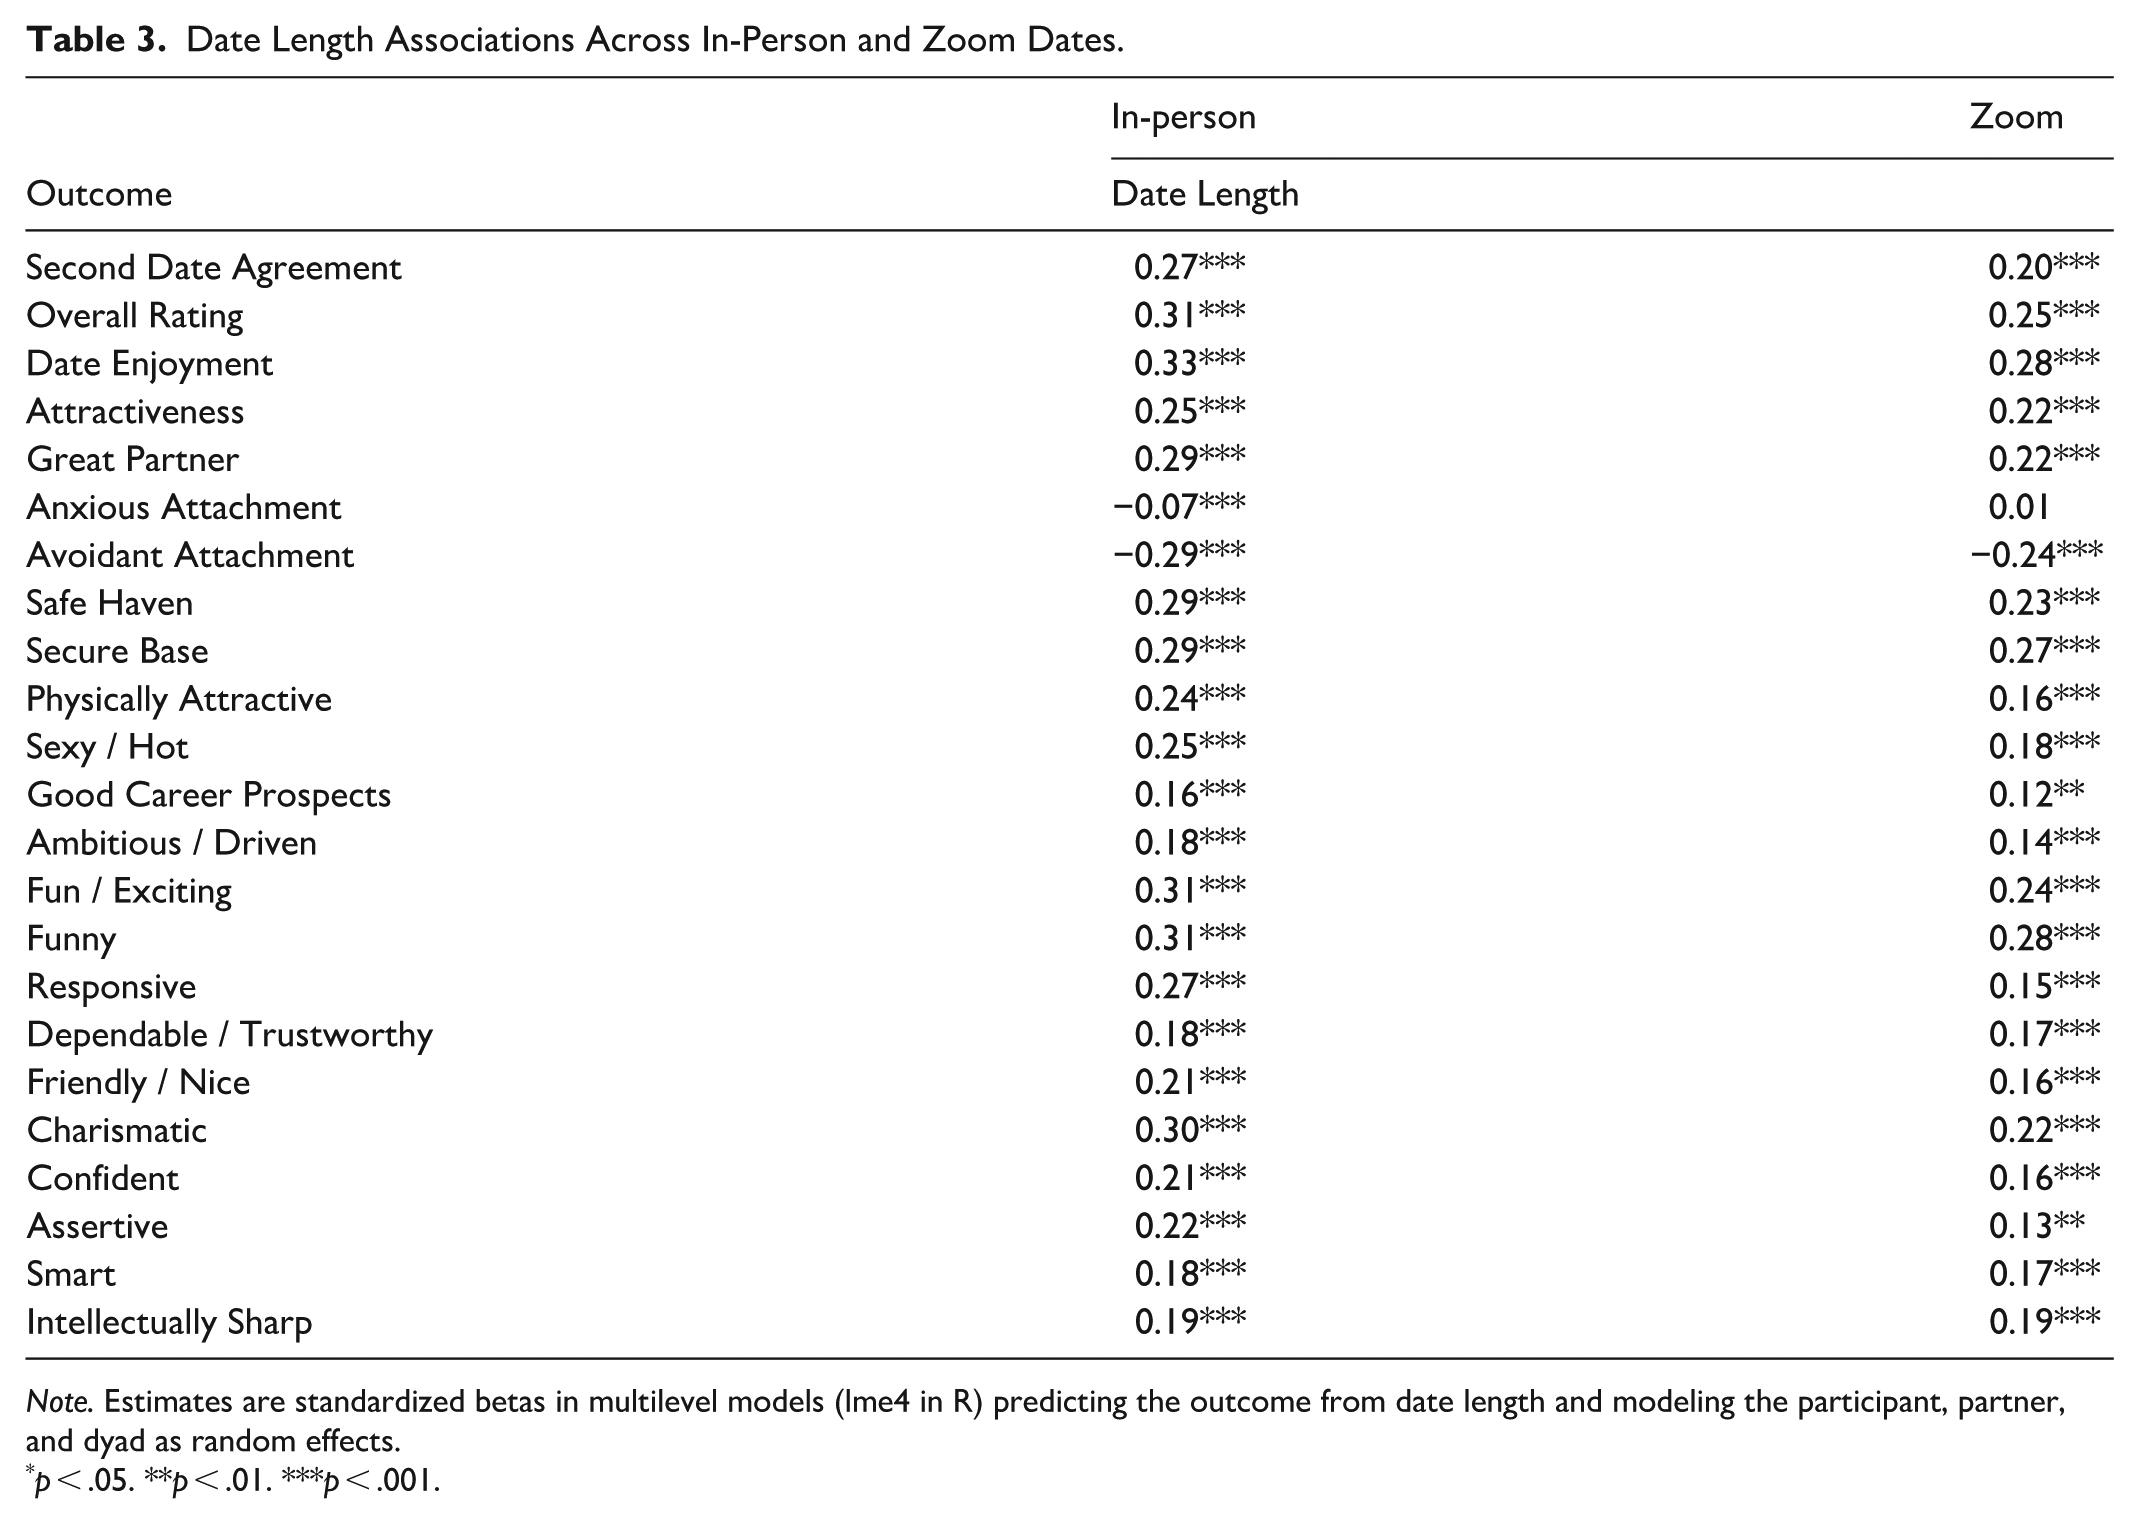
Note. Estimates are standardized betas in multilevel models (lme4 in R) predicting the outcome from date length and modeling the participant, partner, and dyad as random effects.
p < .05. **p < .01. ***p < .001.
The fact that longer dates were generally better dates (Table 3) bolsters our decision to include date length alongside the other outcome measures (Tables 1 and 2). However, the familiarity-attraction causal effect (Reis et al., 2011) would imply that date length could be conceptualized as a predictor of positive outcomes instead. We report an analysis predicting the outcome measures from both date type and date length in the supplemental materials; in this analysis, both date type and date length had positive predictive effects, such that the difference between an in-person and Zoom date had approximately the same positive predictive effect as spending one more hour on the date.
Additional Analyses
Social Relations Model Analyses
The Social Relations Model (SRM) is an approach that decomposes a given construct into actor variance (i.e., some people experience more attraction than other people), partner variance (i.e., some people are more attractive than other people), relationship variance (i.e., people experience attraction for each other person uniquely, above and beyond actor and partner variance), and measurement error (Kenny, 2019; Kenny & La Voie, 1984). The current dataset does not afford the common round robin or blocked designs that are optimal for the SRM. But at the advice of the developer of the SRM (Kenny, August 6, 2025, personal communication), we transformed the dataset into a one-with-many design (Marcus et al., 2009) by reducing the dataset to contain only those dates where (a) one of the participants (i.e., the “focal persons”) went on dates with two or more different partners (i.e., the “informants”), and (b) those partners (i.e., the informants) did not go on dates with anyone else. That reduction yields a dataset of N = 796 focal persons and N = 1,833 informants (i.e., N = 1,833 dates and N = 3,666 reports). Although this one-with-many dataset is about 1/3 the size of the full dataset, it is still quite large by field-wide standards.
Using the procedures described in Eastwick and Hunt (2014), we conducted an SRM variance partitioning analysis on two constructs: initial attraction (comprised of the “attraction” and “great partner” items) and attachment (comprised the “safe haven” and “secure base” items). 1 The results of these analyses are presented in Table 4. Across both constructs, relationship variance was very large (i.e., over 30%), whereas actor and partner variance were in the small-to-medium range (i.e., 10–20%). That is, echoing the results of Eastwick and Hunt (2014), attraction was due more to the unique dynamics between the focal person and the informant (i.e., relationship variance) rather than the attractiveness of the focal person (i.e., target variance), and this difference was even more pronounced for the especially relational “attachment” outcome measure. As in other SRM studies of romantic attraction (Eastwick et al., 2008; Kenny, 2019), generalized reciprocity tended to be negative (i.e., likers were not well liked) and dyadic reciprocity tended to be positive (i.e., someone who uniquely liked their partner was uniquely liked by that partner).
Social Relations Model Analysis for Attraction and Attachment.
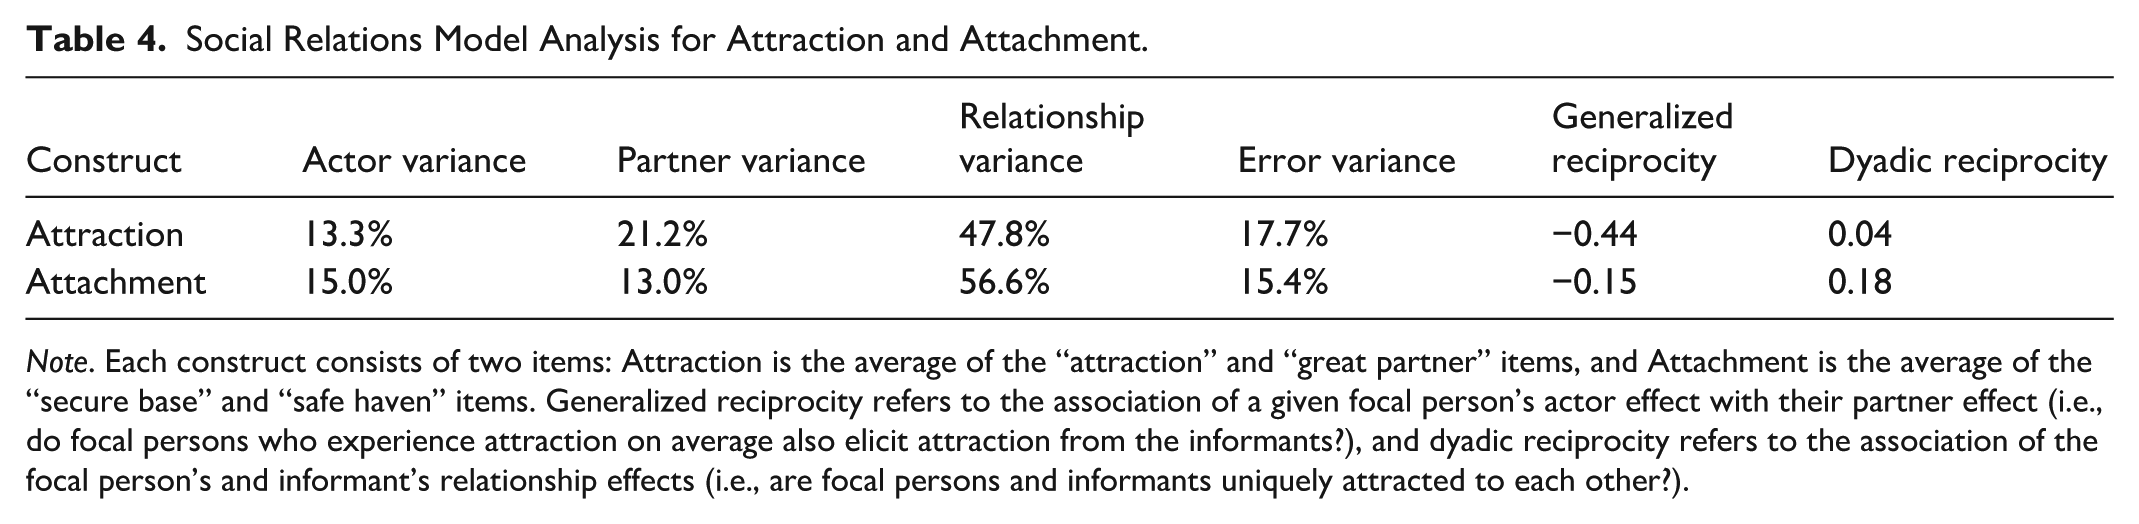
Note. Each construct consists of two items: Attraction is the average of the “attraction” and “great partner” items, and Attachment is the average of the “secure base” and “safe haven” items. Generalized reciprocity refers to the association of a given focal person’s actor effect with their partner effect (i.e., do focal persons who experience attraction on average also elicit attraction from the informants?), and dyadic reciprocity refers to the association of the focal person’s and informant’s relationship effects (i.e., are focal persons and informants uniquely attracted to each other?).
This analysis cannot be run separately by date type (Zoom vs. in-person), but we can control for date type as a binary variable. This analysis caused the variance results to change only minimally for actor variance (average = 0.3% change), partner variance (average = 0.2% change), and relationship variance (average = 0.5% change). In other words, both the Zoom and in-person dates seemed to exhibit SRM dynamics that match other initial attraction studies: daters evidenced some actor variance, some partner variance, and copious amounts of relationship variance.
Individual Differences Analyses
As noted above, practical and logistical concerns were the primary drivers of the matchmakers’ decisions to set daters up on Zoom versus in-person dates. Nevertheless, the date type variable was not randomly assigned, and it is possible that the Zoom versus in-person daters themselves differed in systematic ways that had downstream consequences. For example, extraverts might have been both more likely to go on—and enjoy—in-person dates because they cater to extraverts’ desire for immersive socializing.
Table 5 displays age and the self-reported traits from the individual differences questionnaire, separately for in-person and Zoom dates. All of the differences were small, and none of them significantly differed by date type. 2 These small differences are consistent with the idea that the matchmakers’ decisions to set participants up on in-person versus Zoom dates were not strongly driven by the attributes of the participants.
Actor Traits Across In-Person and Virtual Dates.
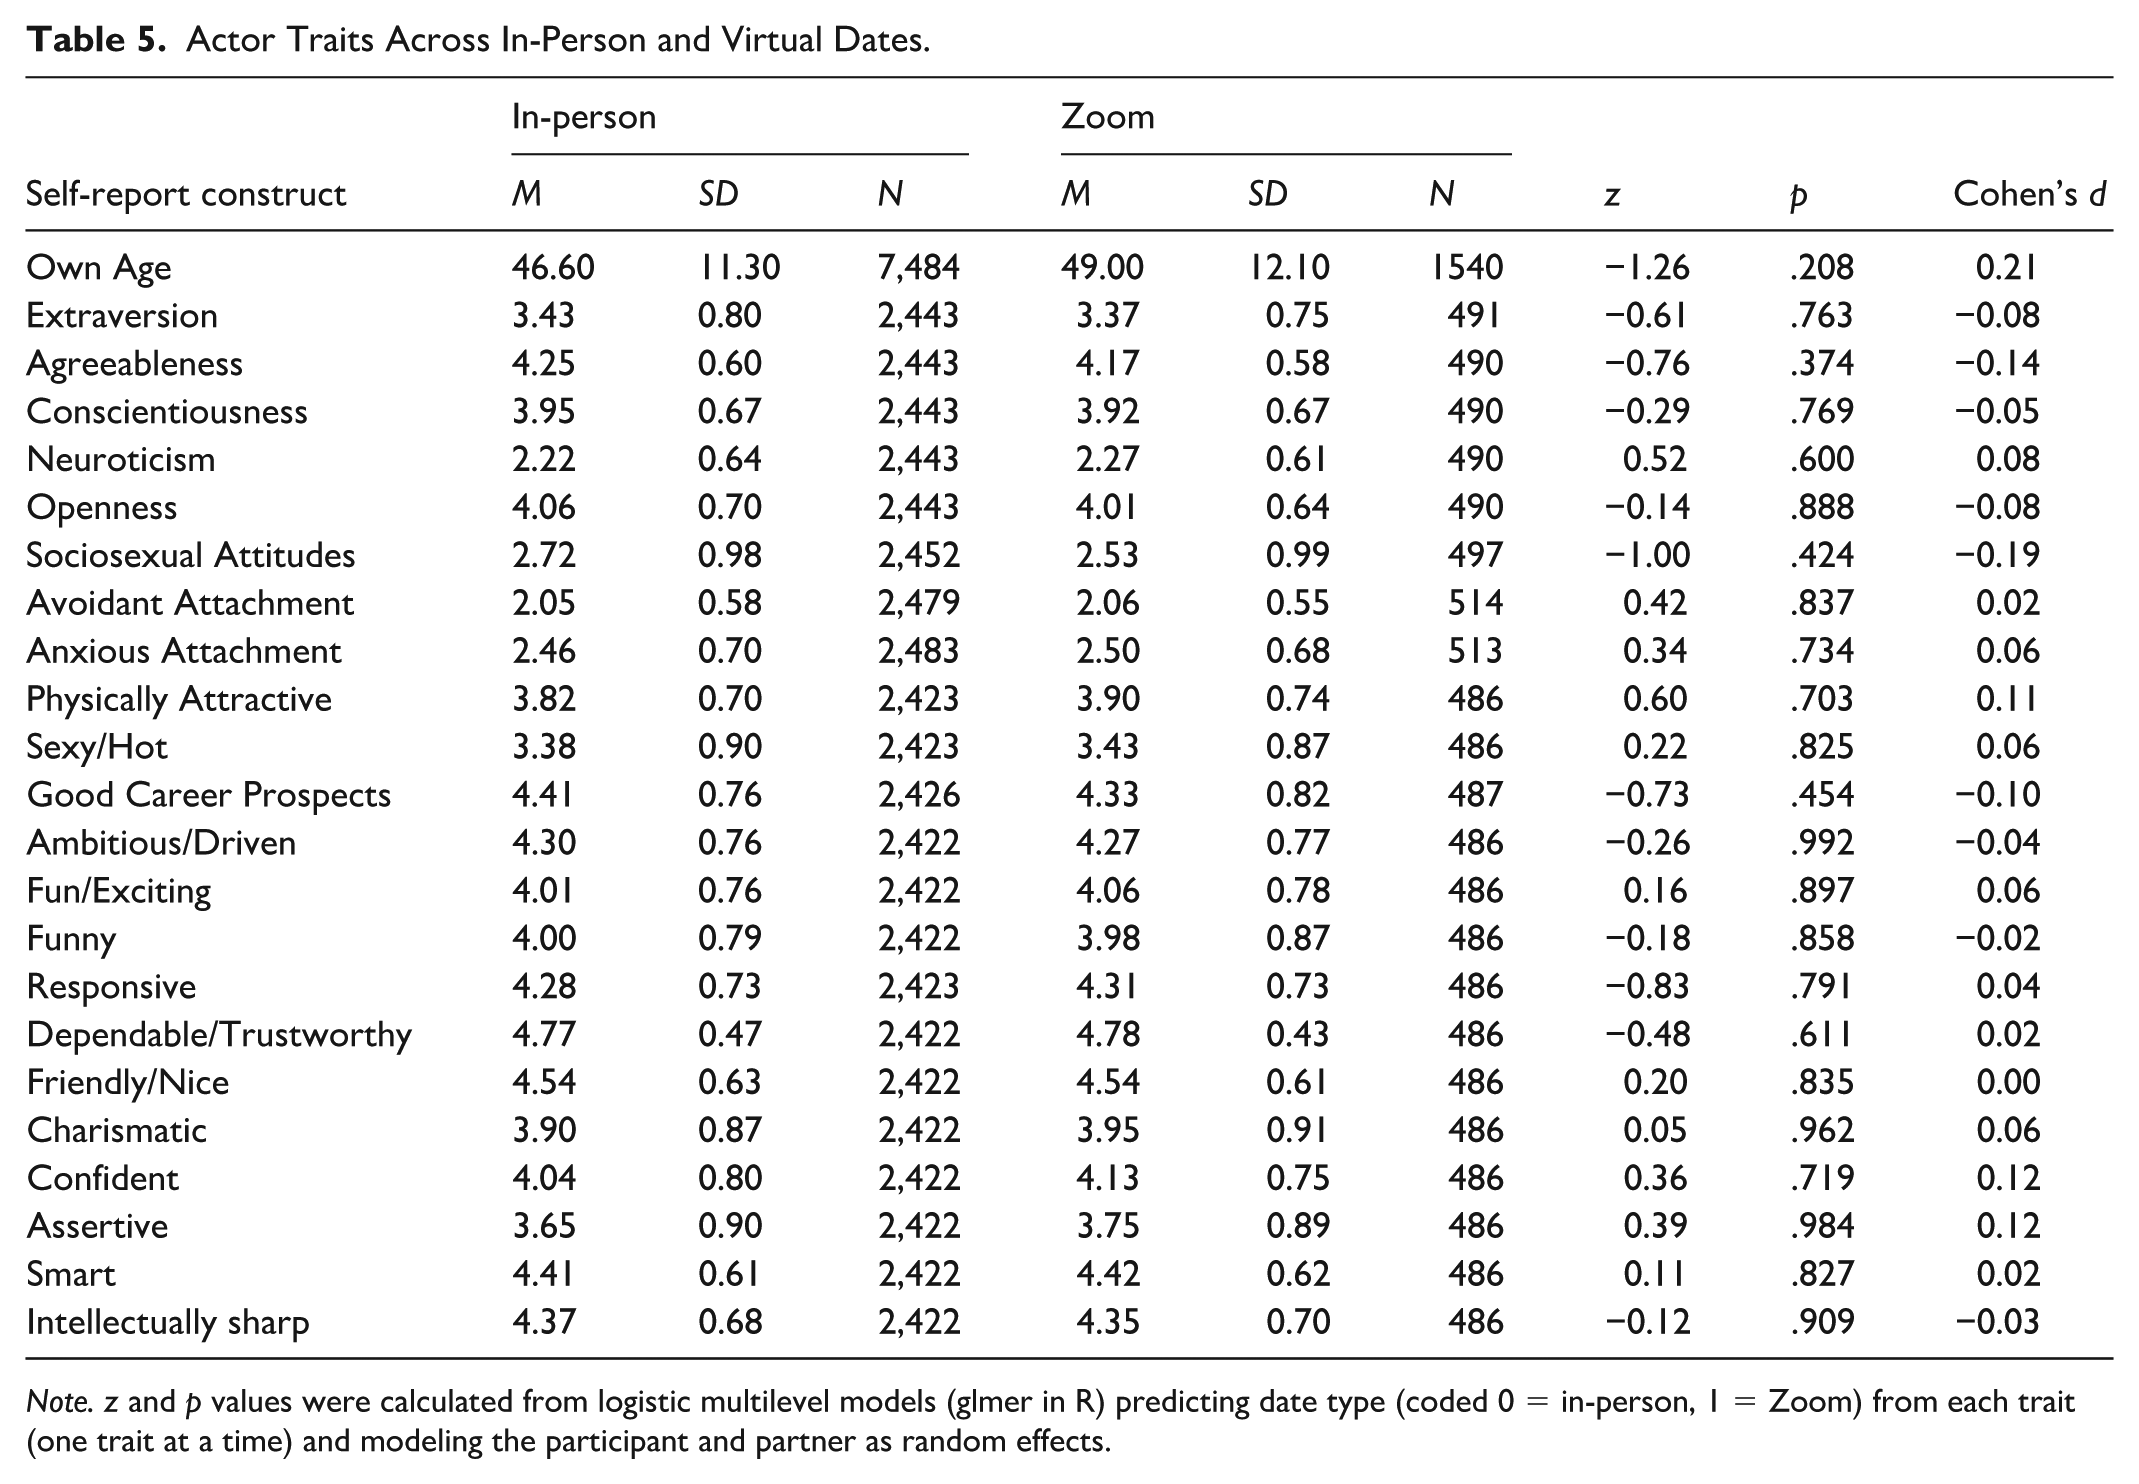
Note. z and p values were calculated from logistic multilevel models (glmer in R) predicting date type (coded 0 = in-person, 1 = Zoom) from each trait (one trait at a time) and modeling the participant and partner as random effects.
In the supplemental materials, we report the association of each of these attributes with the outcome variables, separately for the in-person and Zoom dates. Differences across date type were tiny; in other words, we could find no evidence that certain types of people were especially likely to experience attraction on Zoom versus in-person dates.
Discussion
In this large study of blind dates, we found that virtual dates unfolded similarly to in-person dates: The differences between the two date types were small across the board, and very few reached significance. Generally, longer dates were better dates, and in-person dates tended to be longer than virtual dates. But on average, the additional length of the in-person dates did not seem to provide them with a meaningful advantage over the Zoom dates. It is possible that the length that people intuitively consider to be “long” differs systematically between the in-person and Zoom settings. In other words, a one-hour Zoom date may feel much longer than a one-hour in-person date, perhaps because in-person dates carry additional distractions (e.g., paying for food, talking to the waiter, random events in the environment that grab attention), whereas Zoom dates force daters to maintain a focused attention on each other.
We also conducted an SRM analysis on a one-with-many subset of these data. The results were consistent with other studies of initial attraction: The data revealed meaningful amounts of actor and partner variance and large amounts of relationship variance. If anything, the amount of partner variance in this study (17%) is a touch lower than what tends to emerge in speed-dating studies (25% on average; Kenny, 2019). It is conceivable that the longer time frame of these dates (relative to speed-dating) brought more relationship variance to the fore at the expense of partner variance; that is, people had time to move beyond simple consensual desirability and discover whether they could or could not find compatibility. This mechanism is consistent with the idea that, as people get to know each other, mate value recedes in importance and compatibility becomes even more important (Eastwick, 2026).
General Discussion
This article, for the first time, directly compared virtual and in-person first-date outcomes. First, in Study 1, a sample of online participants predicted that they would enjoy an in-person date more than a Zoom date. This finding aligns with popular media posts where individuals express their disdain and distrust in virtual-dating efforts (Taylor, 2020). However, our Study 2 sample of blind dates revealed preliminary evidence that first-date outcomes and perceived partner attributes differed only slightly across date type. In other words, individuals who actually dated via Zoom (vs. in-person) appeared to form similar impressions of their date partner and had similar opinions of how the date went overall. This pattern is consistent with prior research that established virtual dates as a meaningful tool for building interpersonal relationships (Antheunis et al., 2019; French et al., 2024; Frost et al., 2008), and it suggests that virtual dates may be yet another social situation that people routinely underestimate (Epley & Schroeder, 2014).
Date length was the one variable that revealed a large difference, such that in-person first dates tended to be over an hour longer than virtual dates. Given that date length was positively correlated with the evaluative outcomes in most cases, we might have expected in-person dates to fare better simply due to the fact that those dates were longer on average. Instead, the two date types were comparable, perhaps because the passage of time feels faster in-person than it does over Zoom. It is also possible that participants liked Zoom dates about as much as in-person dates because they (like the Study 1 participants) expected the Zoom dates to go poorly. In other words, if participants went into the Zoom dates with low expectations—but the actual Zoom dates were not all that bad—then participants’ evaluative ratings might have contrasted away from their low expectations.
Date type was not randomly assigned in this study, and the choice seems likely to have been driven more by logistical concerns than by stable qualities of the daters, as far as we can tell. Intriguingly, we could not find any evidence that participants with certain attributes or personality characteristics were more likely to end up on Zoom or in-person dates; we also could not find any evidence that these qualities affected whether participants liked their dates more in one context or the other. Then again, it is plausible that we lacked access to the most relevant individual differences, such as social anxiety, nor did we have any measure of the quality of participants’ Internet connection, which would likely impact attraction (as it did in Mignault et al., 2024). In summary, many people may find virtual first dates to be a convenient strategy for meeting potential partners, and future research may benefit from investigating how various date activities may contribute to discrepancies in evaluating date attributes and overall date success.
Strengths, Limitations, and Future Directions
This article has a number of strengths. Study 1 used an experimental design (drawn from Epley & Schroeder, 2014) to show that online participants generally believe that in-person dates are likely to have better outcomes than virtual dates. Study 2 found that this prediction did not receive support in a real-life, dyadic dataset not seen before in extant virtual-dating research. The large size of Study 2 also meant that we were able to precisely estimate the effect sizes for differences between date types. Further, the Study 2 dataset consists of responses from real individuals who are seeking a long-term partner, allowing for a more realistic commentary on first-date success and setting. In addition, we received responses from both date partners, which provides novel insight into the unfolding of blind first dates and date evaluation across date types.
This article also has some limitations. First, the Study 1 sample was a convenience sample of online participants, and the Study 2 sample consists of fairly well-off individuals who are able to afford matchmaking services. Thus, the population who made the predictions in Study 1 was not exactly the same as the population who went on the dates in Study 2. Also, real-life differences between in-person and virtual dates could be exacerbated for those who do not have stable access to the internet or the ability to travel long distances with relative ease.
The Study 2 dataset was provided by real-world daters who were set up on a virtual or in-person date for reasons of convenience—not by random assignment—and so we are unable to draw causal conclusions. Relatedly, we do not have access to daters’ preferences for going on an in-person or virtual date, and so we could not assess whether those preferences may have affected their date outcomes. Also, we did not follow the virtual daters to see if their second (presumably in-person) dates had different outcomes. It is possible that individuals on virtual dates did not feel as though they had gotten to know their partner sufficiently well to foreclose on future dates with the potential partner, and so they agreed to a second date to learn more. After all, in-person dates likely offer additional opportunities to learn about a partner’s nonverbal (e.g., how they carry themselves) and real-world behavior (e.g., how they treat the wait staff). It is conceivable that people make better dating decisions if they learn this information on a first, rather than a second, date.
Finally, our results have clear implications for the distinction between in-person and virtual blind dates. But dates that form through apps commonly follow a slightly different trajectory, such that matched users first text, then may interact via video chat, then meet in person. Therefore, the common tendency for people to engage in several rounds of texting before any virtual or in-person interaction could change how people form impressions across these two contexts. In fact, some research suggests that a moderate level of emailing and texting is ideal prior to a first in-person impression (e.g., Ramirez et al., 2014); it is unclear whether a little bit (but not too much) texting would similarly boost an initial virtual impression.
Conclusion
Virtual first dates may be a useful tool in screening potential romantic partners. The present research examined the role of date type (i.e., in-person vs. virtual) on date attributes and outcomes using an experimental predictions design (Study 1) and data from a U.S. based matchmaking service (Study 2). Many people appear to harbor the impression that in-person dates are superior to virtual ones. But across real-life, virtual and in-person dates, evaluative variables remained similar aside from date length. Impressions were largely comprised of relationships variance—some pairs were compatible, and others were not—and none of the individual differences we assessed seemed to differentially predict virtual versus in-person date success. Virtual dates are generally less time consuming yet seemingly encourage similar partner evaluations and date outcomes as in-person dates. So, there may not be a need to worry if your next first date happens to be virtual.
Supplemental Material
sj-docx-1-psp-10.1177_01461672251409231 – Supplemental material for In-Person and Virtual Dates are Comparable, But People Don’t Know It
Supplemental material, sj-docx-1-psp-10.1177_01461672251409231 for In-Person and Virtual Dates are Comparable, But People Don’t Know It by Elina Moreno, Eli J. Finkel, Kellie Ammerman and Paul W. Eastwick in Personality and Social Psychology Bulletin
Footnotes
Funding
The authors disclosed receipt of the following financial support for the research, authorship, and/or publication of this article: Funding provided by a UC Davis Small Research Grant awarded to the last author.
Declaration of Conflicting Interests
The authors declared no potential conflicts of interest with respect to the research, authorship, and/or publication of this article.
Supplemental Material
Supplemental material is available online with this article.
Notes
References
Supplementary Material
Please find the following supplemental material available below.
For Open Access articles published under a Creative Commons License, all supplemental material carries the same license as the article it is associated with.
For non-Open Access articles published, all supplemental material carries a non-exclusive license, and permission requests for re-use of supplemental material or any part of supplemental material shall be sent directly to the copyright owner as specified in the copyright notice associated with the article.