
Abstract
Despite growing recognition of the need for cross-national or cross-cultural validation of measures in social psychological research, a tension persists between proponents of measurement invariance and practitioners frustrated with stringent standards and ambiguous recommendations. This article critiques common applications of measurement invariance standards and proposes an alternative method for establishing cross-group validity. We highlight how measurement invariance emerged from concerns about fairness in high-stakes individual selections and is based on meta-theoretical assumptions usually irrelevant for drawing cross-societal comparisons. Using the General System Justification Scale as an example, we demonstrate how reliance on a nomological network can ensure meaningful group differences without meeting invariance criteria and show how non-invariance is preferable to approximate (or partial) invariance. We recommend that psychologists interested in cross-group comparisons isolate construct-relevant factors from method bias. Doing so requires defining a priori the goal of scale use and what is “societal” or “cultural” about what is being measured.
Keywords
“The numbers don’t remember where they came from.” (Lord, 1953, p. 751)
Cross-cultural researchers in personality and social psychology are increasingly concerned, not to say obsessed, with measurement invariance—whether or not an instrument assesses the same construct across different groups or conditions. This concern arises amidst growing international collaborations and access to cross-national datasets. Researchers now have the opportunity to compare attitudes, beliefs, and values across cultures, often by translating multi-item scales developed in one language (typically English) into others. These practices have heightened awareness of the problem of ensuring accurate interpretation of group differences observed with such scales. Does the scale measure the theoretical construct in the same way across groups? Without providing affirmative evidence, it is often claimed that group differences are misleading at best. Measurement invariance has therefore become a major concern in many areas of psychology (He & van de Vijver, 2012; Steenkamp & Baumgartner, 1998; van de Vijver & He, 2016; Vandenberg & Lance, 2000; Vesper et al., 2022).
Despite improvements in statistical sophistication in recent years, the application of measurement invariance techniques remains piecemeal and controversial. Researchers rarely adhere to recommended practices for demonstrating evidence of strict invariance (Putnick & Bornstein, 2016; Rios & Sireci, 2014; Vandenberg & Lance, 2000). When they do, most scales fail to meet recommended thresholds—a problem that pervades general psychology (Maassen et al., 2023), personality psychology (Dong & Dumas, 2020), political psychology (Vesper et al., 2022), and cross-cultural psychology (Boer et al., 2018). The reluctance to conduct and report the results of measurement invariance testing may come from ignorance or fear of article rejection because of how easy it is to violate these standards. The sheer ease of violating measurement invariance in large-scale international studies has led to publications discouraging the cross-national or cross-cultural study of well-known theoretical constructs (Iurino & Saucier, 2020; Sokolov, 2018; Vesper et al., 2022), making the issue more pressing than ever.
Although advocates insist on the necessity of measurement invariance for drawing valid multigroup comparisons (Davidov et al., 2014; Meuleman et al., 2023), others have cast doubt on their underlying premises (Funder & Gardiner, 2024; Robitzsch & Lüdtke, 2023; Welzel, Brunkert, et al., 2023). Thus, in the midst of growing debates about the necessity of measurement invariance, practitioners find themselves caught between contradictory recommendations, wondering if strict standards might actually impede culturally conscious psychological research.
We argue that the application of measurement invariance standards in some areas of psychology has been misguided, and invariance is often unnecessary in comparative research. The concept of measurement invariance emerged as a strong response to eugenicist claims about racial differences in intelligence, but these original concerns were about fairness, equality, and social justice in selection and are irrelevant to many contemporary investigations in social, cultural, and political psychology. Although measurement invariance techniques continue to be valuable for eliminating social influences in the context of individual selection, their meta-theoretical assumptions contradict the very purpose of many cross-national studies, in which theoretical constructs are expected to reflect societal or cultural nuances that contribute to group differences. Building upon a handful of recent critiques and recommendations (De Los Reyes et al., 2022; Funder & Gardiner, 2024; Minkov et al., 2024; Welzel & Inglehart, 2016), we reject the blanket use of measurement invariance testing in psychology.
We use cross-country data pertaining to the General System Justification (GSJ) Scale (Kay & Jost, 2003) to demonstrate how and why social psychological instruments frequently violate measurement invariance criteria in multigroup comparisons. This analysis illustrates several unfortunate consequences of adhering blindly to invariance standards in cross-national research. Comparative research in many areas of psychology requires distinct psychometric evaluations that emphasize the significance of nomological validity. Thus, we call attention to the importance of identifying theory-driven, construct-specific factors to guide the decision about whether or not to apply measurement invariance criteria.
The Origin of Measurement Invariance Testing
The checkered history of psychometrics is intertwined with the search for objective measures of cognitive ability and their highly controversial societal implications (Wijsen et al., 2022). Francis Galton’s early contributions to statistics, aimed at promoting eugenics, forged an ideological path for intelligence testing. Alfred Binet’s intelligence quotient (IQ) test, originally designed to identify cognitive disabilities in children, was adopted by American psychologists such as Terman, Goddard, and Yerkes. Departing from its original diagnostic intent, they used Binet’s IQ test for merit-based selection of individuals. Charles Spearman formalized the study of intelligence by inventing factor analysis, which posited a universal genetic entity, the g-factor. The idea of general intelligence later fueled intense debates about the genetic basis of ethnic IQ differences, largely because studies reported lower group averages for Blacks compared to Whites (Herrnstein & Murray, 1994; Rushton & Jensen, 2005). Lynn and Vanhanen (2002), among others, expanded IQ testing into a global venture, often implying Western superiority. Standardized tests of intelligence, which were very influential in military, educational, and organizational contexts, revived ideas from the eugenics movement and flattered Western conceits about meritocratic selection.
Fairness as Validity in the Context of Individual Selection
In the late 20th century, culturally sensitive researchers acknowledged the notorious history of intelligence research, and there was a push to develop culture-fair assessments of diverse cultural groups. In The Mismeasure of Man, Gould (1996) scrutinized biases in Western researchers’ methods and interpretations of IQ tests. He challenged the notion of intelligence as a universally quantifiable entity and critiqued the misuse of science in justifying social inequalities. Cultural relativists questioned the comparability of intelligence estimates across cultures, asserting that intelligence is deeply embedded in specific sociocultural contexts and that Western-centric methodologies cannot be easily exported to non-Western cultures (Fraser, 1995; Greenfield, 1997). From this perspective, asserting that one group’s intelligence is superior to another group’s was as subjective as claiming that apples taste better than oranges.
Nowadays, researchers and practitioners appreciate that fairness is a crucial element in drawing intergroup comparisons (van de Vijver, 2016), and this is indeed part of why the concept of measurement invariance has caught on. The focus on fairness has motivated two key methodological concepts in psychology: measurement equivalence and measurement bias (van de Vijver & Leung, 2021). Equivalence requires that the meanings of survey items are identical across groups, whereas bias refers to a lack of equivalence. Increasingly, validity is regarded as freedom from bias, and fairness has become an important part of validity in testing contexts (American Educational Research Association et al., 2014). For years, these concepts have influenced global standards in educational and psychological assessment through organizations such as the International Test Commission and the American Educational Research Association.
Statistical Tools to Ensure Equivalence
Psychometricians developed measurement invariance as a statistical principle to examine equivalence in the framework of structural equation modeling (Byrne et al., 1989; Meredith, 1993; Millsap, 1997). In cross-cultural research, the formulation of robust statistical norms fostered the prevalence of multigroup confirmatory factor analysis (MGCFA) as a common way of evaluating measurement invariance (Leitgöb et al., 2023; Steenkamp & Baumgartner, 1998).
Researchers are encouraged to assess three levels of invariance—configural, metric, and scalar—by adhering to established benchmarks for fit indices at each level (Putnick & Bornstein, 2016; van de Vijver & Tanzer, 2004). Configural invariance refers to the consistency of latent factors across groups. Metric invariance refers to the equality of factor loadings across groups, allowing for within-group comparisons. For drawing direct mean comparisons between groups, scalar (full) invariance is considered necessary; it is confirmed when item intercepts are equal across groups. Scalar invariance is the most challenging to attain in practice (Boer et al., 2018; Maassen et al., 2023), and its use and interpretation rest on assumptions that, from our perspective, require closer scrutiny in the context of comparative research.
How Rigid Standards of Measurement Invariance Undermine Comparative Research
Cross-national and cross-cultural research is susceptible to unique method biases such as instrument bias, administration bias, sample bias, and translation bias (see He & van de Vijver, 2012, for a more exhaustive list of method biases). However, common measurement invariance methods like MGCFA cannot “tell where the numbers come from,” so to speak. Non-invariance can come from any of the method biases noted above or from other factors that might otherwise be highly relevant to the theoretical construct under investigation. The purpose of invariance testing, however, is to establish equivalence across conditions “so long as those varied conditions are irrelevant to the attribute being measured” (Millsap, 2011, p. 1, emphasis added). Moreover, “the central theme of test fairness concerns the match between a test’s measurement properties and the purposes and goals for which the test is used” (Camilli, 2006). These notions underscore the need for researchers to determine a priori which factors should be considered construct-relevant (De Los Reyes et al., 2022). Without clear theoretical expectations, researchers risk prematurely eliminating construct-relevant features from their scales when applying measurement invariance techniques.
Individual Comparison in the Selection Context
When psychometricians developed measurement invariance testing, they were appropriately concerned with high-stakes individual contexts such as student and employee selection in which group-level differences were assumed to be irrelevant (e.g., Meredith, 1993). Measurement invariance became a “necessary condition for fair selection procedures,” especially “when the purpose of test use is the selection of individuals” (Borsboom, 2006). The priority in these contexts was ensuring fair and ethical assessments for individual members of all social groups, insofar as assessments systematically favoring one group over another would betray the meritocratic principle of equal opportunity for individuals (Camilli, 2006). Accordingly, the international guidelines of assessment require that researchers “minimize the influence of any cultural and linguistic differences that are irrelevant to the intended uses of the test in the populations of interest” (International Test Commission, 2017, p. 10). If the purpose of scale use is for individual selection, invariance testing is a powerful tool to remove factors that contribute to irrelevant group differences, regardless of whether non-invariance stems from method biases or social and cultural factors.
The concern for fair individual selection has set high standards, and rightly so. The key issue was not whether psychological assessment could be completely invariant; instead, the goal was to minimize irrelevant forms of bias as much as possible (Borsboom, 2006). While researchers in personality and social psychology may view these standards as arbitrary and overly stringent (e.g., Funder & Gardiner, 2024), the methodologists who developed them were responding to profound social responsibilities, mindful of the contentious history of research on racial differences in intelligence. The stringent measurement invariance criteria thus reflect societal pressures as well as methodologists’ commitment to social justice in the context of high-stakes individual selection decisions.
Group Comparison in the Study of Culture and Society
All of this raises valuable questions about how important and useful strict invariance standards are for researchers outside of the individual selection context. Psychologists and other social scientists are often interested in comparing social and cultural groups (e.g., Cohen & Kitayama, 2019). Hofstede (1980, 2001), a pioneering figure, conceptualized culture as the entity by which one group of people distinguishes itself from members of another group. In this view, culture transcends individual minds, manifesting itself as a collectively shared phenomenon at the group level. This theoretical (or meta-theoretical) perspective seeks to compare attitudes, beliefs, norms, values, and ideologies across social groups rather than individuals per se (Minkov et al., 2024). Psychological scales may lack measurement invariance because of cultural differences in customs, traditions, languages, religions, social systems, and so on. The concern for fair individual selection, which does not apply to many areas of research based on group comparisons, treats all of these important cultural factors as merely potential “biases.”
The application of measurement invariance techniques depends on how an instrument’s properties align with its intended purpose. In cross-cultural research, this requires theorizing about which cultural factors are construct-relevant with respect to the scale, but psychologists have long resisted developing an ontology of culture, insisting that “efforts to define culture are irrelevant to the real business of cross-cultural psychology” (Segall, 1984, p. 154). This has led some researchers to treat culture as interchangeable with nationality or even race and ethnicity, in the absence of a strong theoretical foundation (Matsumoto & Yoo, 2006). Psychologists’ reliance on factor analysis, historically grounded in research on intelligence, has ironically led them to view cultural phenomena through the lenses of individual differences. Even popular constructs such as “cultural syndromes” (Triandis, 1996) and independent versus interdependent self-construals (Markus & Kitayama, 1991) encourage a tacit reduction of cultural forces to individual-level phenomena.
Measurement Invariance: Lost in Translation
Since the advent of measurement invariance testing in the 20th century, cross-cultural research rapidly expanded well beyond educational testing to many non-cognitive traits, but methodologists continued to emphasize the need for culture-fair assessments (van de Vijver & Poortinga, 1991). Over time, the original purpose of measurement invariance was forgotten, and technical terms began to take on a life of their own. Scholars claimed that measurement invariance was a necessary (Davidov et al., 2008) condition for making group comparisons meaningful (Davidov et al., 2014), unbiased (Maassen et al., 2023), valid (Leitgöb et al., 2023), comparable (Alemán & Woods, 2016), and fair (Kline, 2018). However, as we have seen, these value-laden terms were originally applied to the context of individual selection, and they do not necessarily fit other research purposes. Without defining the theory-driven goals of scale development and use, practitioners are often misled into assuming that any violation of measurement invariance is problematic, even unethical (see also Funder & Gardiner, 2024). The troubling irony is that—by promoting the ritualistic application of rigid measurement invariance criteria—cultural and cross-cultural psychologists, among others, risk obscuring the very cultural and societal differences they seek to understand (Fischer & Karl, 2019; van de Vijver & Leung, 2021).
A rigid application of measurement invariance testing would, for instance, lead researchers to develop instruments that eliminate cultural factors altogether, including social differences arising from race, ethnicity, language, religion, gender, and educational background. The overarching goal is to place individuals on some “bell curve,” with similar distributions across populations and social contexts, highlighting and even amplifying individual differences while suppressing group differences, as illustrated in Figure 1A. However, psychologists who are truly interested in society or culture should treat their subject matter in terms of group-level phenomena that are largely shared within group boundaries but that vary from group to group (Hofstede, 1980, 2001), as in Figure 1B. Thus, the research goals arising from individual selection and group comparison are very different from one another.
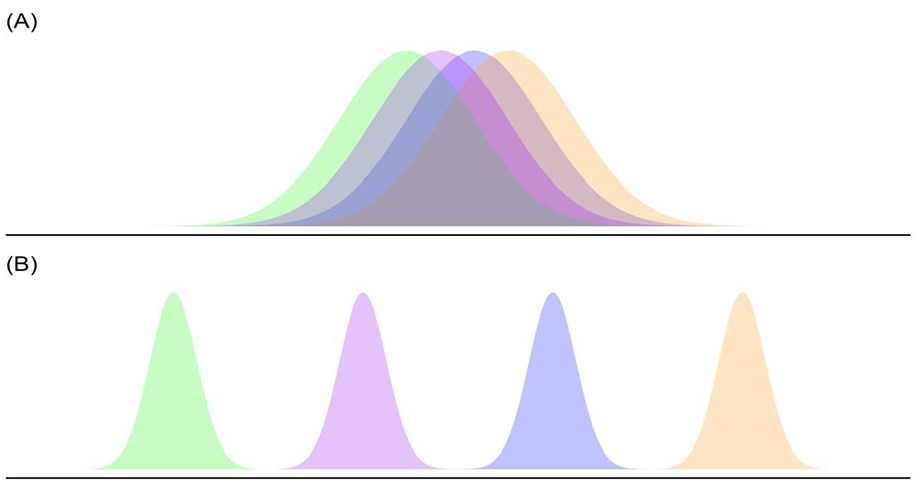
Contrasting ideal distributions under two varying ontological/epistemological assumptions.
There are other serious problems with existing recommendations to remove items and groups (such as countries) from analysis in order to preserve measurement invariance. Excluding items based solely on measurement invariance statistics can compromise content validity and alter the original conceptualization (Clifton, 2020). Excluding cultural groups for the sake of measurement invariance may perpetuate Western-centric biases in psychology (e.g., Henrich et al., 2010). Because Western societies (such as the United States) often serve as the reference point for scale development, such practices may inadvertently promote “academic imperialism” (Biswas-Diener, 2022, p. 24) by privileging items and groups with minimal cultural variation while neglecting constructs that are culturally unique in non-Western contexts (Boehnke, 2022).
The meta-theoretical assumptions of measurement invariance techniques, such as MGCFA, in other words, fundamentally conflict with those associated with the comparative study of cultures and societies. The MGCFA requirement for sufficient within-group variability is inherently at odds with the comparative study of culture. It may lead researchers, quite inappropriately, to dismiss meaningful group- or societal-level differences as reflecting nothing but measurement error.
One complicating factor is that psychological research often relies on closed-ended Likert-type scales that constrain response variability at the extreme ends of the scale (see Supplemental Material, Section 1). 1 Common CFA models require sufficient within-group variability for reliable parameter estimation, but this requirement becomes unrealistic and unhelpful in cross-group comparisons in which extreme views are common and expected, and within-group variability is therefore low (Zhirkov & Welzel, 2024). For instance, respondents in Muslim countries typically show ceiling effects when asked about religiosity, with little variance to be modeled for the purpose of obtaining reliable factor solutions. However, these homogenous response patterns reflect something very important about the societies and cultures that are being studied (Minkov et al., 2024; Welzel & Inglehart, 2016; see also Supplemental Material, Section 6).
To resolve the tension between psychometric requirements for measurement invariance and the comparative study of group differences, we propose prioritizing nomological (convergent) validity—examining how group means correlate with criterion variables that are theoretically relevant (Welzel, Brunkert, et al., 2023). This approach helps to distinguish genuine cultural differences from method biases, giving rise to non-invariance, especially when some groups show extreme scores with low within-group variability. In other words, nomological validation can ensure that group differences, despite violating common invariance standards, arise from construct-relevant rather than construct-irrelevant factors.
Study Overview
GSJ Scale
Our empirical case study focuses on a scale of GSJ beliefs. Jost and Banaji (1994) introduced system justification theory, which proposes that people are motivated to appraise existing social, economic, and political systems as fair and legitimate. The concept has played a significant role in social psychology, facilitating research into how system-justifying beliefs predict attitudes toward authority figures, public policies, and various social groups in a wide range of social, cultural, and political settings (see Jost, 2019, 2020). System justification theory posits that people’s attitudes, beliefs, and values are shaped by both dispositional and situational (or environmental) factors; this means it provides an excellent example for demonstrating how and why applying rigid measurement invariance criteria is unhelpful for comparative research. When assessing theoretical constructs that are inherently context-dependent, variations across social and cultural groups should be expected rather than treated as a nuisance.
A key instrument in this research is the GSJ scale (Kay & Jost, 2003). While originally developed for U.S. populations, the GSJ scale has found unexpected global application in international surveys and national polls (e.g., Cichocka & Jost, 2014). However, Vesper et al. (2022) questioned its cross-cultural validity based on MGCFA involving data from 30 countries and, because of a lack of scalar invariance, concluded that “it is not justified to compare mean values across countries” (p. 1046). Their critique provides an opportunity for us to illustrate the problematic assumptions of conventional invariance techniques, which may lead researchers to reject valuable cross-national comparisons that reveal genuine differences that are of theoretical importance.
Using the same dataset used in Vesper et al.’s (2022) critique, we directly compare the consequences of following standard measurement invariance techniques with our alternative approach. We propose an alternative way of establishing cross-national or cross-cultural validity that does not require adhering to traditional measurement invariance criteria, or even to more lenient approximate invariance criteria based on newer, more sophisticated techniques. Our analysis consists of three parts: (a) analyzing the association between country-level GSJ scale statistics and their degree of measurement invariance; (b) assessing approximate invariance of the scale via the alignment optimization method; and (c) establishing nomological validity by linking cross-country differences in the scale with theoretically relevant socioeconomic and political variables obtained from independent data sources.
Hypotheses
To evaluate the GSJ scale’s cross-cultural validity, we examined its relationship with objective indicators of social mobility, societal well-being, and governance quality. We build upon the general observation that people perceive societies with higher levels of social mobility as fairer and more legitimate than societies with lower social mobility (Brandt et al., 2020; Day & Fiske, 2017). We hypothesized that people in societies with greater social mobility and more opportunities for economic success, on average, would exhibit stronger system-justifying beliefs. We also hypothesized that the scale would correlate with governance quality measures such as political stability, absence of corruption, and overall societal well-being (Cichocka & Jost, 2014). If the GSJ scale captures meaningful societal-level differences, these differences should covary with socioeconomic and political conditions but not with construct-irrelevant factors like method biases. This approach provides an alternative path to validating cross-national or cross-cultural comparisons without achieving measurement invariance.
Methods
Data
We used Brandt et al.’s (2020) cross-national survey data, which were analyzed in Vesper et al.’s (2022) critique of the GSJ scale in terms of cross-cultural equivalence. This dataset includes various self-report variables administered in 30 countries across North America, South America, Europe, and Asia. The samples consisted of students and non-student participants. See Brandt et al. (2020) and Supplemental Material for demographic information.
Outcome Variable
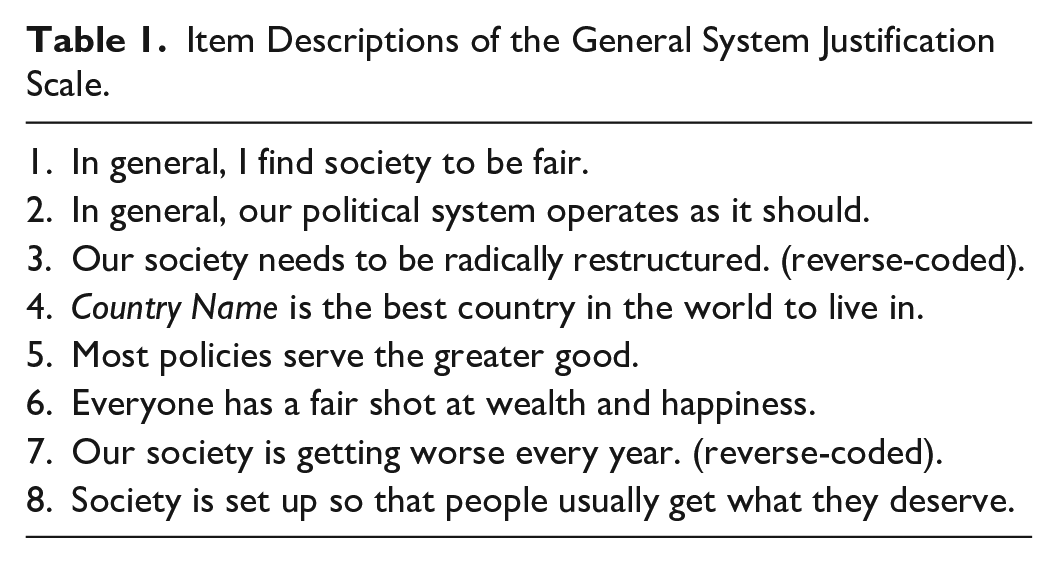
The GSJ Scale (Kay & Jost, 2003) consists of eight items, measured on a 7-point scale ranging from −3 (Disagree Strongly) to +3 (Agree Strongly) (see Table 1). To construct the latent factor score, we calculated the average of these eight items.
Item Descriptions of the General System Justification Scale.
Criterion Variables
Global Social Mobility Index 2020
The World Economic Forum (2020) computed this index by combining various empirical indicators of income, health, and education across 82 countries. It is said to capture “the extent to which everyone in society has a fair chance to fulfill their potential” in terms of intra/inter-generational mobility (World Economic Forum, 2020).
World Happiness Index 2020
The World Happiness Report (2020) published an index of economic and societal well-being based on GDP per capita, healthy life expectancy, and other factors. Importantly, there is no overlap between the variables used to construct this index and those included in the Global Social Mobility Index.
Worldwide Governance Indicators 2020
We sourced six-dimensional indicators of government performance from the World Bank (2024), namely: control of corruption, governmental competence, political stability, judicial effectiveness, regulatory burdens, and citizen participation (α = .968). The “control of corruption” indicator, for example, captures public power abuse for private gain. Higher country-level scores indicate higher levels of institutional quality and democratic functioning.
Covariates
Cross-national and cross-cultural comparisons introduce unique methodological biases. One likely concern is sample bias, which arises when theoretically irrelevant sample characteristics differentially affect responses across cultures (He & van de Vijver, 2012). Such factors may produce unwanted variance in the outcome variable. If we observe the hypothesized associations between the GSJ scale and criterion variables after accounting for potential sample biases, we can conclude that the scale is detecting meaningful societal differences in GSJ beliefs. Here, we consider two potential sources of sample bias.
Country-Mean Age
College students comprised the majority of samples in most countries included in the dataset used by Brandt et al. (2020) and Vesper et al. (2022), but some countries included non-college students or mixed samples. This disproportionate sample composition creates a potential sample bias, insofar as college students typically occupy more privileged societal positions relative to the general population. These educational disparities could systematically bias system justification scores across countries. For instance, college students in Lebanon might represent a more elite segment of their society compared to college students in countries with broader educational access, potentially inflating the former’s system justification scores. To address this type of sample bias, we adjusted for country-mean age as a covariate (e.g., Jang et al., 2017), which significantly varied between student and non-student samples. 2
Proportion of Female Respondents
Although the majority of respondents in the dataset were female, the gender ratio varied across countries, with some having more males than females (e.g., 74% male in India) and others with more balanced ratios (e.g., Greece and Lebanon). Based on evidence that women score lower than men on GSJ (Hässler et al., 2019; Jost, 2020), we suspected that country-level differences could be driven by disproportionate gender ratios. We adjusted for this potential sample bias by computing the proportion of female respondents in each country.
Transparency and Openness
We have made data and statistical codes available here: https://osf.io/v9mtf/?view_only=30c92ec126c845caa5502eb022e85a18
Results
Descriptive Statistics
We examined intercorrelations between GSJ means and standard deviations at the country level. Density plots of the GSJ scores in Figure 2 suggest that countries varied widely in the degree of within-group variability. These varying distributions were systematically associated with country-level means. A country’s mean score was positively and significantly correlated with its standard deviation, r(28) = .60, p < .001. As shown in Figure 3, standard deviations were smallest in those countries, where there was a clear rejection of the system justification items (e.g., Serbia, Lebanon, Colombia, Greece, Chile, and Türkiye). Standard deviations plateaued in countries with moderate system justification beliefs (e.g., the United States, Italy, and Russia), and they decreased again in countries with very positive views of the system (e.g., Singapore and India), as illustrated in Figure 3. These patterns show that, when survey responses are constrained by a closed-ended scale, groups (or societies) with more extreme responses exhibit less within-group variability, which means that they are less likely to satisfy measurement invariance criteria. Sections 1 and 2 in the Supplemental Material provide simulations that illustrate this quadratic pattern between country-level means and standard deviations in multigroup comparisons (see also Zhirkov & Welzel, 2024).
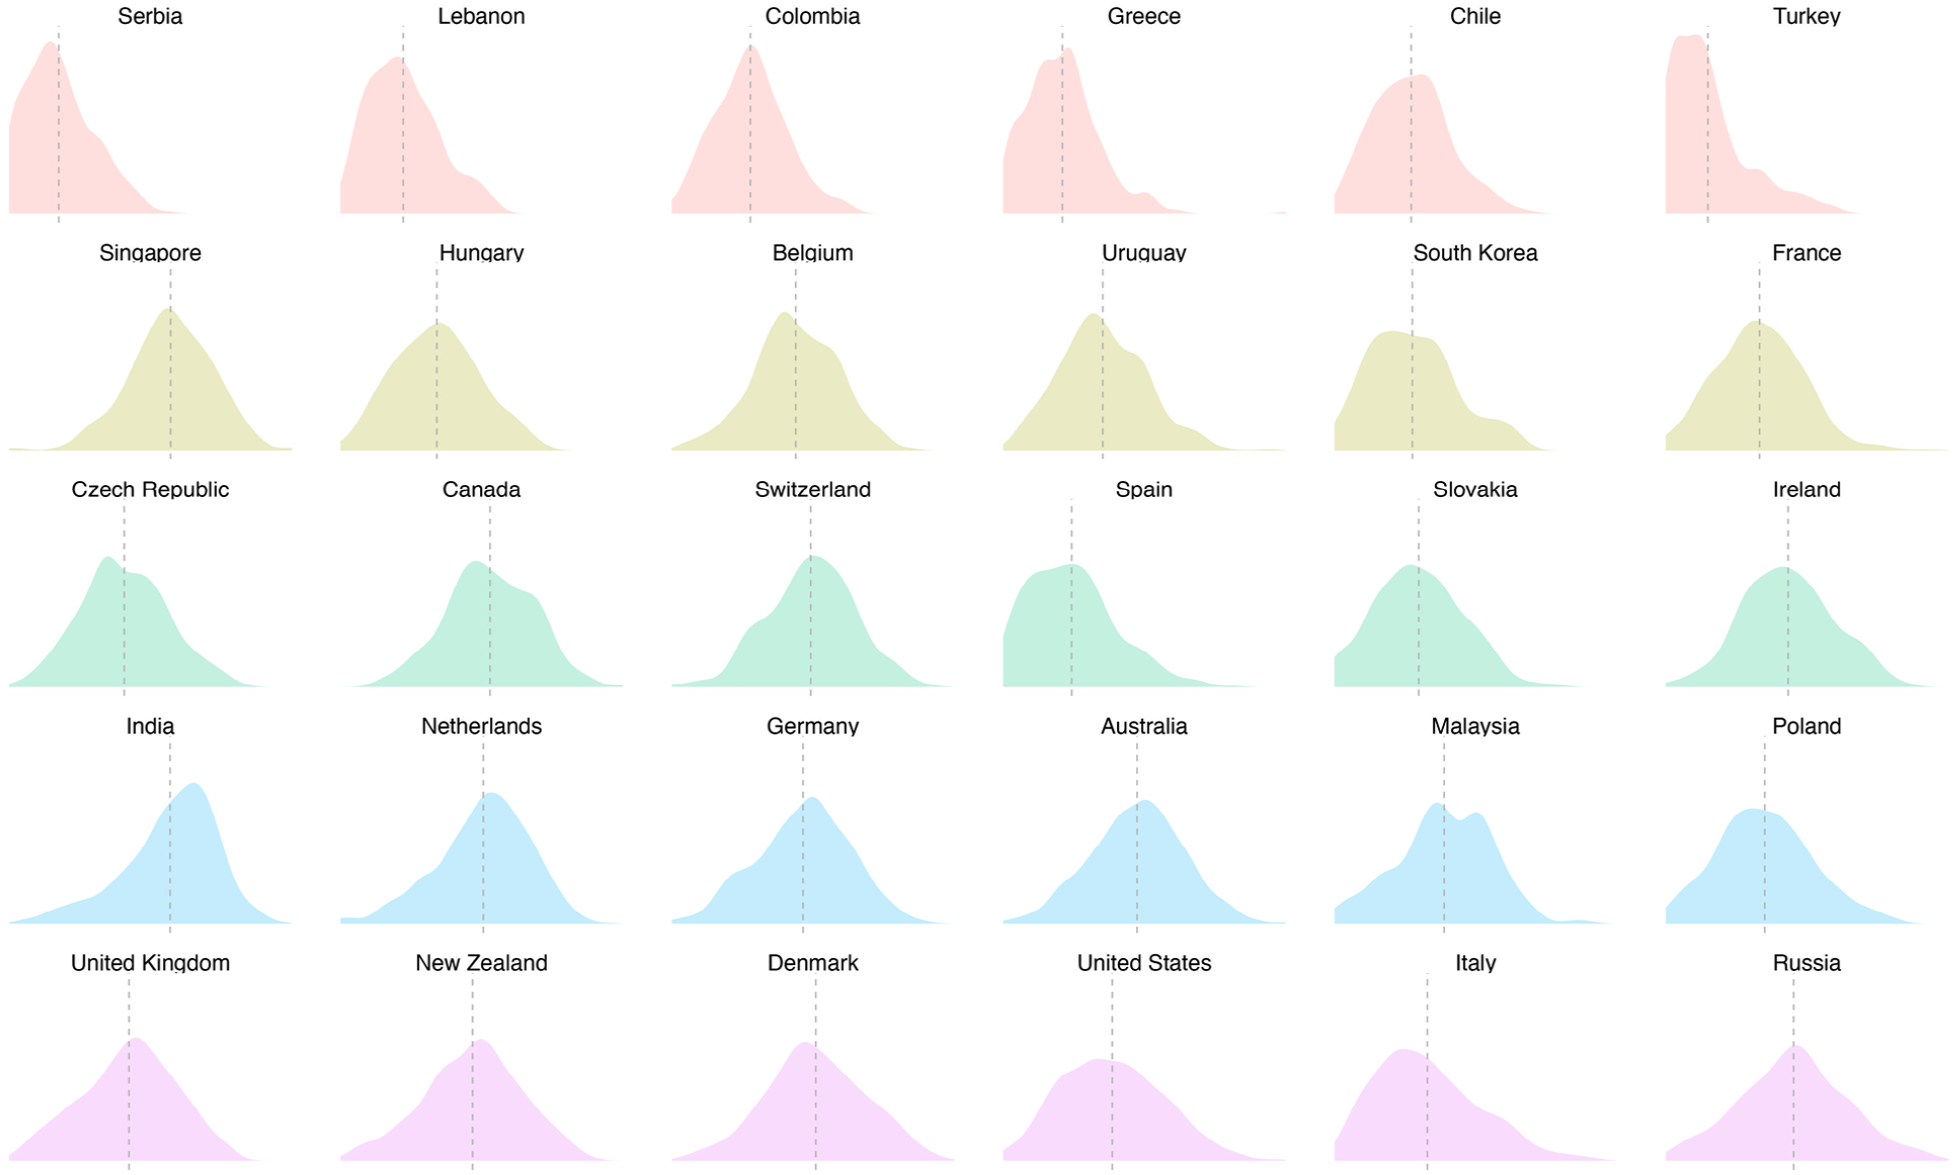
Varying means and standard deviations (distributions) of general system justification scores across 30 countries.
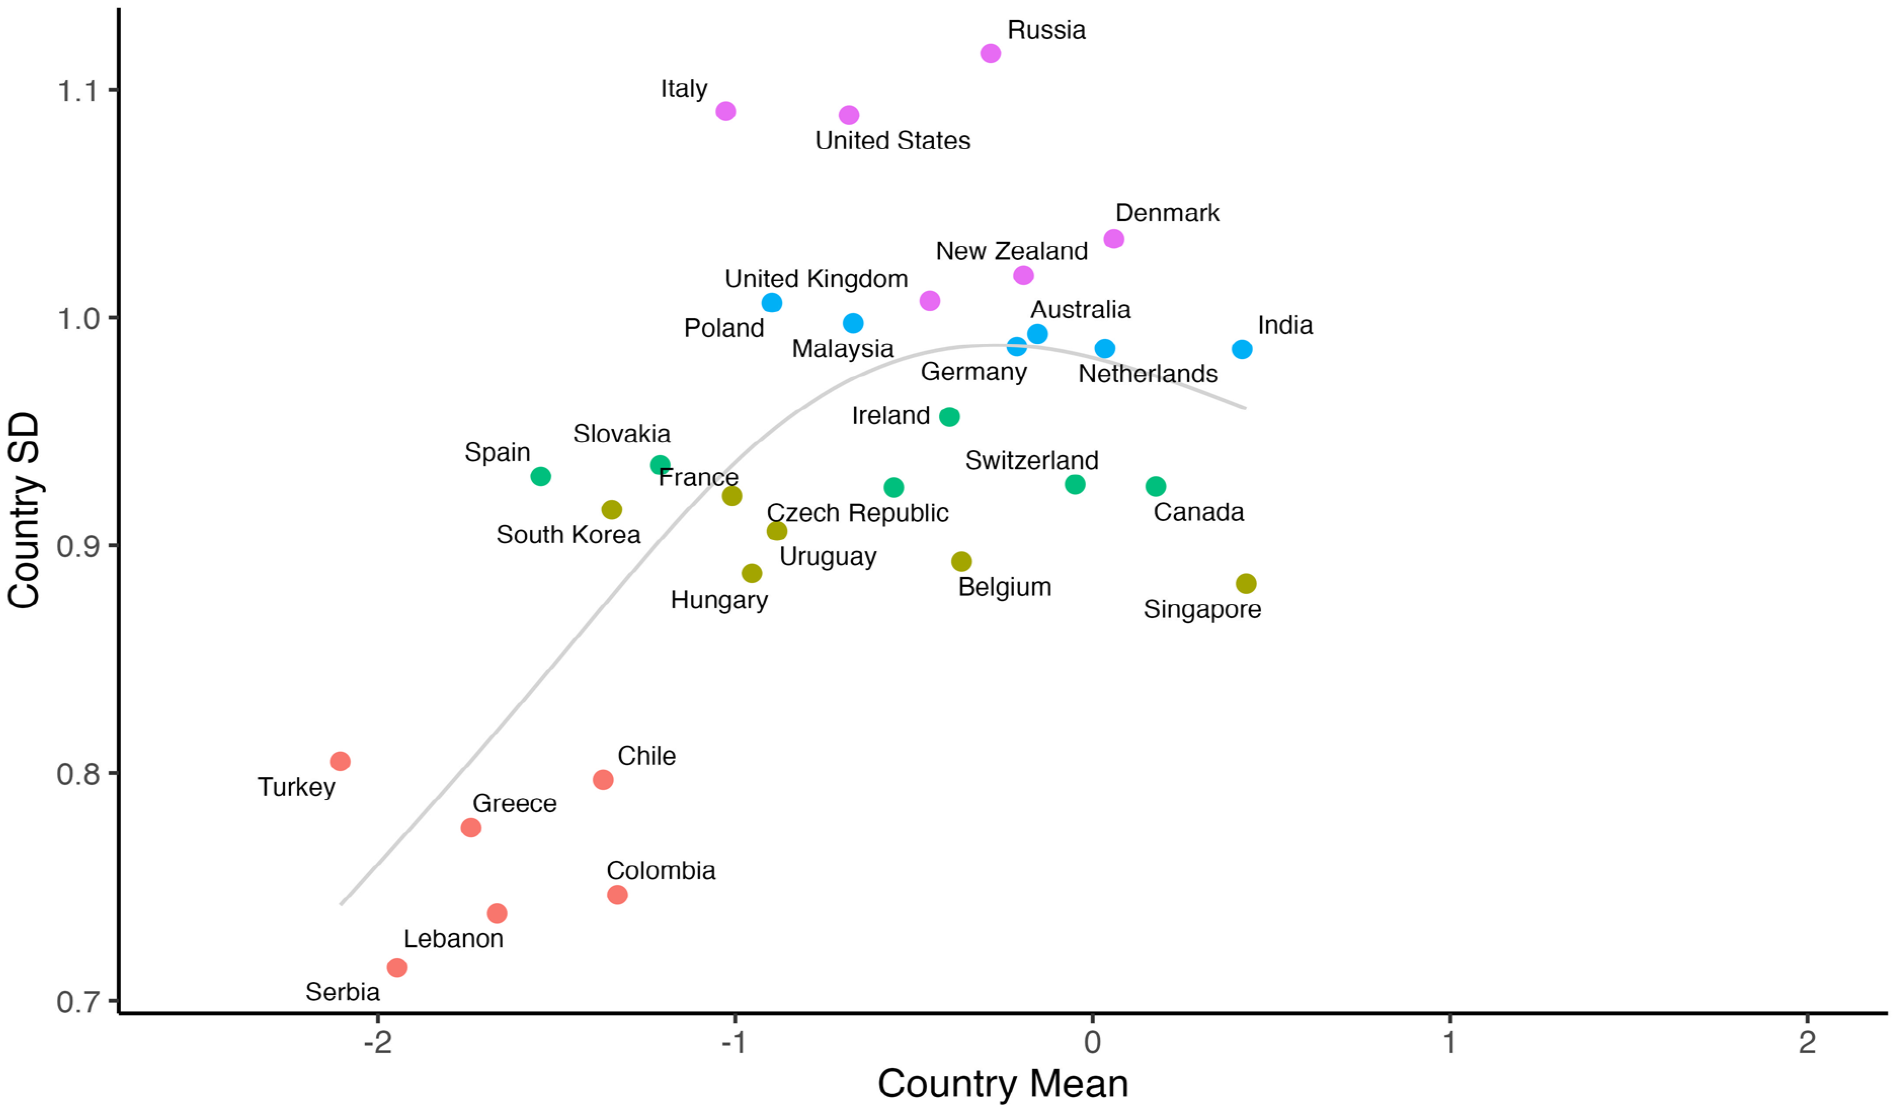
Countries with lower means of General System Justification exhibit lower standard deviations.
Multigroup Confirmatory Factor Analysis (MGCFA)
Countries with extreme responses and low within-group variability struggled to “pass” the MGCFA test, especially with respect to scalar invariance. Table 2 shows MGCFA fit statistics across six country groups, classified on the basis of standard deviations. Countries with the lowest standard deviations (Group 1: Serbia, Lebanon, Colombia, Greece, Chile, and Türkiye), where there was high consensus that the system is unfair, showed poor fit, disrupting reliable factor solutions (Zhirkov & Welzel, 2024). Only heterogeneous countries with the highest standard deviations (Group 5: United Kingdom, New Zealand, Denmark, United States, Italy, and Russia) achieved “acceptable” levels of scalar invariance because their distributions were more normal (see Figure 2). Countries with moderate standard deviations (Groups 3 and 4) showed moderate fit.
Measurement Invariance Test Statistics of the General System Justification Scale Using Multigroup Confirmatory Factor Analysis.
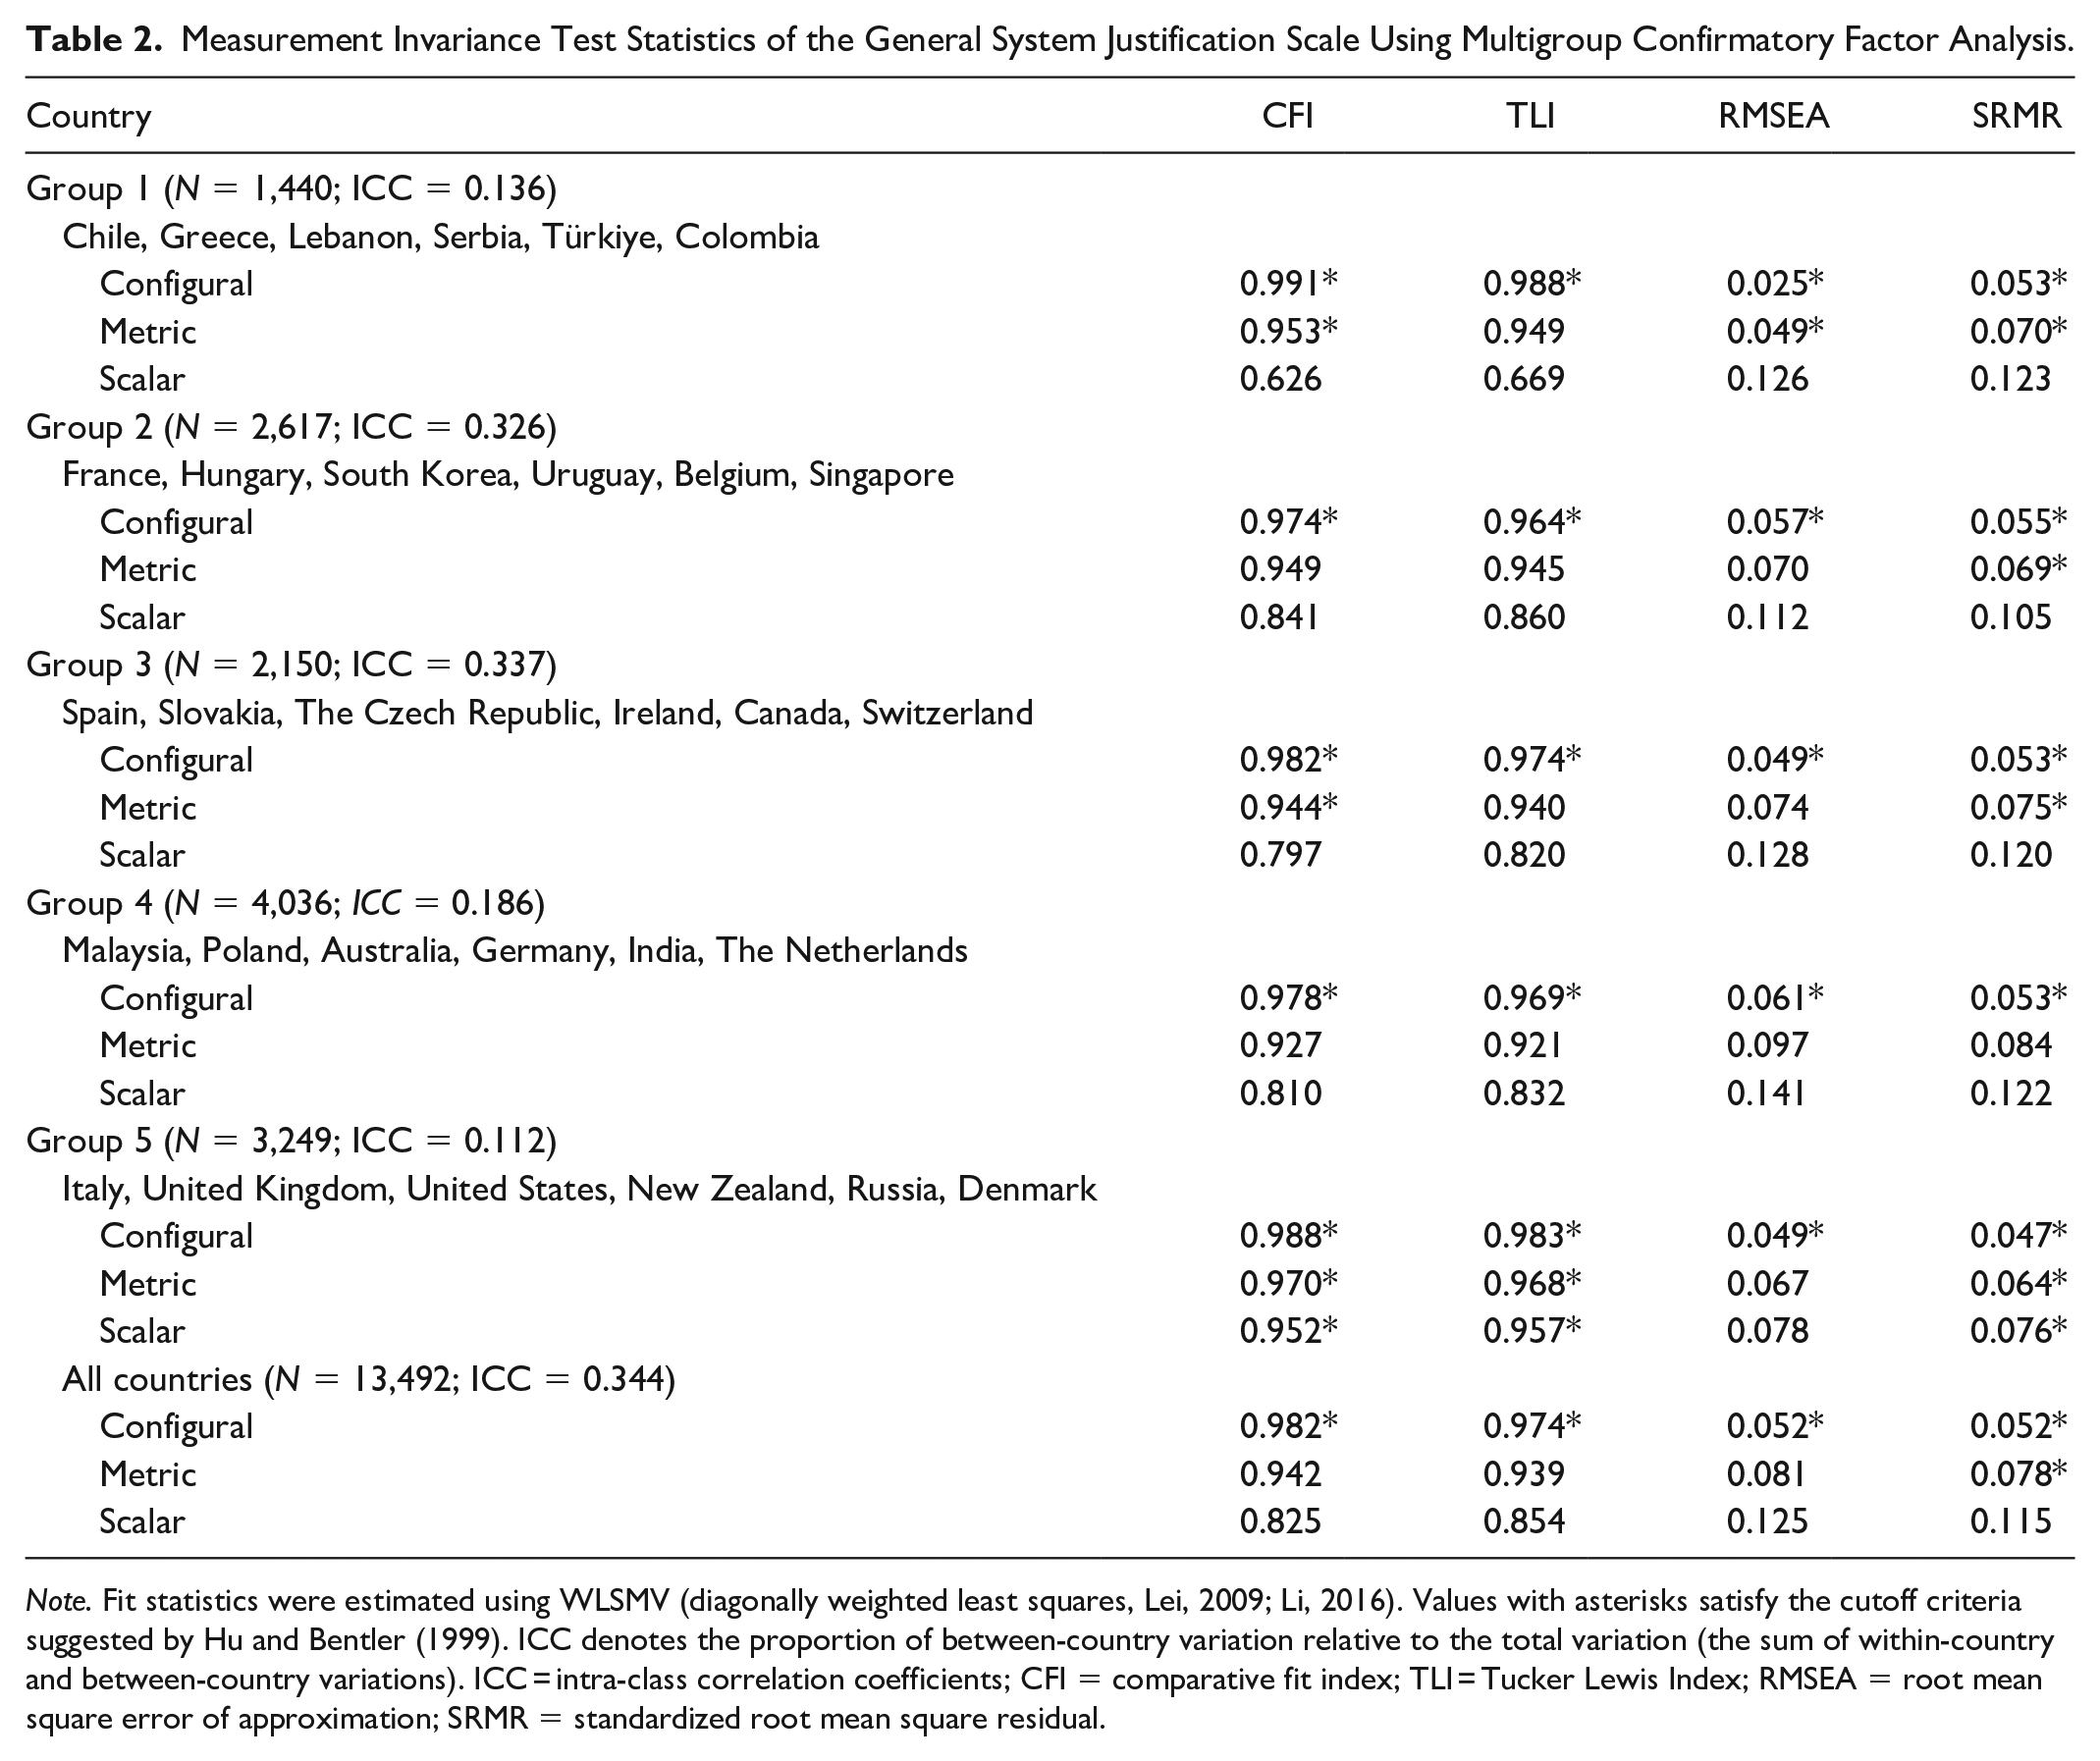
Note. Fit statistics were estimated using WLSMV (diagonally weighted least squares, Lei, 2009; Li, 2016). Values with asterisks satisfy the cutoff criteria suggested by Hu and Bentler (1999). ICC denotes the proportion of between-country variation relative to the total variation (the sum of within-country and between-country variations). ICC = intra-class correlation coefficients; CFI = comparative fit index; TLI = Tucker Lewis Index; RMSEA = root mean square error of approximation; SRMR = standardized root mean square residual.
Thus, MGCFA, by design, “favors” groups with more moderate, heterogeneous views, while “penalizing” groups with more extreme, homogeneous views. According to conventional standards, researchers would be forced to conclude that the scale possesses questionable cross-cultural validity and is biased in Serbia, Lebanon, and Colombia. However, these patterns of results emerge naturally from the mere fact that there is a high social consensus that the overarching social system is lacking in fairness and legitimacy. An important next step, therefore, is to examine the true source of non-invariance: whether the societal differences are driven by construct-relevant factors or method biases that are irrelevant to the theoretical construct of system justification.
The Alignment Optimization Method
Perhaps the problem is simply that the invariance standards of MGCFA are too strict? Asparouhov and Muthén (2014) proposed an alternative approach, the “alignment optimization method,” to estimate partial or approximate measurement invariance when a large number of groups makes it unrealistic to achieve full invariance (see also Asparouhov & Muthén, 2023; Muthén & Asparouhov, 2014). The alignment method overcomes the technical difficulty of meeting strict invariance in studies with numerous groups, such as via MGCFA, by allowing some items to vary freely across groups.
This method begins with the configural model, which imposes no equality constraints on factor loadings or intercepts across groups. In this initial model, factor variances are constrained to 1, and factor means are set to 0 for all groups. From this starting point, the alignment method introduces an optimization process that minimizes a simplicity function. This simplicity function penalizes large differences in factor loadings and intercepts across groups while achieving the maximum possible invariance and maintaining the same model fit as the configural model.
The alignment process is conceptually similar to factor rotation in exploratory factor analysis, where the goal is to obtain a simple structure. In factor rotation, variables are aligned so that they load strongly on one factor while having weak loadings on others. Similarly, the alignment method seeks a solution where most measurement parameters remain invariant across groups so that non-invariance is limited to a minimal number of parameters. This approach generates aligned factor means and variances for each group, which reflect group-specific latent characteristics that account for potential measurement non-invariance.
The alignment method enables the comparison of latent factor means and variances across groups, even when some items exhibit non-invariance. Its implementation in widely available software such as Mplus (Muthén & Muthén, 2017) has made it accessible for applied research. It is increasingly used in large-scale cross-cultural studies because the likelihood of non-invariance increases with larger numbers of groups (e.g., Jang et al., 2017). Vesper et al. (2022) applied the alignment optimization method and concluded that the GSJ scale still violated scalar invariance (i.e., the equal item intercepts assumption). Here, our primary goal is not to reiterate their findings, but to compare raw latent factor scores against alignment-optimized scores and evaluate their performance in terms of nomological validity.
Model Specification
We used the sirt package in R (Robitzsch, 2024) to conduct alignment optimization with respect to the GSJ scale. Following Fischer and Karl (2019), we set the alignment power to be 0.25. We set the tolerance values of intercept invariance to be ν = .20, so that any item parameters exceeding the cutoff were flagged as non-invariant (i.e., differential item functioning [DIF] effects). We estimated the percentage of invariant parameters out of the total unique parameters to be estimated. After that, we retained the item intercepts estimated by the alignment optimization model for each country and estimated the “alignment-optimized” scores across countries.
Result of the Alignment Method
The alignment method revealed that 52% of the total parameters were deemed non-invariant (items showing DIF effects), clearly exceeding the conventional 25% cutoff. Item 4 (“Country Name is the best country in the world to live in”) showed the most non-invariance, followed by Items 2 (“In general, our political system operates as it should”), 3 (“Our society needs to be radically restructured”), and 7 (“Our society is getting worse every year”). Chile and Slovakia had the highest number of non-invariant items, followed by Colombia, Denmark, Lebanon, and Türkiye. Even with a more lenient threshold, the GSJ scale appears to violate measurement invariance. The Supplemental Material (Section 4) provides a more detailed summary of the alignment method and the results we obtained.
Figure 4 compares the raw latent factor scores of the GSJ scale on the x-axis with the alignment-optimized scores on the y-axis. The two scores were moderately correlated, r(28) = .442, p = .01. Some countries, such as Uruguay, the United States, and Malaysia, maintain very similar positions on both scores. However, after alignment, countries with the lowest GSJ raw scores—Türkiye, Serbia, and Greece—exhibited substantial upward adjustments. Conversely, countries with higher GSJ raw scores, such as Denmark, India, and Singapore, exhibited substantial downward adjustments. In some cases, country differences were reversed after alignment: the alignment method shifted Türkiye, Serbia, and Greece to be slightly higher than India. A key feature of the alignment method, highlighted in Figure 4, is its power to diminish between-country variability. The alignment-optimized scores clearly exhibited much lower between-country variability (SD = 0.14) compared to the raw scores (SD = 0.70).
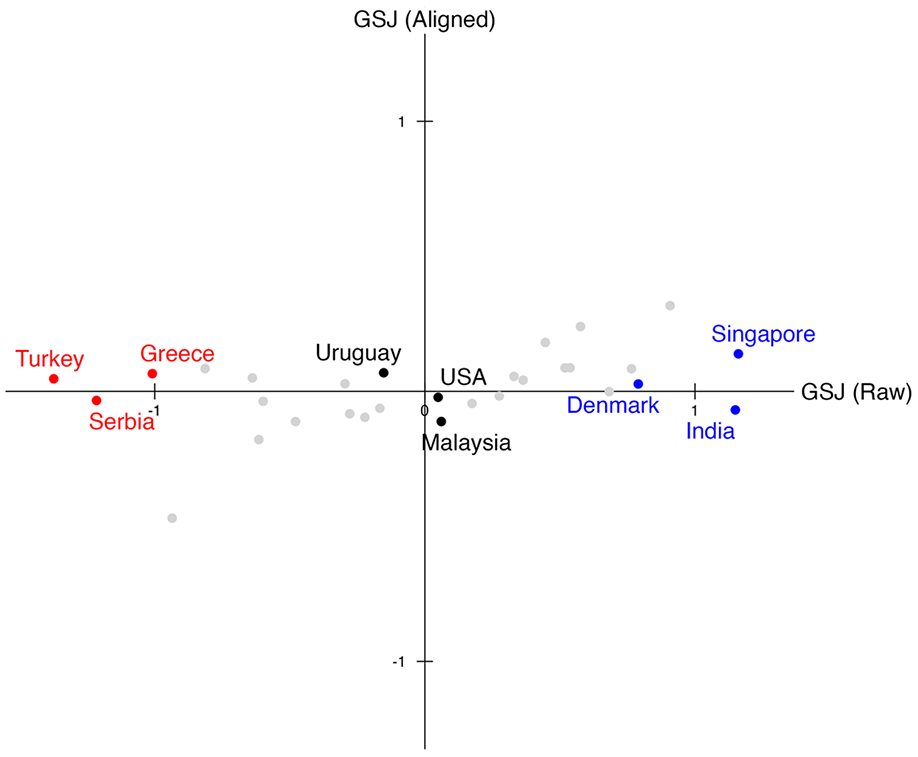
The raw factor scores of the General System Justification scale against the aligned scores.
The alignment optimization method “improves” measurement invariance by equalizing group differences. However, it remains unclear whether alignment-optimized scores represent valid group differences. Do extreme responses in Türkiye, Serbia, and Greece reflect meaningful theoretical patterns, such as a rejection of system legitimacy, or are they “biased” and need to be “fixed”? We answer these questions by exploring the scale’s nomological network.
Nomological Validation of the GSJ Scale
How do we know whether extreme, uniform responses (such as a strong social consensus that the overarching social system is either highly legitimate or highly illegitimate) reflect meaningful societal or cultural differences, as opposed to method biases arising from construct-irrelevant factors? And how do we know whether the alignment optimization method increased or decreased the nomological validity of the scale? Table 3 presents the zero-order Pearson correlations involving the raw GSJ scores, alignment-optimized scores, and various criterion variables. India emerges as an outlier that significantly drives some of these correlations.
Nomological Validity of the GSJ Scale With Structural Indicators of Societal Functioning.
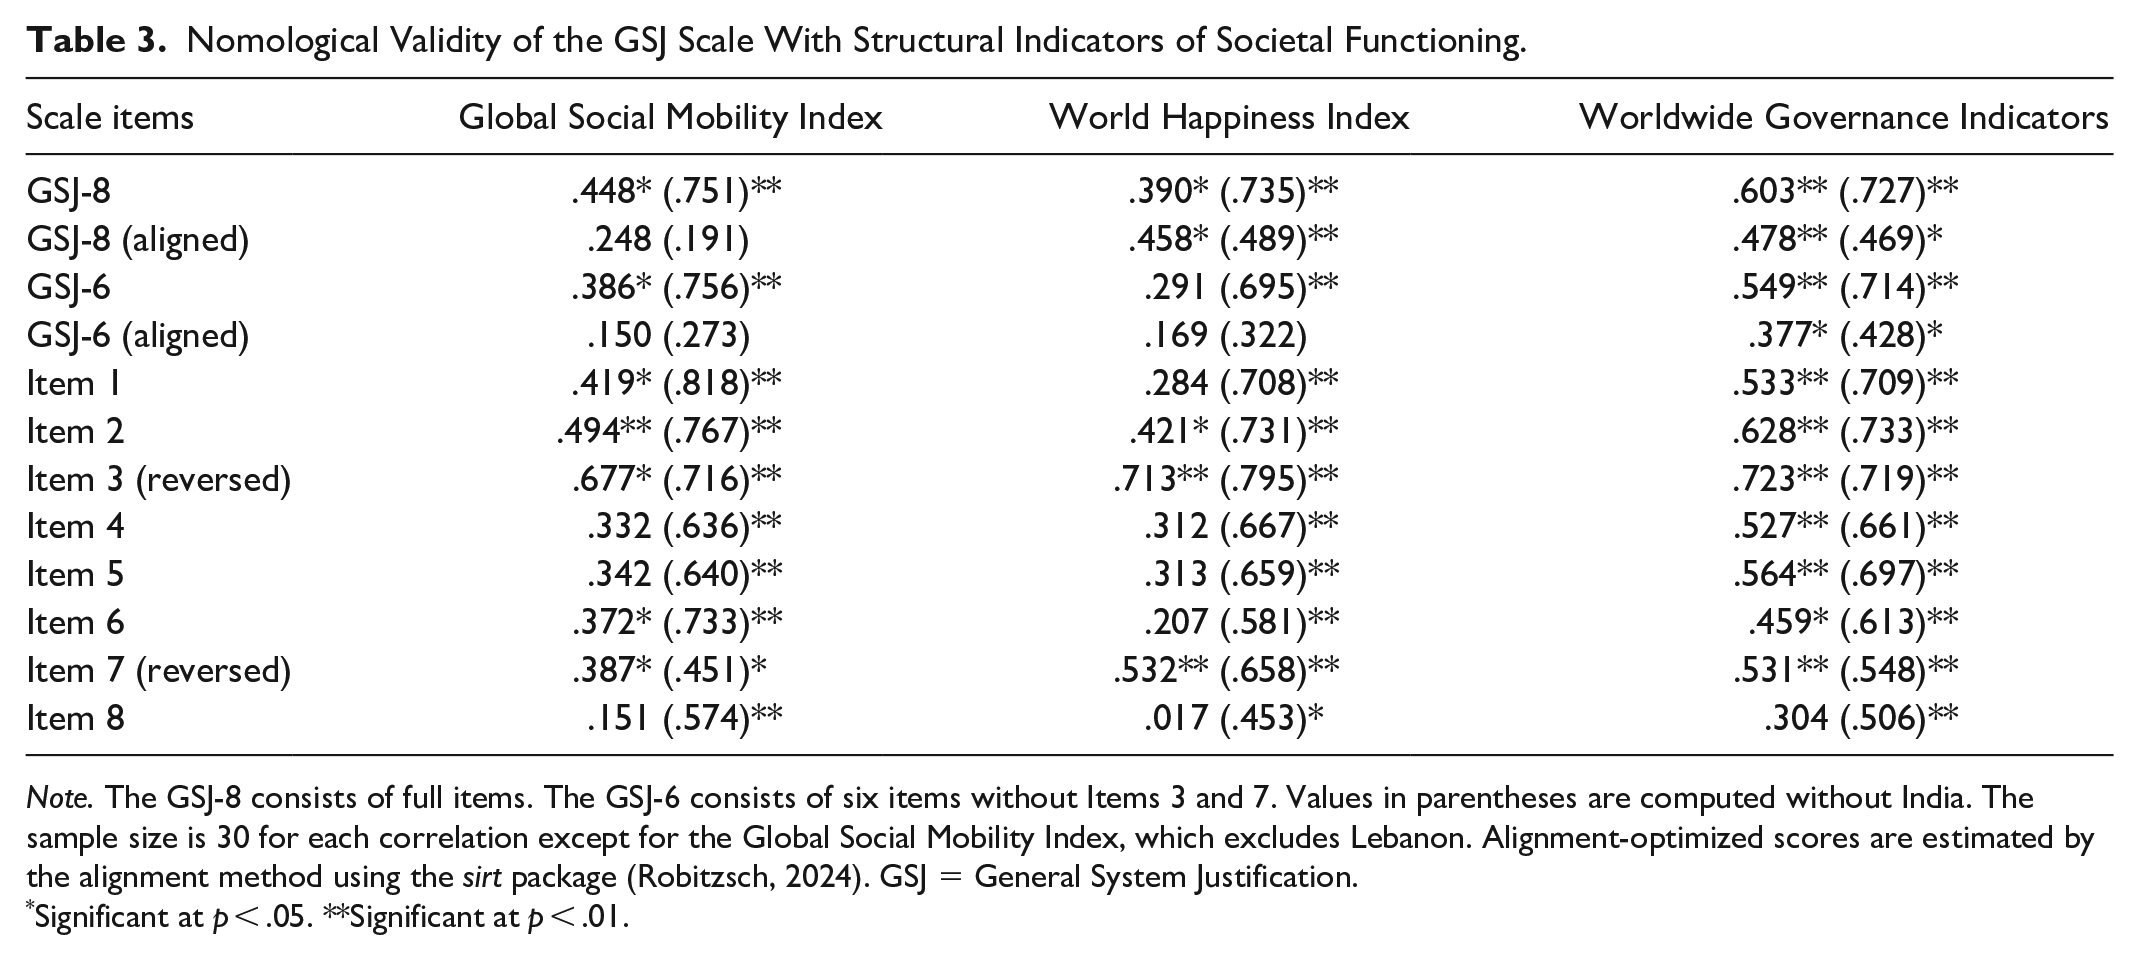
Note. The GSJ-8 consists of full items. The GSJ-6 consists of six items without Items 3 and 7. Values in parentheses are computed without India. The sample size is 30 for each correlation except for the Global Social Mobility Index, which excludes Lebanon. Alignment-optimized scores are estimated by the alignment method using the sirt package (Robitzsch, 2024). GSJ = General System Justification.
Significant at p < .05. **Significant at p < .01.
In general, the GSJ scale (especially the original 8-item unadulterated version) exhibits adequate nomological validity with respect to key criterion variables such as social mobility, societal well-being, and governance quality. Most notably, the Worldwide Governance Indicators are strongly correlated with both raw GSJ-8 scale (r = .603) and raw GSJ-6 scale scores (r = .549). These results support the hypothesis that individuals in well-governed societies perceive their social systems as fair and desirable, while those in poorly governed societies tend to perceive them as unfair and undesirable.
Importantly, raw GSJ scores showed stronger correlations with two of the three criterion variables, the Global Mobility Index and Worldwide Governance Indicators, compared to alignment-optimized scores. While the alignment method improves measurement invariance by adjusting for non-invariance, it does so at the cost of reducing differences between groups (or societies) in these variables (see Figure 4). Pursuing measurement invariance through the alignment optimization method does not necessarily enhance cross-cultural validity, and it may suppress theoretically meaningful links to other variables in the nomological network.
Item-by-item comparisons further revealed that reverse-coded items (Items 3 and 7) showed strong correlations with key criterion variables. Item 3 had the strongest correlations with the Global Mobility Index (r = .677), the World Happiness Index (r = .713), and the Worldwide Governance Indicators (r = .723), and these correlations were relatively unaffected by India’s unique score. Likewise, Item 7 performed strongly on par with other items, whether India was included or not. That is, these reverse-coded items performed particularly well when it came to distinguishing high system-justifying countries from low system-justifying countries, indicating high nomological validity. Putting all of this together, the 8-item version generally outperformed the 6-item version as well as individual items. These findings are at odds with standard practices, including the analyses of Vesper et al. (2022), which excluded the reverse-coded items on the basis of low factor loadings and non-invariance statistics.
India, as noted already, is a potential outlier in this analysis. Despite its relatively high GSJ scores, India exhibits low levels of the criterion variables, thereby lowering the observed correlations for the overall comparison. While correlations computed without India (values in parentheses in Table 3) are generally stronger, most correlations remain significant even with India included. The reverse-coded items (Items 3 and 7) maintain similar correlations regardless of whether India is included or excluded, further reinforcing the value of including these reverse-scored items. It is worth pointing out that excluding India did not affect the alignment-optimized scores because the optimization method had already deflated India’s extreme value substantially (see Figure 4). In any case, future research would do well to investigate why—from a social psychological perspective—system justification beliefs are so pervasively held in India, given low levels of objective social mobility, governmental quality, and societal well-being.
Isolating Construct-Relevant Factors From Method Biases
Using multiple regression analyses, we isolated the associations between GSJ (8-item raw scores) and its criterion variables from two sources of method bias (country-mean age and the proportion of female respondents). In three separate models, we regressed GSJ scores onto each criterion variable while adjusting for the two covariates (see Table 4). The models largely replicate the correlational patterns in Table 3. With respect to the Global Social Mobility Index (Model 1) and World Happiness Index (Model 2), the inclusion of covariates improved the precision of estimates between GSJ and the criterion variables, suggesting that the demographic confounds were indeed acting as suppressor variables. Figures 5 to 7 depict the model-implied associations derived from the regression models. At the country level of analysis, system justification was positively associated with objective indicators of social mobility, societal well-being, and governance quality, and these associations were not driven by sample biases. These results provide further support for the nomological validity of the full 8-item GSJ scale.
Multiple Regressions Predicting Scores on the GSJ Scale.
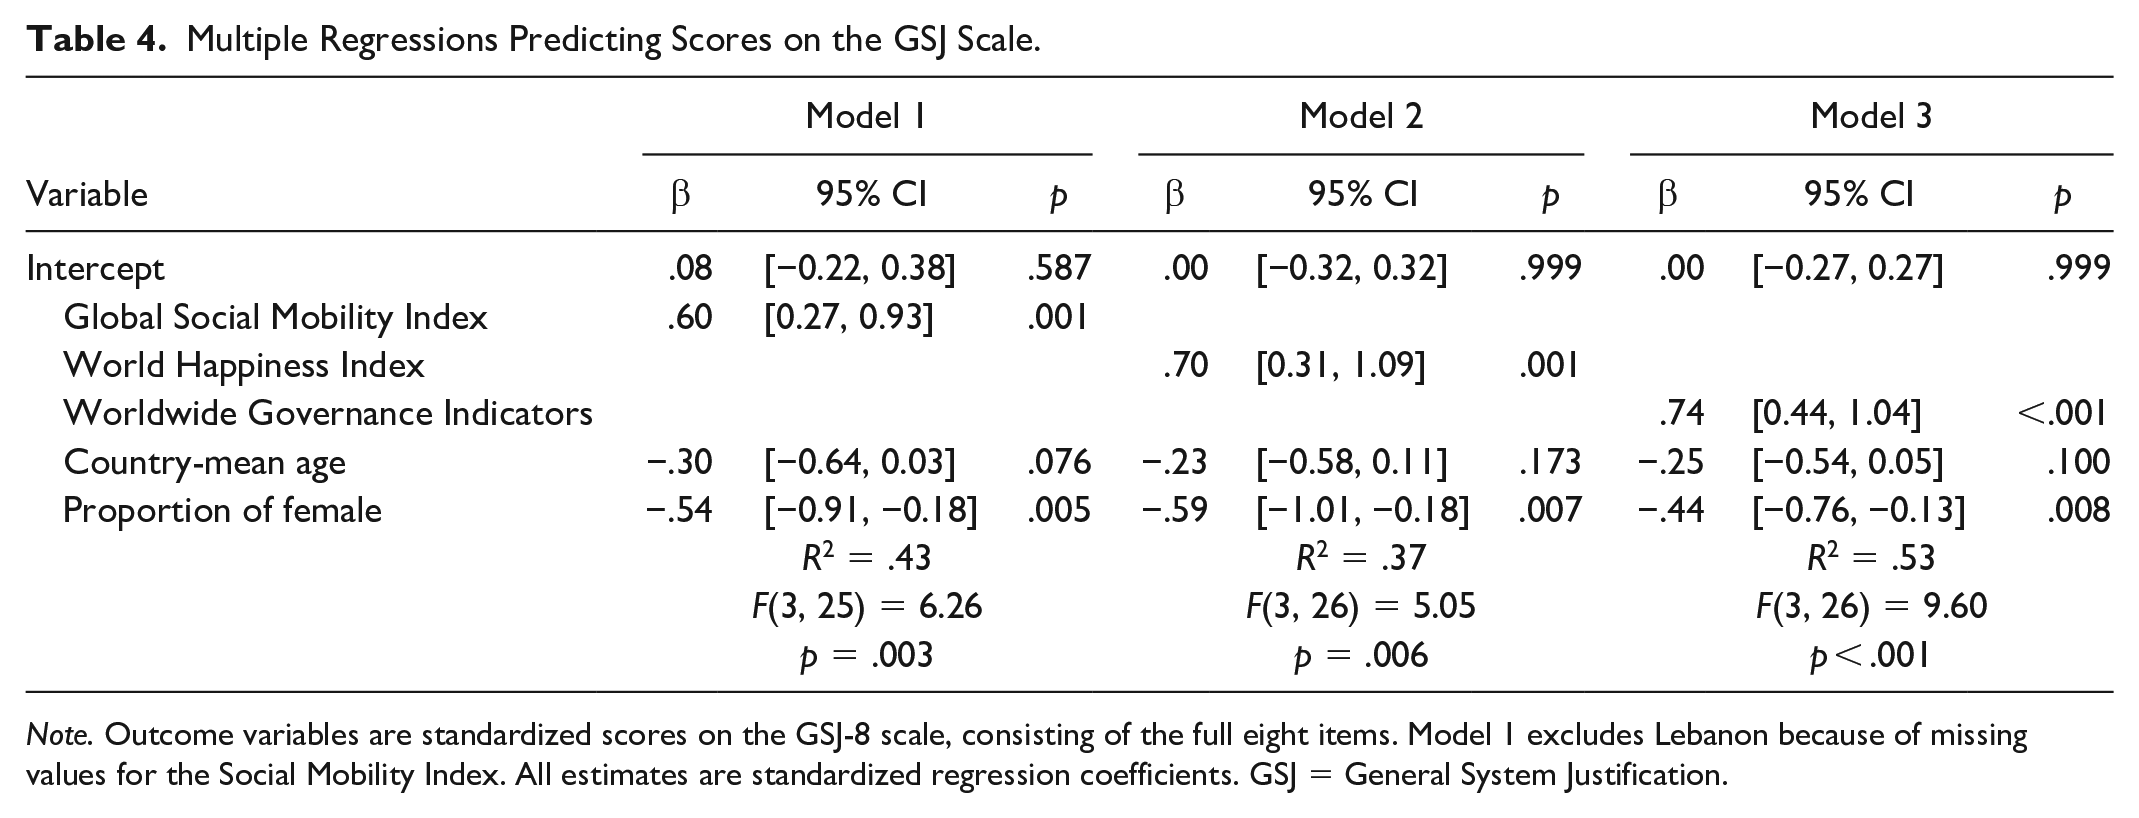
Note. Outcome variables are standardized scores on the GSJ-8 scale, consisting of the full eight items. Model 1 excludes Lebanon because of missing values for the Social Mobility Index. All estimates are standardized regression coefficients. GSJ = General System Justification.
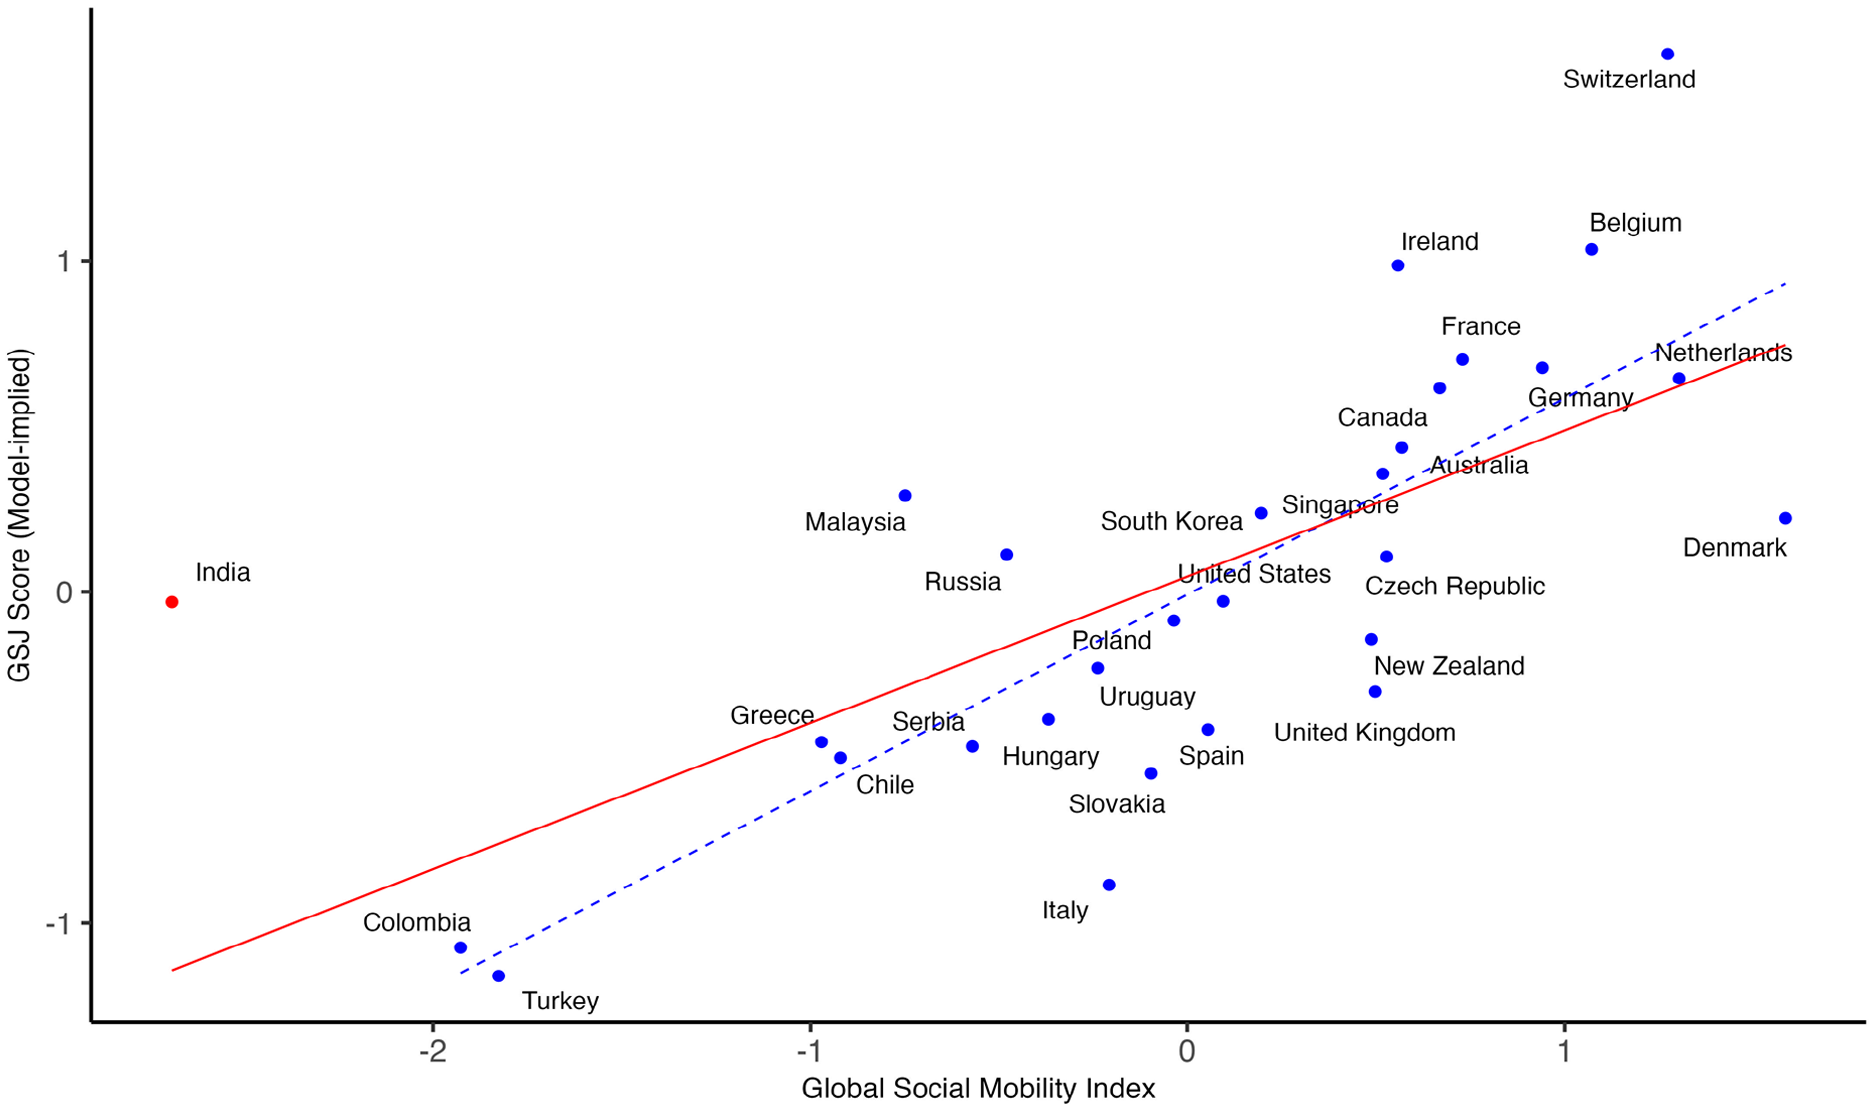
Objective social mobility is positively associated with General System Justification scores at the country level.
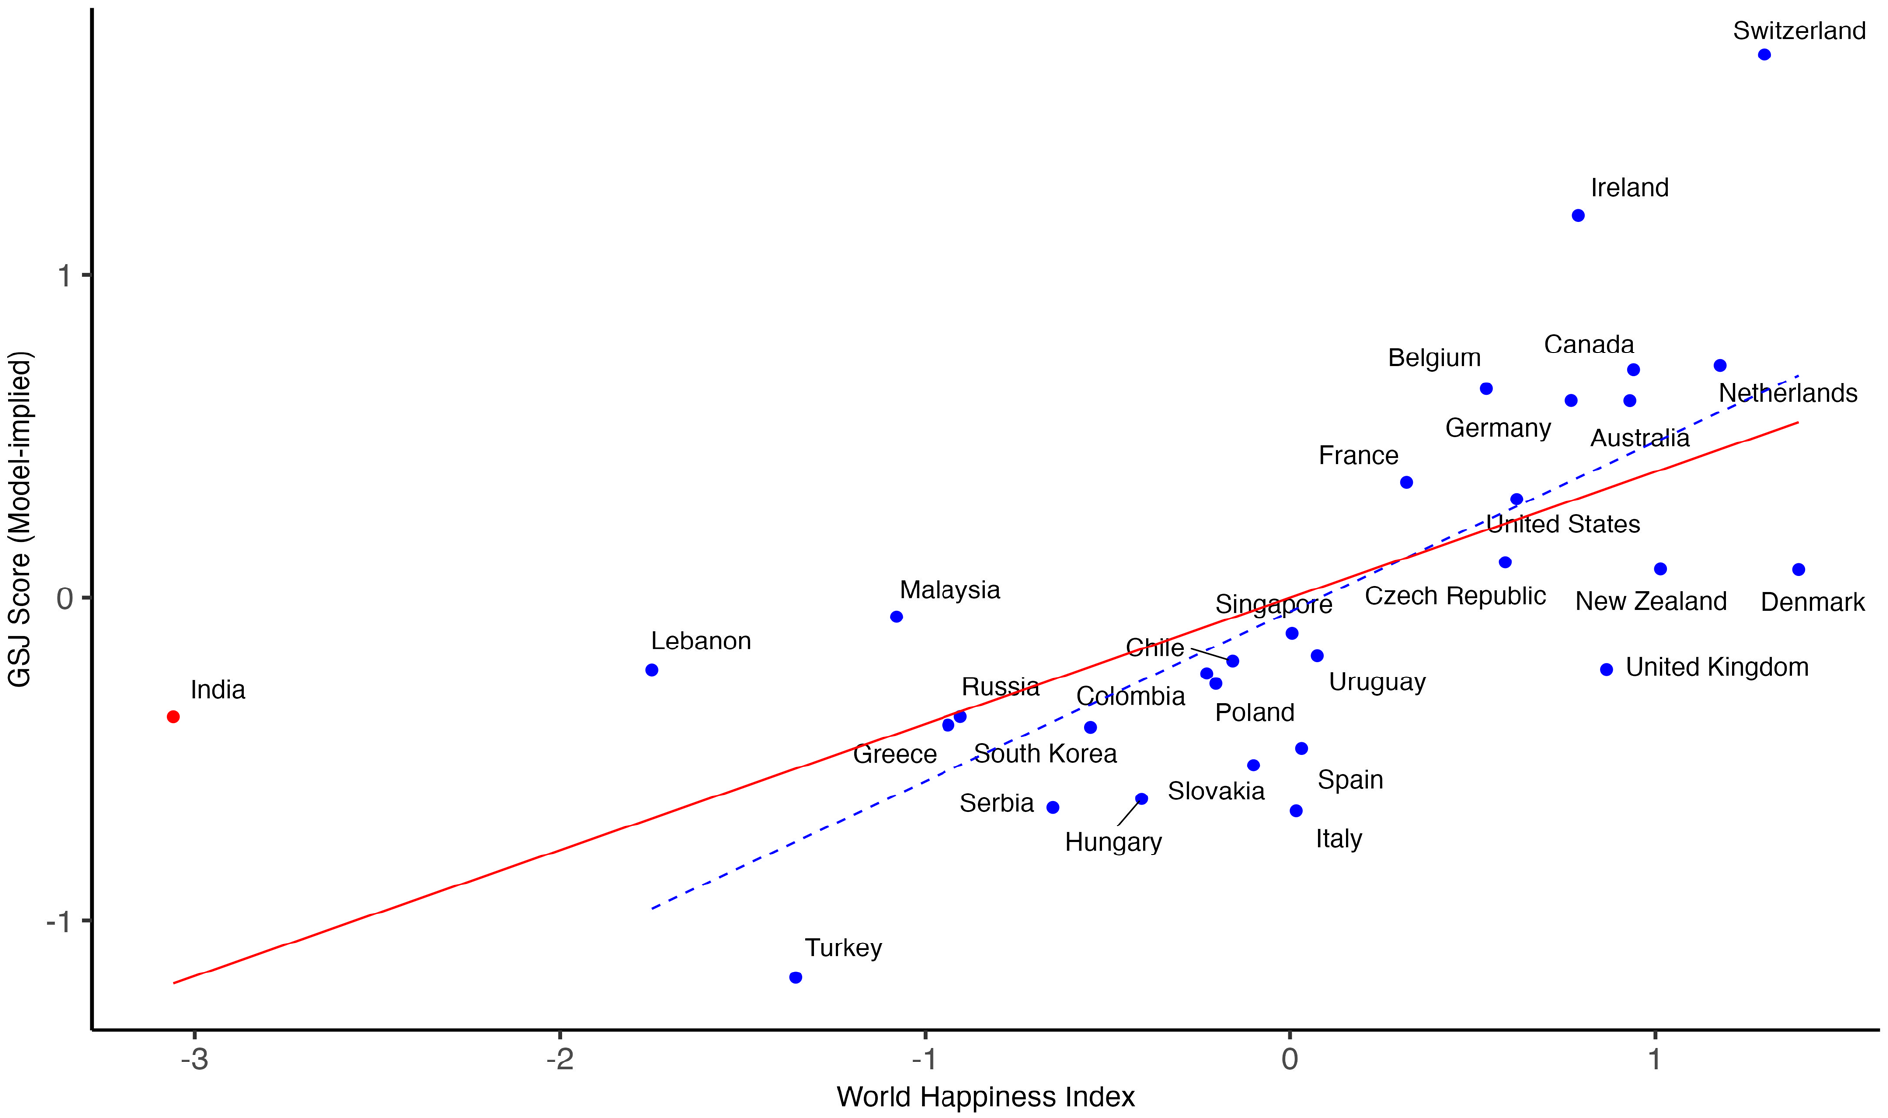
Objective societal well-being is positively associated with General System Justification scores at the country level.
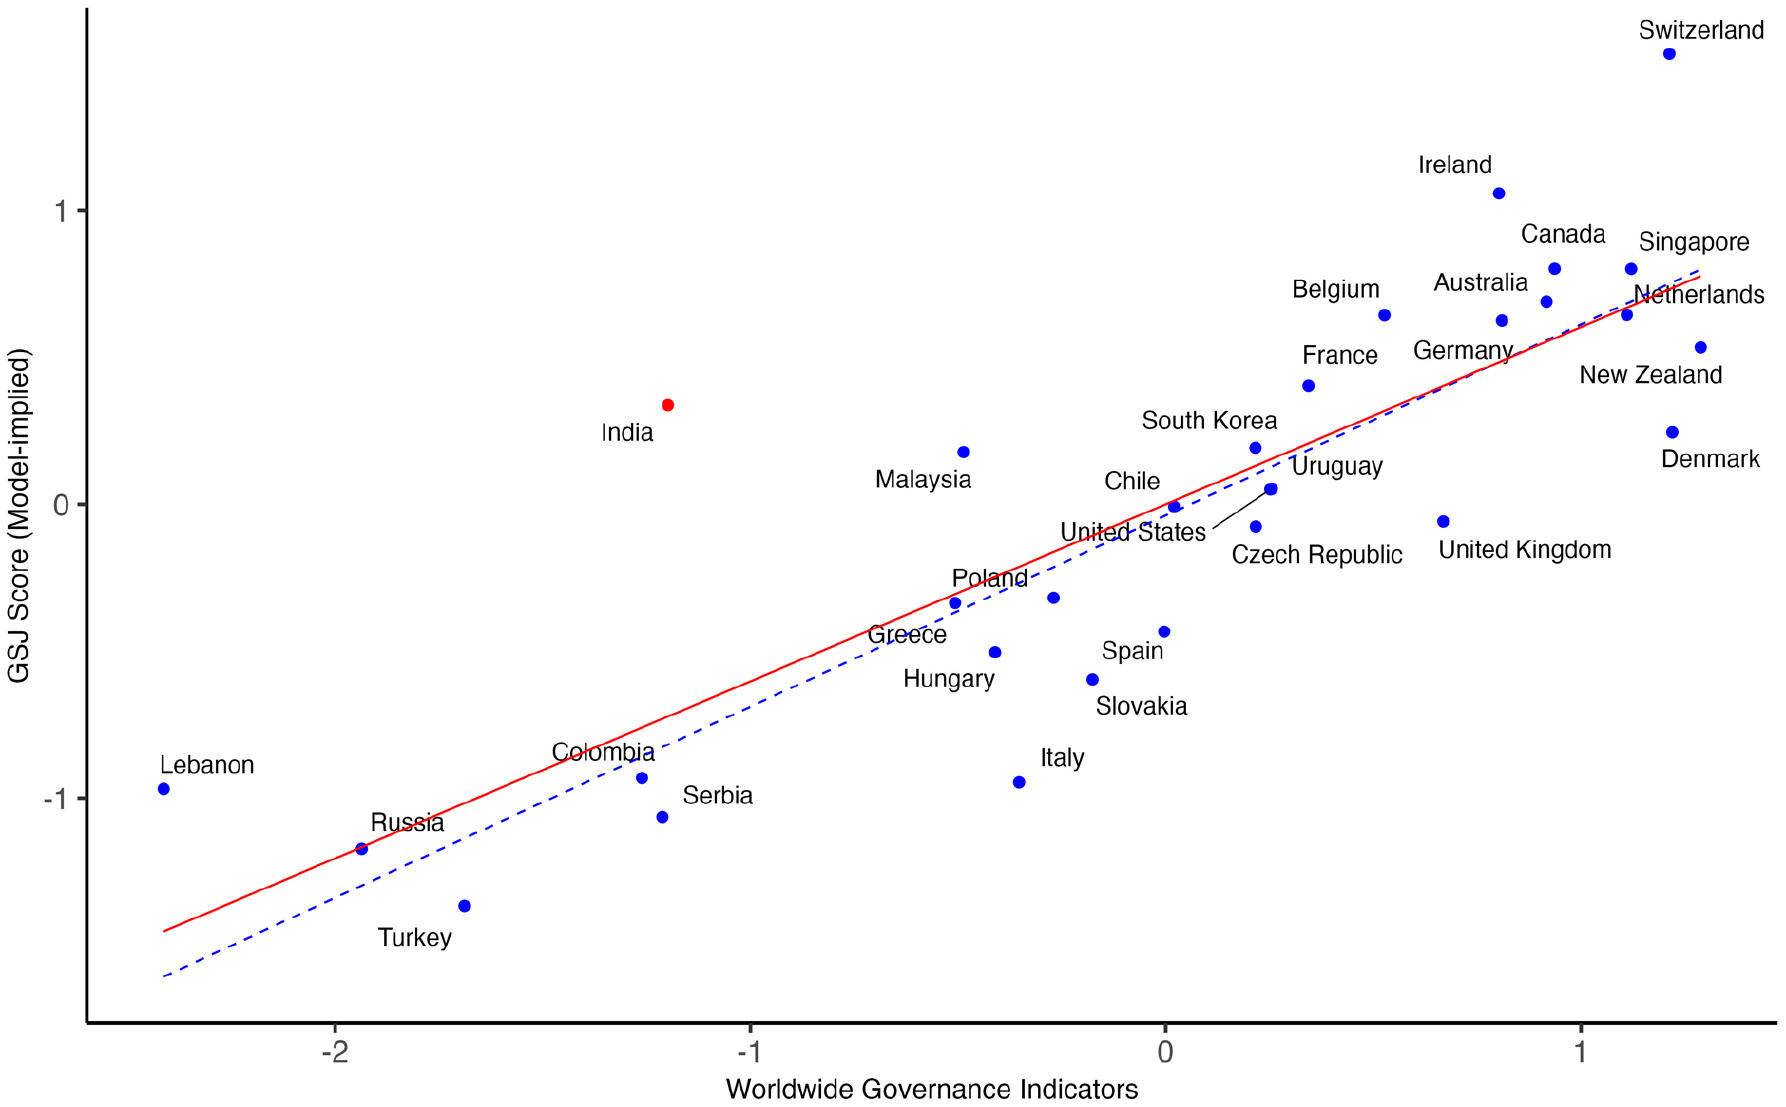
Objective governance quality is positively associated with General System Justification scores at the country level.
General Discussion
Our analyses demonstrate that measurement non-invariance can result from extreme yet uniform response patterns that reflect genuine societal and cultural phenomena rather than sample bias. Respondents in countries with high levels of social mobility and societal well-being (such as Denmark and Switzerland) consistently agree that “Everyone has a fair shot at wealth and happiness,” while respondents in countries facing political instability and economic crises (such as Lebanon and Türkiye) overwhelmingly disagree that “In general, our political system operates as it should.”
Despite lacking measurement invariance under both MGCFA and alignment optimization methods, the GSJ scale’s strong correlations with criterion variables reveal that it captures bona fide cross-societal differences. Rigidly following measurement invariance recommendations would limit analyses to only those countries with moderate to high within-group variability; this is a common practice, but it obscures truly valuable insights into the connections between subjective perceptions and objective socioeconomic realities.
We discovered that non-invariance is preferable to approximate (or partial) invariance when drawing cross-national comparisons about system justification beliefs. While alignment optimization offers an apparently sophisticated solution for overcoming measurement invariance with numerous groups, it achieves this by reducing between-group variability, thereby undermining nomological validity. This approach only reinforces epistemological assumptions that are problematic for cross-national and cross-cultural research goals (see also Minkov et al., 2024). Unfortunately, recent statistical advancements do not address these fundamental issues.
The recent explosion of research in personality and social psychology comparing the attitudes, beliefs, values, norms, and ideologies across diverse societies—especially “non-WEIRD (Western, Educated, Industrialized, Rich, and Democratic)” societies (see Henrich et al., 2010)—has intensified methodological concerns about the validity of scales that violate rigorous measurement invariance standards. A growing number of critics have bemoaned the neglect of measurement invariance standards in the cross-cultural application of existing psychological scales (e.g., Boer et al., 2018; Dong & Dumas, 2020; Maassen et al., 2023; Steenkamp & Baumgartner, 1998; Vesper et al., 2022). However, proponents of measurement invariance testing have rarely questioned why psychological scales violate invariance assumptions so often and so easily. Nor have they wondered whether the purpose of measurement invariance testing fundamentally contradicts the goals of comparative research.
Consider this less-than-subtle analogy: a hammer is designed specifically for driving nails into wood; if an IT technician uses it to work on a smartphone’s delicate internal components, the hammer will almost surely cause severe damage, no matter how sophisticated the technique that is applied. This analogy highlights the necessity of bearing in mind the historical roots and dedicated purposes of specific methodological tools in the social sciences. We have seen that measurement invariance techniques originated from efforts to develop culture-fair assessments, as in the case of intelligence testing, for selecting individuals in high-stakes decisions. Measurement invariance techniques seek to remove any and all group differences, including social and cultural influences, because they are considered irrelevant to the theoretical construct of interest. However, applying the same measurement invariance criteria indiscriminately to investigate social and political constructs that are expected to vary across cultures and societies is at best counterproductive and at worst destructive to the enterprise of comparative research.
Personality and social psychologists are often interested in comparing values, attitudes, beliefs, and ideologies across social groups—and not just individuals. In such cases, researchers do not necessarily need to establish measurement invariance. Instead, they should consider various exploratory analyses—interviews, correlational analyses, visualization—during the nomological validation process to detect method biases at various stages of the research process (e.g., He & van de Vijver, 2012; Robitzsch, 2023). Resulting scales and interpretations should seek to understand rather than eliminate social and cultural nuances.
A recent debate concerning cross-cultural comparisons focused on the construct of sexual emancipation (abortion, divorce, and acceptance of homosexuality) is instructive and germane. Analyzing data from the World Values Survey, Zhirkov and Welzel (2024) observed that an “acceptance of homosexuality” item violated both metric (equality of item loadings) and scalar (equality of item intercepts) forms of invariance. In Libya, for instance, an overwhelming majority of respondents reject this item. The decision about whether or not to drop this item or exclude Libya based on measurement invariance statistics depends upon several considerations of a theoretical (or meta-theoretical) nature. One school of thought suggests that sociopolitical conditions are irrelevant to the psychological construct under investigation (Fischer et al., 2023), whereas another sees these conditions as integral to the drawing of cultural comparisons (Welzel, Kruse, & Brunkert, 2023). This debate illustrates how different research goals and assumptions shape interpretations of measurement non-invariance even in the same data set.
Fischer et al. (2023) argued that the homosexuality item represents “bias” attributable to the criminalization of same-sex relationships in Libya (Human Dignity Trust, n.d.). They contend that survey responses should be free from such strong legal strictures, because extreme (and uniform) responses in Libya are likely to misrepresent “true” attitudes toward sexual minorities and instead reflect unwillingness to publicly sanction illegal behavior. Implicit in this reasoning is that the item in question distorts intended comparisons of individuals because anti-homosexuality laws—which are absent in most countries—cause Libyan respondents to appear more homophobic than they actually are.
Welzel, Kruse, and Brunkert (2023), on the other hand, argue that the same item is valuable for differentiating between sexually repressive and tolerant cultures. Although this item violates invariance because of extreme, uniform responses in certain countries, it increases nomological validity because of substantial between-country variability (Zhirkov & Welzel, 2024). From a sociocultural perspective, the criminalization of homosexuality in some countries is integral to the understanding of cultural differences in the formation and expression of attitudes. This logic is broadly consistent with system justification theory, insofar as citizens are likely to accept the “laws of the land” as legitimate more often than not (Jost, 2020).
In Table 5, we outline a conceptual framework based on the foregoing for determining when measurement invariance should be applied and how to interpret non-invariant items or groups in divergent research contexts. We recognize that many, if not most, psychological instruments were initially developed to assess individual differences within specific populations. However, these same instruments could also be used to explore cross-national or cross-cultural differences. Social psychological constructs are often theorized to be dynamic and context-sensitive. Thus, Jost et al. (2003) once remarked that studying political ideology “exclusively from the standpoint of personality theory is a mistake,” because it “neglects growing evidence that situational factors influence the experience and expression” of ideology (pp. 339–340). This view reflects social psychology’s longstanding emphasis, since at least the time of Kurt Lewin, on the “person in the situation”—the interplay between individuals and their social contexts (Ross & Nisbett, 2011).
A Conceptual Guideline for Determining When Measurement Testing Is and Is Not Desirable.
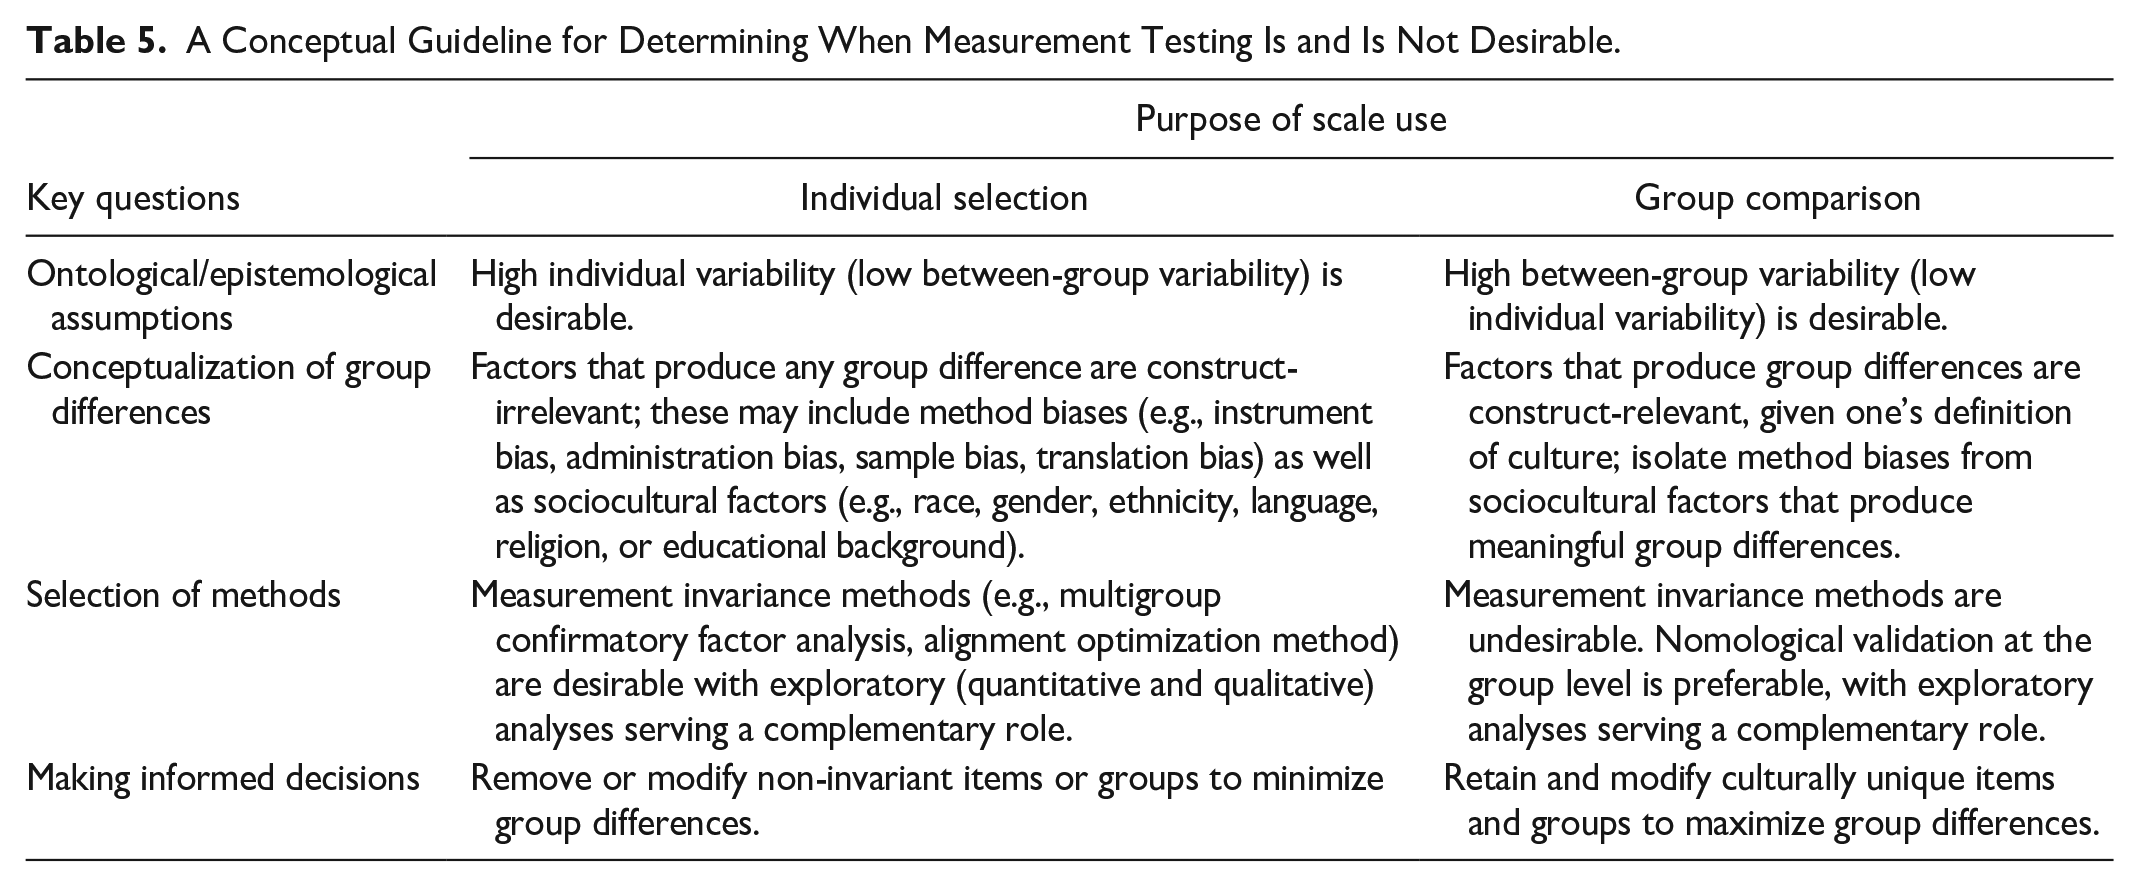
The guidelines presented in Table 5 are intended to emphasize that the same psychological instruments (such as system justification scales) can flexibly serve multiple purposes in different research contexts rather than being confined to either individual selection or group comparison purposes. For example, a personality measure of conscientiousness may be used to predict individual job performance for selection purposes in one organization, for better or worse. The same measure may turn out to exhibit highly extreme and uniform responses in another organization, where, in this case, it has poor utility as an individual difference measure. This situation opens up a novel path, at least in theory, to understand and compare differences in workplace cultures across organizations.
In the future, we expect that increasing the diversity of research samples will reveal social and cultural nuances with respect to many existing psychological scales. In such cases, we would encourage researchers to expand upon their research goals and ontological assumptions. This is important because psychological processes often operate at multiple levels, including individual, group, and system levels of analysis (Doise, 1986). Unique and valuable insights are sure to emerge from each level of analysis (Stangor & Jost, 1997). Before these insights can be realized, however, it is necessary to reject an overly restrictive status quo in which measurement invariance testing is a “default” requirement in psychological research.
Because the empirical dimension of our critique is based on a single case study, we cannot make universal research recommendations. Instead, we encourage researchers to reconsider and, when it is theoretically warranted, pivot away from traditional practices of measurement invariance. Future scholarship would do well to consider whether the issues we raise apply to other social psychological constructs used in comparative research. Such efforts will help to refine our preliminary recommendations and ultimately contribute to the establishment of alternative standards for scale validation.
We recognize that our alternative approach, which emphasizes nomological validity, creates additional challenges, such as the need for large numbers of divergent samples. If a dataset contains respondents only from Japan and the United States, it would be difficult to identify precisely which specific sociocultural factors distinguish the two countries, because there are so many factors that differ between them. Our approach is more easily accomplished by using large-scale cross-national datasets, as in the World Values Survey or the 30-country comparison in which we investigated societal-level differences in GSJ. Fortunately, international collaboration in psychology is becoming much more common and affordable. This should make it easier for researchers to explore nomological validity when evaluating the cross-national or cross-cultural validity of psychological scales.
Some authors express concern that “anything goes” once measurement invariance standards are ignored (Meuleman et al., 2023). To assuage such concerns, we emphasize the need for a strong theoretical foundation in comparative research and scale development. Indeed, the need for sound theory is not limited to cross-cultural research but applies to all areas of psychological science (Muthukrishna & Henrich, 2019). To establish nomological validity, researchers should clearly articulate what the construct should (and should not) correlate with at the group or societal level. In the absence of robust theoretical frameworks, there is a genuine risk that studies concentrating exclusively on nomological validity will produce tenuous conclusions based on spurious correlations.
Conclusion
The psychometrician Frederic M. Lord famously quipped that “the numbers don’t remember where they came from” (Lord, 1953, p. 751). Because this is so, we began the article by reviewing the genealogical roots of measurement invariance testing in the context of assessing racial differences in general intelligence and noting the importance of interpreting numbers (and formulas) in light of their historical context, research goals, and ontological assumptions. Psychologists have indeed achieved global success in raising assessment standards in education and other areas of psychological research. However, many social, cultural, and political outcomes are largely shared within groups while varying between them, and they require non-standard, alternative approaches to validation. Rather than adhering to measurement invariance criteria, we advocate exploring the constructs’ nomological net to establish cross-national or cross-cultural validity. Psychological instruments need not be invariant or equivalent across societies and cultures, as long as they are useful and justifiable when it comes to documenting meaningful societal or cultural differences.
Supplemental Material
sj-docx-1-psp-10.1177_01461672251341402 – Supplemental material for The Mismeasure of Culture: Why Measurement Invariance Is Rarely Appropriate for Comparative Research in Psychology
Supplemental material, sj-docx-1-psp-10.1177_01461672251341402 for The Mismeasure of Culture: Why Measurement Invariance Is Rarely Appropriate for Comparative Research in Psychology by Kodai Kusano, Jaime L. Napier and John T. Jost in Personality and Social Psychology Bulletin
Footnotes
Declaration of Conflicting Interests
The author(s) declared no potential conflicts of interest with respect to the research, authorship, and/or publication of this article.
Funding
The author(s) received no financial support for the research, authorship, and/or publication of this article.
Supplemental Material
Supplemental Material is available online with this article.
Notes
References
Supplementary Material
Please find the following supplemental material available below.
For Open Access articles published under a Creative Commons License, all supplemental material carries the same license as the article it is associated with.
For non-Open Access articles published, all supplemental material carries a non-exclusive license, and permission requests for re-use of supplemental material or any part of supplemental material shall be sent directly to the copyright owner as specified in the copyright notice associated with the article.