
Abstract
A focal point in the acculturation literature is the so-called “integration hypothesis,” whereby integration (high mainstream cultural engagement and heritage cultural maintenance) is associated with higher psychosocial adjustment, compared to other strategies. Yet, the vast majority of this literature is cross-sectional, raising questions about how best to understand associations between integration and adjustment. Does greater integration lead to greater psychosocial adjustment, as proposed by the integration hypothesis? Or is it the other way around, with more adjustment leading to greater integration, consistent with what we name the “mental resources hypothesis?” This study tests these 2 competing hypotheses in a 4-wave longitudinal study of 278 international students in their first weeks and months in Canada. The results replicate well-documented cross-sectional acculturation-adjustment associations. They also show that baseline adjustment is prospectively associated with later integration and mainstream acculturation, but not vice versa, supporting the mental resources hypothesis but not the integration hypothesis.
Keywords
They celebrated Christmas in addition to Chinese New Year’s, and were regulars at Radio City Music Hall. Ralph owned a Davy Crockett hat. Helen knew most of the words of the songs in The King and I, and South Pacific. It was true that she still inquired of people if they’d eaten yet, odd as it sounded; Ralph invented his grammar on the fly; even Theresa struggled to put her Chinese thoughts in English. But now she had English thoughts too—that was true also.
Typical American (Gish Jen, 1992, p. 123)
Gish Jen’s novel follows the life and acculturation of a Chinese migrant family in the United States. As illustrated in the above passage, Ralph, Helen, and Theresa have forged a bicultural life over their time in the United States, where they adopt and engage in the American cultural mainstream while also maintaining their Chinese cultural heritage. A core tenet of acculturation research is that migrants who, like the Chang family, manage this dual cultural engagement are better off both functionally and emotionally (Berry, 2005; Nguyen & Benet-Martínez, 2013). Even so, the question remains: which one comes first? Does successfully managing this complex cultural challenge lead to improved well-being? Or is it the other way around? Does better adjustment help one negotiate a bicultural life, as with the Chang family? We investigate these specific questions in the present research, using a longitudinal design and focusing on international students’ first year in their new country.
Psychological Acculturation and Psychosocial Adjustment
Psychological acculturation refers to the change process people undergo when they have prolonged contact with a cultural context different from the one in which they were socialized (Ward & Geeraert, 2016). This complex process involves adopting new values, behaviors, and cultural patterns prevalent in the new cultural environment (mainstream acculturation) as well as negotiating whether and how to maintain engagement with one’s preexisting cultural background (heritage acculturation). With ever-increasing international migration world-wide, a large and growing number of people undergo acculturative changes. An estimated 281 million people were living in a country other than their countries of birth in 2020, over three times the estimated number in 1970 (McAuliffe & Triandafyllidou, 2021). This trend is similar for international students, with more than 6 million in 2019, three times more than in 2000 (Migration Data Portal, 2023). In Canada, where this study took place, there were roughly 622,000 international students in 2021, an 80% increase from 2000 (Statistics Canada, 2022).
Cross-cultural psychologists have led the way in developing a now imposing literature on acculturation. They have sought to answer questions such as which migrants do well, which ones struggle, and why? A focal point in this literature is the so-called “integration hypothesis” whereby integration is associated with the best psychosocial adjustment outcomes compared to other acculturation profiles (assimilation, separation, or marginalization; Sam & Berry, 2010, 2016). Integration involves maintaining heritage cultural engagement and identity (high heritage acculturation) coupled with adopting features of the cultural mainstream (high mainstream acculturation) (Berry, 1980, 2005). This dual cultural engagement is not present in assimilation (high mainstream acculturation and low heritage acculturation), separation (low mainstream acculturation and high heritage acculturation), or marginalization (low mainstream and heritage acculturation). Psychosocial adjustment encompasses psychological and sociocultural dimensions (Searle & Ward, 1990): psychological adjustment refers to emotional well-being, such as feeling happy and at ease in the new cultural environment; sociocultural adaptation refers to practical and behavioral competence, such as knowing how to secure a place in daycare for one’s child or how to navigate the workplace. Many studies have shown that integration scales, in which participants endorse items describing both heritage and mainstream acculturation, correlate positively with measures of psychosocial adjustment (e.g., Pham & Harris, 2001; Sam & Berry, 1995; Virta et al., 2004). This positive acculturation-adjustment association could be described as “received wisdom” in the acculturation literature by this point.
Indeed, Nguyen and Benet-Martinez’s (2013) frequently cited meta-analysis seemed to have settled the issue. They reported strong effects for integration and for heritage and mainstream underlying dimensions measured separately. However, a recent meta-analysis by Bierwiaczonek and Kunst (2021) has called into question this strong support for the integration hypothesis. Using a more commonly accepted statistical procedure (weighted-mean approach to random effects instead of Rosenthal’s counternull approach—the latter typically yielding values considerably larger than the former, leading to confusion in interpretation) and accounting for publication bias, the authors found a weak positive association between mainstream acculturation and adjustment, but no reliable effects for heritage acculturation or the integration strategy. Complicating the picture even further, several studies have shown that acculturation-adjustment associations may depend on characteristics of the social context, such as perceived neighborhood ethnic density (e.g., Jurcik et al., 2019) or acculturation discrepancies within romantic couples (Rapaport et al., 2021).
Leaving aside these variations, a glaring gap remains. Most acculturation studies (94% of studies included in Nguyen & Benet-Martinez’s 2013 meta-analysis) are cross-sectional, raising questions about how best to understand the acculturation-adjustment relation. Bierwiaczonek and Kunst’s (2021) meta-analysis was able to identify only 19 relevant longitudinal studies, with nine samples of international students, seven samples of migrant children and adolescents, and three samples of adult migrants. The vast majority of studies focused on migration to North America and Europe and most studies included only two time points. This meta-analysis yielded longitudinal acculturation-adjustment effects that were both inconsistent and approaching zero. For example, the effects of adjustment on integration were positive or negative depending on time points and the reverse effects were negative but so close to zero that any change of sign might be considered irrelevant. Here, we probe two outstanding longitudinal issues regarding: (a) the order of effects and (b) the timing of the waves.
Directionality: Which One Comes First?
Few, if any, acculturation researchers have mistaken correlation for causation. Yet, there is a tendency to treat acculturation—whether viewed as orthogonal mainstream and heritage dimensions or as a set of “strategies” encompassing different combinations of these dimensions—as the independent variable predicting psychosocial adjustment (Rudmin, 2009). According to the integration hypothesis, one adopts an integration strategy and ends up adjusting better and adapting more effectively: one learns the language, makes local friends, and eats local foods, which results in higher levels of adjustment. However, other temporal dynamics are also possible.
Acculturation is mentally costly. Navigating a new cultural environment without well-established cultural schemas to guide oneself is cognitively effortful (Doucerain, 2019). Integrating more or less compatible cultural repertoires within the self may depend on the cognitive resources people already have at their disposal (Bierwiaczonek & Kunst, 2021). Furthermore, highly stressed people may avoid parallel mainstream-heritage cultural engagement because of, “the extra conflict and diversity-related stress that this acculturation strategy produces” (Luijters et al., 2006, p. 561).
A cultural-clinical psychology perspective (Ryder et al., 2011), which takes a joint interest in cultural and clinical questions, might also be useful here. Clinically, one might well expect a psychosocial adjustment problem to have consequences for curiosity, attention, cognitive effort, social confidence, and so on—all attributes that prove useful when navigating a less familiar cultural environment (van der Zee et al., 2016). In short, we contend that an alternative “mental resources hypothesis,” whereby greater psychosocial adjustment represents a resource that prospectively predicts greater integration, is as plausible as the widely touted integration hypothesis. In other words, this hypothesis implies that integration involves a “cost” or expenditure of resources that may not be available to all migrants.
The view of psychosocial adjustment as a resource echoes recent perspectives in organizational research. Grounded in positive psychology, Luthans and Youssef (2004) describe positive state-like capacities—malleable and open to change, compared to psychological traits—as psychological resources positively influencing performance and organizational behavior. Their work focuses mainly on hope, resilience, optimism, and self-efficacy, with the recognition that psychological well-being could be seen as such a psychological resource (Luthans et al., 2008). Accordingly, Reitz and colleagues (2022) found that greater psychological adjustment prospectively predicted more positive work transitions in a representative sample of Dutch participants. Such findings could plausibly apply to other life transitions such as migration.
The extant longitudinal acculturation literature does not support a clear conclusion regarding these competing “mental resources” versus “integration” hypotheses. For example, regarding the integration hypothesis, Schwartz and colleagues (2015) found that Hispanic adolescents in the United States whose heritage and mainstream acculturation did not increase over time reported the least favorable mental health outcomes. In contrast, Lönnqvist and colleagues (2015) found no prospective associations between acculturation and psychological adjustment among migrants from Russia to Finland. In their meta-analysis of longitudinal studies, Bierwiaczonek and Kunst (2021) found that time-lagged associations between acculturation and adjustment were weak and inconsistent. Timing of the data collection waves, which we discuss next, may be partly responsible for such disparate results.
Timing: What Stage of The Acculturation Journey Is Captured?
The last decade has seen a surge of longitudinal acculturation studies (Doucerain, Deschênes, et al., 2017). This body of work is heterogeneous in terms of where it captures migrants along their acculturation journey—and yet, timing ought to matter (e.g., Cheung et al., 2011). For instance, the mainstream acculturation-adjustment interplay likely looks very different for a migrant spending her first winter in Canada than for one marrying off the last of her Canadian-born children. We concentrate here on the first weeks and months post-settlement for two reasons.
First, acculturation may become less relevant for adaptation—or vice versa—at later stages when one’s position regarding mainstream and heritage cultural traditions has become more settled (Bierwiaczonek & Kunst, 2021). Thus, this early focus may maximize the likelihood of detecting lagged acculturation-adjustment effects. Second, recent theoretical accounts describe the interplay between culture and psychology—of which acculturation is a prime example—as a dynamic system (e.g., Chentsova-Dutton & Ryder, 2019). Dynamical systems theory underscores that initial conditions are critical. Indeed, “the specific trajectory of self-organization in a system reflects the system’s attempt to satisfy multiple constraints embedded in the initial state of the system” (Vallacher et al., 2002, p. 267). Besides being theoretically meaningful, the early post-migration stage may also be practically relevant. Initial conditions play a crucial role in influencing trajectories of change (Doucerain et al., 2017). Thus, understanding these initial conditions could help design interventions with more leverage on downstream outcomes than at other time points.
Adjustment-Acculturation Shortly After Settlement: Lay of The Land
In this work, we consider the directionality of the acculturation-adjustment relation, focusing on early effects because of the reasons just discussed. We investigate associations between initial adjustment/acculturation and subsequent acculturation/adjustment at the early stage of migrants’ acculturation journey (i.e., the first weeks and months post-migration). We could only identify a handful of directly relevant research projects, highlighting the novelty of our investigation.
Researchers have measured initial, or baseline, conditions in two ways. People expect and plan important life transitions (Amiot et al., 2007) and settle in a new country with predispositions that will influence their acculturation journey (Tartakovsky, 2009). For example, fulfillment of expectations in Russian-speaking immigrants predicted their adjustment outcomes above and beyond personality traits and acculturation levels (Yakobov et al., 2019). Therefore, some researchers have assessed baseline conditions pre-migration. Among 90 international students in the United States, pre-migration acculturation strategies patterned with sociocultural adjustment 3 months post-migration (Cemalcilar & Falbo, 2008): adjustment was lower for separation (low mainstream and high heritage acculturation) than for the other strategies. Jasinskaja-Lahti (2012) collected data from 325 ethnic migrants from Russia to Finland, with 1 pre-migration assessment and 3 post-migration follow-ups at 6 months, 2 years, and 3 years after arrival (correlations in Table S5 of Bierwiaczonek & Kunst, 2021 meta-analysis). Correlations between mainstream acculturation at Time t and later adjustment were overall positive but quite small (−.06 to .18). They were similarly positive for the reverse order of effects (−.01 to .13). In the heritage case, correlations were overall negative but quite small in the acculturation to adjustment direction (−.20 to .04); they were small and inconsistent for the reverse order of effects (−.17 to .10). In short, these results provide equally little support for both integration and mental resources hypotheses.
The use of such pre–post migration designs is ideal but presents considerable logistical difficulties. Other researchers have therefore measured initial/baseline conditions shortly after arrival (e.g., 1 month) in the new country. A rationale for this approach is that such a brief exposure to the new cultural environment would not have allowed for significant changes in constructs of interest, and therefore baseline assessments are adequate proxies for pre-migration characteristics. Japanese students in the United Kingdom (N = 35) who reported higher in-group bias—a loose proxy for a separation acculturation strategy—shortly after arrival reported reduced psychosomatic illness 8 months later (Greenland & Brown, 2005). Among 126 sojourning Chinese in the United States, T1–T2 correlations between mainstream identification and psychological well-being (3 months apart) were not significantly different from 0 in either direction (Zhu et al., 2016). To summarize, no clear pattern of results emerges from these studies, which relied mostly on small samples. A systematic and well-powered investigation of early-stage prospective adjustment–acculturation associations is needed.
Acculturation Measurement
Seminal acculturation theories center on the four acculturation strategies resulting from crossing a person’s mainstream and heritage orientations. For example, one may contrast the relative benefits of adopting an assimilation (high mainstream, low heritage acculturation) versus a separation (low mainstream, high heritage acculturation) strategy. Traditionally, researchers have used four separate typological scales to assess acculturation strategies (one for each strategy). Unfortunately, this approach suffers from major psychometric flaws (Rudmin & Ahmadzadeh, 2001). Using bilinear scales to assess mainstream and heritage acculturation separately is another approach. Two scales assess acculturation toward mainstream and heritage cultural streams, typically with mirror wording. For example, an item may probe whether participants adopt mainstream cultural practices and its mirror item whether they adopt heritage cultural practices. This approach is now considered best practice (Doucerain et al., 2017; Ryder et al., 2000) and modern acculturation research is moving in that direction. For example, 18 out of the 19 longitudinal studies included in Bierwiaczonek & Kunst, 2021 meta-analysis relied on this bilinear approach. This is also the approach we adopt here.
Nevertheless, acculturation strategies (Berry, 1997, 2005) provide a meaningful and widely accepted theoretical framework, even if the categorization process leads to a loss of dimensional information. In line with this framework, researchers using two independent mainstream and heritage acculturation scales often allocate participants to one of the four acculturation strategies through a median, mean, or midpoint split. These dichotomization procedures place participants into groups that score high or low on heritage-culture maintenance and mainstream-culture adoption. For example, a score is considered low if below the mid-scale value, and high if above that value. This placement categorizes people into the four acculturation strategies. The midpoint-split procedure, which we adopt here, is preferable over mean and median splits on conceptual grounds: it relies on a meaningful middle point on the Likert-type scales rather than on sample-specific and relative cut-off values (Arends-Tóth & van de Vijver, 2006).
This procedure still results in severe loss of variability. In many samples, most participants score high on both mainstream and heritage acculturation scales—a common occurrence in our Canadian research experience. In such cases, categories other than the integration strategy may be virtually unpopulated (Demes & Geeraert, 2014). Furthermore, this procedure provides no information regarding how strongly one endorses a strategy. To circumvent this issue, we developed a novel way to use bilinear scales to generate non-dichotomous, typological strategy scores, which we detail in the methods section.
The Present Study
The “integration hypothesis” has become a cornerstone of acculturation research. Its existence often seems to be taken for granted. Yet, this presumed acculturation to adjustment pathway relies overwhelmingly on cross-sectional designs that shed little insight into causality (Kunst, 2021). Fortunately, longitudinal studies, which are essential to establishing temporal precedence, have become more frequent in the last decade. The relatively few that do exist have yielded only weak and inconsistent results, however, based on a recent meta-analysis of 19 longitudinal studies (Bierwiaczonek & Kunst, 2021). One key issue blurring the picture is how heterogeneous these longitudinal studies are with respect to time frame and populations studied (migrant adults, migrant children, international students). In addition, many were not designed to test acculturation-adjustment prospective associations systematically.
We target these issues and draw on the idea that timing matters when looking at changes over time. This longitudinal study captures the first academic year of international students who recently arrived in Canada, with four time points. This population faces issues of acculturation and adjustment (Smith & Khawaja, 2011) while being more easily accessible for research recruitment than other migrant groups. Also, arrival time is highly predictable because of its synchronization with the academic year cycle. These characteristics make it possible to test integration versus mental resources hypotheses by recruiting participants easily and almost immediately after migration.
First, we seek to replicate the well-documented cross-sectional results expecting that
Next, we probe prospective associations between baseline and later values. We test two competing—yet non-mutually exclusive—hypotheses:
Method
Participants and Procedure
We recruited newly arrived international students at two Montreal universities, one offering primary instruction in French and one in English. Recruitment took place at the beginning of the academic year in two ways. First, we posted flyers around both campuses. Second, research assistants attended information sessions for international students and handed out pamphlets on the study. Flyers and pamphlets invited international students to take part in a study on cultural identities and adaptation. We recruited fresh cohorts each year for 3 consecutive years (all before the COVID-19 pandemic). Eligibility criteria required students to: (a) have arrived in Montreal less than 3 months prior to the study; (b) plan to stay in Montreal for at least 1 year; and (c) have an international student status. Our longitudinal design included four time points, with roughly 2 months between each assessment. This choice reflected a balance between having sufficiently many time points to model change over time and feasibility considerations such as limiting participant burden to avoid attrition. The first (baseline) assessment took place in September, followed by assessments in November, January, and March. Thus, our longitudinal study was conducted over 7 months. Participants completed all assessments online and received a $10 online bookstore gift certificate as compensation for their time. They provided informed consent online before taking part in the study. To minimize drop-out, we additionally entered participants who completed all four assessments in a draw for three cash prizes awarded at the end of each academic year. The review boards of the first and last authors’ institutions approved the study. This study is part of a larger project on international students’ adaptation to a new cultural environment, which included additional measures.
Across the three academic years, 492 international students took part in the first assessment. Among them, 278 (183 females) completed at least 1 additional assessment and were therefore included in this study. Specifically, 135 students completed all 4 assessments, 75 completed 3 assessments, and 68 completed only 2 assessments. We still re-invited participants who missed one time point at subsequent assessments. For example, a person could complete Times 1, 3, and 4. Attrition rates were similar across the three cohorts (44% in year 1, 40% in year 2, and 49% in year 3).
On average, participants were 22.44 years old (SD = 4.66) and came from 48 different countries. Nine participants did not report their country of origin, but we inferred it from the native language and heritage culture they reported (e.g., we inferred “Argentina” as country of birth from Spanish native language and Argentinian heritage culture). These inferences are described in the Supplementary materials. A total of 181 participants came from Europe (65%); 19 from North America (7%); 19 from Central/South America (7%); 10 from sub-Saharan Africa (4%); 15 from North Africa/ the Middle East (5%); 15 from South Asia (5%); 18 from East/South-East Asia (6%); and 1 from Oceania. On average, they had arrived in Montreal 27.51 days (SD = 18.23) before the baseline assessment. Most participants spoke French as their native language (58%) and attended a francophone university (58%). Given that Montreal is in the Canadian province of Quebec, where French is the official language, adapting to the Montreal cultural environment with a native command of French may represent a qualitatively different experience from acculturating with another native language. To take this possibility into account, we included native language recoded as French-versus-other as a binary covariate in all analyses.
To test whether attrition could have affected the results, we used logistic regression on the complete data (i.e., including all three cohorts) to predict the probability of completing only the first assessment (N = 214) versus completing more than one assessment (N = 278), with all study variables and some demographic variables (cohort, age, sex, francophone-versus-anglophone university, and French-versus-other native language) entered as predictors. Males and younger participants were more likely to leave the study after the first assessment than females, B = 0.48, SE = 0.21, t = 2.32, p = .02, and older participants, B = −0.07, SE = 0.03, t = −2.48, p = .01, similar to findings from other studies (Demes & Geeraert, 2014; Karsenti, & Thibert, 1994).
Measures
In addition to providing demographic information, participants completed the following questionnaires at each time point. Where necessary, measures were translated from English to French using a committee approach to translation (Douglas & Craig, 2007), which ensures that most time and attention are devoted to problematic content.
Acculturation
The Quebec version of the Vancouver Index of Acculturation (VIA; Ryder et al., 2000) is a 30-item questionnaire with 3 subscales assessing acculturation toward participants’ heritage group (VIA-H) and both of Quebec’s mainstream cultural traditions: French-Canadian (VIA-FC) and English-Canadian (VIA-EC). We will later describe how we use these two mainstream subscales to generate a single mainstream score. The subscales comprise 10 items each, with parallel wording. Agreement with items such as “It is important for me to maintain or develop English-Canadian cultural practices” is rated on a 1 Strongly disagree to 9 Strongly agree scale. Total scores can range from 1 to 9 (mean of item scores), with greater scores indexing a more positive orientation toward the cultural group assessed. Past research has shown that the VIA is a reliable and valid measure of acculturation (Huynh et al., 2009; Ryder et al., 2013; Testa et al., 2019). Internal consistency in this sample was acceptable to excellent across time points for both heritage (αs = .89–.92) and mainstream (αs = .81–.88 for VIA-FC and αs .78–.87 for VIA-EC) subscales.
We established longitudinal invariance across time points for all three subscales by running confirmatory factor analyses with VIA-H, VIA-EC, and VIA-FC items loadings on their respective latent variable. We compared χ2 and CFI values of (a) models with factor loadings constrained to be equal across time points versus free to vary across time points (metric, or “weak” invariance) and (b) models with factor loadings constrained to be equal across time points versus factor loadings and item intercepts constrained to be equal across time points (scalar, or “strong” invariance). All three subscales reached metric invariance based on statistically non-significant chi-square differences, ∆χ2(27)s = 37, 33.5, and 29.7, ps = .10, .18, and .33, respectively, and changes in CFI values <0.01 (∆CFI = −0.002, −0.003, and −0.001, respectively). Only VIA-H reached scalar invariance, ∆χ2(27) = 14, p = .98, and ∆CFI = 0.003. Given that scalar invariance is less relevant in models that are not focused on mean comparisons, such as regression-based analyses (including mixed-effects regression), we proceeded as planned. We operationalized acculturation in three ways: bidimensionally; categorically (midpoint split); and typologically (this new method is described below).
Bidimensional Operationalization
We used VIA-H average scores directly for the heritage dimension. As in past research (e.g., Doucerain, Deschênes, et al., 2017), mainstream acculturation (VIA-M) was indexed by scores on the VIA-FC subscale for participants attending a francophone university and scores on the VIA-EC subscale for participants attending an anglophone university.
Categorical Operationalization
We used a midpoint split, whereby participants with VIA-M and VIA-H average scores greater than 5 were assigned to an “integration strategy” category, and the rest of the sample was assigned to an “other strategies” category. We did not create independent categories for the three other strategies for two reasons. First, this dichotomy reflects our specific probing of the integration hypothesis and is therefore aligned with our theoretical framework. Second, because of VIA-M and VIA-H scores distribution in our sample, group sizes for the other three categories would have been too small to generate statistically meaningful comparisons (10% of observations for separation, 5% for assimilation, and 4% for marginalization).
Typological Operationalization
We devised a procedure placing, for each participant, pairs of mirror VIA-M and VIA-H scores on a quadrant with corresponding mainstream and heritage acculturation axes ranging from 1 to 9 (VIA Likert-type scale range). As illustrated in Figure 1, item pairs with high scores for both dimensions (in the top-right quadrant) reflect a participant’s endorsement of an integration strategy. The closer to the top-right corner the scores, the stronger the endorsement. We then assigned integration scores to each pair of VIA-M and VIA-H mirror items present in the top-right integration quadrant, decreasing from a maximum of 4 in the top-right corner to a minimum of 0 for the mid-scale bands. For instance, in Figure 1, coordinate scores of 6 on VIA-M (X-axis) and 9 on VIA-H (Y-axis) yield an integration score of 1 (i.e., a limited level of integration for this item pair). We then summed up these item pair integration scores and divided the sum by the total number of item pairs (10), thus yielding a total typological integration score for each participant, in a possible range of 0 to 4. Of note, one could compute typological scores for the other acculturation strategies by applying the same procedure to corresponding quadrants.
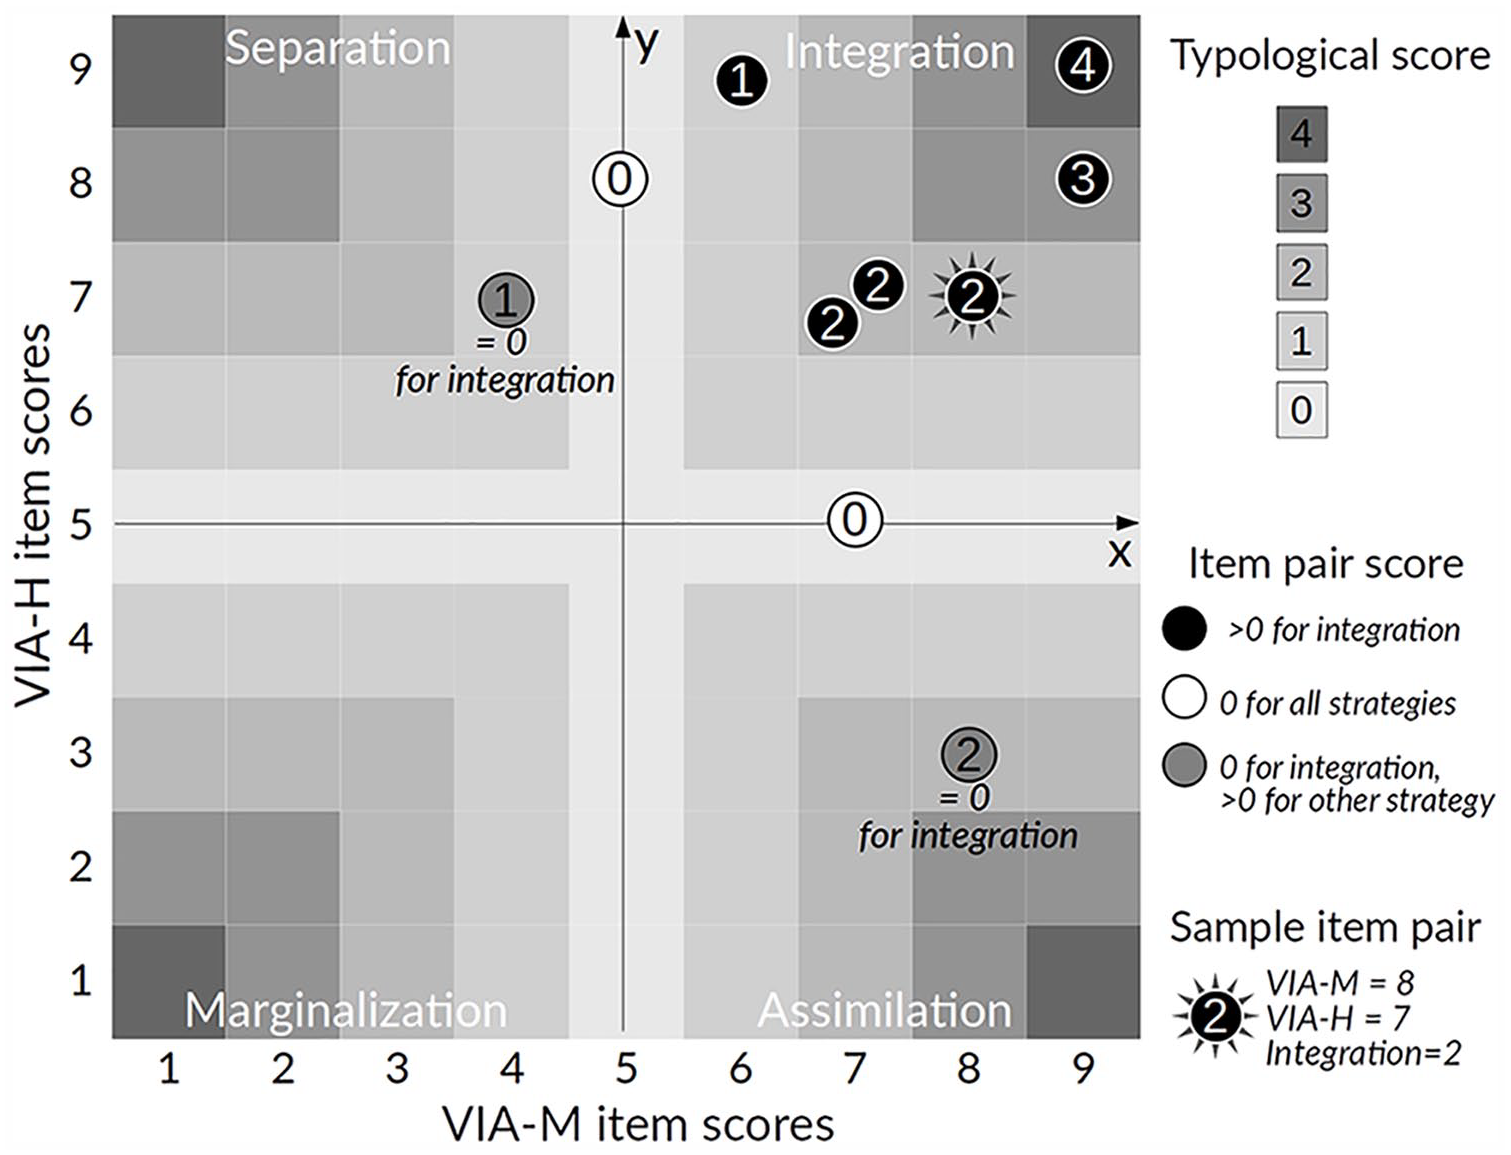
Typological procedure illustration for a sample participant.
Figure 1 illustrates this procedure for a hypothetical participant from Venezuela attending the English-speaking university. She scored 8 on the VIA-M item “It is important for me to maintain or develop English-Canadian cultural practices” and 7 on the parallel VIA-H item “It is important for me to maintain or develop Venezuelan cultural practices.” These dimensional scores, illustrated by the star-shaped symbol in Figure 1, yield an integration typological score of 2 based on the assigned score from the X- and Y-axis coordinates. Five other item pairs (black circles) have VIA-M and VIA-H scores >5. Therefore, these pairs contribute positive values in the computation of the integration typological score. Two item pairs have VIA-M and VIA-H scores of 5 (white circles in mid-scale bands) and 2 others have scores <5 (gray circles), therefore yielding typological integration scores of 0. The participant’s total integration score would be the sum of 0, 0, 0, 0, 1, 2, 2, 2, 3, and 4 divided by 10: 1.4. If researchers wanted to compute typological scores for other strategies, which is not the case here, one pair (gray circle) could be considered for a separation total score (with value 1) and one other one for an assimilation total score (with value 2).
Psychosocial Adjustment
We used three indices of psychosocial adjustment. The Center for Epidemiological Studies–Depression (CESD) scale (Radloff, 1977) is a 20-item questionnaire assessing depressive symptoms, an index of psychological adjustment. Participants rated the frequency of items such as “I had crying spells” on a 0 Rarely to 3 Most or all of the time scale. Total scores can range from 0 to 60, with greater scores indexing higher levels of depression. Internal consistency in this sample was excellent across time points, αs = .90 to .93.
The Socio-Cultural Adjustment Scale (SCAS; Ward & Kennedy, 1999) is a 30-item questionnaire assessing migrants’ difficulties in navigating their new sociocultural environment, an index of sociocultural adjustment. Participants rated the difficulty of items such as “Dealing with people in authority” on a 1 No difficulty to 5 Extreme difficulty scale. Total scores can range from 1 to 5, with greater scores indexing lower levels of sociocultural adjustment. Internal consistency in this sample was excellent across time points, αs = .92 to .95.
The Riverside Acculturative Stress Inventory (RASI; Benet-Martínez & Haritatos, 2005) is a 15-item questionnaire assessing difficulties adapting to a new cultural environment. Participants rate their agreement with items such as “I feel that my particular cultural/ethnic practices have caused conflict in my relationships” on a 1 Strongly disagree to 5 Strongly agree scale. Total scores can range from 1 to 5, with greater scores indexing higher levels of acculturative stress. Internal consistency in this sample was good to excellent across time points, αs = .87 to .92.
Adjustment Composite
For the sake of parsimony, we created a single adjustment score reflecting the three adjustment facets measured here. We first checked that CESD, SCAS, and RASI scores were indicators of a single adjustment latent construct using confirmatory factor analysis. We rescaled CESD scores so that they would have the same 1 to 5 possible range as SCAS and RASI scores, and reversed all three variables so that greater scores indicate greater adjustment. We then tested a model with a latent adjustment variable for each time point, with corresponding CESD, SCAS, and RASI scores as indicators, and with correlated measurement residuals for each adjustment facet. Model fit was excellent, whether loadings for a given indicator were constrained to be equal across time points, χ2(36) = 36.20, p = .46, CFI = 1.00, RMSEA = 0.004, SRMR = 0.04, or free to vary, χ2(30) = 27.48, p = .60, CFI = 1.00, RMSEA = 0.00, SRMR = 0.03. Loadings ranged between 0.52 and 0.96 for the constrained model and between 0.47 and 0.95 for the free-to-vary model. Furthermore, this adjustment operationalization reached metric invariance across time points, ∆χ2(6) = 3.12, p = .79, and ∆CFI = 0.00. Therefore, we created a single adjustment composite score (1–5 possible range) by taking the mean of the rescaled CESD, SCAS, and RASI scores.
Cultural Distance
Past research has shown that it is more challenging to adjust to a more (vs. less) culturally distant country (Searle & Ward, 1990; Ward & Kennedy, 1999). Therefore, we included an index of cultural distance between Canada and participants’ country of origin as a covariate in all analyses. The Kogut and Singh (1988) index is commonly used but some research has shown that it is problematic (Konara & Mohr, 2019). Therefore, we used an alternative theory-driven generic culture distance index proposed by Yeganeh (2011) and its application to Canada. We used the absolute value of distance indices provided by Yeganeh (2011; Table 7). When distances were not available for a participant’s country of origin, scores for the closest available country were used (e.g., West Africa for Mauritius or Arab countries for Syria; all decisions are described in Supplementary materials).
General Analytic Approach
Data were analyzed using R, version 4.2.1 (R Core Team, 2021) and packages jtools, version 2.2.0 (Long, 2020), ggplot, version 3.3.6 (Wickham, 2016), lme4, version 1.1.30 (Bates et al., 2015), lavaan, version 0.6.12 (Rosseel, 2012), and Amelia II, version 1.7.6 (Honaker et al., 2011). The studies’ design and analyses were not pre-registered. Materials and data analysis code are available at: https://osf.io/598yc/?view_only=510bd9c7f3744fe697eaa4e2d3e05857. Data are available upon request.
A priori power analyses are notoriously difficult for multilevel analyses (Matuschek et al., 2017), in part because of complexities tied to random effects. Therefore, we determined sample size in line with feasibility considerations and we base our power estimation on the average sample size of longitudinal acculturation-adjustment studies conducted among international students and considered in Bierwiaczonek and Kunst’s (2021) meta-analysis, N = 204.8. With N = 278, power was deemed sufficient for the current study. Univariate outliers (0.68% of values) were winsorized to three median absolute deviations around the median (Leys et al., 2013). One participant was identified as a multivariate outlier for all time points based on Mahalanobis distances (evaluated at p < .001), but it did not affect the results and was therefore left untouched. Missing data were few (0.33% of VIA-M scores and 0.33% of VIA-H scores), missing completely at random based on the results of non-parametric tests of homogeneity of covariance, p =. 51 (Jamshidian & Jalal, 2010), and imputed using expectation-maximization.
Results
Descriptive Results
Table 1 displays descriptive statistics and correlations for the study variables at all time points. Shortly after arrival in Montreal, at baseline, participants reported fairly high mainstream and heritage acculturation, based on VIA-M and VIA-H scores. Baseline VIA-H scores were on average higher than VIA-M scores, t(524) = 7.3, p < .001. Both variables were significantly positively correlated at all time points. Throughout the study, roughly 80% of the sample was in the integration category, but typological integration scores were moderate. Participants reported fairly high adjustment levels overall, with low levels of sociocultural difficulties (SAS scores) and acculturative stress (RASI scores). However, CESD scores hovered around the cut-off score of 16, which is indicative of mild depressive symptomatology. Across assessments, mainstream acculturation was negatively associated with sociocultural adjustment and acculturative stress, and positively related to adjustment as a composite. Zero-order correlations between VIA-H and adjustment indicators were also significant in some instances, but not consistently across indicators and assessments.
Descriptive Statistics and Bivariate Correlations Among Study Variables.
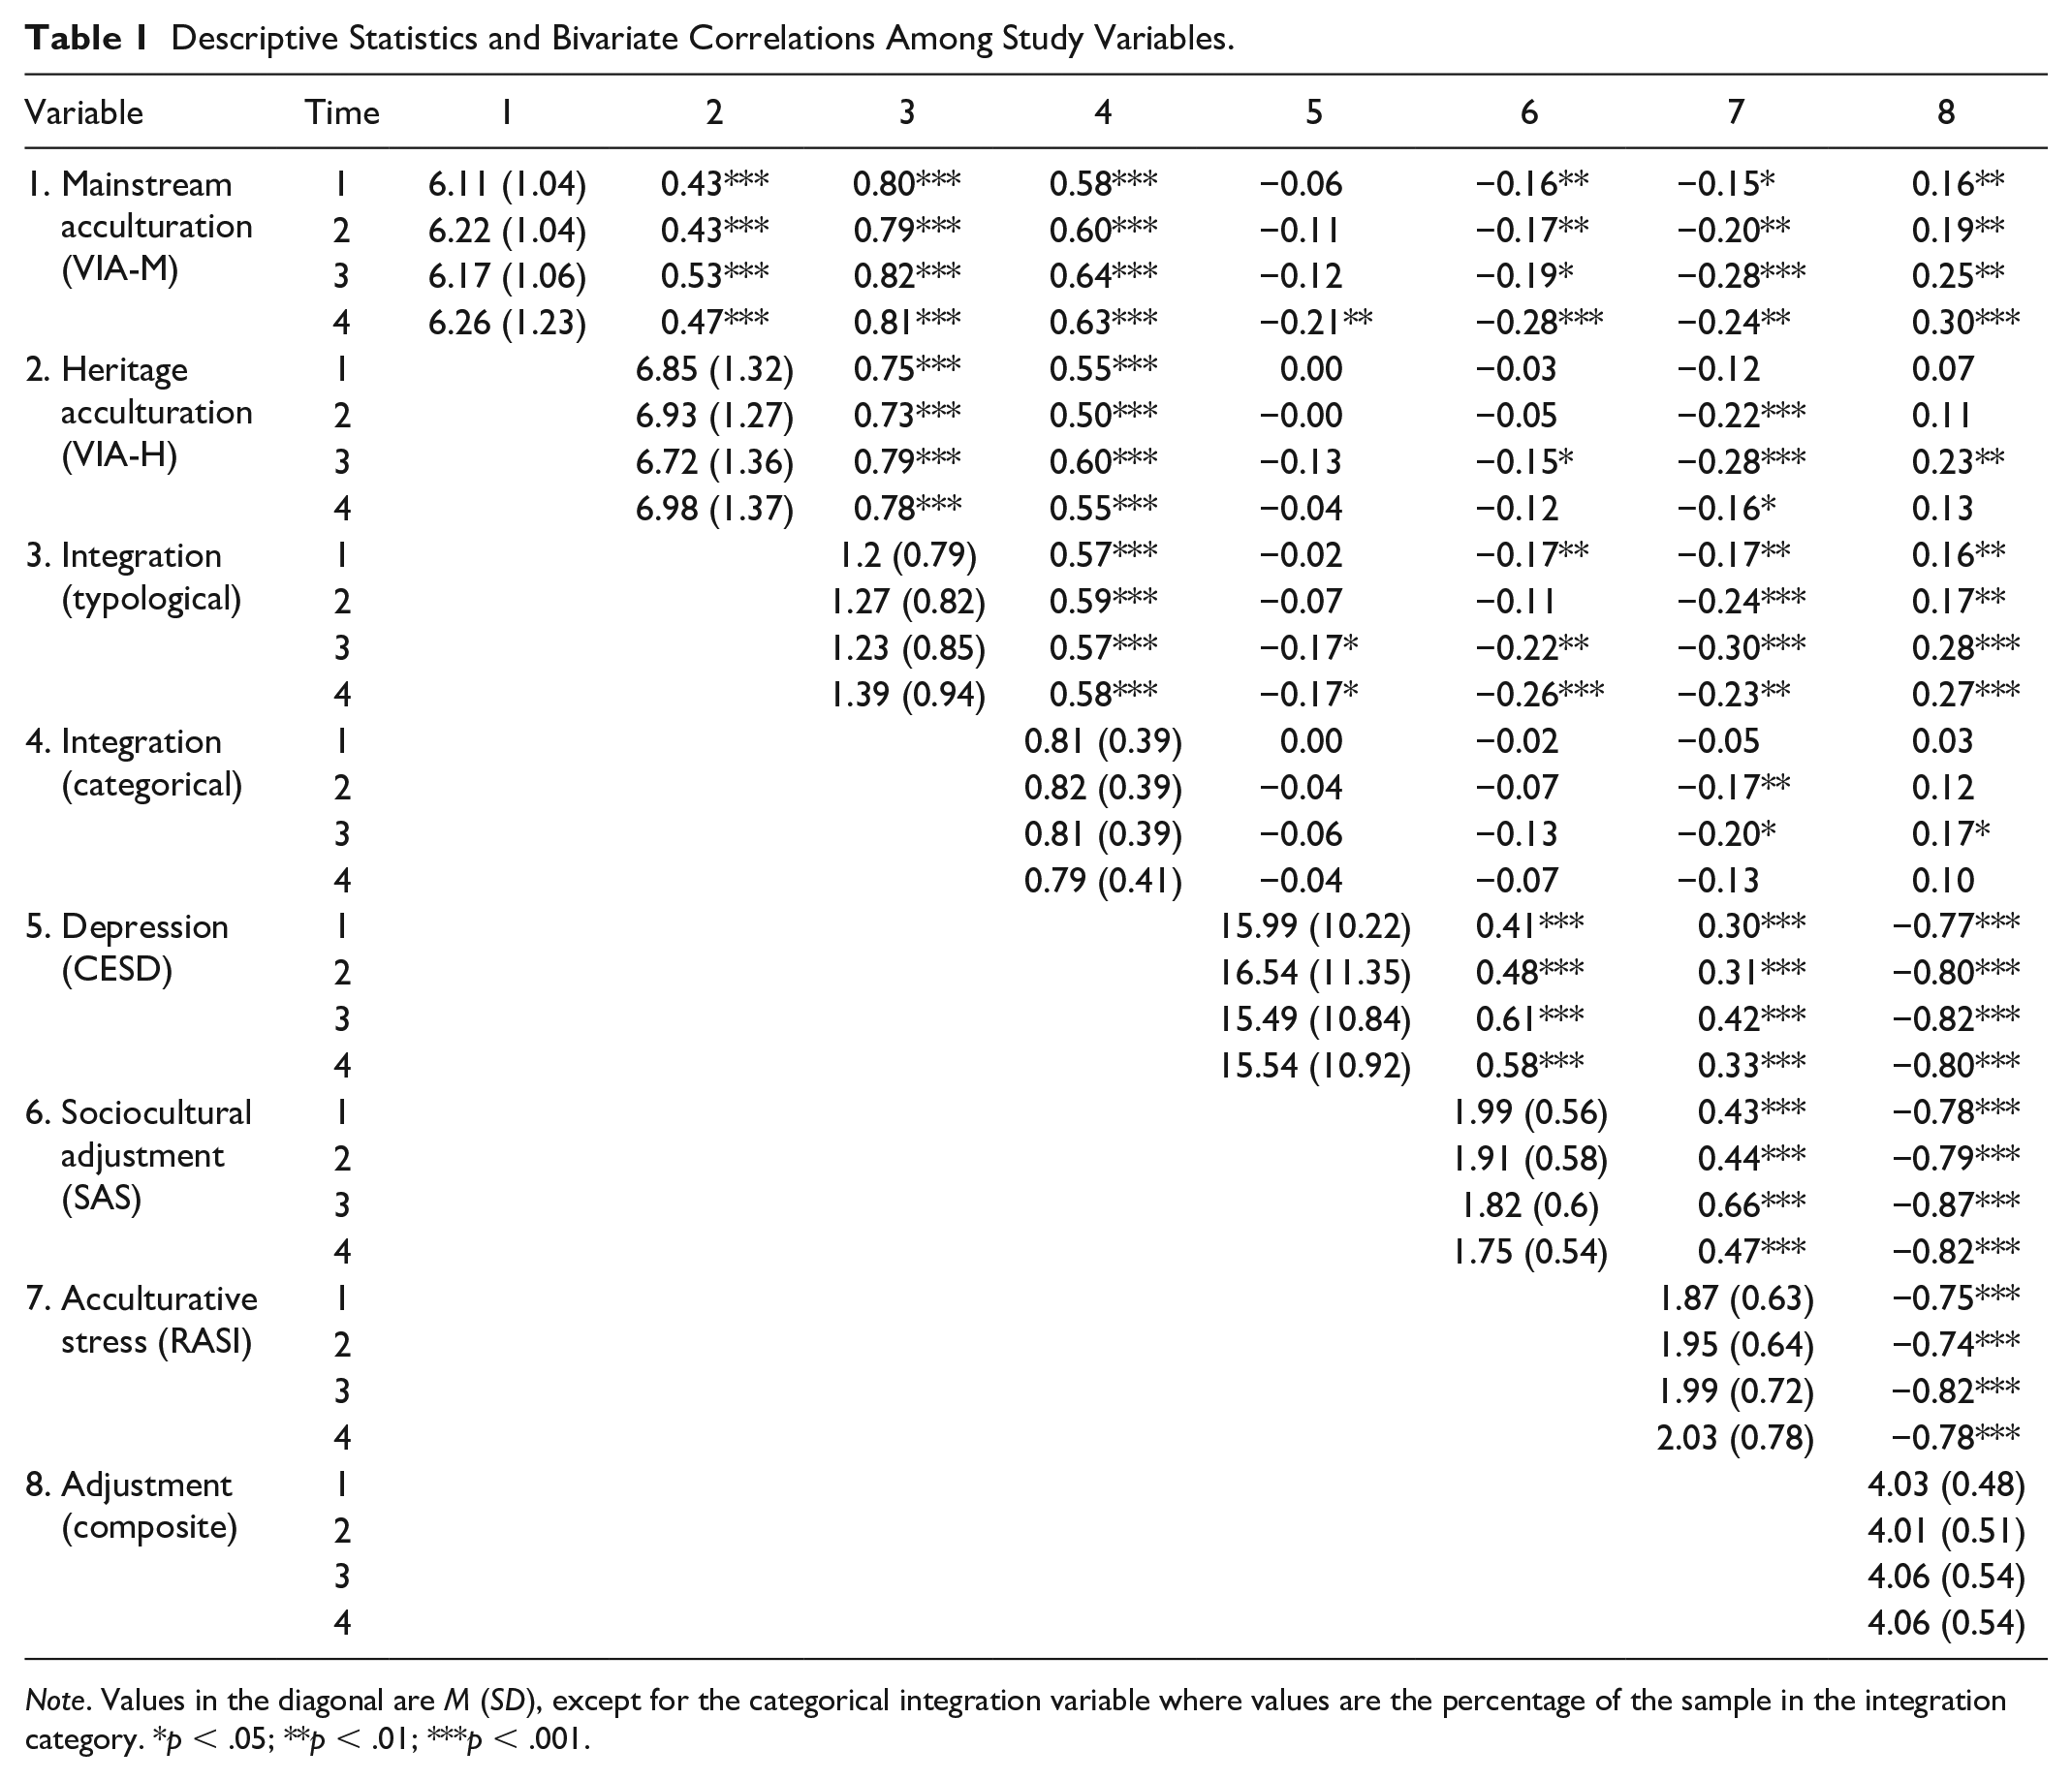
Note. Values in the diagonal are M (SD), except for the categorical integration variable where values are the percentage of the sample in the integration category. *p < .05; **p < .01; ***p < .001.
Cross-Sectional Associations Between Acculturation and Adjustment
Analytic Approach
We used mixed-effects models (Level 1 time points nested within Level 2 participants) to examine cross-sectional associations between adjustment and acculturation. After entering sex, age, native language of participants (French-versus-other), and cultural distance as Level 2 covariates, acculturation was entered as Level 1 predictor of adjustment scores (composite). The three different acculturation operationalizations were entered into three separate models to estimate their separate contributions. In a third step, we entered them jointly to determine their relative and unique contributions. Multicollinearity was moderate but adequate for this last step (VIFs ≤ 5.03). Table 2 displays the results of these analyses. We specified random intercepts only, based on likelihood ratio tests showing that random slopes for acculturation terms were unnecessary (all ps > .05). We checked statistical assumptions using mixed-effects regression diagnostics. Residuals were leptokurtic but there was no issue of skewness, linearity, or homoscedasticity. One observation seemed particularly influent (based on its Cook’s distance separate from the rest of the distribution), but, given that the results remained the same upon inclusion or removal of this observation, it was kept in the analyses.
Cross-Sectional Association Between Psychosocial Adjustment and Acculturation: Mixed-Effect Models Predicting Adjustment.
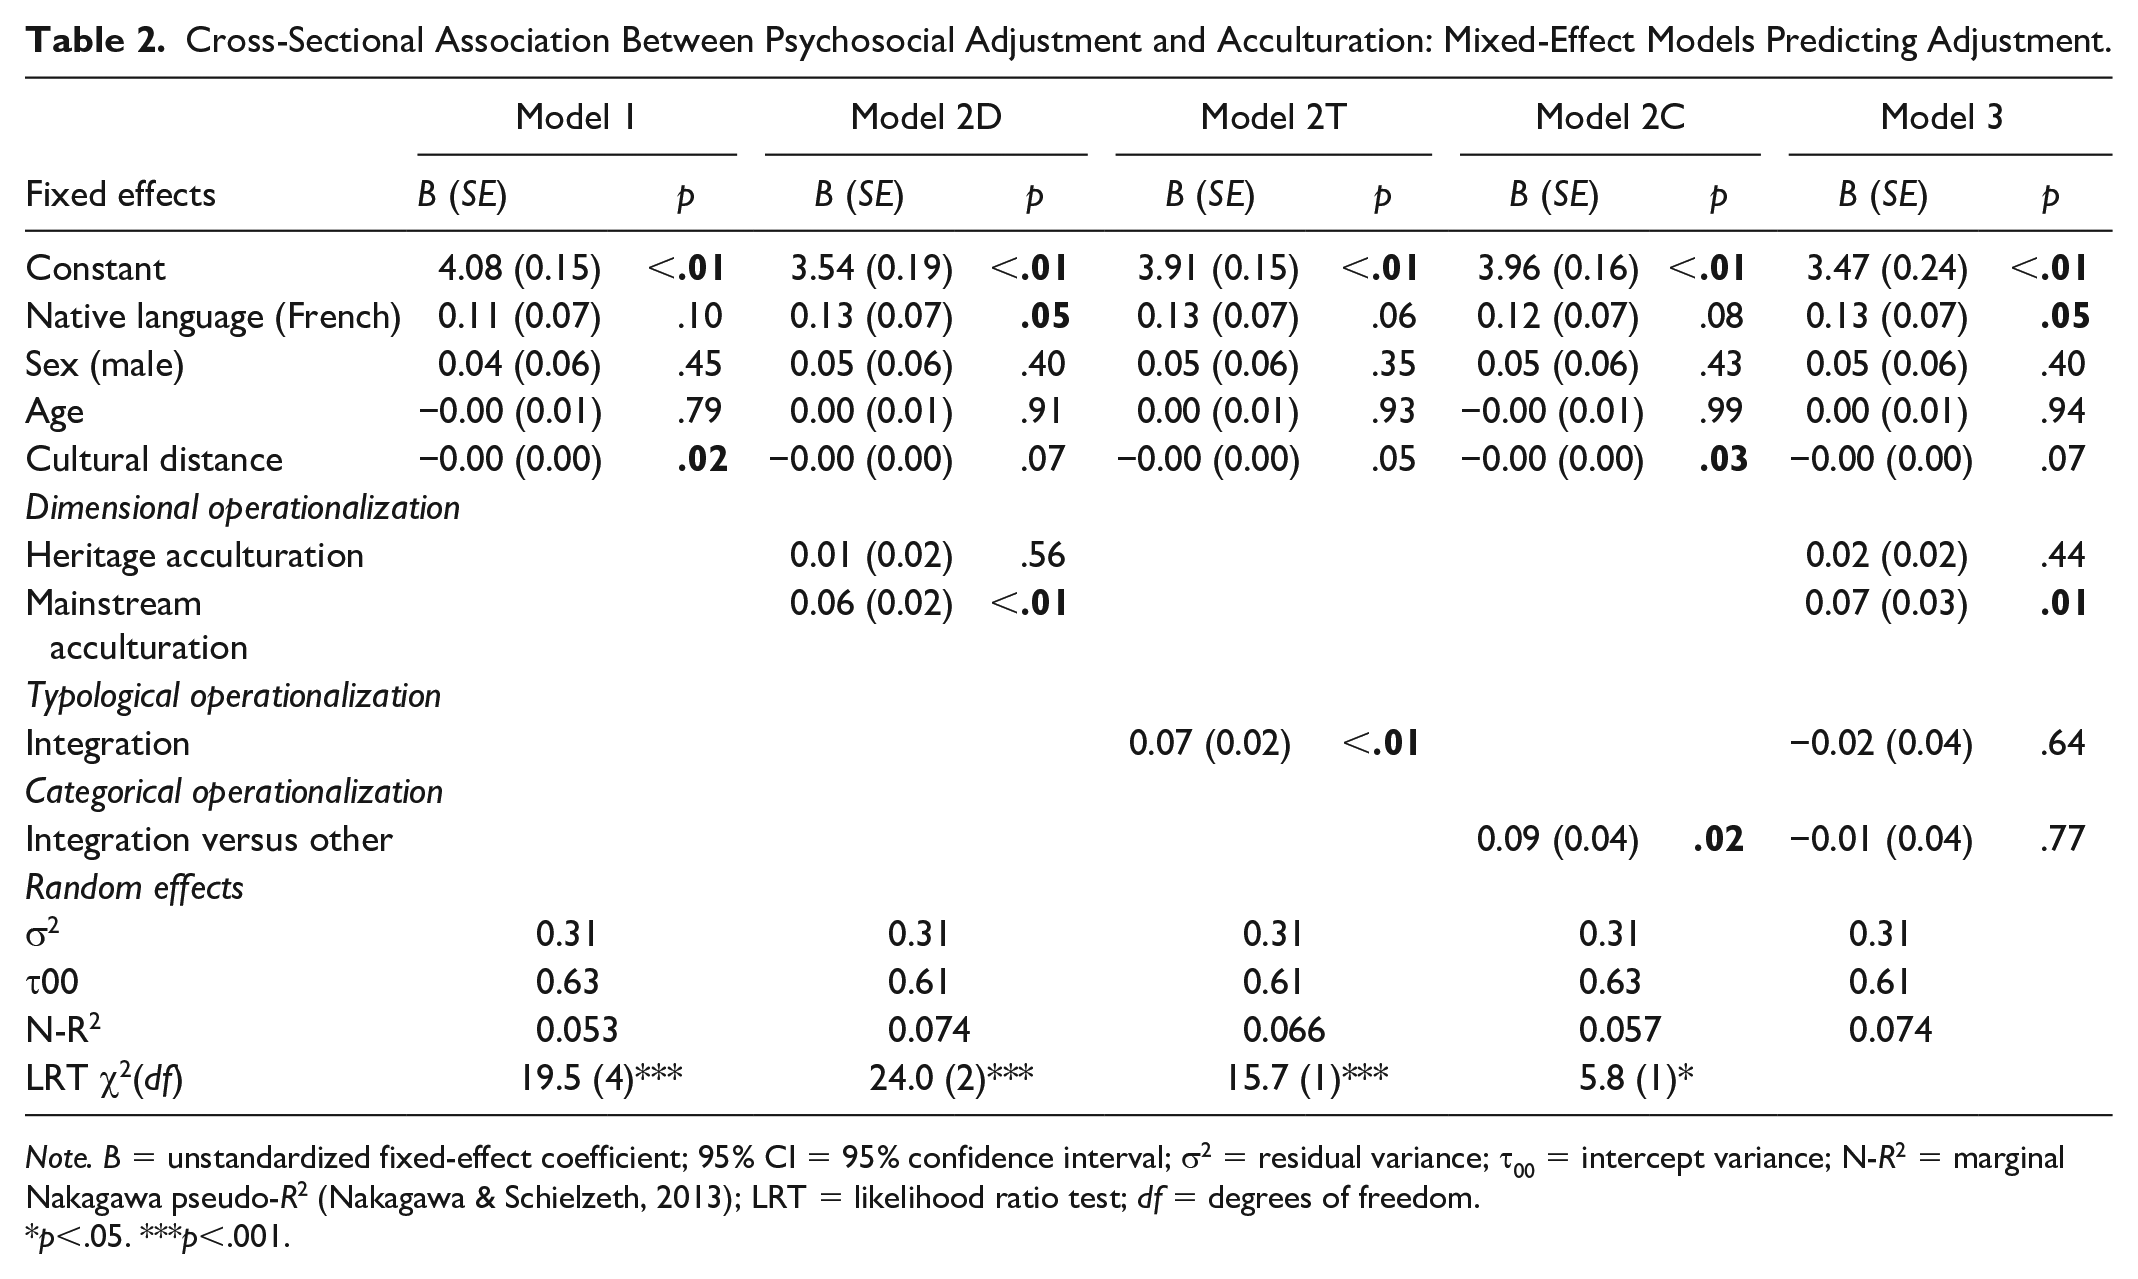
Note. B = unstandardized fixed-effect coefficient; 95% CI = 95% confidence interval; σ2 = residual variance; τ00 = intercept variance; N-R2 = marginal Nakagawa pseudo-R2 (Nakagawa & Schielzeth, 2013); LRT = likelihood ratio test; df = degrees of freedom.
p<.05. ***p<.001.
Findings
In Model 1, age, sex, and having French as a native language were not related to adjustment, but greater cultural distance between Canada and one’s country of origin was associated with lower adjustment, β = −.15, 95% CI = [−0.28; −0.02], p = .03. Controlling for these variables, the introduction of dimensional acculturation variables (Model 2D) accounted for 4% of remaining intercept variance and 2% of remaining residual variance. The effect of VIA-M scores was positive, statistically significant, and small in size, β = .13, 95% CI = [0.06, 0.20], p < .001. This indicates that participants who had a more positive orientation toward the mainstream culture also reported greater adjustment cross-sectionally. There was, however, no significant association between VIA-H and adjustment scores, β = .02, 95% CI = [−0.05, 0.10], p = .56. These results support H1b.
Regression coefficients for integration were also statistically significant, both with typological (Model 2T) and categorical (Model 2C) operationalizations, which is consistent with H1a. Participants in the integration category (β = .17, 95% CI = [0.03, 0.31], p = .02) and who endorsed the integration strategy more strongly (β = .12, 95% CI = [0.06, 0.18], p < .001) reported greater adjustment than those in other categories or who endorsed integration to a lesser extent. These models explained 1% additional residual variance, and 0.2% and 0.3% additional intercept variance (Model 2C and Model 2T, respectively). Of note, effect sizes were similar across operationalizations (βs = .12, .13, and .17).
In Model 3 (full model with all three acculturation operationalizations), only mainstream acculturation (VIA-M) remained significantly associated with adjustment (β = .16, 95% CI = [0.05, 0.27], p = .005), suggesting that the integration effects observed in the previous step were largely carried by the mainstream underlying dimension.
Longitudinal Associations Between Initial Conditions and Later Scores
Analytic Approach
We ran two sets of mixed-effect regressions with baseline predictors (Time 1) of subsequent criterion variable scores (Times 2–4). This time lag allows us to assess the effect of initial conditions on later values. In the first set, baseline acculturation predicted subsequent adjustment (integration hypothesis). In the reverse set, baseline adjustment predicted subsequent acculturation (mental resources hypothesis). In both sets, time, sex, age, participants’ native language (French-versus-other), and cultural distance were entered as covariates in a first step, and predictors of interest in a second step. Baseline values of the outcome variable were entered in a third step, to control for auto-regression (i.e., stability in the outcome over time). This is essential to obtain realistic effect size estimates and conclusively establish temporal precedence, or “Granger causality.” Many of the still fairly rare longitudinal acculturation studies neglect this essential step (Kunst, 2021) and are therefore not able to demonstrate that earlier X prospectively predicts later Y above and beyond predictions of later Y from Y’s own earlier values.
Longitudinal effect sizes controlling for auto-regression are notably smaller than cross-sectional ones (three to seven times smaller; Adachi & Willoughby, 2015) and cannot be interpreted according to common guidelines (e.g., Cohen, 1992 for β). Following Adachi and Willoughby’s (2015) recommendations, we interpret the effect sizes of lagged predictors relative to the outcome’s stability coefficient and cross-sectional effect sizes. Finally, with adjustment as the dependent variable, we also entered all three acculturation operationalizations together in a final step. VIFs in that final model were smaller than 5 except for baseline integration (VIF = 6.62).
Based on likelihood ratio tests probing the necessity of random effects, we specified random intercepts for all models and we added random slopes for time in models where adjustment, VIA-M, and typological integration were dependent variables. We checked statistical assumptions using mixed-effects regression diagnostics. Residuals were leptokurtic but there was no issue of skewness, linearity, or homoscedasticity. There was also a positive correlation between fitted values and residuals (.23 < rs < .29), which we attribute to the lack of time-varying predictors. A few observations seemed particularly influential, based on Cook’s distances separate from the rest of the distribution. Given that the results remained the same upon inclusion or removal of these observations, they were left untouched. Table 3 shows the results of analyses testing the integration hypothesis (H2) and Table 4 of those testing the mental resources hypothesis (H3).
Results of Mixed-Effects Models Testing Longitudinal Associations Between Baseline Acculturation and Later Adjustment.
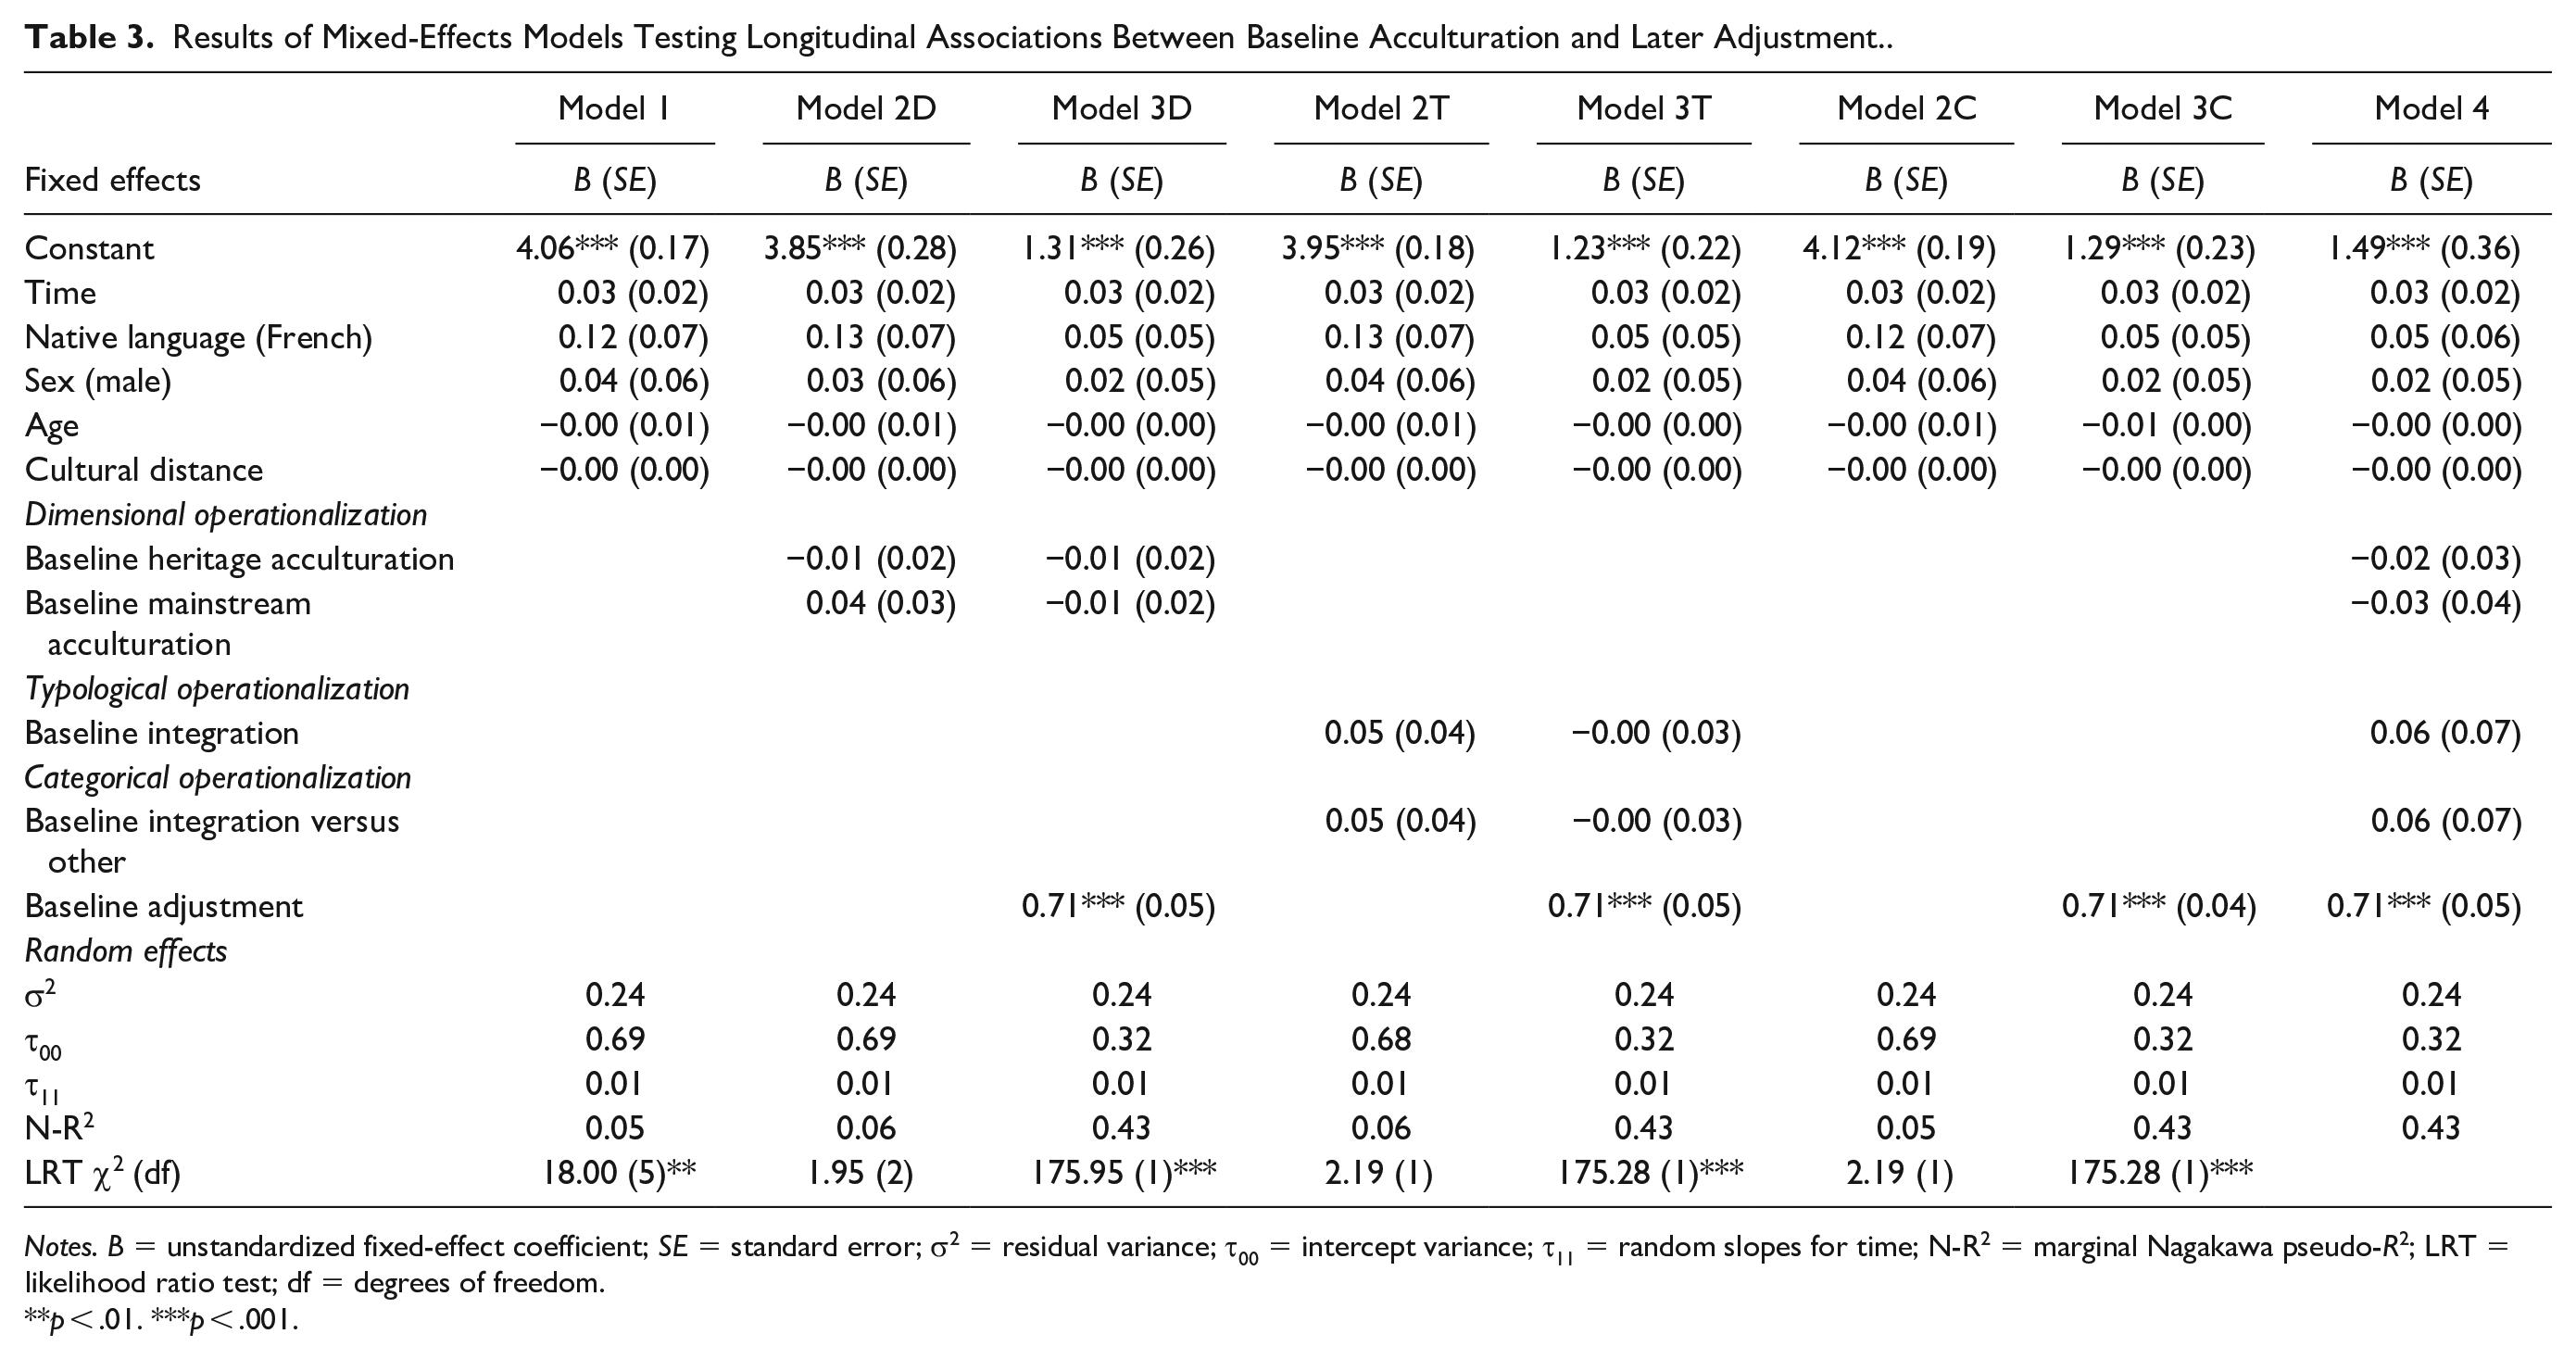
Notes. B = unstandardized fixed-effect coefficient; SE = standard error; σ2 = residual variance; τ00 = intercept variance; τ11 = random slopes for time; N-R2 = marginal Nagakawa pseudo-R2; LRT = likelihood ratio test; df = degrees of freedom.
p < .01. ***p < .001.
Results of Mixed-Effects Models Testing Longitudinal Associations Between Baseline Adjustment and Later Acculturation.
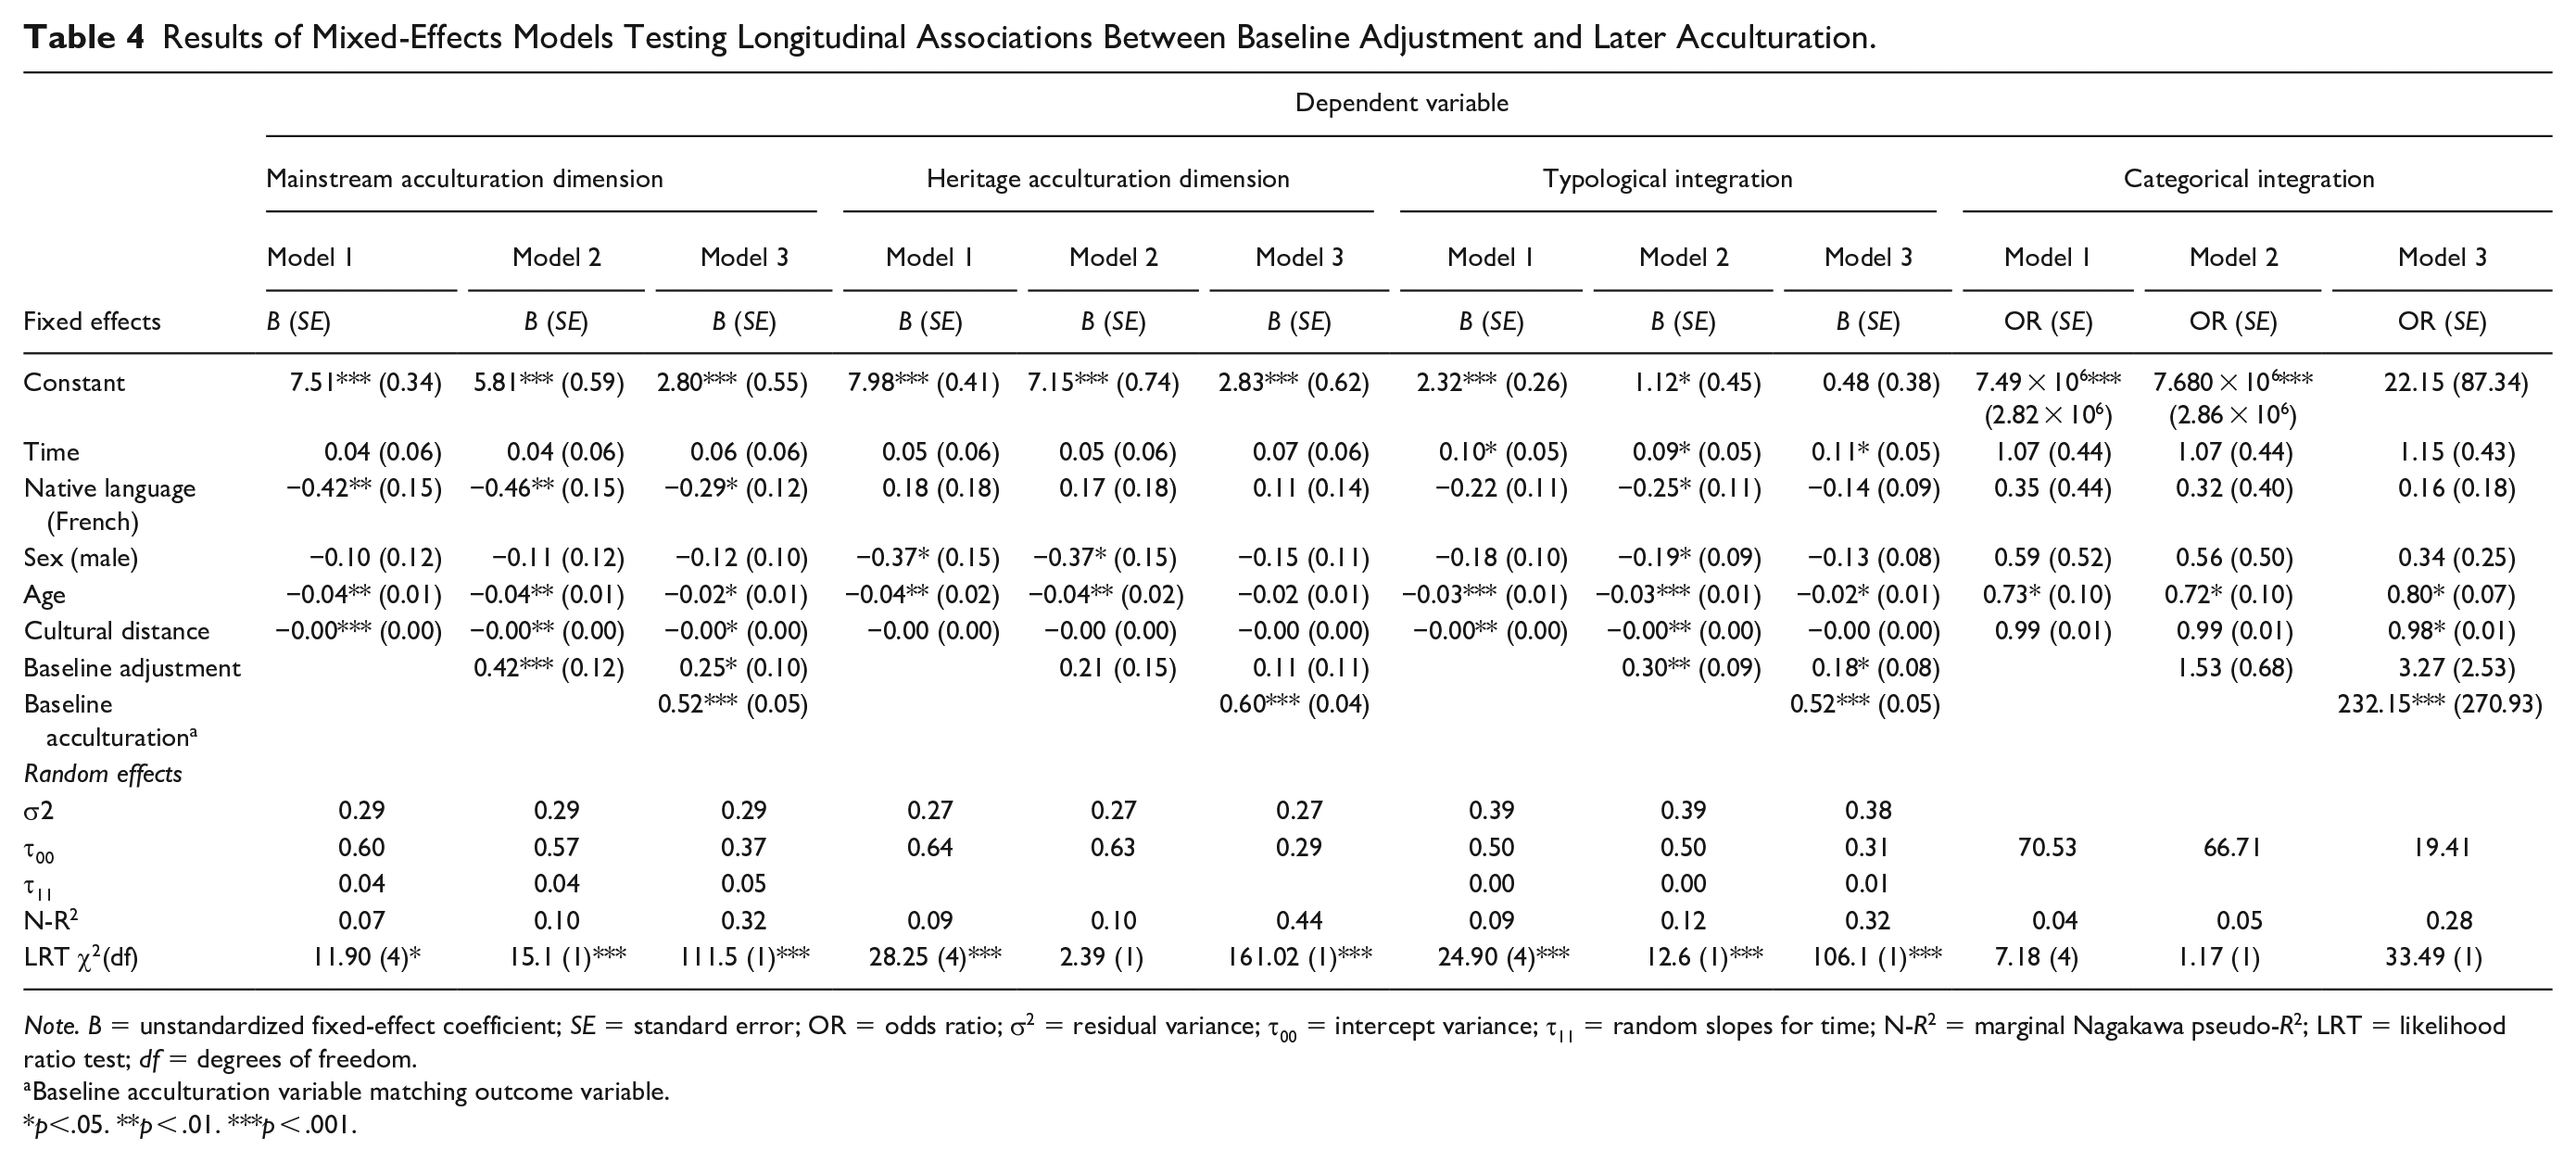
Note. B = unstandardized fixed-effect coefficient; SE = standard error; OR = odds ratio; σ2 = residual variance; τ00 = intercept variance; τ11 = random slopes for time; N-R2 = marginal Nagakawa pseudo-R2; LRT = likelihood ratio test; df = degrees of freedom.
Baseline acculturation variable matching outcome variable.
p<.05. **p < .01. ***p < .001.
Findings for the Integration Hypothesis (H2)
Controlling for Model 1 covariates, baseline acculturation was not associated with subsequent psychosocial adjustment, regardless of operationalization and cultural stream, and whether auto-regressive baseline adjustment effects were included or not: dimensional mainstream β = −.01, 95% CI = [−0.10, 0.08], p = .84; dimensional heritage β = −.03, 95% CI = [−0.12, 0.06], p = .54; typological integration β = −.01, 95% CI = [−0.09, 0.07], p = .80; and categorical integration versus other β = −.11, 95% CI = [−0.32, 0.09], p = .26 for Model 3 with auto-regressive effects. These results do not support the integration hypothesis.
Findings for the Mental Resources Hypothesis (H3)
When operationalizing acculturation dimensionally and controlling for Model 1 covariates, baseline psychosocial adjustment prospectively predicted mainstream acculturation (Model 2: β = .18, 95% CI = [0.08, 0.29], p < .001) but not heritage acculturation (Model 2: β = .07, 95% CI = [−0.03, 0.18], p = .17). Adding baseline adjustment to the prediction of later mainstream acculturation explained 7% of remaining intercept variance and 1% of remaining slope variance, and increased N-R2 by 3.5%. Thus, participants who arrived in the country better adjusted reported greater adoption of the Canadian mainstream culture in subsequent assessments. This prospective association remained statistically significant even when controlling for the auto-regressive effect of baseline mainstream acculturation (Model 3: β = .11, 95% CI = [0.02, 0.20], p = .02).
Baseline psychosocial adjustment also prospectively predicted acculturation when operationalized typologically (Model 2: β = .17, 95% CI = [0.06, 0.27], p < .001), an association which also remained significant after the addition of auto-regressive effects (Model 3: β = .10, 95% CI = [0.01, 0.18], p = .03). Adding baseline adjustment to the prediction of later integration explained 7% of remaining intercept variance and increased N-R2 by 5%. In other words, arriving in the country with greater adjustment was associated with greater endorsement of an integration strategy later on. This positive role of baseline psychosocial adjustment was not present when acculturation was operationalized categorically (Model 2: β = .43, 95% CI = [−0.44, 1.29], p = .34). Together, these results provide support for the mental resources hypothesis.
Strong stability of a construct over time often removes a large portion of variance in the outcome that is shared with the predictors. Consequently, controlling for auto-regressive effects typically shrinks effect sizes of interest substantially. In the present case, stability effects (auto-regressive predictors) were strong for both mainstream acculturation and typological integration (β = .47, 95% CI = [0.38, 0.56], p < .001 in both cases). Yet, prospective adjustment effect sizes controlling for stability effects were less than twice as small as those without stability controls (0.18–0.11 for mainstream acculturation and 0.17–0.10 for typological integration). This is evidence that the prospective association between baseline adjustment and later acculturation is non-negligible.
Discussion
This research aimed to deepen the investigation of the intensively researched association between acculturation and adjustment. Although, as expected, our cross-sectional analyses replicated the well-established relation between integration/mainstream acculturation and psychosocial adjustment, our longitudinal analyses revealed that baseline psychosocial adjustment prospectively predicted later acculturation. There was no evidence for the reverse relation: baseline acculturation prospectively predicting later psychosocial adjustment. Thus, our results substantiate our mental resources hypothesis over the commonly assumed integration hypothesis.
These results compel us to reflect on the vast literature on acculturation and adjustment conducted over the past 50 years, and its common assumptions, in a new light. We need to at least consider the possibility that adjustment predicts acculturation besides—or more radically, instead of—the reverse. How best to understand the mechanisms underlying this effect awaits investigation. Our theorizing on acculturation as the re-establishment of cultural fluency offers a plausible interpretation (see Doucerain, 2019). We experience cultural fluency when we rely on “good enough” cultural schemas to guide our thoughts, actions, and feelings (Oyserman, 2011). Cultural fluency means we can relegate much of our daily functioning to automatic and effortless processing. Migration disrupts this taken-for-granted equilibrium and experiences of cultural disfluency become chronic (Mourey et al., 2015). Because of inadequate cultural schemas, much daily functioning switches to deliberate, effortful processing. This type of processing consumes limited cognitive resources. From this perspective, having more mental resources at one’s disposal—indexed by greater psychosocial adjustment in the current research—may help develop and rehearse new cultural schemas adequate for local daily functioning. This development and rehearsal appears to be an important component of mainstream acculturation.
Other mechanisms are also possible. People with greater psychological adjustment may be more willing to approach new situations, perceived as challenges. In contrast, those with poorer psychological adjustment may tend to withdraw from these situations, perceived as threats. This differential appraisal and engagement may have positive versus negative influences on acculturation. In a related vein, acculturation is a complex intergroup phenomenon operating through repeated social interactions with members of cultural ingroups and outgroups. For migrants reporting ethnocultural discrimination, as many unfortunately do, these social interactions can be unfriendly, tax self-regulatory resources and have been linked to poorer adjustment (e.g., Jurcik et al., 2019). Given associations between adjustment and self-regulation (e.g., Park et al., 2012), experiencing greater psychosocial adjustment may mean that migrants have more self-regulatory and cognitive resources available (e.g., emotion regulation, cognitive flexibility, and attention) to manage complex and demanding social interactions in the new country. In turn, the benefits of this greater baseline functioning may facilitate mainstream acculturation. Indeed, in our past work, we found that greater resting respiratory sinus arrhythmia (RSA) shortly after arrival in the new country prospectively predicted greater increases in mainstream acculturation among international students (Doucerain et al., 2016). RSA indexes variability in heart rate tied to the respiration cycle and can be conceptualized as a physiological index of self-regulatory capacities (Laborde et al., 2018). Furthermore, lower RSA reactivity, indexing lower social sensitivity, buffered the negative impact of perceived ethnic discrimination on mainstream acculturation among migrants (Doucerain et al., 2022). Taken together, these results suggest that baseline psychosocial adjustment may be linked to later acculturation through its ties with self-regulation and being able to meet the complex cognitive and affective demands of navigating a new cultural environment. Future research will be necessary to test these putative mechanisms and potential personal and contextual boundary conditions under which such mechanisms would operate. In the meantime, our results have practical implications. They suggest that interventions aiming at ensuring or boosting international students’ and migrants’ psychosocial adjustment shortly after migration could help foster their integration in the new country.
In this study, we tested prospective acculturation-adjustment associations using three different acculturation operationalizations, detecting effects for both dimensional and typological ones, but not for the categorical operationalization. Variance loss associated with this latter approach has been well documented (Demes & Geeraert, 2014) and may be responsible for the null effect observed here. With a dimensional approach, we found significant effects for mainstream, but not for heritage acculturation. This is consistent with Bierwiaczonek and Kunst’s (2021) meta-analytic results and suggests that the mainstream underlying dimension may largely carry a significant association with typological integration. Nevertheless, a lot of acculturation theorizing is articulated in terms of typological acculturation strategies. Finding alternatives to psychometrically flawed typological scales has been a challenge for acculturation researchers. Here, we described such an alternative (using dimensional scales with mirror wording to compute a typological score) with promising results. This alternative would need to be validated more extensively in future research, but we nonetheless see it as a contribution of this work.
It would be premature to conclude that baseline acculturation is never associated with later psychosocial adjustment. We have presented a single study, limited to a culturally heterogeneous sample of international students arriving in Montreal to attend one of two universities. These demographic particularities may have suppressed the capacity of acculturation to predict psychosocial adjustment prospectively. For instance, international students often have many centralized and relatively easy-to-find resources exclusively available to them on campus (e.g., advocacy services, student interest groups, ethnic organizations, and health and counseling services). Equivalent resources might be more dispersed and challenging to access for more typical migrants living in the broader community. In the latter case, a premium might be placed on an integration acculturation strategy which might foreseeably lead to better sociocultural adaptation (e.g., the ability to find and use needed resources) and thus better adjustment. Future samples need to focus on various non-student migrant groups to determine whether our findings are replicable and generalizable.
In addition, we only followed our students for a 7-month period. Baseline adjustment might be particularly important in shaping how the early phase of acculturation proceeds; more well-adjusted people may be more likely to engage with people they have just met and do so across a cultural divide at this important point in time in the acculturation process. We are open to the possibility of a bidirectional relation between acculturation and adjustment over longer time frames, with adjustment predicting cultural orientation, in turn predicting future adjustment. We will need future longitudinal studies with a higher density of assessments to test this possible feedback loop.
We are not yet prepared to abandon the standard integration hypothesis. However, our findings, at the very least, establish that the reverse mental resources hypothesis is plausible and deserves sustained consideration. In particular, acculturation researchers should pay more attention to baseline adjustment, especially when following migrants during their first few months in a new society. Future research should also examine the predictors of baseline adjustment to better understand what is happening during these first seemingly critical weeks. To this aim, longitudinal studies with a pre-migration assessment, while complicated, would be particularly useful. They could help separate adjustment problems that pre-exist migration from those that might rapidly emerge during an initial transition that proves especially difficult. Intervention research with migrants might compare the benefits of focusing on bolstering early psychosocial adjustment (e.g., using evidence-based interventions for improving mood), to approaches that specifically promote integrative acculturation strategies.
Limitations
Our study has several strengths, including a well-powered four-assessment wave longitudinal design focusing on a theoretically meaningful period of migrants’ acculturation process. It also has several limitations that ought to be addressed in future research. First, we relied on international student samples. This decision is justified by the relative ease of recruitment during the first few weeks post-migration but limits the potential for generalization. Second, the international student sample was culturally heterogeneous and thus does not allow us to investigate group-specific characteristics (e.g., different cultural models guiding how to form new social ties) that might nuance our conclusions. Furthermore, the majority of our sample was from European countries, which are culturally not very distant from Quebec. Whether our results would generalize to other cultural contexts is therefore an open question, although we suspect the effects we detected might indeed be larger in culturally more distant samples. Third, we relied on brief self-report measures of acculturation and adjustment. This choice enhanced the feasibility of a longitudinal study with four assessments, but it compromised the detail that might be accessible using other assessment methods (e.g., differentiating between identity, behaviors, and values components of acculturation). The fact that the distribution of acculturation scores did not allow us to probe associations between adjustment and strategies other than integration (e.g., assimilation or separation) might be related to our assessment choices. For example, these strategies might have counted more participants if we had assessed acculturation in terms of cultural identification with mainstream and heritage groups (Snauwaert et al., 2003). Similarly, we did not control for any personality traits or other individual differences, which may have facilitated initial adjustment. Fourth, we restricted the duration of the study to 7 months, limiting our conclusions to the very early phase of adaptation. In addition, assessments took place at fixed times for all study participants. This makes it impossible to exclude the role of other relevant factors that may overlap to some extent with measurement waves (e.g., features of the academic calendar such as exams or breaks). Fifth, we have presented a single study where hypotheses were not pre-registered.
Conclusion
Our current longitudinal study demonstrated that baseline psychosocial adjustment is associated with later acculturation, rather than the reverse pattern widely presumed to be the case. Despite its limitations, we believe that our research makes an important contribution to the acculturation literature. We hope that our findings might provoke replications and extensions that address the limitations of the present work, including the use of a broader community-based immigrant sample and a longer time frame. Acculturation may indeed be challenging—but, surely, it is especially challenging when interwoven with ongoing psychosocial adjustment difficulties. Should our findings replicate, some societies may still continue to choose multiculturalism and promote integration. However, it will be harder to argue that doing so will necessarily lead to better adjustment, let alone that we ought to pursue those policies to have this effect. Rather, a continued commitment to these policies will need to be backed up with immigration support services, including mental health services that can provide migrants with the psychosocial resources they need on their acculturation journey. Doing so will not only improve our capacity to work with recent migrants but will also help us better engage with the multicultural diversity many societies already have.
Footnotes
Declaration of Conflicting Interests
The author(s) declared no potential conflicts of interest with respect to the research, authorship, and/or publication of this article.
Funding
The author(s) disclosed receipt of the following financial support for the research, authorship, and/or publication of this article: This research was made possible thanks to a grant from the Social Sciences and Humanities Research Council of Canada to Catherine E. Amiot and Andrew G. Ryder (grant number: 430-2011-0576). The authors would like to thank Amélie Beaupré, Franca Lacroix, and Biru Zhou for their assistance in coordinating this research, and Elsa Brais-Dussault and Camille Benoit for their involvement in data collection. Data are available on request from the corresponding authors.