
Abstract
Israel’s year-long protest calling for Prime Minister Netanyahu’s resignation created an opportunity to examine unique factors influencing sustained collective action (SCA; i.e., repeated participation in social movement action for the same cause). As little is known about how to explain such dedication, we compared a well-established set of predictors of one-time collective action (CA) with a new predictors set of SCA, focusing on collective instrumental and socio-emotional (CISE) motivations grounded in previous participation experience, to predict subsequent participation. In a unique longitudinal design, we tracked protestors over 6 weeks. Our findings showed that less emotional exhaustion, more subjective effort into participation, and a perceived closer timeframe for desired social change positively predicted SCA. This differentiates SCA from CA—moreover, as one-time CA predictors did not predict SCA, this suggests a need for a new model to explain SCA based on CISE motivations that reflect continuous goal pursuit.
Introduction
Collective action (CA) has the power to inspire revolutions, destabilize corrupt governments, and establish democratic transitions. In recent years, we have witnessed social movements in different areas of the world, like the 2019 to 2020 Hong Kong protests and the Belarusian protests, in which people have participated in CA on a weekly or even daily basis, which we refer to as sustained collective action (SCA; see also Yip et al., 2023). SCA can potentially have a substantial impact in advancing social change, for example, in Chile’s revolution against social inequality and (to some extend) in the Black Lives Matter protest in the United States. Since CAs can be effective by applying pressure to decision-makers (Piven, 2008), SCA can be effective as it applies pressure continuously and consistently. This continuous aspect also gives the movement time to grow and mobilize additional people; as a broader portion of the population participates in the action, the more chances the protest will succeed in achieving its goals (Chenoweth & Stephan, 2011). However, this ongoing action entails a considerable and repeated effort on the protestors’ side without any guaranteed outcomes. Thus, it is essential to understand the psychology of SCA.
In this research we compare a well-established set of key motivations for one-time CA with what we propose are a set of key motivations for SCA. One-time CA is defined as being undertaken by psychological group members to achieve group goals (van Zomeren, 2015, 2016), while in SCA, group members undertake continuous actions that take place repeatedly (e.g., every day, week, or month for an extended period of time, such as multiple weeks, months, or even years). We propose that SCA is motivated not so much by motivations that differentiate between individuals who act and those who do not, but that differentiate between individuals who keep acting and those who do not. 1 We suggest that the process and predictors leading to SCA are not the same as those involved in one-time CA. To explore this, we report a study on the year-long weekly demonstrations in Israel calling for Prime Minister Netanyahu’s resignation, for which the same protesters filled out six surveys, 6 weeks in a row. This unique longitudinal approach enabled the study to explore changes in the potential predictors of actual participation over time.
SCA as a Unique Form of CA
To date, most studies in the field focus on general willingness to participate in CA and usually as a one-time occasion (e.g., Cakal et al., 2011; Cohen-Chen et al., 2014; Nelson et al., 2008; Shuman et al., 2016; van Zomeren et al., 2004). In recent years, studies have slowly started to go beyond one-time CA by examining engagement in CA over time (e.g., Hasan-Aslih et al., 2020; Lizzio-Wilson et al., 2021; Louis et al., 2016). However, perhaps because of the use of the same theoretical perspectives and associated sets of predictors, those studies still ask who is more likely to act versus not engage in any action rather than who is more likely to keep acting versus participate in singular actions.
It is possible that the same theoretical predictors will apply to these different questions in the same way. For example, the extended social identity model of collective action (SIMCA, van Zomeren et al., 2008, 2011) includes a set of predictors (moral convictions, politicized identification, group efficacy, and anger) known to explain variance in participation in one-time CA (Adra et al., 2020; Cakal et al., 2011; Chan, 2017; Stewart et al., 2016; van Zomeren et al., 2018). Indeed, Thomas and colleagues (Thomas et al., 2020) measured the SIMCA variables and willingness to participate in CA in a longitudinal study based on three time points separated by a few years. They found that the SIMCA variables are still good predictors for CA over these years. This, however, explains who is more likely to act, rather than who is more likely to keep acting (i.e., the difference between a general willingness to act toward a cause and a continued involvement in and commitment to sustained action). Although the SIMCA variables may answer the first question, they do not necessarily answer the second question (see also Thomas et al., 2022).
Klandermans’s and Oegema (1987) four-step model of participation in social movements offers clues as to why this may be the case (see Klandermans & Oegema, 1987; Oegema & Klandermans, 1994). According to that model, to become a participant in a social movement, one becomes (a) a sympathizer of the movement, then (b) a target of mobilization attempts; next (c) motivated to participate in movement action, and finally, (d) motivated to overcome instrumental barriers to actual participation (Klandermans & Oegema, 1987). In this model, the typical focus on one-time CA is often set in the third stage of the model, where people become motivated to participate in a given movement action. SCA, however, would be located at the fourth stage, which includes the motivation to overcome instrumental barriers to participation, or maybe even at a new fifth step, which includes the motivation to overcome barriers to repeated participation. Such motivation to overcome barriers is, according to Klandermans (and others; e.g., Louis et al., 2020; Stürmer & Simon, 2004), in essence collectively and instrumentally oriented. This fits nicely with a view of SCA as a dynamic, collective, and repeated form of goal pursuit.
There are two ways to distinguish SCA from one-time CA: (a) based on previous involvement in CA, and (b) based on the mere passage of time. Research shows that previous participation positively predicts future engagement (Burrows et al., 2022; Fendrich & Lovoy, 1988) and that participation in CA can lead to various psychological changes (for a review, see Vestergren et al., 2017), such as increased or politicized group identification (Klandermans et al., 2002), and a sense of collective uniformity (Vestergren, Drury, & Chiriac, 2019). On the other hand, the dynamics of social movements change over time due to factors like changes in political structures, political opportunities, shifting collective identities, changes in organizational capacities, and external events (McAdam, 1999; Meyer & Minkoff, 2004; Tarrow, 2011). Therefore, predictors that consider the unique characteristics of SCA may be needed to do justice to this unique form of CA.
Theoretically, one can indeed wonder whether anger, for example, would predict SCA. Can an individual be highly angry for a prolonged period of time? Theories such as The Job Demands-Resources model (Bakker & Demerouti, 2007) and the Conservation of Resources Theory (Hobfoll, 1989, 2001) would say no, as they claim that prolonged experience of anger will lead to burnout. Similarly, one can ask whether the concept of group efficacy (the belief that one can achieve group goals through joint effort; van Zomeren et al., 2008) is still applicable to SCA. It is possible that over time, the desire for tangible outcomes may become more important than holding onto beliefs about one’s efficacy in order to remain engaged. We suggest that the perception of effectiveness (i.e., effectiveness of the action in realizing these goals) is a likely motivation for participating in SCA (Hornsey et al., 2006; see also Hamann et al., 2023). Lastly, identification with groups can strengthen or weaken based on the socio-cultural environment, personal experiences, or evolving group dynamics (Tajfel & Turner, 1979). To advance theory and research on SCA, it is essential to investigate not only these predictors but also others that fit with the more complex and dynamic nature of SCA. Our exploratory study draws on and moves beyond the SIMCA model by proposing two sets of potential predictors—collective instrumental predictors (related to efficacy) and socio-emotional predictors (related to identification and emotion).
Instrumental and Socio-Emotional Explanations Unique to SCA
We explored a wide range of variables that fit with experiences formed during repeated engagement in CA over time. We propose that the experience of acting together with others and for an extended period of time affects individuals’ instrumental motivation to achieve collective goals and influences their socio-emotional experience. As presented in Figure 1, we propose two specific subsets of variables to predict SCA: collective instrumental and socio-emotional (CISE) variables. The first subset, collective instrumental predictors, refers to the costs and benefits from repetitive and long-term engagement, which includes (but may not be limited to) shortening the timeframe of the desired change, perceptions of effectiveness, momentum, and invested effort. The second subset is socio-emotional predictors, which refers to possible emotional effects from people repeatedly and continuously sharing experiences. This includes (but may not be limited to) emotional synchrony, protesters’ uniformity, emotional fit, and (inversely related) emotional exhaustion. We discuss each in turn below while considering the element of time and/or past experiences for the relevance of the predictor.
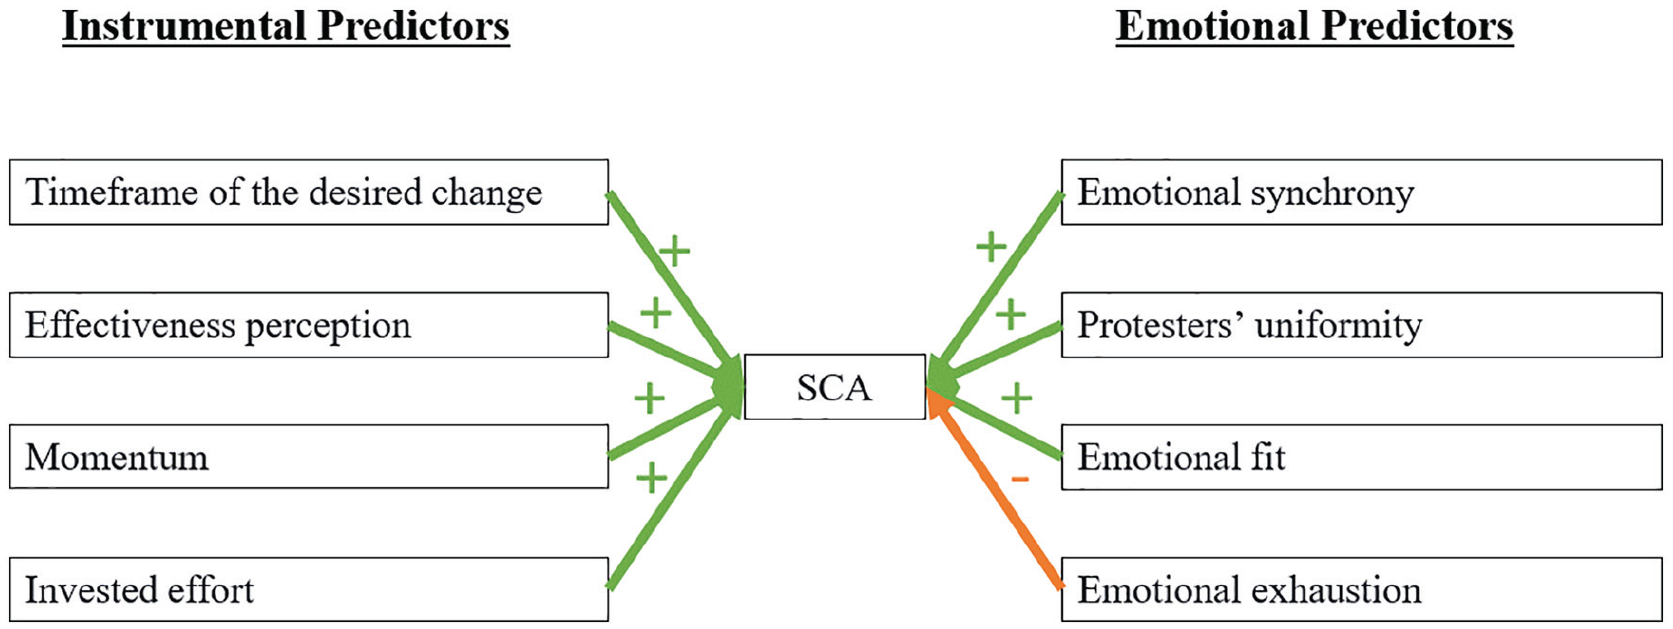
CISE predictors for SCA.
Note that conducting longitudinal research is challenging, especially when it involves finding a specific group of participants with unique characteristics. In our case, the research focused on protesters who were deeply committed to achieving their goals by repeatedly investing their time and effort, which made recruitment to participate in the study even more difficult. To avoid missing important information, as we recognize the rarity of such a research opportunity, we initiated an exploratory examination in which we tested a long list of 44 variables. We then established clear inclusion criteria for these variables, which will be further detailed in the Method section. Only eight variables met our inclusion criteria, and so we focus on these in detail below.
Subset 1—Collective Instrumental Predictors
Timeframe of the Desired Change
How long will it take the movement to reach its goal(s)? This is a key consideration for those motivated to engage in SCA because the closer the timeframe, the stronger the motivation to keep acting. Although we are not aware of specific tests of this possibility in the CA literature, hints of this effect can be found in other fields. For example, Bandura and Schunk (1981) found that a proximal goal affected self-efficacy more than a distant goal, and Jobe (1984) found a relationship between proximity to the goal and performance. It was also found that soccer players closer to the goal (both physically and psychologically) performed better in the same task than when they were further away from the goal (Headrick et al., 2012). Thus, the closer the timeframe in which protesters believe they will achieve their desired change, they should be more motivated to keep acting. In the field of marketing and consumerism, the perceived rate of progress serves as a dynamic metric that influences motivation differently at various stages of goal pursuit (Huang & Zhang, 2011). This indicates the relevance of this instrumental predictor for a continuous action compared to a one-time action.
Perceived Effectiveness
Efficacy and perceived effectiveness, while sometimes used interchangeably in everyday parlance, have distinct nuances, according to a recent review (Hamann et al., 2023; see also Agostini & van Zomeren, 2021). Efficacy generally refers to the belief in one’s ability to succeed in specific situations or accomplish a task. In contrast, effectiveness-related phrasings aim to assess whether a particular action has met its expected goals. In essence, while efficacy is about belief and potential, perceived effectiveness is about assessment and results (Hamann et al., 2023). Participants in SCA particularly might consider, in their motivation to keep acting, whether and how their actions influence decision-makers or public opinion. In other words, in SCA, some actions have already been taken; hence, their perceived outcomes may play a substantial role in further engagement. This differs from one-time CA, where no prior action in the same context influences this perception. Effectiveness can target different goals: influencing government, influencing the public, building opposition, and expressing values (Hornsey et al., 2006). Effectiveness can focus on the sustained nature of the movement, that is, the effectiveness of the whole movement, or can be evaluated incrementally, like the effectiveness of the last protest within the movement (for each protest), and thus reflect an instrumental predictor of SCA.
Momentum
Psychological momentum is an added or gained psychological power that gives individuals the feeling that they have an advantage over the opponent (Iso-Ahola & Mobily, 1980). Momentum has been characterized in past research by heightened perceptions of self-efficacy (e.g., Iso-Ahola & Dotson, 2014; Jones & Harwood, 2008) and goal progress (e.g., Markman & Guenther, 2007), as well as increased efficiency (Iso-Ahola & Dotson, 2016) and persistence (e.g., Iso-Ahola & Dotson, 2014) in task performance. Psychological momentum has received considerable attention in the sports domain (e.g., Briki et al., 2013) and in the experimental psychology discipline (e.g., Hubbard et al., 2009; Knops et al., 2014) literatures, but little is known about how the construct generalizes to other domains and disciplines. There is a similarity between the sports domain and the SCA domain, as in both domains, individuals engage for substantial periods of time with their group to show support without a guaranteed outcome. Based on this similarity, we might see a similar effect for momentum on SCA (i.e., as an instrumental predictor), like in sports, where it contributes to perceived success (Stanimirovic & Hanrahan, 2004).
Invested Effort
Invested effort could lead to more commitment to the movement due to the sunk-cost fallacy, which is the tendency to keep engaging in behavior once an investment in money, effort, or time has been made (Arkes & Blumer, 1985; Thaler, 1980). The sunk-cost fallacy may lead those who participate in SCA and thus invest time and effort to continue participating in the movement to avoid the feeling of loss of the time and effort they have already invested (Tversky & Kahneman, 1991). Hence, the sunk-cost fallacy can potentially push individuals to participate in SCA for instrumental reasons.
Subset 2—Socio-Emotional Predictors
Emotional Synchrony
Perceived emotional synchrony is a concept introduced by Durkheim (1912/1995) to describe the intense shared emotional experience or group state of high emotional arousal related to the intensification of emotions by social sharing, which empowers the individual. The socio-emotional experiences felt during collective gatherings consist of a high mutually shared emotional arousal that reinforces a sense of uniformity and implies synchronization of emotional responses that, in turn, reinforces social cohesion (Collins, 2014; Von Scheve & Salmella, 2014). Páez and colleagues (2015) found that higher perceived emotional synchrony was associated with stronger emotional reactions, more robust social support, and higher endorsement of social values. Thus, emotional synchrony can play a role in maintaining durability in SCA as it is a unique structural, motivational, and resilience resource for participants in this type of action. People acting together could feel shared emotions that motivate them to maintain their engagement, and thus reflect a socio-emotional predictor of SCA.
Protesters’ Uniformity
Group uniformity is the perception that group members share attributes, goals, or behavior 2 (McLauchlin & Pearlman, 2012). Group uniformity has been found to have long-term sustainability (Thomas et al., 2009) and to be essential for CA motivation (Drury et al., 2005; Gorski & Chen, 2015; Thomas et al., 2009; Vestergren et al., 2019). Protesters’ uniformity refers to one’s perceived similarity with other protesters. It is different from perceived emotional synchrony discussed above in the emotional aspect but has the same socio-emotional effect on SCA. Protesters’ uniformity is also different from politicized identification, as the latter emphasizes similarity in values among protesters, while the former focuses on their similarity in goals and purposes. More specifically, if a group acts together, they may be more likely to experience group uniformity, which will motivate them to keep acting (thus reflecting a socio-emotional predictor of SCA).
Emotional Fit
Emotional fit is a more specific form of group uniformity that specifically refers to the congruence between people’s emotions and those of others around them, and has been observed in couples (Anderson et al., 2003; Gonzaga et al., 2007), groups (Totterdell, 2000), and cultures (De Leersnyder et al., 2015). Recent work showed that emotional fit might function as a resilience factor against burnout in the context of CA (Vandermeulen et al., 2023). As it is easy to envision burnout resulting in dropping out from SCA, having a protective mechanism like emotional fit could be a positive socio-emotional predictor for SCA and perhaps the distinction between participation in CA to SCA. Emotional fit is distinct from perceived emotional synchrony as it measures actual shared emotions and not the perception of shared emotions.
Emotional Exhaustion
Emotional exhaustion occurs when individuals become overly involved emotionally and overextend themselves or feel overwhelmed by the emotional demands imposed by others (Maslach, 1982). In situations like SCA where people are required to be active for a long time and, in many cases, also to conduct physical actions such as standing for a long time in a demonstration, walking for a long time in a march, or trying to make a noise that will attract attention, it is not difficult to imagine how exhaustion and burnout may occur. Taking into account anger from the SIMCA model, it is possible to see, based on different emotion theories such as the Job Demands-Resources model (Demerouti, 2007) and Conservation of Resources Theory (Hobfoll, 1989, 2001), how in a situation where a person demonstrates and expresses anger over time, the prolonged experience of anger will lead to burnout as well. Emotional exhaustion was found to predict dropouts in many contexts, such as long-term volunteering (Ross et al., 1999), years-long sports practice (Isoard-Gautheur et al., 2016), and throughout medical school (Dyrbye et al., 2010). At the same time, rewards did not appear to have a protective effect against dropouts (Ross et al., 1999). There is no reason to suspect that emotional exhaustion will have a different influence in the context of SCA, which makes emotional exhaustion a negative socio-emotional predictor for SCA.
The Current Study
The main goal of the current study was to explore the question of what makes individuals persist in action over time. We made use of an opportunity to empirically answer this question in the context of ongoing protests in Israel calling for the resignation of Prime Minister Netanyahu following allegations of his corrupt practices. The common name for the movement became “the Balfour protest” since it included protests every week on Saturday night (with a minority of protestors who sometimes protested on a daily basis) in front of the formal residence of the prime minister in Balfour Street, Jerusalem. The movement lasted almost a year and expanded to bridges and junctions throughout the country, partially due to COVID-19 restrictions. This study started a few months after the protests began, when the movement had already spread all over Israel, and hundreds of thousands of Israelis were taking part in demonstrations on a weekly basis.
We recruited self-identified protestors who declared participation in the Balfour protest during the 6 months prior to the study and surveyed them for 6 weeks in a row (six waves overall). Participants were asked to fill out the questionnaires each week. The aim was to explore the changes in patterns of participation over time. A set of extended SIMCA variables (moral convictions, protest identification, group efficacy, and anger during the protests) was compared with the new set of variables based on the dynamic nature of participation over time: CISE predictors of SCA.
Method
Participants
Four hundred eighty-three participants were recruited. The inclusion criteria were for the participants to be at least 18 years old and self-identified as protestors in the Balfour protest during the months prior to the study. Participants were not required to be active protestors when recruited, as long as they had been involved previously. The recruitment process included distributions in relevant Facebook and WhatsApp groups, organizations that participated in the protest, and people in leadership roles in the protest who have published our study to protestors. We kindly asked all participants to share information about the study with more protestors (such as friends and family).
Participants who dropped out before completing at least four of the six waves were not retained for analysis. Given that dropout rates might be relatively high in such demanding studies, the recruitment process lasted 5 weeks (meaning some participants started the first wave 5 weeks before or after other participants). Overall, 304 participants were included in the final analysis, Mage = 49.31, 63.81% female, Mreligiosity(1-7scale) = 1.89, Mpolitical ideology(1=Extreme rightist, 7=Extreme leftist) = 5.37. There were no dropout biases, i.e., there were no differences in meaningful socio-demographic measures between the participants included in the analysis and participants who did not fill out at least four waves of survey questionnaires. Participants volunteered for this study and were incentivized to complete the six waves through a lottery, with 10 randomly selected individuals receiving a voucher worth 400 NIS.
Procedure
The study consisted of six surveys, one survey per week. Each participant chose their preferred method, email, or SMS, and received a link to the Qualtrics survey. Participants were also reminded to fill out the questionnaires weekly via email or SMS, whether they attended the week’s protest or not. The protest usually took place on Saturday nights; hence, the surveys were sent on Saturday nights and Sunday mornings. Participants could fill out the surveys during the week until Saturday at noon. This procedure was IRB-approved. As the study was exploratory, it was not pre-registered.
Measures
Participants responded to all measures on a 7-point Likert-type scale, where responses ranged from 1 (strongly disagree) to 7 (strongly agree) unless otherwise specified. Given the difficulty of retaining participants over time, we aimed at concise weekly surveys. Thus, some variables that were measured with multiitem scales at the first wave were only measured with one item in later waves. Since the study was exploratory, we started by reviewing the literature in search of a long list of variables composing the CISE theoretical groups and the SIMCA variables. Forty-four variables were measured in this study, from which 22 variables reached the following criteria and were included in the analyses: They were measured in at least five waves, and no ceiling or floor effects were suspected. For the remaining 22 variables, a correlation analysis was conducted to avoid multicollinearity within each theoretical group. Variables found to be highly correlated were merged into one scale or dropped out of the study, depending on the theoretical concepts, and how conceptually overlapping they were. Eventually, eight CISE variables passed these thresholds and were used in the analysis, which were the variables presented in the introductions. Demographic variables and moral convictions are the only variables that were measured only once (in wave 1), as we had no reason to believe they would change over time. The complete set of measures is reported on this study’s OSF project (https://osf.io/e2tkr/?view_only=bf2c4fd448934ad4838c80bd33a40fe3).
Demographics and Background Variables
Gender and Age
One item each, only on the T1 questionnaire, assessed gender, and age. Participants were asked to fill in their gender and their age.
Religiosity
One item assessed the participants’ religiosity level only on the T1 questionnaire. Participants were asked, “What is the level of your religiosity?” on a scale of (1) atheist, (2) secular, (3) secular but observe some traditions, (4) traditional, (5) religious, and (6) ultra-orthodox.
Political Identification
One item assessed the participants’ political identification on the T1 questionnaire. Participants were asked, “What is your political stance from radical left to radical right?”
Protest Background
Activist identification and past protests count. One item only on the T1 questionnaire assessed each. Participants were asked, “To what extent do you consider yourself an activist?” To measure activist identification, past protests count was measured by asking participants to evaluate how many protests they had attended as part of the Belfour protest in the last 6 months, between 0 and 100. The purpose of measuring the protest background was to rule out alternative explanations that stem from participants’ self-definitions or from what happened before the research began.
Social Identity Model of Collective Action
Moral Convictions
Following previous work (Van Zomeren et al., 2011), a three-item scale (α = 0.7) was used to assess moral convictions. Example item: “My feelings about preventing the prime minister’s conduct are deeply connected to my beliefs about ‘right’ and ‘wrong’.” This variable was measured only in the T1 questionnaire, as moral convictions are relatively stable over time (Skitka et al., 2021).
Protest Identification
Adapted from prior work (McGarty et al., 2009), one item was used for protest identification (opinion-based group identification) on the T1 questionnaire: “I identify with the other people who are protesting.” This item was suspected of having a ceiling effect; thus, it was changed to a different item to measure protest identification in waves 2-6: “I feel connected with other people who oppose the prime minister’s conduct.”
Anger
One item assessed the participants’ anger during the protest. Participants were asked to evaluate the extent to which they felt anger during the protest at the conduct of the Prime Minister.
Group Efficacy
Based on previous work (van Zomeren et al., 2011), only on the T1 questionnaire two items assess group efficacy (r = 0.83). One item of the two was used in all six questionnaires to assess change over time: “I believe that, together, the people who oppose the conduct of the prime minister and his government are capable of stopping their conduct or replacing the prime minister.”
Collective Instrumental Predictors
Timeframe of the Desired Change
One item was used to assess the subjective belief about the perceived timeframe in which the change that the protests aimed to achieve might occur, ranging from “It will never happen” to “It will happen next week.”
Effectiveness Scale
Extracted from prior work (Hornsey et al., 2006), a four-item scale was used to measure perceived effectiveness. Participants were asked to indicate the extent to which they thought the protests were effective in achieving their goals by: “influencing the government,” “influencing public opinion,” “building an oppositional movement,” and “expressing certain values” (ranging between α = 0.73 and α = 0.85 across the waves). Two items about the effectiveness of the movement in general and the effectiveness of the last protest were added to the scale before analysis due to high intercorrelation (ranging between α = 0.78 and α = 0.89 across waves 2-5. The latter added variable was measured from T2). The six effectiveness items are intercorrelated moderately. See supplementary material for a summary of intercorrelations among all measurements. All six items ranged from 1 (counterproductive) to 4 (no impact) to 7 (very effective).
Momentum
A three-item scale was used to measure perceived momentum (ranging between α = 0.63 and α = 0.79). Participants were asked to indicate how many participants took part in the last protest compared to previous demonstrations; how many new participants they estimated joined the last protest compared to previous ones; and how many participants had left the protest compared to the earlier protests. The latter was removed from the analysis as it compromised Cronbach’s alpha reducing it to α = 0.47.
Invested Effort
Two items were used only on the T1 questionnaire to assess the self-report subjective invested effort (α = 0.78). One of the two items was used through questionnaires T2 to T6: “In your opinion, to what extent have you invested effort to participate in the demonstrations?”
Socio-Emotional Predictors
Emotional Synchrony
A three-item scale was used to measure emotional synchrony through all questionnaires (ranging between α = 0.90 and α = 0.95). For example, participants were asked to what extent they identified with the statement: “During the demonstration, we, the protesters, felt strong shared emotion.”
Protesters’ Uniformity
One item was used to assess the subjective belief about the perceived protesters’ uniformity, ranging from “the protesters are very diverse” to “the protesters are very homogeneous.”
Emotional Fit
Seven emotions were measured (anger, shame, hope, despair, belonging, disappointment, and pride). Participants were asked to what extent they felt each emotion during their last protest. Based on recent work on emotional fit (De Leersnyder, 2017; De Leersnyder et al., 2015; Vandermeulen et al., 2023), we computed profile correlations (see De Leersnyder, 2017). Hence, we correlated each participant’s emotional pattern (i.e., scores of each emotion) with the emotional pattern of the group (i.e., mean score of the group in each emotion). The profile correlations resulted in a unique emotional fit value per participant per wave.
Emotional Exhaustion
Only in the T1 questionnaire a three-item item scale was used to measure emotional exhaustion (α = 0.82). A shorter version of two of the three items was used between T2 and T6 (ranging between α = 0.74 and α = 0.89). For example, participants were asked to what extent they identified with the statement: “Sometimes I feel worn out from participating in the demonstrations.”
Dependent Variable
Participation
One item was used to measure participation. Participants were asked whether they had attended the most recent weekly protest or not. As mentioned in the introduction, most of the research on CA is based on measures capturing willingness to participate in CA (e.g., Lizzio-Wilson et al., 2021) but not on assessing actual participation. Literature in social psychology highlights the “principle-implementation gap,” according to which individuals may support an idea (e.g., “I am willing to attend a protest on that topic”) while not acting accordingly in real life (e.g., “but maybe not in this specific up-coming protest on that topic”; Dixon et al., 2017). Therefore, it is essential to get as close as possible to measuring actual behavior rather than mere intentions. In our case, the ultimate measure is a self-report on actual participation in a demonstration after the action took place. To capture this in the most straightforward and unambiguous way, we chose a single item with a binary “yes” or “no” option that would not allow any misinterpretation.
Results
Data Analysis Strategy
The first part of the analysis was designed to address the question of which individuals participated over time versus which did not. Rather than predicting attendance each week, we were primarily interested in predicting individual’s general trajectory of attendance over time (e.g., were they dropping out, increasing their attendance, or some other trajectory), thus, we chose an analysis approach that could identify people’s trajectory of attendance, latent class growth analysis (LCGA). LCGA identifies unobserved latent groups of individuals who share similar longitudinal data patterns (Jung & Wickrama, 2008; Muthén & Muthén, 2000). We determined the number and nature of latent clusters in the samples based on the longitudinal changes in participation using LCGA. We used a standard model that assumes conditional independence of the indicator variables.
The second part of the analysis was designed to test the variables predicting which individuals belong to each group, namely, we tested the predictors of latent clusters membership using multinomial regression. A multinomial logistic regression model is used for data in which the dependent variable is unordered or polytomous, and the independent variables are continuous or categorical predictors and were introduced by McFadden (1974). This model is, therefore, suitable for variables measured on a nominal scale. Unlike a binary logistic model, in which a dependent variable has only a binary choice (e.g., presence/absence of a characteristic), the dependent variable in a multinomial logistic regression model can have more than two choices that are coded categorically, and one of the categories is taken as the reference category.
For our predictor variables that were measured over time, we followed the procedure of between-subject centering and within-subject centering, the most common procedure when dealing with longitudinal designs (Bolger & Laurenceau, 2013; Jebb et al., 2015; Wang & Maxwell, 2015). Between-subject centering creates a participant-level variable, computed as individuals’ mean across all time points. This variable captures the variance between participants, for example, a participant who was generally low on all measurements would receive a low value. In contrast, someone who was relatively high on all measurements would receive a high value. Thus, this variable captures the differences between people, hence the term “btw-participant.”
Then, our within-subject variable was created by subtracting this participant-level mean (i.e., “btw-participant”) from each time measurement (i.e., the raw value) and calculating the slope of all time points of each participant, hence creating the change variable yielding a unique value per participant. Thus, this variable represents changes or fluctuations over time for each participant, which is the within-subject variance. If we were to place the uncentered variable into the model, we would not know whether any effect was due to the between-subjects variance or the within-subjects variance (or some combination of the two). Thus, the method we have used allowed us to have those two sources of variance as separate variables in the same model so that it is clear what the effect of each is.
Since the linear combination of both between and within variables results in the original raw values, no information is omitted or added. The information is merely separated to distinguish the two effects. As these operations separated both effects, they are statistically independent of one another, as suggested by the lack of correlation between both “btw-participant” and “within-participant” variables (see Wang & Maxwell, 2015 for more information on centering approaches and see Hasan-Aslih et al., 2020 for a similar approach for longitudinal data). While we could also have baseline-centered our predictors (i.e., separating the variables into participants’ scores at T1 and their changes over time), this would have caused all participants to have a change score of 0 at T1 (i.e., the baseline). This then introduces new statistical issues, as there is no variance in the change variable at T1, creating asymmetry in the variances across time points (Bates, 2010). Therefore, we relied on mean-centering to create the “btw-participant” and the “within-participant” variables. All syntax underpinning the analyses can be found on this study’s OSF project (https://osf.io/e2tkr/?view_only=bf2c4fd448934ad4838c80bd33a40fe3).
To avoid multicollinearity due to many predictors, three separate multinomial regressions were conducted, one for the demographic variables to check if variables need to be controlled for; the second for the SIMCA variables to examine if the variables are relevant for the fourth step in Klandermans’s model (i.e., predicting sustained action); the third for the CISE variables, to explore potential predictors for the fourth step. We conducted t-tests on all the demographics and the background variables between the participants included in the analysis and participants who did not fill out at least four waves in the study (see Table 1). We found that gender, political identification, and past protests count in Balfour protest were significantly different, and therefore, they were controlled for in all four regressions. In each of the three first regressions, the variables found to be significant or marginally significant were included in the fourth regression, with the two components: within-participant and btw-participant.
t-Test Between Included and Excluded Participants, N included = 304, N excluded = 175.
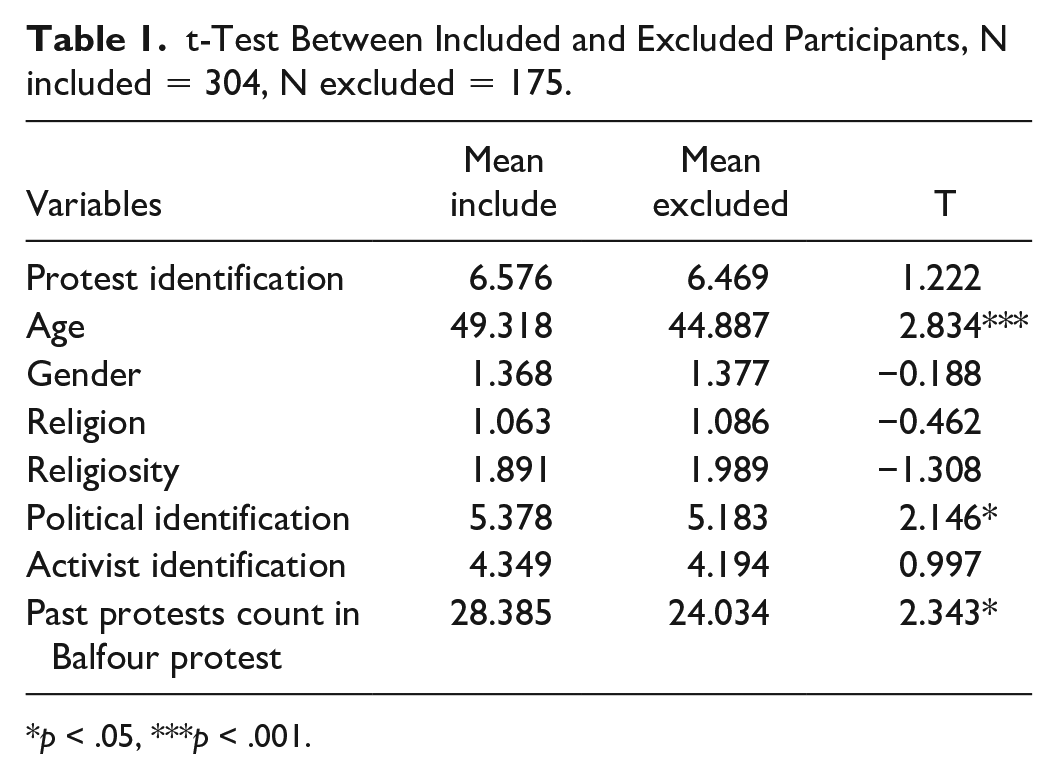
p < .05, ***p < .001.
Patterns of Attendance
The analysis aims to answer the question: Who are the individuals who participate over time and who do not participate? To determine the number and nature of latent clusters in the samples based on the longitudinal changes in participation, we conducted an LCGA on the attendance measures (between 4 and 6 values for each participant) using Mplus (Version 8; Muthén & Muthén, 2017). We used several indicators to assess model fit. Unlike cluster analysis, LCGA incorporates a goodness-of-fit test for the number of subgroups in the data (Osborne & Sibley, 2017). Thus, first, following Asparouhov and Muthén (2012), we compared a k–1 model (where k = the number of latent classes) with a k model using the Vuong-Lo-Mendell-Rubin (VLMR) test and bootstrapped likelihood-ratio test (BLRT). Second, we examined the Akaike information criterion (AIC), Bayesian information criterion (BIC), and adjusted BIC (aBIC) for each model, with smaller values representing a better fitting solution. Third, we considered model interpretability and fit with theory and model parsimony (e.g., by inspecting the profile plots; Muthén, 2006). Finally, we examined the entropy of each model, which captures the strength of separation between classes. Values greater than 0.80 indicate a clear delineation between classes. Lower values do not indicate misfit, per se, but indicate that the classes are less distinguishable (Celeux & Soromenho, 1996). Table 4 summarizes the fit statistics for classes with one to five classes, entropy, and the percentage of opponents and supporters assigned to the different classes.
The fit statistics indicate that the best-fitted models are the model using two classes and the model using three classes, with a slight advantage to the first. However, using the two classes model did not identify the class of participants who stopped participating. This class consists of the individuals who showed a participation pattern of ceasing to attend demonstrations during the time of the study. This class is very interesting to investigate as it can allow us to understand what predicts dropping out. We cannot examine this class any other way, as the two-class model divided the sample into high and medium participation. Therefore, since the two models are very similar in the fit statistics, we decided to use the three-class model in the following analysis. The three-class model consists of high attendance class, medium attendance, and low attendance (see Figure 2).
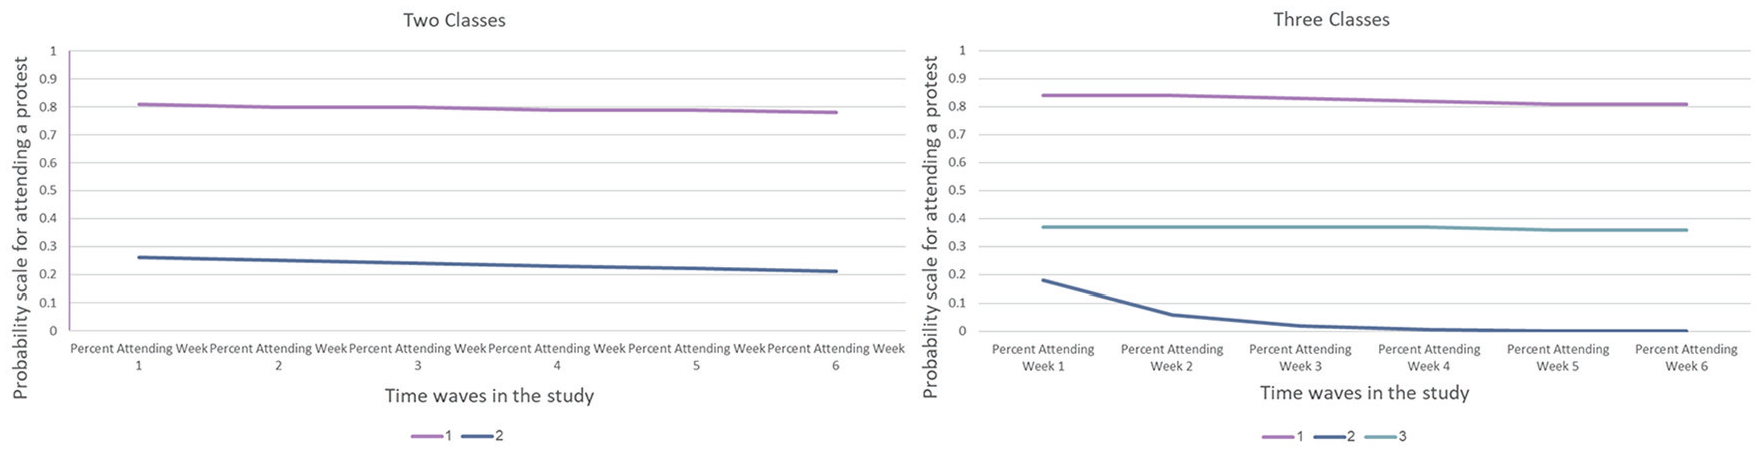
Latent Class Growth Analysis Model Result.
What Predicts the Patterns of Attendance?
The main analysis aims to answer the question of what will predict belonging to each group of the three classes of the LCGA. We tested the predictors of latent class membership using multinomial regression. The multinomial regression analysis step is comprised of four regressions. In all four regressions, the outcome was the classes of attendance. In addition, age, protest identification, and past protests count were controlled for in all four regressions since they were found significant in the t-tests (see Table 3); all btw-participants as they were measured once. We used “low participation” as the reference category as this was the group we were primarily interested in. See Table 2 for the results of the multinomial regression analysis.
Model-Fit Statistics for Latent Class Growth Analysis.
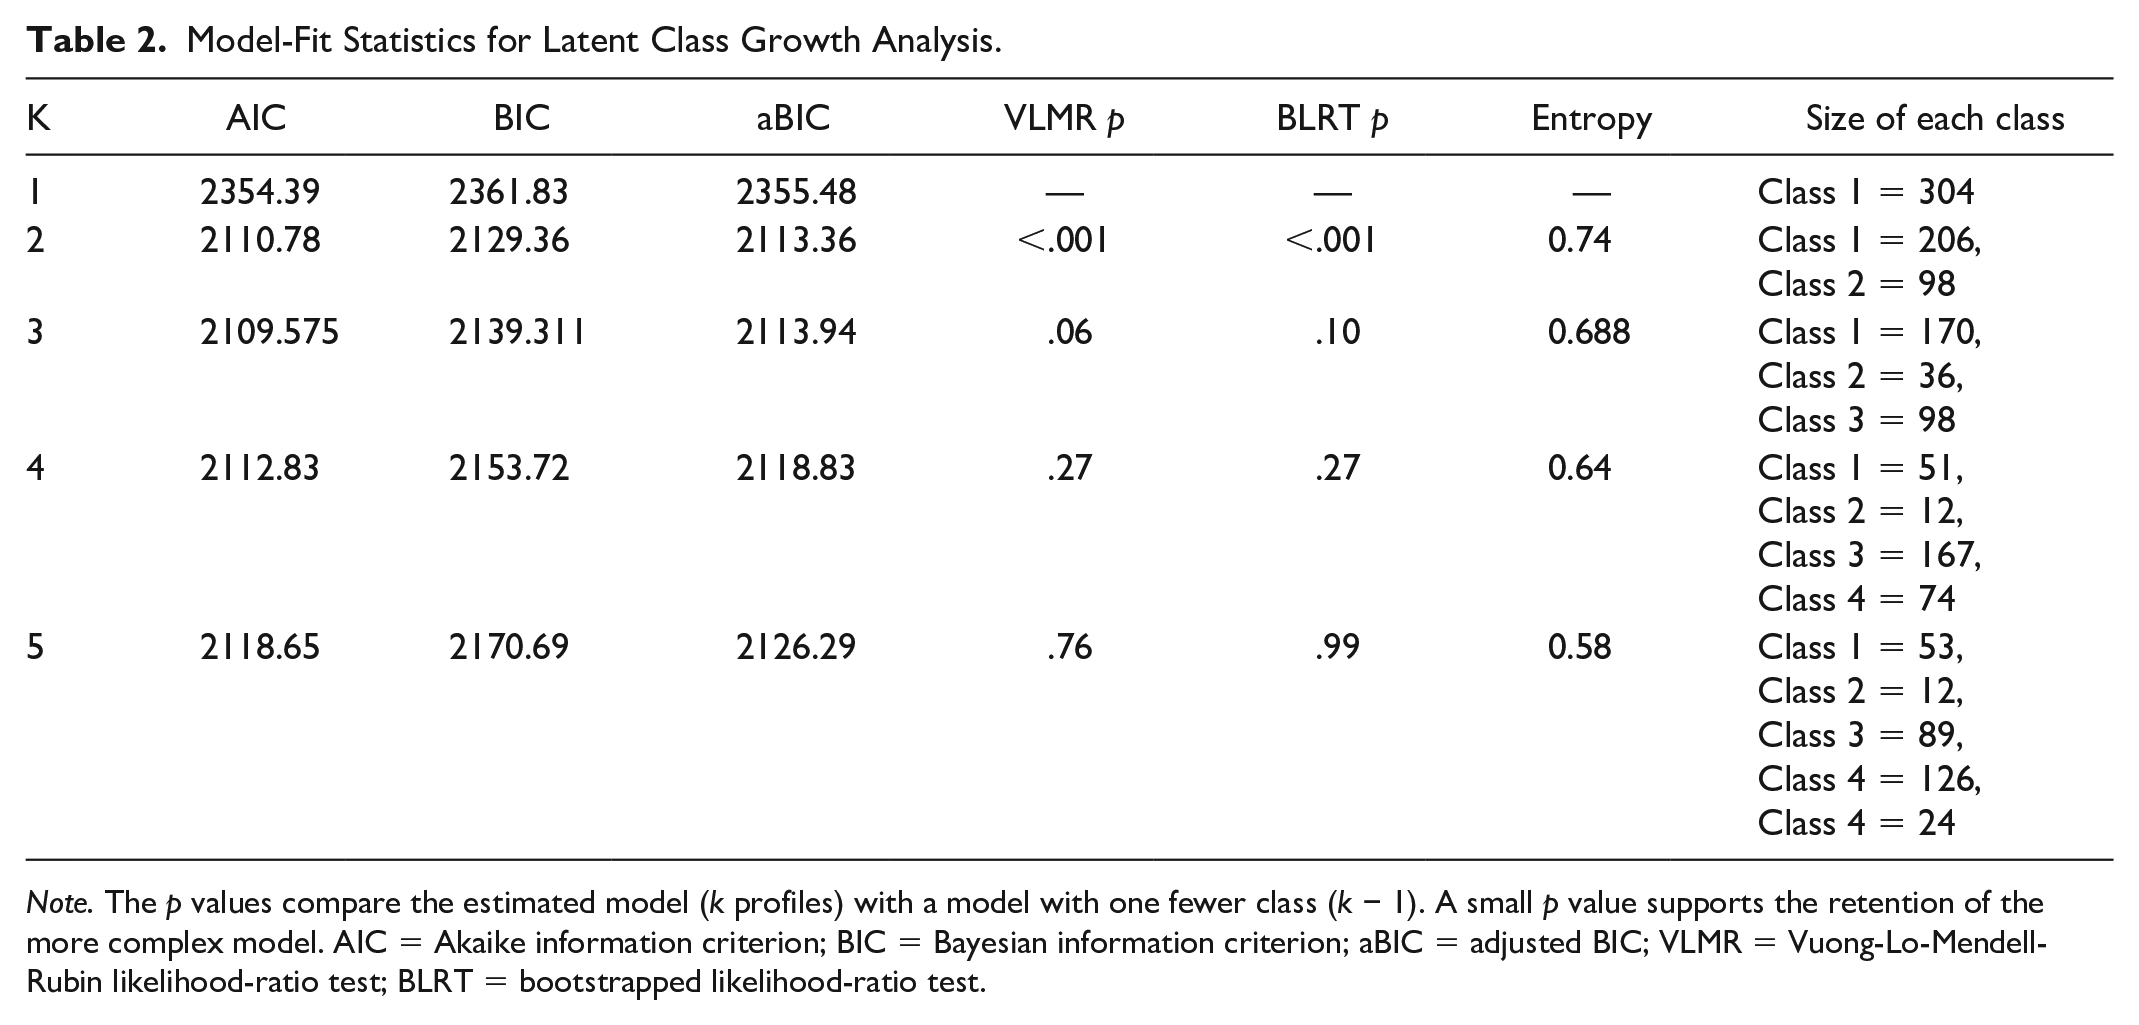
Note. The p values compare the estimated model (k profiles) with a model with one fewer class (k − 1). A small p value supports the retention of the more complex model. AIC = Akaike information criterion; BIC = Bayesian information criterion; aBIC = adjusted BIC; VLMR = Vuong-Lo-Mendell-Rubin likelihood-ratio test; BLRT = bootstrapped likelihood-ratio test.
In the first regression, the attendance classes were regressed on the demographics and background variables: gender, religiosity, activist identification, and all btw-participants as they were measured once. There were no significant demographic variables in addition to those we already intended to control for, so in the following steps, we only controlled for them (see Table 3). This model produced an R2 Nagelkerke of 0.224, suggesting that these variables explain 22% of the explained variance in the participation classes.
Multinomial Regression Analysis Results.
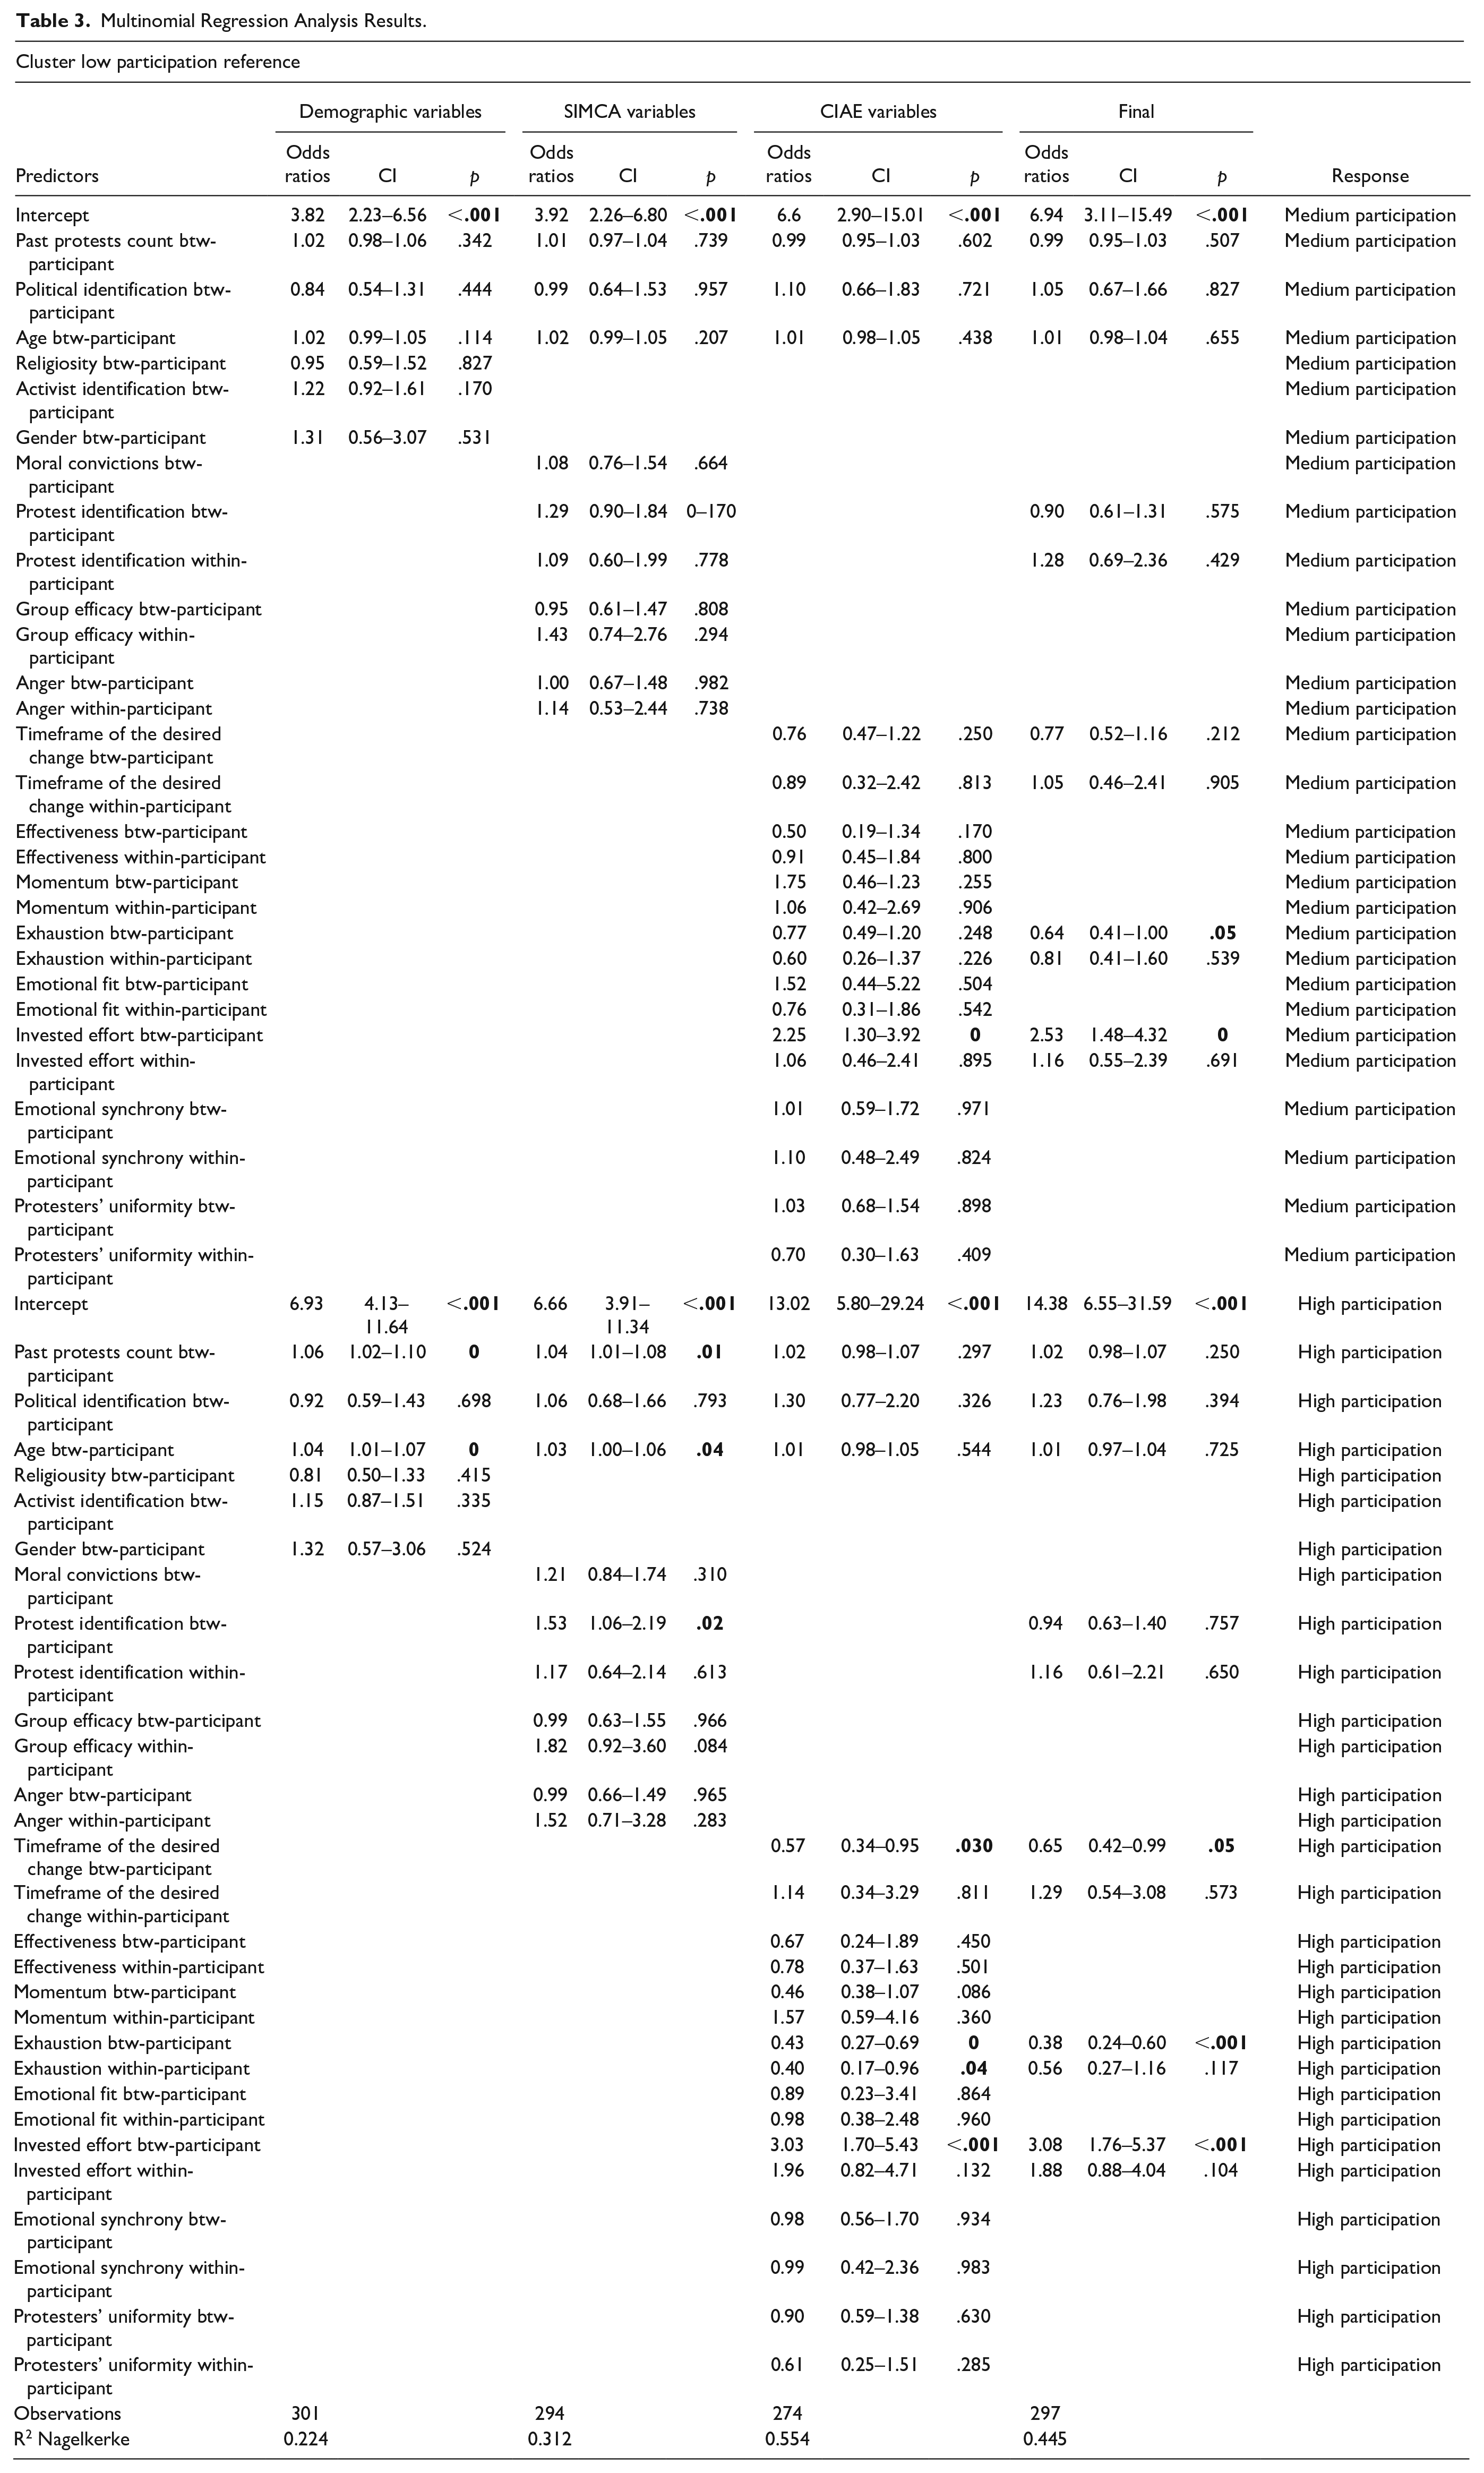
In the second regression, the SIMCA variables were added to the first model as independent variables: moral conviction, protest identification, group efficacy, and anger, all variables included both the within-participant and the btw-participant variables, except for moral convictions as it was measured once. Protest identification was found to be significant. There were no other significant predictors (see Table 3). This model produced an R2 Nagelkerke of 0.312, suggesting that these variables explain 31% of the variability in the classes of participation, which is an increase of 9% to the explained variance.
In the third regression, the CISE variables were added to the first model as independent predictors: timeframe of the desired change, effectiveness scale, momentum, invested effort, emotional synchrony, protesters’ uniformity, emotional fit, emotional exhaustion, both within-participant and btw-participant variables. The results show that invested effort, the timeframe of the desired change, and emotional exhaustion were significant. There were no other significant results (see Table 3). This model produced an R2 Nagelkerke of 0.554, suggesting that these variables explain 55% of the variability in the classes of participation, which is an increase of 24% compared to the previous regression.
After the three separate regressions were conducted, we found which demographic variables need to be controlled for, and which of the SIMCA and CISE sets of variables predicts the three classes of the LCGA. With these findings, we set the fourth regression to test which variables predict which individuals belong to each group when all relevant variables were included in the model. In the fourth regression, the independent variables were all the previous significant variables: protest identification, the timeframe of the desired change, invested effort, emotional exhaustion, all both within-participant and btw-participant variables, even if only one was found to be significant.
The results show that participants whose scores were higher on invested effort btw-participant (i.e., reportedly, put more effort into participating in the protests) [odds ratio (OR) = 3.08, 95% CI = [1.76, 5.37], p < .001] were more likely to be members of the high participation class compared with the low participation class. In addition, participants whose score is higher on the timeframe of the desired change btw-participant (i.e., think the time frame in which the movement goals will be achieved is longer) (OR = 0.65, 95% CI = [0.42, 0.99], p = .047), and participants who have higher scores on emotional exhaustion btw-participant (i.e., experience more emotional exhaustion) (OR = 0.38, 95% CI = [0.24, 0.60], p < .001) were less likely to be members of the high participation class compared with low participation class. Furthermore, participants whose scores were higher on invested effort btw-participant (i.e., reportedly, put more effort into participating in the protests) (OR = 2.53, 95% CI = [1.48, 4.32], p = .001) were more likely to be members of the medium participation class compared with the low participation class. A marginal effect was found such that participants who have higher scores on emotional exhaustion btw-participant (i.e., experience more emotional exhaustion) (OR = 0.64, 95% CI = [0.41, 1.00], p = .052) were less likely to be members of the high participation class compared with the low participation class. There were no other significant results (see Table 3). This model produced an R2 Nagelkerke of 0.445, suggesting that these variables explain 44% of the variability in the classes of participation. Even though the CISE regression had an 11% higher explained variance, both percentages are considered high in the social science field (Cohen, 2013). In addition, the R2 Nagelkerke is affected by the number of the regressed variables. Thus, the decrease might result from the fewer variables in the regression.
General Discussion
We explored which social-psychological factors predicted participation in future CAs after previous involvement in protests for the same cause. We recruited self-identified protestors who declared participation in the Balfour protest and surveyed them for 6 weeks in a row (six waves overall). The participants were asked to fill out the questionnaires each week after the weekly main demonstration. The aim was to observe the changes over time. Our goal was to examine whether our new CISE variables would predict SCA and to compare the SIMCA variable (van Zomeren et al., 2008, 2011) to the CISE variable to find out which, if any, could predict SCA.
We found that some CISE variables predicted participation above and beyond the SIMCA variables. The fourth and primary regression results in particular showed that less emotional exhaustion and a stronger perception of a closer timeframe of the desired change were positive predictors of SCA. It is interesting to note that individuals who experience more emotional exhaustion tend to drop out of the protest, while individuals who report investing more effort to participate tend to participate more. This finding implies that putting more effort into an activity might not be equivalent to experiencing emotional exhaustion from the activity. Nevertheless, the findings suggest that the sunk-cost fallacy (Arkes & Blumer, 1985; Thaler, 1980) may play a role in the tendency to participate in SCA over time. In addition, we found that the perception of a closer timeframe for achieving the desired change led to a tendency toward higher participation. All the significant effects stem from the between-participant variables, meaning that the differences between participants, rather than the within-person changes over time during the protest, were the decisive factor in individuals’ participation in SCA.
The CISE variables consisted of two subsets of variables: CISE predictors. The findings showed that only collective instrumental predictors (timeframe of achieving the desired change and invested effort) are positive predictors for SCA. We can learn from these findings that the characteristics of the predictors for the fourth step in Klandermans’s and Oegema (1987) model are related to coping with the decision to put effort into the cause while keeping the goal in mind. In other words, the results suggest that prolonged engagement is more about continuous goal pursuit and how to maintain it, rather than about being generally motivated for CA. Indeed, the absence of effects for the SIMCA variables implies that although the SIMCA variables are good predictors for explaining who is more motivated for CA in general, the CISE variables tell us that are more likely to keep acting. This finding strengthens our claim that CA and SCA are not the same phenomena, encourages more research into SCA (especially given its potential for actual change), and may suggest adding a new, fifth step to the Klandermans model.
The longitudinal design of measuring self-report of actual participation over time provides a novel perspective of SCA to the literature—namely, commitment to being involved in a social movement for periods of time. Furthermore, we suggest new variables capturing the dynamic nature of participation over time, the CISE variables as predictors for SCA. The CISE variables have not been examined in the context of predictors for CA before, especially the sunk-cost fallacy, a behavioral phenomenon known in the field of behavioral economics that has been applied in the psychology domain. Moreover, this research is the first to our knowledge to measure self-report of actual participation in multiple demonstrations in a row. Although a considerable part of research in the CA domain uses willingness to participate as the measure of CA (e.g., Alberici & Milesi, 2013; Bäck et al., 2015; Cakal et al., 2011; Cohen-Chen et al., 2014; Nelson et al., 2008; Shuman et al., 2016; Solak et al., 2017; Van Zomeren et al., 2004), there may be a “principle-implementation gap” (Dixon et al., 2017). In this sense at least, measuring the self-reported actual participation is a step forward in our field.
Furthermore, the current study can practically contribute to promoting social change. The study’s results can be used to maintain individuals as active players in shaping society according to their values. Non-governmental organizations or concerned citizens can use the findings as a basis for better communication with activists or developing interventions to prevent dropouts from SCAs. These findings may be helpful since they were found in a sample of both self-defined activist and self-defined non-activist. In democratic regimes, there is a desire for all population members to be able to take part in actions that affect the public agenda. Therefore, it is essential to find the relevant tools for more than only those who already see themselves as activists with the ability to act together for social change.
This study has a number of limitations. The study examines participation over time in a movement a few months after the movement started. We may have missed some of the dropout effects that happened before our study. For example, none of the variables’ effects stemmed from the changes within individuals. It is reasonable to assume that those mental processes had already occurred by the start of our study and thus were primarily observed as between-subjects effects. An additional longitudinal study that starts and ends with sustained action throughout the movement’s entire time period is needed to better understand the role of changes within individuals regarding participation in SCA over time.
Another potential limitation is our sample. Due to our sampling method, it is uncertain how accurately our sample represents the protest movement. Although we do not have evidence to suggest that the sample is not representative, it is important to acknowledge this potential limitation. It is possible that Emotional Fit (see De Leersnyder, 2017) could be a better predictor if it more precisely captured the overall movement, rather than a subsample of people who were more motivated to engage in scientific research. Replication using different sampling method may be necessary to estimate this possible effect, yet it is obviously challenging given the nature of the studied phenomenon.
Furthermore, the study and the protest occurred during the COVID-19 pandemic. It is unknown how that might have affected our findings. On the one hand, it could have prevented individuals at risk or those fearful of catching the virus from participating in the protest. On the other hand, while the COVID-19 restrictions were in place, the demonstrations were the only option for some individuals to meet others in person. In both cases, there is a risk that our sample is not generalizable to other contexts. When there is no longer the threat of a global pandemic, replication may be necessary to understand the scope of the pandemic effects.
Finally, it is important to note that this work is based solely on a study conducted in one particular culture and context, thus limiting its generalizability. Although there is currently no evidence to suggest that different contexts would produce different results regarding factors that affect SCA, like any emerging field of study that is still in its early stages of development, further research is needed to investigate this. The political climate during that period was characterized by governmental instability caused by consecutive elections without the formation of a stable government. This may have impacted the protests’ goals, making them appear more attainable. On the other hand, it could also have created a sense of desperation among citizens who had been voting in four elections for 2 years, only to see the situation worsen and more elections taking place.
In the future, we aim to replicate these findings across diverse contexts. This includes protests in different countries, varied cultural and political backgrounds, led by minorities, and with distinguishable goals. In addition, we plan to examine factors related to a unique context to determine whether this model is unique to a specific culture. The Balfour protest was the largest protest in Israel since 2011 (in which there was a protest about the cost of living in Israel). Since the Balfour protest, it seems that Israelis have gained experience in protests, as in the days of writing these lines, there is another ongoing protest against the government’s legal reform. Perhaps, in the future, it will be accurate to discuss habits and norms as meaningful factors that play a role in the context of Israel, but it was not relevant at the time of the current study.
In conclusion, our explorative study reveals that CA and SCA are interrelated phenomena yet may not be the same. The study reveals that a different model of predictors is needed to predict engagement or dropping out in the context of long-lasting movements. We hope that the current study will be the first of a new line of research and theorizing about SCA, as this type of action holds a great potential for positive social change.
Footnotes
Declaration of Conflicting Interests
The author(s) declared no potential conflicts of interest with respect to the research, authorship, and/or publication of this article.
Funding
The author(s) received no financial support for the research, authorship, and/or publication of this article.