
Abstract
How does a person’s socioeconomic status (SES) relate to how she thinks others see her? Seventeen studies (eight pre-registered; three reported in-text and 14 replications in supplemental online material [SOM], total N = 6,124) found that people with low SES believe others see them as colder and less competent than those with high SES. The SES difference in meta-perceptions was explained by people’s self-regard and self-presentation expectations. Moreover, lower SES people’s more negative meta-perceptions were not warranted: Those with lower SES were not seen more negatively, and were less accurate in guessing how others saw them. They also had important consequences: People with lower SES blamed themselves more for negative feedback about their warmth and competence. Internal meta-analyses suggested this effect was larger and more consistent for current socioeconomic rank than cultural background.
Socioeconomic Status Differences in People’s Beliefs About How Others See Them
“What people think of me: Your quick guide to caring less” (Kennet, 2016) is just one of hundreds of self-help books aimed at teaching people to stop caring about what others think of them. This genre’s popularity suggests that, often against their wishes, people worry about their meta-perceptions, or how others perceive them. But why do some worry while others are confident they will be liked and respected? We propose one way to predict a person’s meta-perceptions is to consider their socioeconomic status (SES). We test the link between SES and meta-perceptions, and related questions about mechanisms and consequences of this link, across three studies (two pre-registered). Fourteen additional studies in the SOM (six pre-registered) replicate these effects. The SOM studies are either smaller-sampled pilot studies or focus on testing different questions but nonetheless contain relevant data.
We posit two reasons why SES would predict meta-perceptions. Before delving into them, a caveat: To avoid portraying one point on the SES spectrum as the default, we present predictions and results sometimes by referring to low SES individuals compared with high SES individuals, and at other times, by the opposite comparison.
Self-Presentation
People often strategically present themselves in a positive light (Gibbs et al., 2006; Leary & Kowalski, 1990). Those who intend to present themselves in a positive light and are confident they can do so successfully should expect others to see them positively (see Toma & Carlson, 2015). This may describe individuals with high SES better than those with low SES: They are more likely to show off to manipulate others (Belmi & Laurin, 2016), and to be confident in their abilities (Belmi et al., 2020).
This aligns with theory and research showing that social class groups develop ways of being adapted to their social structures and that guide thoughts and behavior, including appropriate ways to present oneself to others (e.g., Bourdieu, 1984, 2018; Snibbe & Markus, 2005; Stephens et al., 2014). People in working-class cultural contexts tend to value interdependent goals like fitting in and maintaining relationships (Dietze & Knowles, 2016; Stephens et al., 2007), such that confidently presenting oneself in a positive light may seem like bragging. In contrast, people in higher-class contexts tend to value independent goals like self-promotion and self-expression (Snibbe & Markus, 2005; Stephens & Townsend, 2013), which align well with self-presentation. Moreover, people with limited resources and power likely feel less control over others (Kraus et al., 2009; Lachman & Weaver, 1998), perhaps including over others’ impressions of them. These self-presentational factors might lead people with low (vs. high) SES to expect others to see them less positively.
Self-Regard
Recent developments in sociometer theory indicate that self-esteem and narcissism are both hierometers: They increase when people feel high status (Mahadevan et al., 2019). Moreover, because working-class contexts promote seeing the self as part of a connected network with others, these contexts likely discourage overly positive self-views (compared with higher-class cultures, which promote seeing the self as uniquely important and prioritizing it over relationships; Grossmann & Varnum, 2011; Stephens et al., 2007). These factors help explain why people with low (vs. high) SES have more negative self-perceptions—lower self-esteem (Twenge & Campbell, 2002) and narcissism (Foster et al., 2003; Piff, 2014). Because people sometimes base their meta-perceptions on their self-perceptions (Carlson & Elsaadawy, 2019; Kenny & DePaulo, 1993), this too might lead people with low (vs. high) SES to expect others to see them less positively.
Self-regard is likely positively related to self-presentation: In most cases those who see themselves positively probably believe they can convey that positivity to others. However, the constructs are distinct: People could view themselves positively but be unwilling to show off when self-presenting (e.g., if this feels manipulative), or view themselves positively but doubt that others will be convinced by their self-presentation attempts (e.g., if they expect others to discriminate against them).
Consequences
These lines of reasoning suggest people with lower (vs. higher) SES may have more negative meta-perceptions. This likely has consequences for how these individuals reason about their interpersonal failures. When people fail, they attribute it to themselves if it is what they expected, but to external factors if it is not (e.g., Feather & Simon, 1971; Ford & Collins, 2010). For example, after a bad date, people who believe they are socially inept blame themselves, but people who believe they are socially gifted blame the awkwardness of first dates (Girodo et al., 1981). If someone with lower SES (who expects others to see her negatively) finds out that she did not get a job she applied for, or that a second date will not follow last week’s first, she will likely blame herself. In contrast, if someone with higher SES receives similar negative feedback, she will likely downplay her own responsibility, instead blaming the interviewer or the date. We therefore predict that SES differences in meta-perceptions will translate into SES differences in attributions for interpersonal failure.
Multidimensionality
Dimensions of Meta-Perceptions
Our hypotheses are about the general positivity of meta-perceptions, not meta-perceptions on any particular trait(s). In testing our hypotheses, we nonetheless considered two different positive meta-perceptions: competence (e.g., ambition, intelligence) and warmth (e.g., kindness, trustworthiness). We predicted that higher-SES people would expect to be seen as both more competent and warmer. That said, these are distinct and fundamental dimensions of interpersonal perception (Bakan, 1966; Fiske et al., 2007; Wiggins, 1979), and they differ in their intuitive associations with SES. Those with higher (vs. lower) SES might reasonably expect others to see them as more competent simply based on their education and financial success: Education is presumably intended to increase competence, and increased income should be a sign of competence (at least in a meritocratic society; Lerner, 1980). But without our hypothesized pathways through self-regard and self-presentation, it is less clear why SES would predict warmth meta-perceptions. We therefore view associations between SES and warmth meta-perceptions as especially meaningful: They are not subject to this alternative explanation based on meritocracy.
Dimensions of SES
The literature provides many distinct ways to conceptualize SES. One distinction is between objective SES (typically indexed by income or education; Kraus & Stephens, 2012) and subjective SES (typically indexed by self-reported position on a ladder representing the socioeconomic hierarchy; Adler et al., 1994). Subjective and objective SES differently predict psychological outcomes (e.g., Anderson et al., 2012; Belmi & Laurin, 2016); subjective SES more strongly predicts self-perceptions (Kraus & Park, 2014) and self-presentation (Belmi & Laurin, 2016). We therefore pre-registered that subjective, compared with objective, SES would more strongly predict meta-perceptions and their consequences.
Nonetheless, our studies also include objective measures like income and education. This allowed us to explore a second distinction in conceptualizing SES: As a malleable sense of current rank, or a stable cultural background. This second distinction was not on our radar when we ran these studies and is therefore not in our pre-registrations. We explore it here without a priori hypotheses.
Scholarship conceptualizing SES as current rank argues that people assess their standing by comparing their resources and status to others’, and that that assessment then affects people’s thoughts, feelings, and behaviors (Kraus et al., 2013). The (subjective) ladder measure is the predominant measure of rank; other measures include asking about people’s current resources (e.g., income). In contrast, scholarship conceptualizing SES as cultural context argues that high SES contexts promote independence and low SES contexts, interdependence (Stephens et al., 2014; Stephens & Townsend, 2013). Measures of culture include asking about people’s family backgrounds (e.g., their parents’ income when they were children) and education (as educational degrees are typically obtained in young adulthood, and educational institutions promote high SES norms; Phillips et al., 2020; Stephens et al., 2012).
Though these perspectives have co-existed for over a decade (Kraus et al., 2009, 2011; Stephens et al., 2007; Stephens & Townsend, 2013), little empirical work distinguishes between them. Our studies and internal meta-analyses test how and to what degree rank and culture predict meta-perceptions and attributions. These perspectives on SES are not mutually exclusive, and we do not aim to put them in competition to declare a winner. Rather, they are complementary: Both rank and culture likely affect people’s psychology in many ways, including their meta-perceptions. For example, rank and culture are both linked to our proposed mechanism of self-regard (e.g., both income and education predict self-esteem; Twenge & Campbell, 2002), but for different reasons. People who feel high (vs. low) in rank are likely to see themselves as having higher economic value and therefore higher self-worth in general (Kraus & Park, 2014); people from middle- or upper- (vs. working-) class cultural contexts are likely socialized from a young age to value their own unique attributes (Grossmann & Varnum, 2011; Stephens et al., 2007). There may also be additional mechanisms unique to either rank or culture that affect meta-perceptions in particular contexts; we return to this possibility in the General Discussion.
Causal Direction
The theoretical argument we have laid out here describes a specific causal chain: SES affects self-presentation and self-regard, which in turn affect meta-perceptions. But the links between these variables may operate in other directions as well. For example, someone who doubts that others will see them positively may lack confidence in job interviews, which could result in low SES. That is, SES may not always be the starting point as we have described it here; SES could also be an outcome, making the pathway cyclical rather than linear (e.g., Bourdieu, 1984, 2018; Laurin et al., 2019; Markus & Kitayama, 2010). In any case, our studies will not demonstrate causality: We attempted to manipulate SES, but despite using manipulations that succeeded in past research (Kraus et al., 2010), our manipulation checks showed null effects (see SOM Studies S11-S13). Nevertheless, our correlational data provide a nuanced picture of the associations between variables that can inform future causal research.
Overview of Studies
Study 1 tested the relationship between SES and meta-perceptions by having participants interact in person and rate their meta-perceptions. Study 2 tested mechanisms of the SES—meta-perceptions link by having participants imagine interactions and rate their self-regard and self-presentation. Both studies found links between SES and meta-perceptions (as did the 14 supplemental studies; see SOM), but there were inconsistencies across measures. Internal meta-analyses across all 17 datasets revealed a pattern mapping onto the rank—culture distinction. Next, we briefly return to Study 1, presenting additional data exploring SES differences in meta-perception accuracy. Study 3 then examined the consequences of SES-linked meta-perceptions for attributions for negative feedback. A second set of internal meta-analyses across all eight datasets measuring attributions uncovered the same pattern distinguishing rank from culture. Pre-registrations for Studies 2, 3, and six supplemental studies, and data and code for all studies, are available at https://osf.io/g7v94/?view_only=f03d6682f7e1418ab88277ba11df9743.
Study 1
Study 1 was conducted for a different purpose (Bjornsdottir et al., 2022; Elsaadawy et al., 2021; Heyman et al., 2022; Rau et al., 2019; Tissera et al., 2021) and was therefore not pre-registered. However, it measured SES and meta-perceptions using a large sample of in-person interactions, offering a strong initial test of our question.
Methods
Participants
Participants were 546 Canadian undergraduate students, the maximum sample we could recruit in 2 years. No participants were excluded. See Table 1 for all studies’ demographics.
Demographics for All Studies.
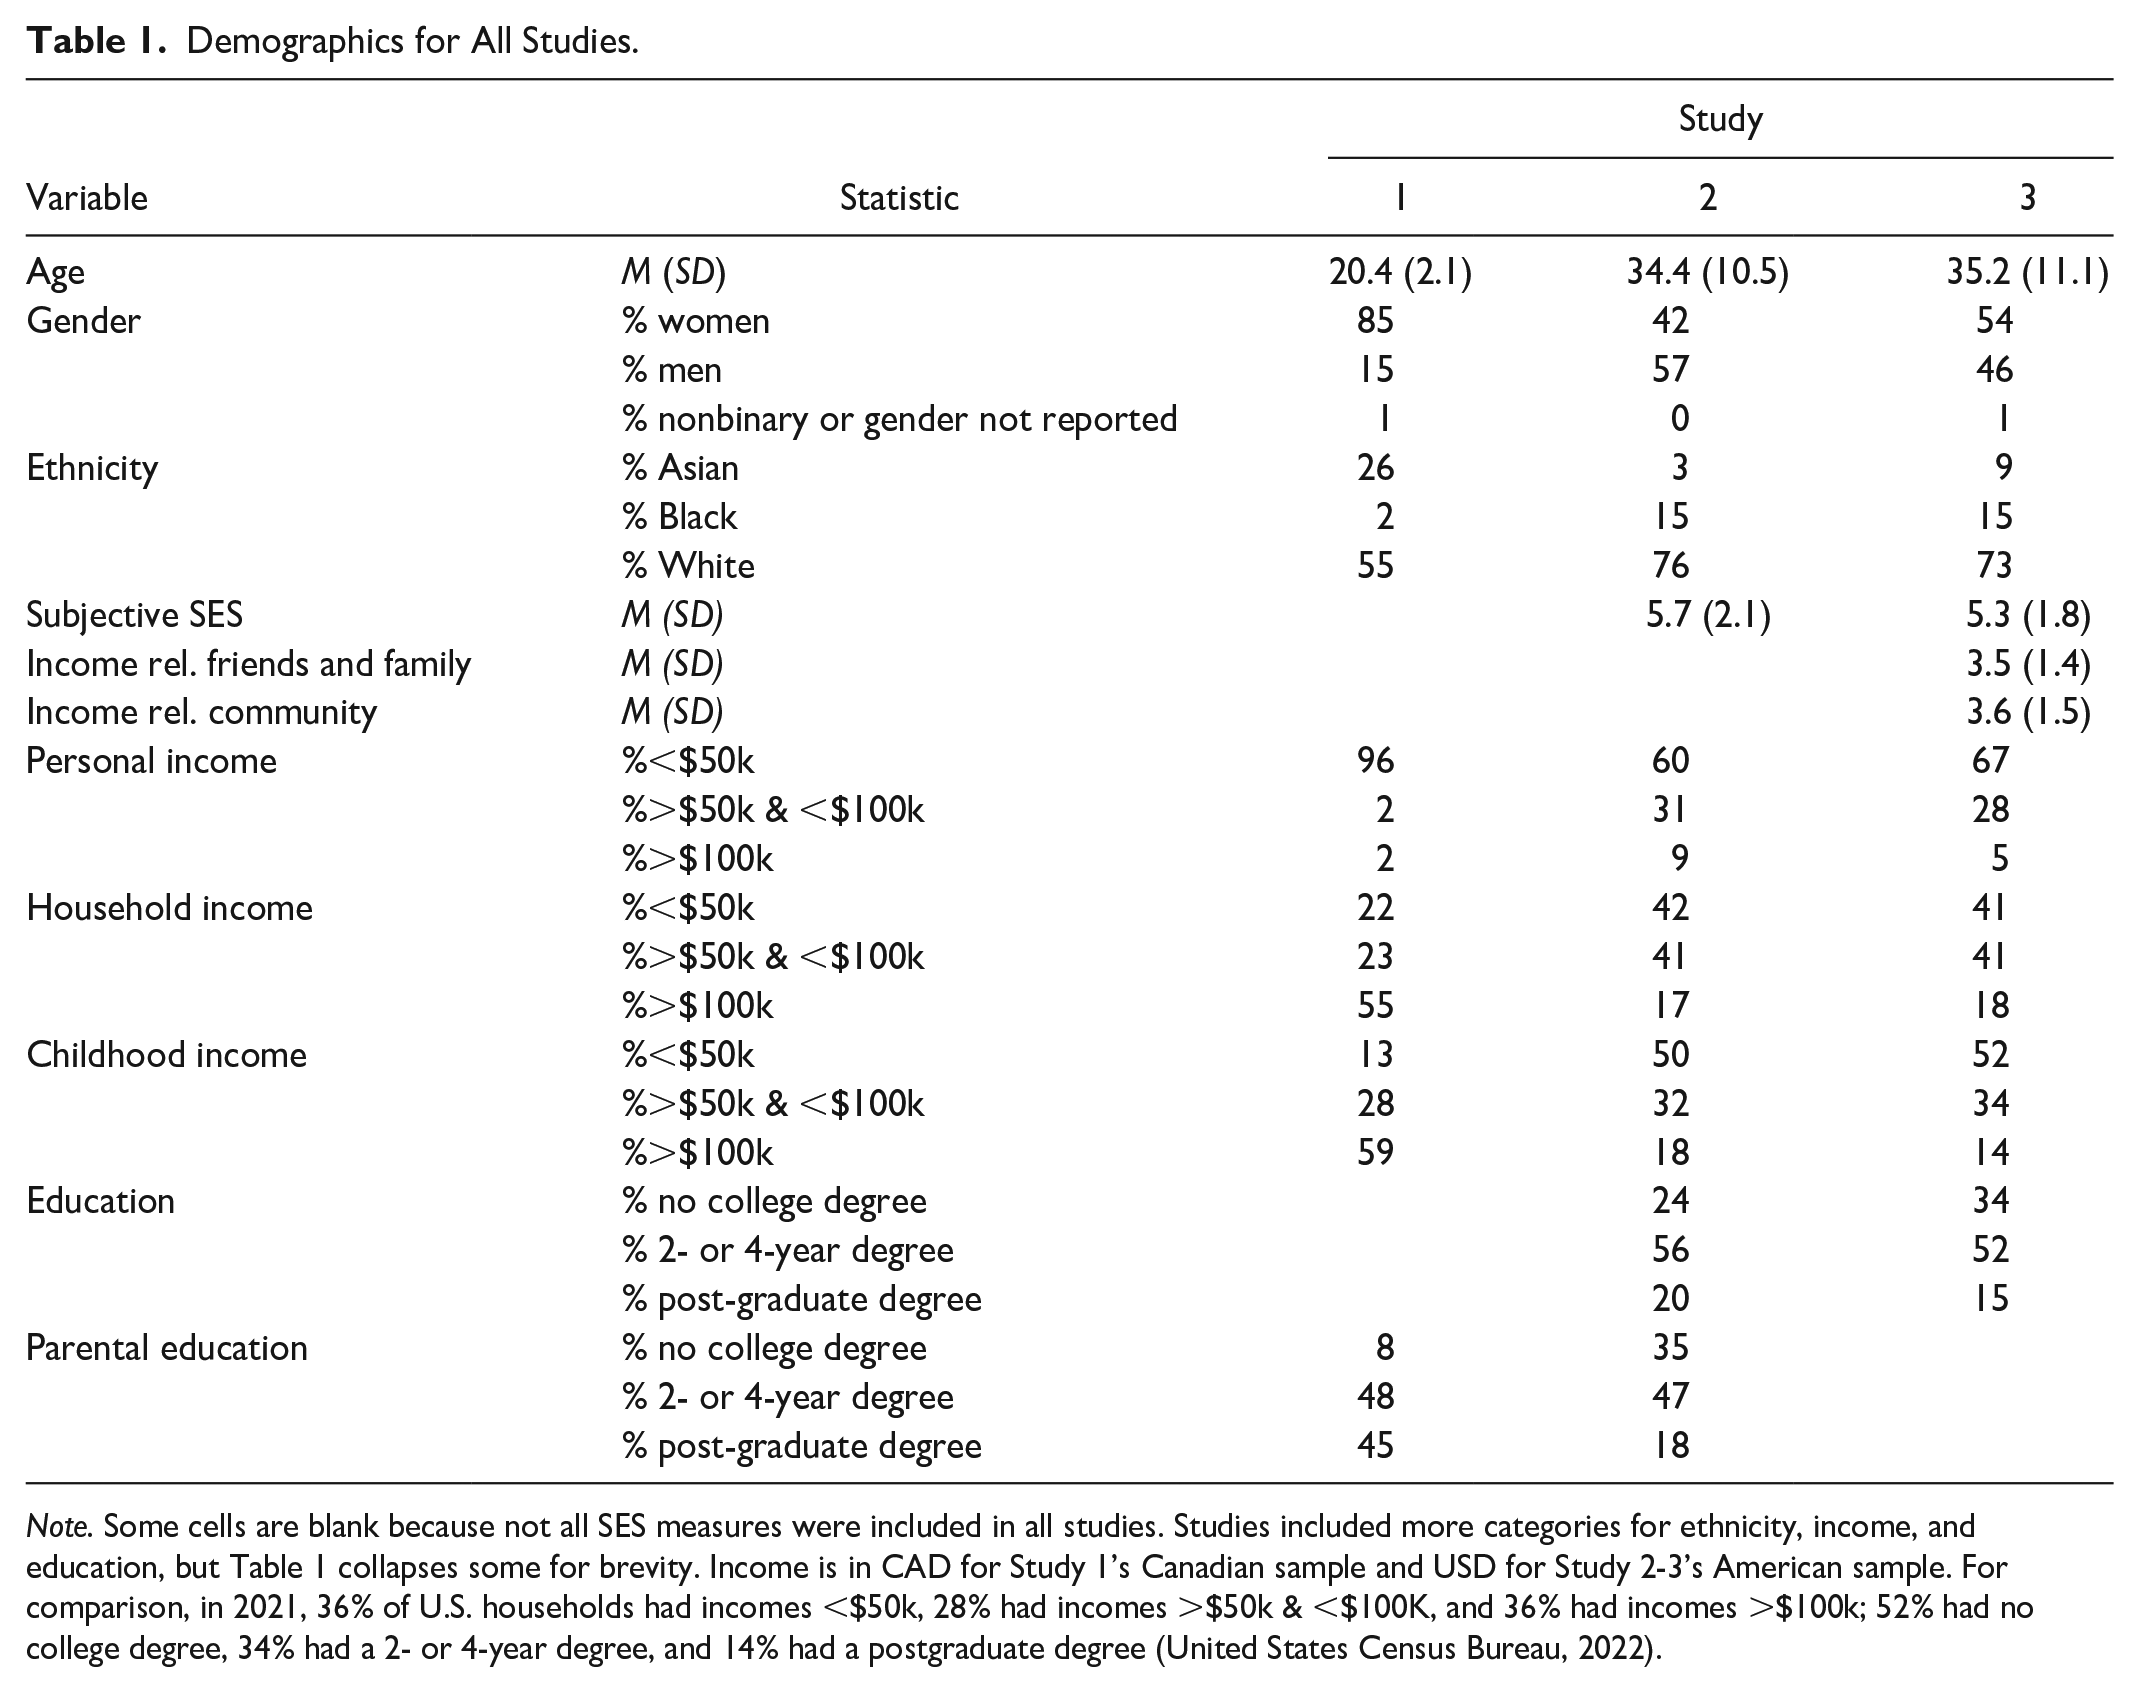
Note. Some cells are blank because not all SES measures were included in all studies. Studies included more categories for ethnicity, income, and education, but Table 1 collapses some for brevity. Income is in CAD for Study 1’s Canadian sample and USD for Study 2-3’s American sample. For comparison, in 2021, 36% of U.S. households had incomes <$50k, 28% had incomes >$50k & <$100K, and 36% had incomes >$100k; 52% had no college degree, 34% had a 2- or 4-year degree, and 14% had a postgraduate degree (United States Census Bureau, 2022).
Procedure
Participants first reported demographics, including SES. All measures were objective; two related to current rank (annual income, household income), and three to cultural context (childhood income, highest educational degree obtained by a parent, and highest total years of education completed by a parent). All income questions provided eight response options (<$15,000 to >$150,000). Participants then reported their self-perceptions (“I see myself as someone who. . .”) using 12 items (1 = strongly disagree, 7 = strongly agree). Two measured intelligence: “Is intelligent” and “Is bright”; the other 10 measured the Big Five traits (e.g., for agreeableness: “Is helpful and unselfish with others”; John & Srivastava, 1999).
In groups of three to eight (mode = 6), each participant had a two minute conversation with each other participant. After each conversation, participants reported perceptions (“I see this person as someone who. . .”) and meta-perceptions (This person sees ME as someone who. . .”) of their conversation partner. Both measures asked about the same 12 traits and used the same response scale as the self-perceptions measure. Each participant thus rated 12 meta-perception items for each groupmate. We analyzed the data at the item level, providing a high-powered sample (36,439 observations in total, or M = 66.74, SD = 14.06 observations per participant).
We analyzed the data at the item level, rather than combining items into warmth and competence subscales because the items did not directly ask about warmth and competence. For example, does the trait “Is original, comes up with new ideas” belong in a warmth subscale, a competence subscale, or neither? To circumvent this issue, a separate pool of 72 undergraduates rated each of the 12 traits on warmth and competence (both intraclass correlation coefficients [ICCs] = .98): “To what extent would strongly agreeing you have the following trait indicate that you are [warm/competent]? In other words, how [warm/competent] do you think someone who has this trait is likely to be?” (1 = very cold/incompetent, 7 = very warm/competent). Using warmth ratings as an example, raters thought that someone who “Is helpful and unselfish with others” and “Is outgoing, sociable” would likely be a warm person, (M = 5.57 and M = 5.60, respectively), whereas someone who “Tends to find fault with others” and “Is depressed, blue” would likely be a cold person (M = 2.17 and M = 2.72, respectively).
For each participant, the item-level correlations between how much they expected others to perceive them in line with each trait, and how much each trait projected warmth (or competence) according to our raters, reveals that participant’s meta-perception of warmth (or competence). Continuing with the warmth example, if a particular participant’s meta-perceptions for each trait are strongly positively correlated with how much that trait signals warmth, that means this participant expected others would see them more in line with traits characteristic of a warm person. Conversely, if a different participant’s correlation is negative, that means this participant expected others to perceive them more in line with traits characteristic of a cold person. We could therefore test our hypothesis by evaluating whether SES moderated the item-level correlations: Did high SES participants show more positive correlations—did they expect to be seen more in line with traits reflecting high warmth and/or competence—than low SES participants?
Results
We expected significant positive interactions between coders’ ratings and SES predicting participants’ meta-perceptions: Participants with higher (vs. lower) SES should believe others perceive them more in line with traits reflecting higher warmth and competence.
SES—Meta-Perceptions Link
We tested this interaction in 10 multilevel regression models, each one predicting meta-perceptions from one of the five SES measures, one of two sets of coder ratings (warmth or competence), their interaction, and random intercepts for participants. (Initially, we also included random intercepts for interaction partner and dyad, but these accounted for close to 0% of the variance and created convergence problems).
The predicted interaction emerged in nearly all models (see Table 2, top 5 rows): Participants with higher, compared with lower, SES were more likely to believe others saw them as possessing warm and competent traits. Put differently, people with higher (vs. lower) SES had more positive meta-perceptions. Parental years of education was the only SES measure that did not show this pattern consistently.
Interactions Between Different Measures of SES and Warmth/Competence Trait Ratings Predicting Meta-Perceptions, Study 1.
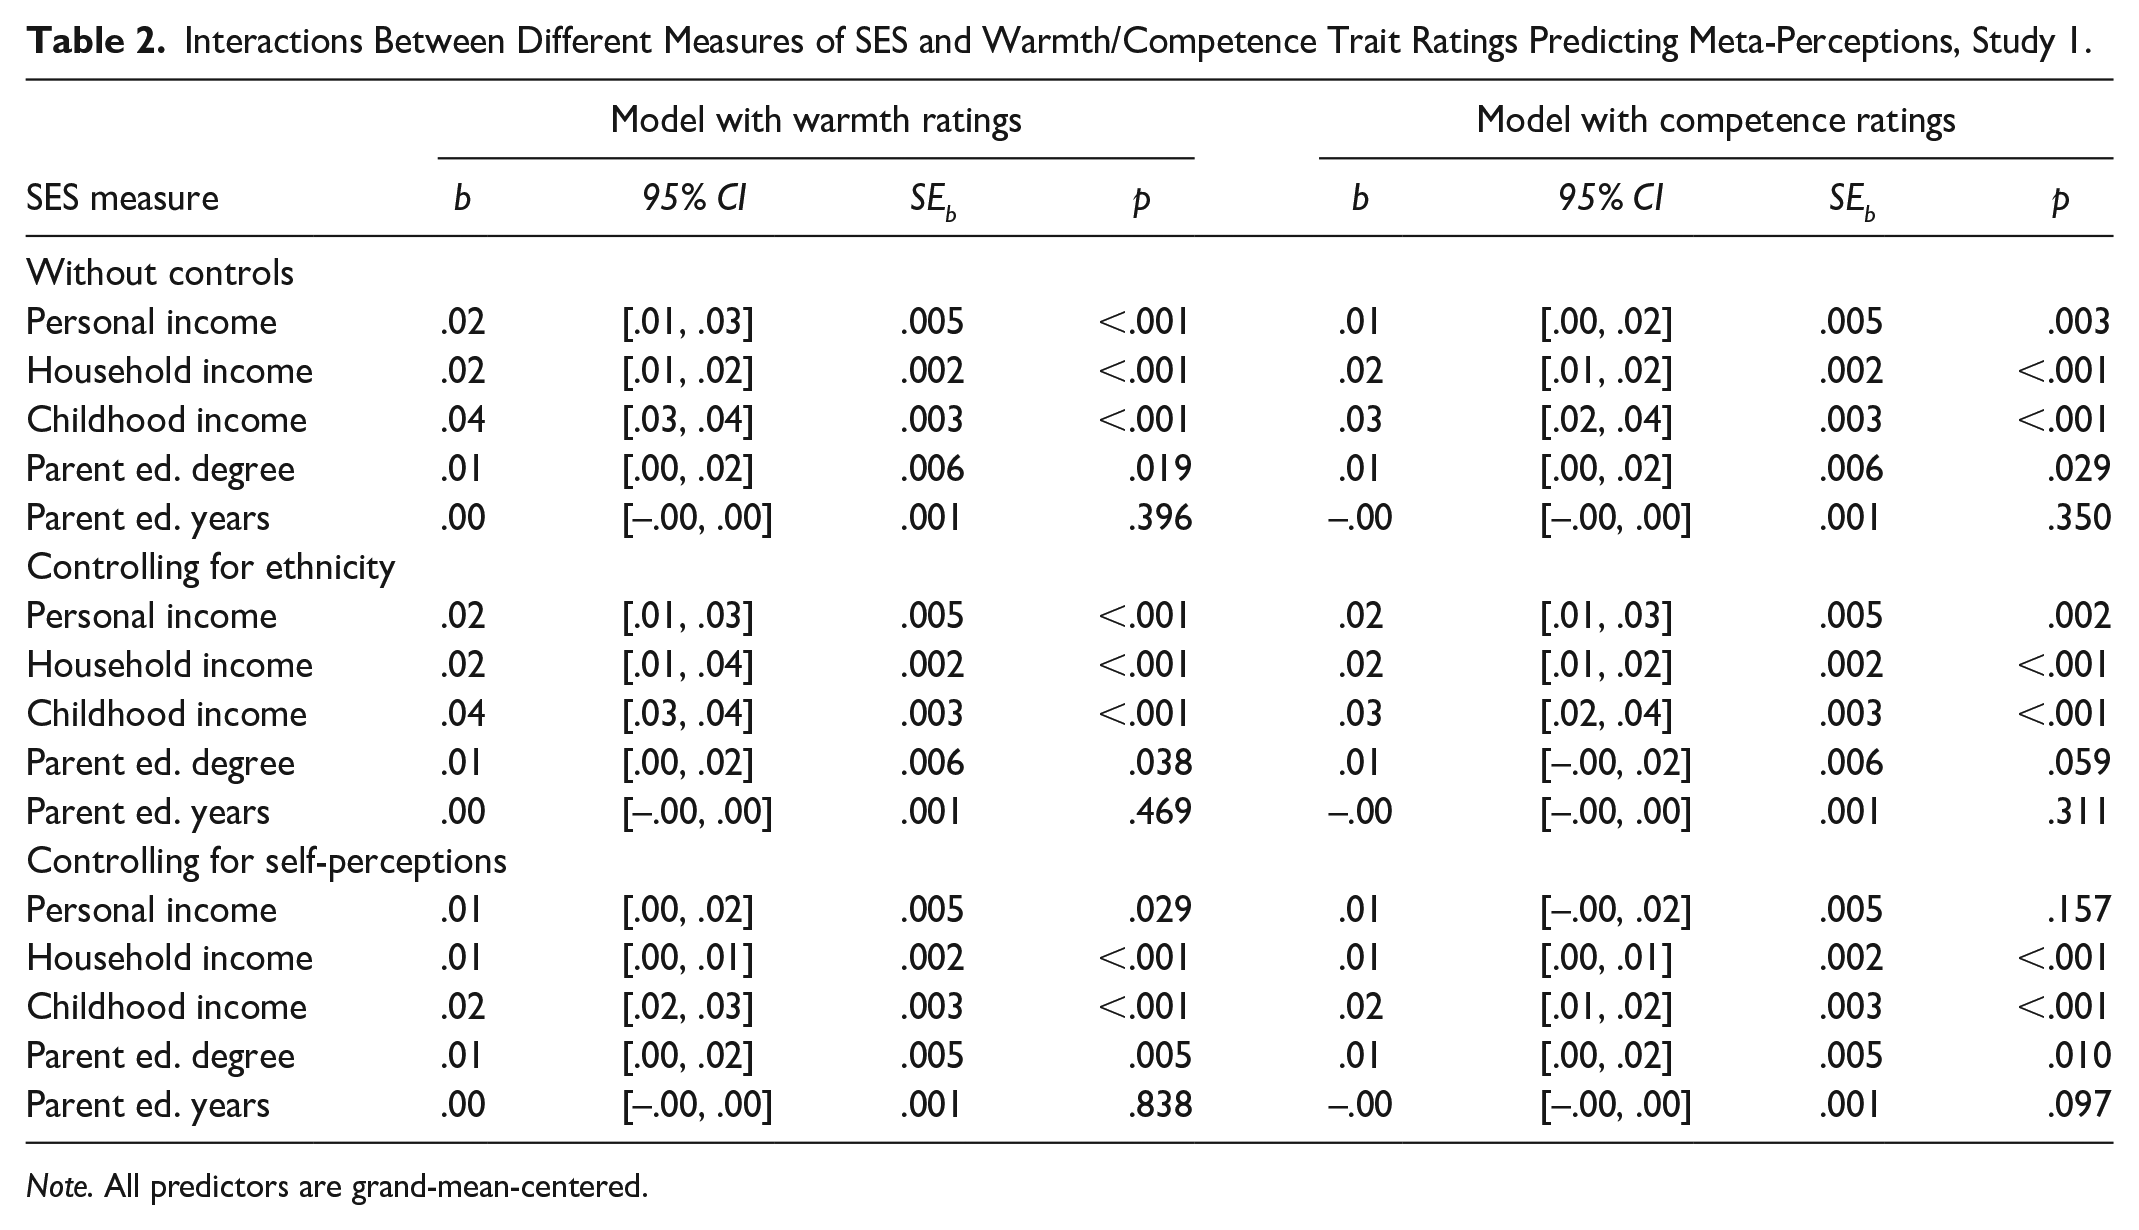
Note. All predictors are grand-mean-centered.
Robustness Checks: Ethnicity and Self-Perceptions
We also ran two sets of robustness checks (see Table 2, bottom 10 rows). First, because SES is confounded with ethnicity in North America (Akee et al., 2019; Block et al., 2019), we ran all models controlling for ethnicity (1 = socioeconomically advantaged group [White and/or Asian], –1 = socioeconomically disadvantaged group [Black, Hispanic, Indigenous, multiethnic other than White and Asian, or other ethnicity]; Birnbaum et al., 2021) and its interaction with coders’ ratings. Second, to ensure the effects on meta-perceptions were not simply reducible to self-perceptions, we ran models controlling for self-perceptions.
Effects generally held controlling for ethnicity. This was also true in all other studies; see SOM. The SOM also reports parallel analyses examining the relationship between ethnicity and meta-perceptions: In Study 1, White and Asian participants had more positive meta-perceptions on the warmth dimension only; in Studies 2 to 3, this group had more negative meta-perceptions on both dimensions. These findings suggest that the SES—meta-perceptions link is not explained by a general tendency for people from advantaged groups to believe others see them positively; instead, the effect seems specific to SES.
Effects also generally held controlling for self-perceptions; this was also true in other studies where we measured self-perceptions, see SOM. Thus, the association between SES and meta-perceptions is not entirely reducible to self-perceptions. Even if two people view themselves similarly, the one with lower SES is more likely to believe that others doubt her warmth and competence. In Study 2, we consider the role of self-regard, a potential driver of both self- and meta-perceptions.
Multidimensionality
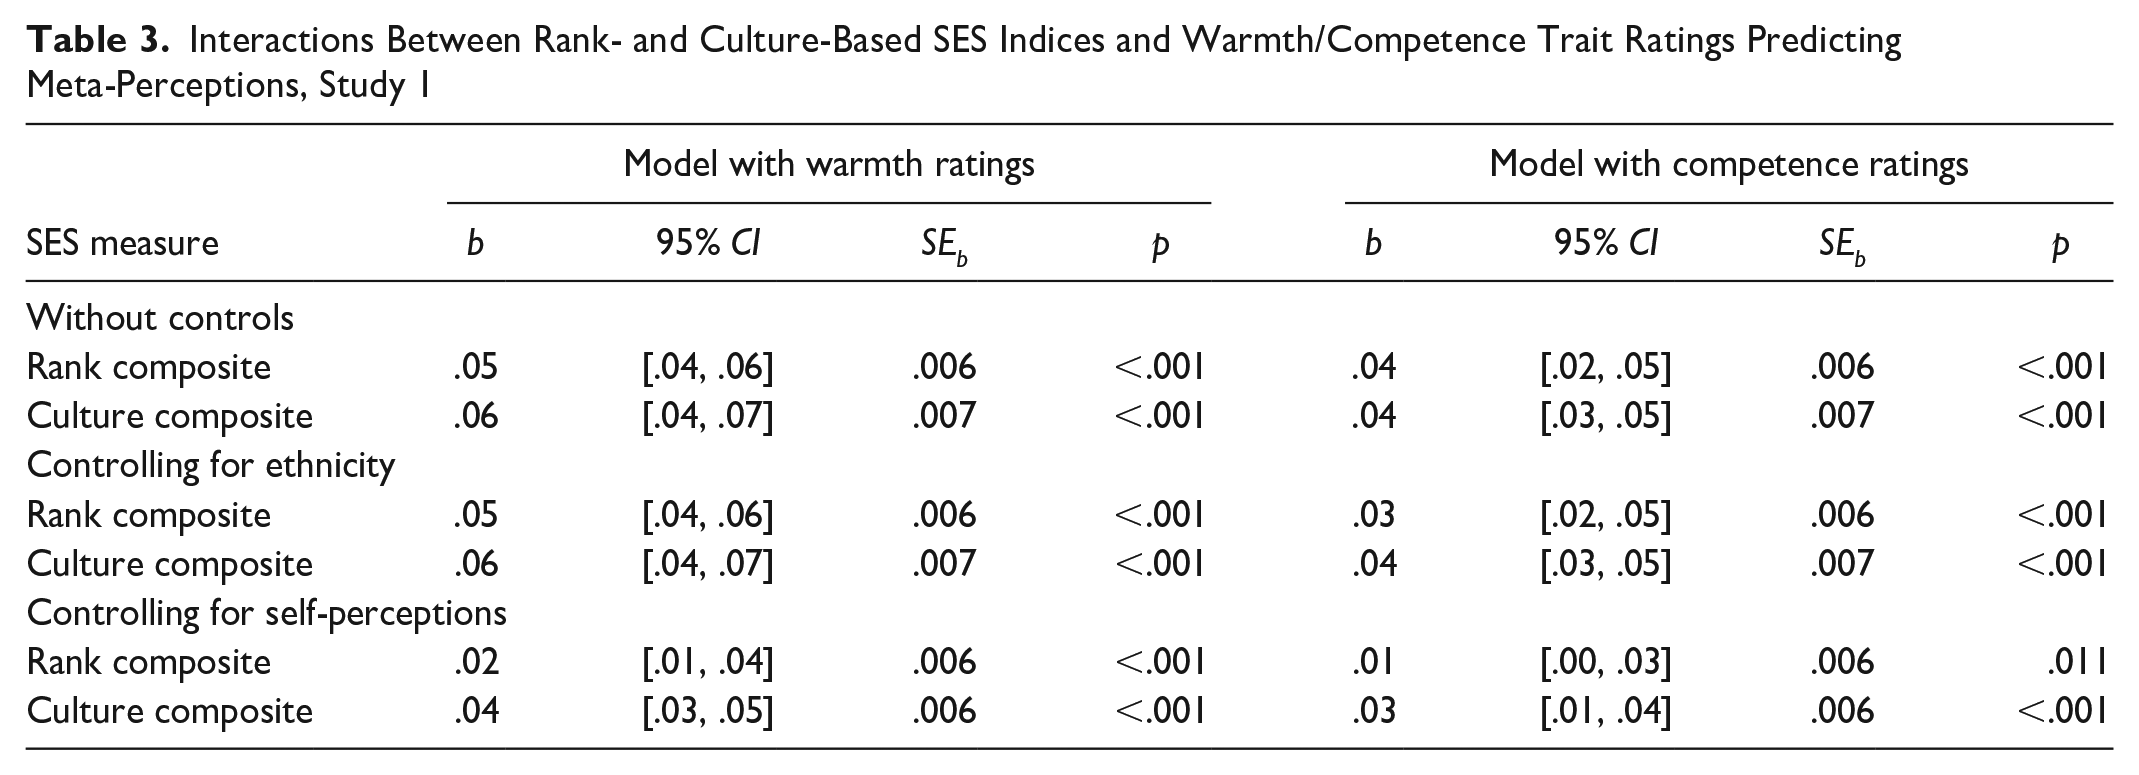
Considering multidimensionality of meta-perceptions, there was no consistent pattern whereby the effects were stronger for warmth or competence. Considering multidimensionality of SES, the weakest predictors of meta-perceptions were the parental education variables. To further compare rank-based and culture-based SES measures, we standardized and averaged measures in each category and ran models testing their interactions with coders’ ratings; see Table 3. Effects were similarly sized and significant for both composites.
Interactions Between Rank- and Culture-Based SES Indices and Warmth/Competence Trait Ratings Predicting Meta-Perceptions, Study 1
Discussion
Participants with lower (vs. higher) SES thought others saw them less positively in terms of both warmth and competence. These effects were independent of ethnicity and remained significant controlling for participants’ self-perceptions. We theorized effects would be stronger when examining links with subjective (vs. objective) SES, but Study 1 contained no subjective SES measure. Exploratory composite rank- and culture-based SES measures yielded similar effects. However, the effect emerged across all rank measures, but only some culture measures, with weaker effects for parental education. We continue tracking these patterns across remaining studies.
Study 2
Study 2 provides a pre-registered (https://osf.io/g93e7?view_only=b877fbd1da394fa2b2fefbbd38ffccd3) test that also examines our theorized mechanisms, self-regard and self-presentation. It includes the classic rank-based subjective SES measure, along with objective measures related to rank (e.g., income) and culture (e.g., education).
Method
Participants
A priori power analyses indicated 300 participants would provide over 80% power to detect both f2 = .03, the expected size of the relationship between SES and meta-perceptions based on our supplemental studies, and indirect effects from a and b links with βs around .2 to .3 (see Fritz & MacKinnon, 2007), the expected size of our mediation effects based on Study S13. We therefore targeted N = 300 and recruited 310 MTurk participants; all had a 95%+ approval rating and had completed under 5,000 MTurk surveys. As pre-registered we excluded participants who failed any of two attention checks (e.g., “Please select 6 if you are paying attention”), n = 21, or who experienced technical problems, n = 1; leaving 288 participants. In all pre-registered studies, we planned to control for gender in case men and women had different meta-perceptions. However, doing so meant excluding non-binary participants. To avoid unnecessarily excluding these participants, and because results are virtually identical with or without this control, we instead present all results not controlling for gender.
Procedure
Participants imagined interacting with strangers and reported their meta-perceptions, self-presentation intentions, demographics, self-regard, and self-perceptions. We randomly assigned demographics to appear either at the beginning or the end of the study; order did not affect results.
Meta-perceptions
Each participant imagined interacting with two different strangers (represented using two White male faces from the Chicago Face Database; Ma et al., 2015). Each stranger had a different setting (party or work meeting), name, and description; see Figure 1.
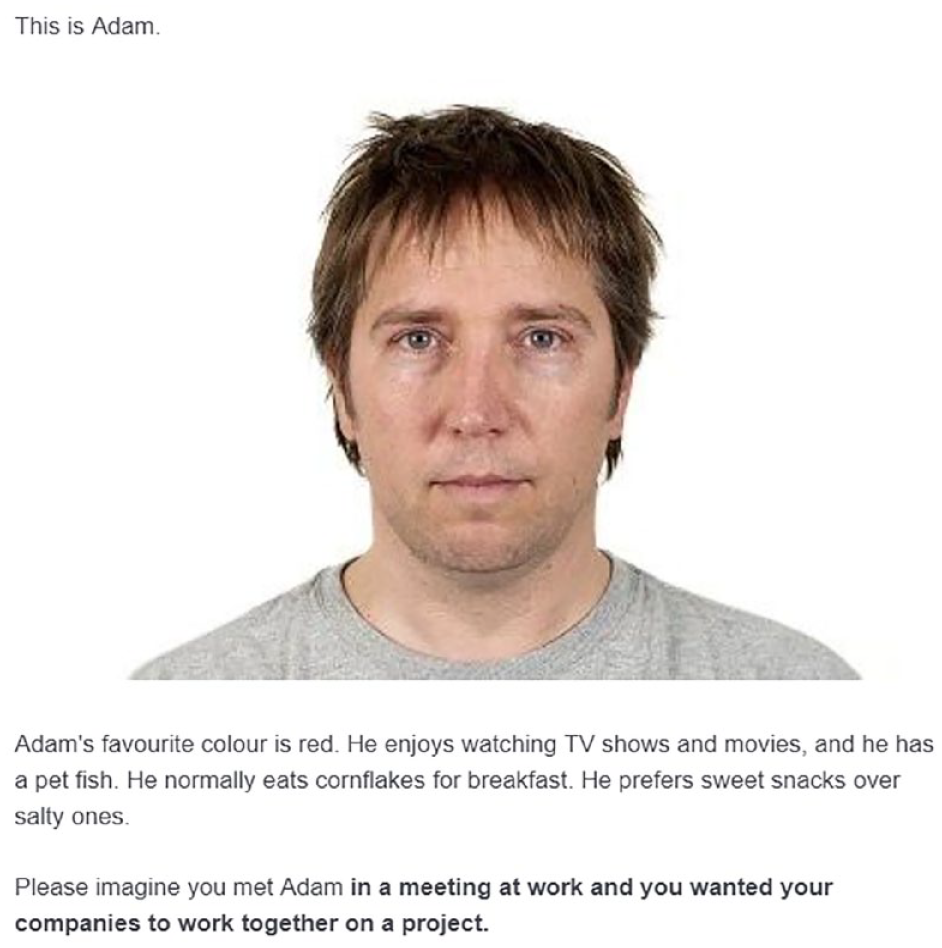
Sample Target Image and Description, Study 2.
Participants reported their meta-perceptions using 12 items: “How ________ would they think you are?” (1 = not at all, 7 = extremely). Eight 1 items measured warmth (e.g., “likable,” “trustworthy”; α = .90) and four competence (e.g., “capable,” “intelligent”; α = .88). Within participants we randomly assigned half of each to appear with each interaction partner. We averaged items across partners.
Self-presentation
Participants reported their self-presentation expectations for each partner on two items we created (not a validated scale): “How hard would you try to convey a good impression to [partner] in this situation?” (1 = not try at all, 7 = try very hard); “If you did try hard to convey a good impression, how successful do you think you would be?” (1 = I probably wouldn’t be able to convey a good impression, 7 = I would definitely be able to convey a good impression). We averaged items across partners, α = .70.
Self-regard
Participants reported two facets of self-regard: self-esteem (Rosenberg, 1965) and narcissism (Ames et al., 2006). We summed standardized scores across both measures.
SES
We pre-registered the ladder measure, which captures rank, as one primary SES measure; this measure is subjective, so we expected it to show a strong effect. We also pre-registered a second primary SES measure capturing cultural context: childhood income (measured as in Study 1). Additional exploratory measures assessed current rank (personal income, total household income) and cultural context (education, parents’ education).
Results
SES—Meta-Perceptions Link
As pre-registered, we ran a multilevel regression analysis predicting meta-perceptions from SES (centered), meta-perception dimension (1 = warmth, –1 = competence), their interaction, and random intercepts for participants (see Table 4). 2 Of our two primary measures, only the ladder showed the predicted effect: Overall, and for warmth and competence specifically, participants who felt lower (vs. higher) status expected a stranger to see them more negatively. Unlike in Study 1, participants expected to be seen similarly regardless of childhood income.
SES Predicting Meta-Perceptions, Study 2.
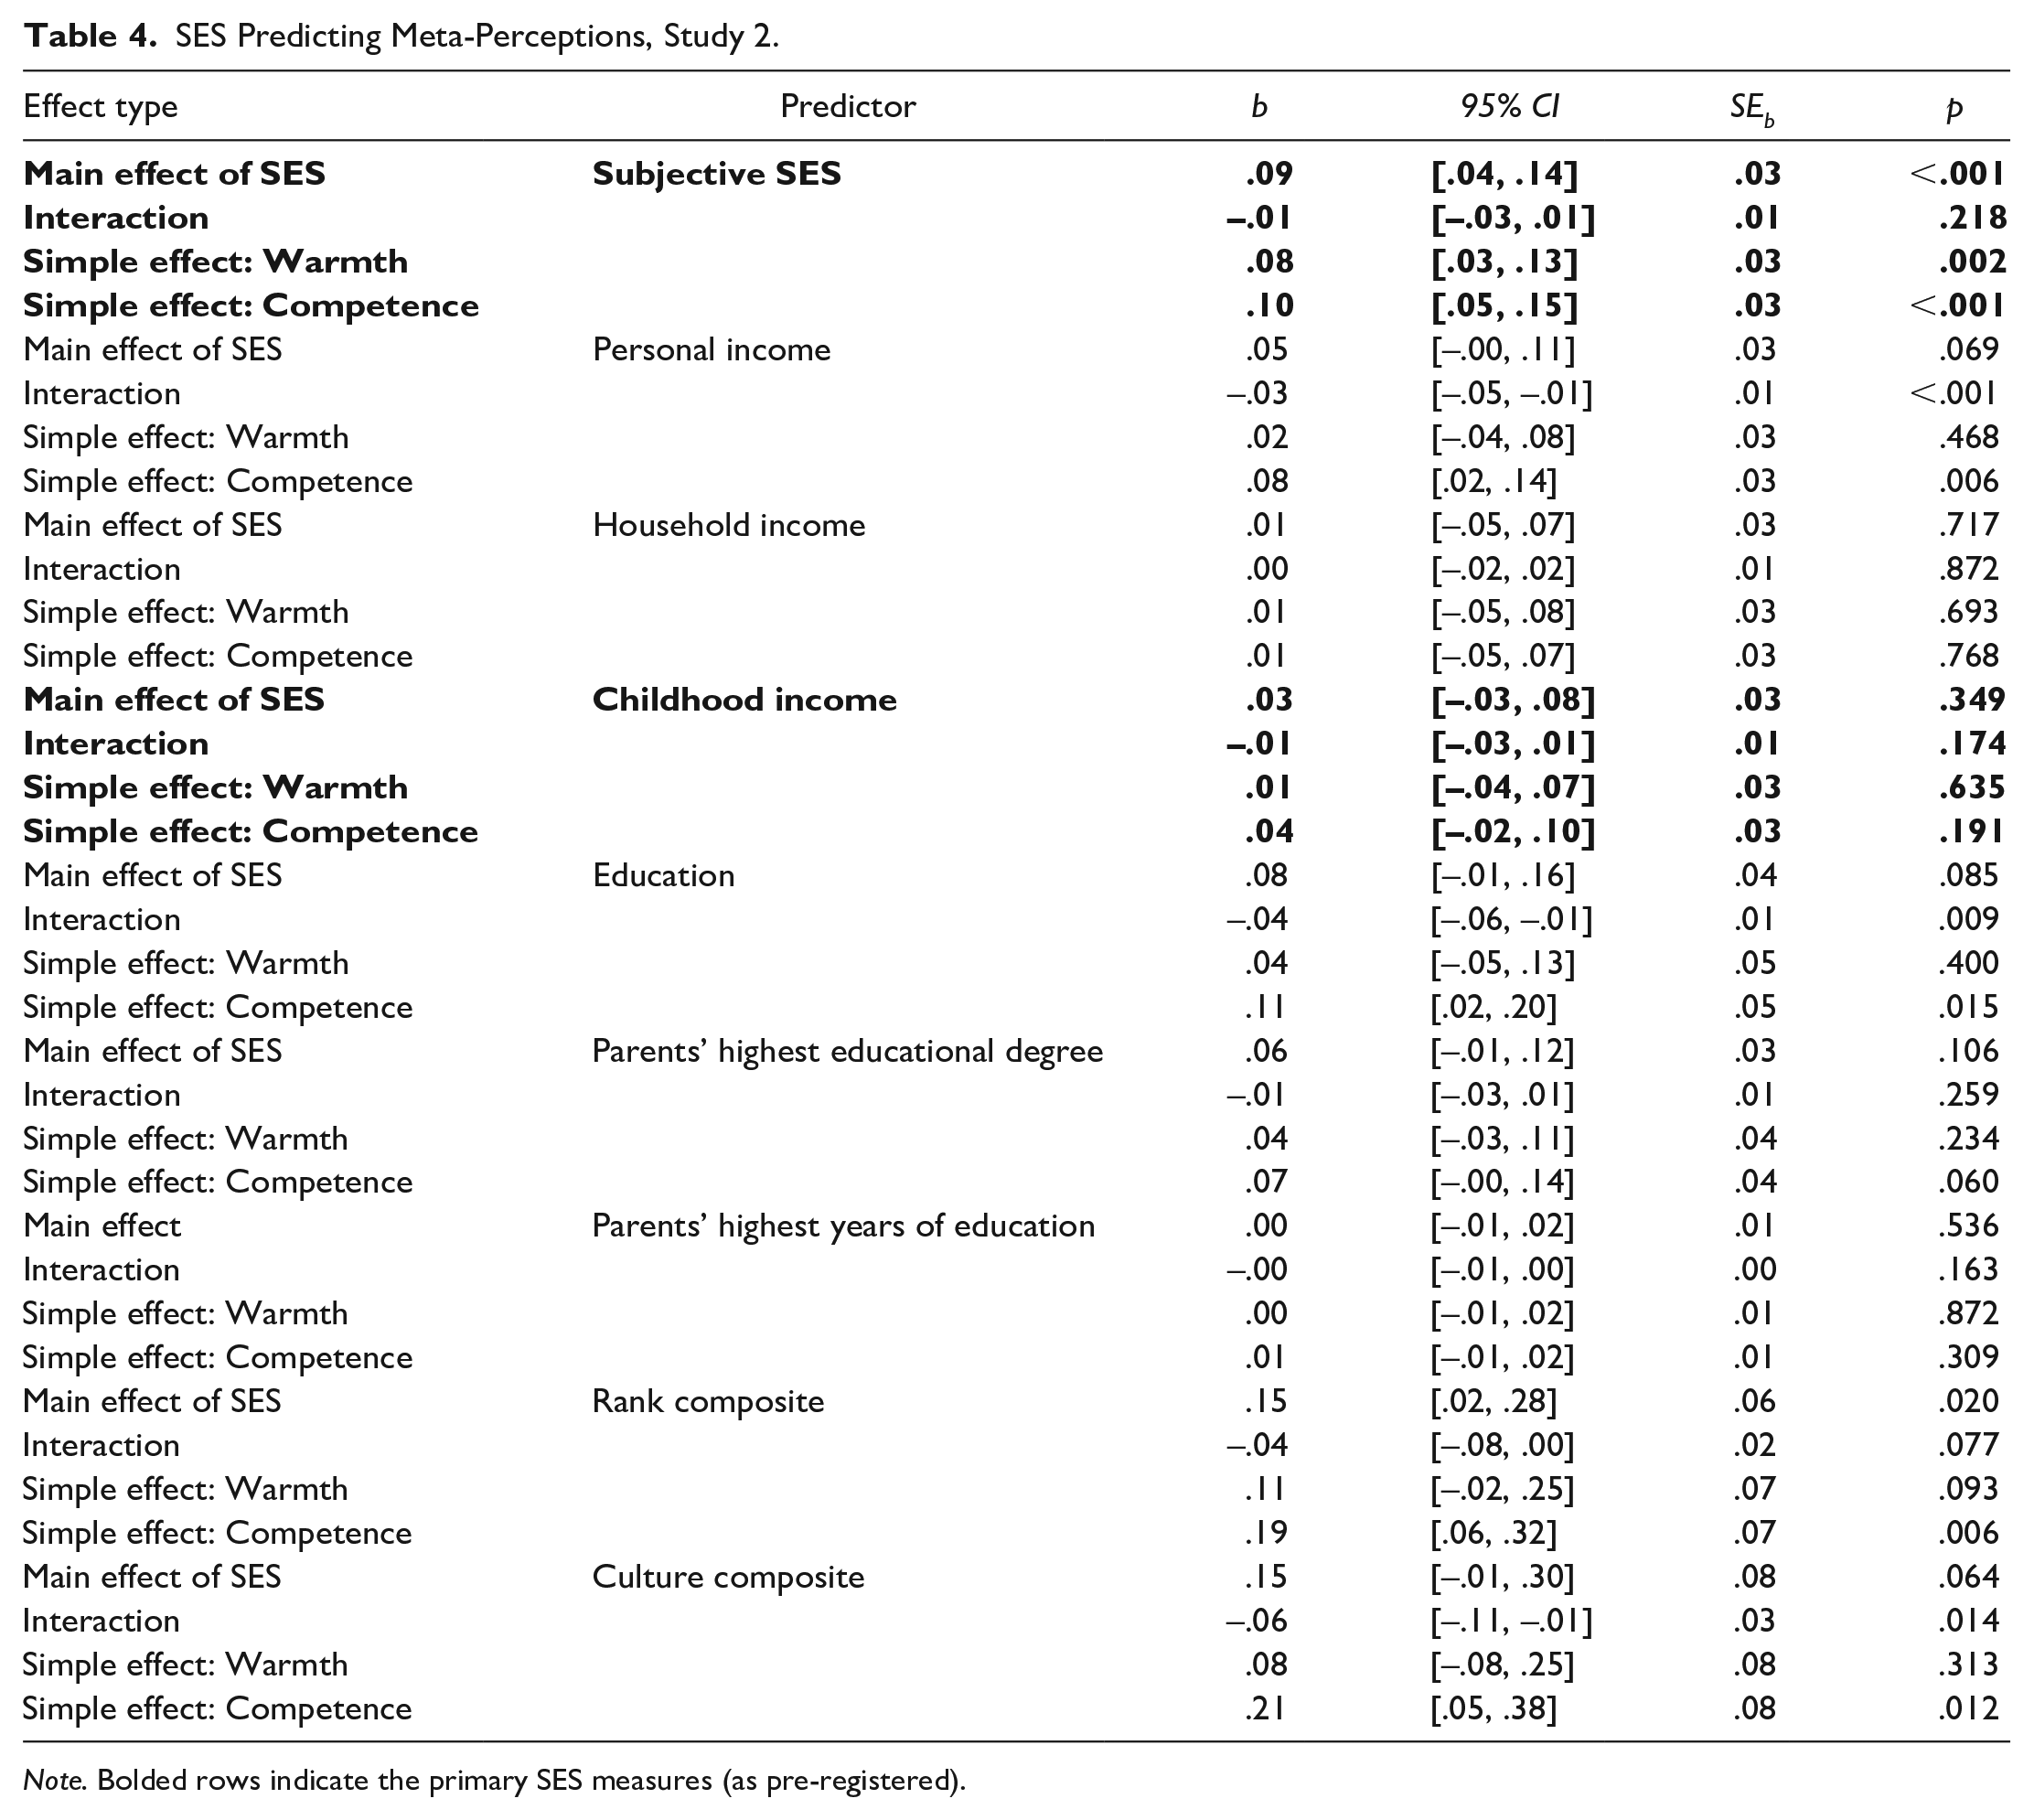
Note. Bolded rows indicate the primary SES measures (as pre-registered).
We found no main effects of any exploratory SES measures. Instead in two of five cases, we found significant interactions: People with more (vs. less) personal income and education expected to be seen as more competent, but equally warm.
Regarding multidimensionality, unlike Study 1, effects were stronger for competence than warmth. However, when we examined the rank and culture composites, rank showed a main effect with no interaction: People with higher (vs. lower) rank expected others to see them more positively. Conversely, culture showed an interaction with no main effect: People with higher (vs. lower) SES cultural backgrounds expected others to see them as more competent, but not warmer. However, the simple effects of these measures showed similar patterns, so we hesitate to overinterpret the difference.
Mechanisms: Self-Regard and Self-Presentation
Using the PROCESS macro in SPSS (Hayes, 2018), we ran pre-registered parallel mediation models testing independent indirect effects from SES through self-regard and self-presentation predicting meta-perceptions; see Table 5.
Standardized Indirect Effects [95% CIs] From Models Testing Self-Regard and Self-Presentation as Parallel Mediators of the Relationship Between SES and Meta-Perceptions, Study 2.
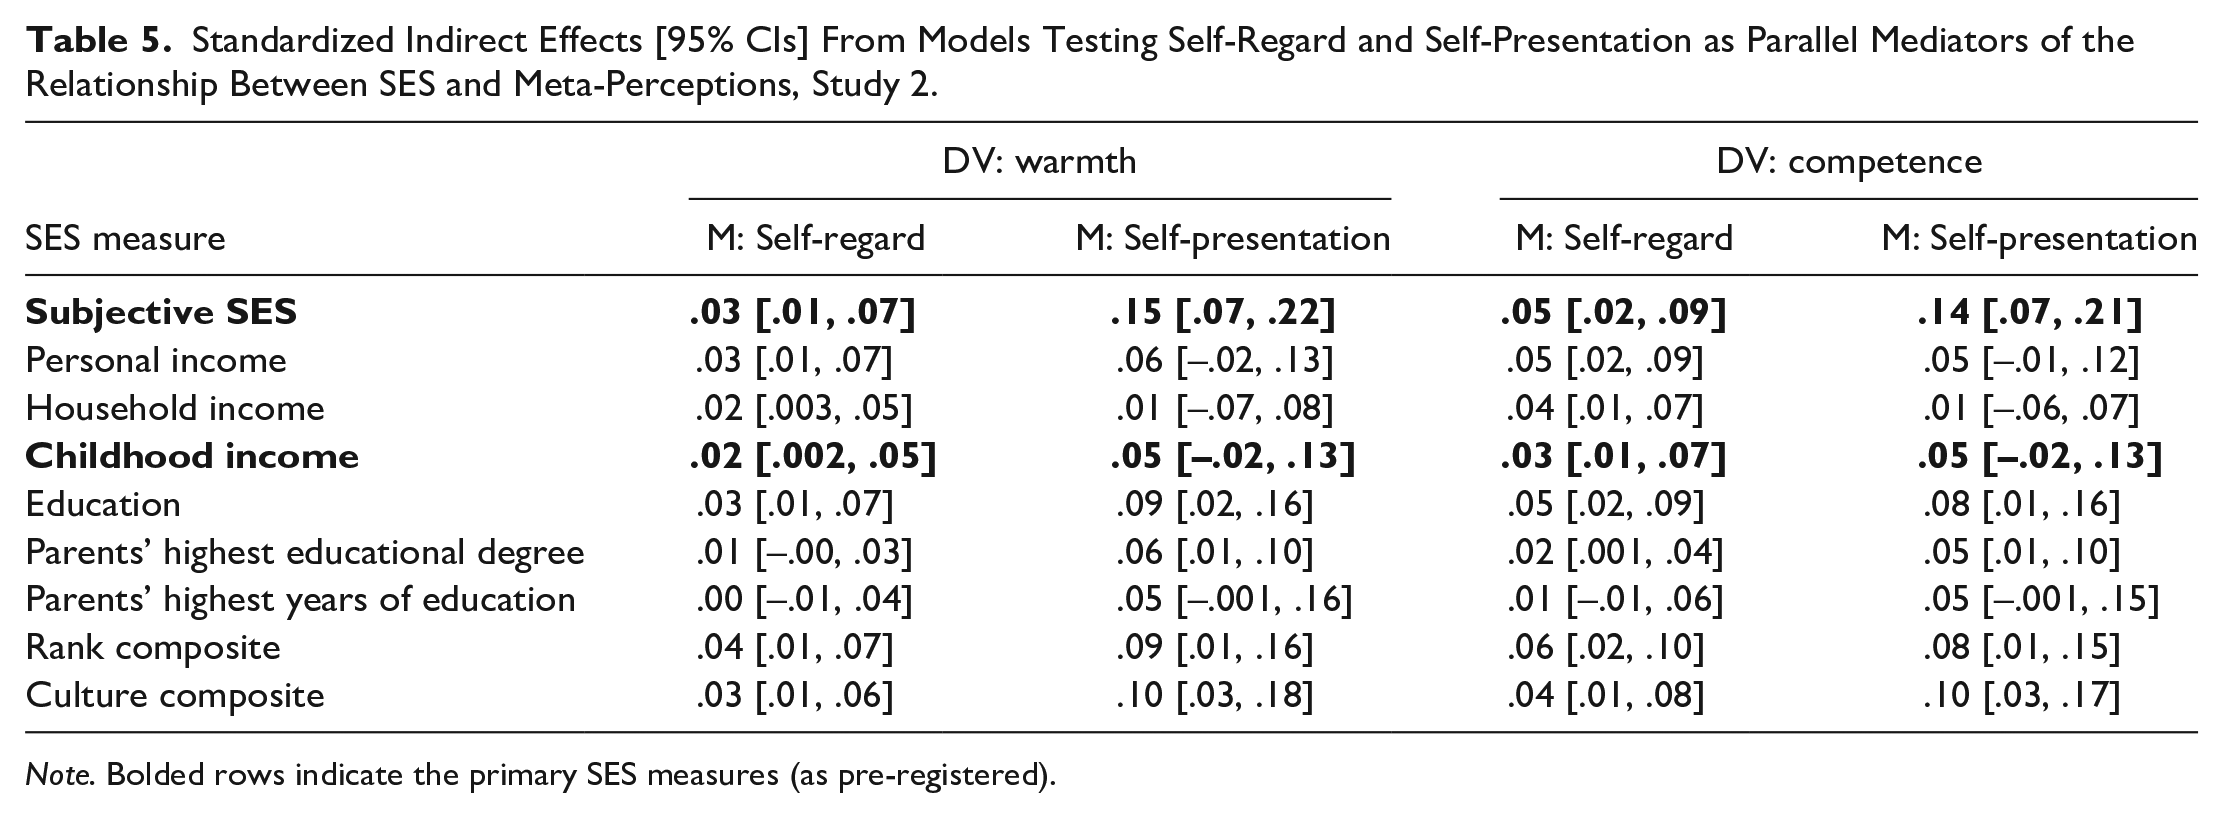
Note. Bolded rows indicate the primary SES measures (as pre-registered).
Overall, 25 of the 36 indirect effects we tested were significant, and we could discern no pattern differentiating rank- from culture-based measures: Even comparing the composite measures, the indirect effects were similarly sized (see also Figure 2). Similar results emerged using separate rather than parallel mediation models; see SOM.
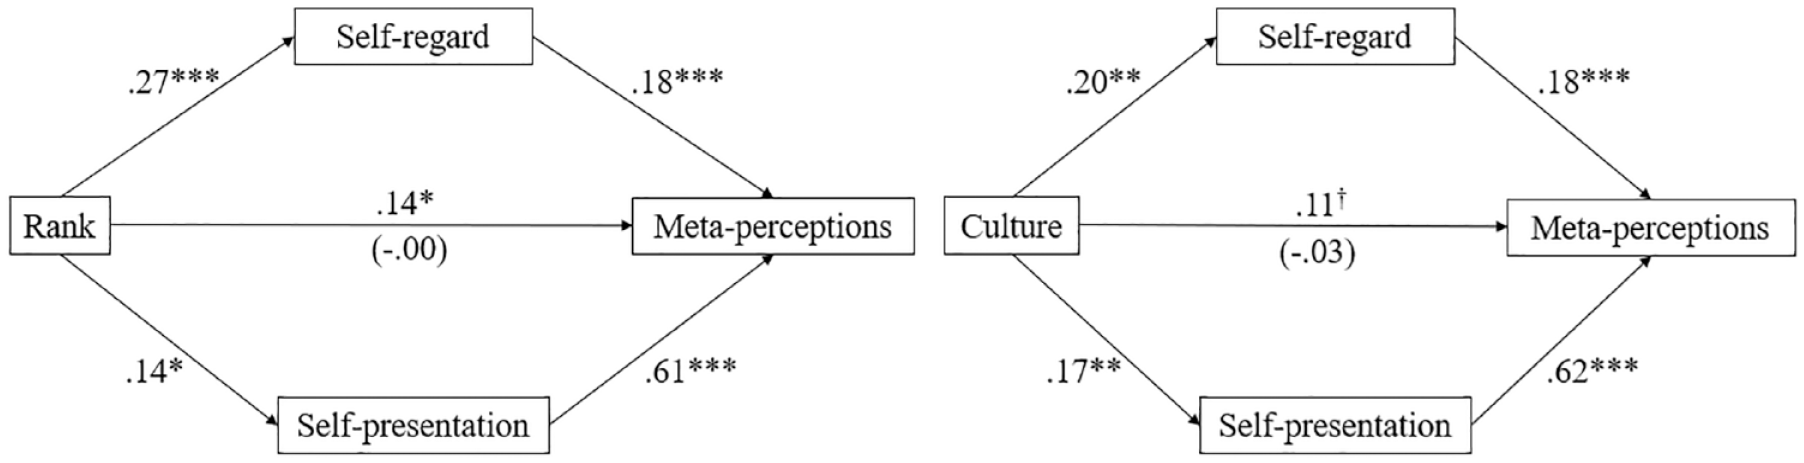
Mediation Models Predicting Overall Meta-Perception Positivity (Mean of Warmth and Competence) With Rank (Left) and Culture (Right) Through Self-Regard and Self-Presentation.
However, the mediators’ facets were less strongly correlated than expected. In fact, self-esteem and narcissism were weakly negatively correlated (see Table 6). We therefore also ran models testing mediation through each facet of each mediator; see SOM. For self-presentation, anticipated success was a stronger mediator than effort. For self-regard, it depended on the dimension of meta-perceptions: narcissism was a stronger mediator of the effect on the competence dimension, but for warmth the composite more strongly mediated the effect than either facet alone. Our speculative interpretation for this latter finding is that, while much differs between self-esteem and narcissism, what they share (i.e., positive self-regard) may be the critical ingredient.
Correlations Between Mediators and Facets of Those Mediators.
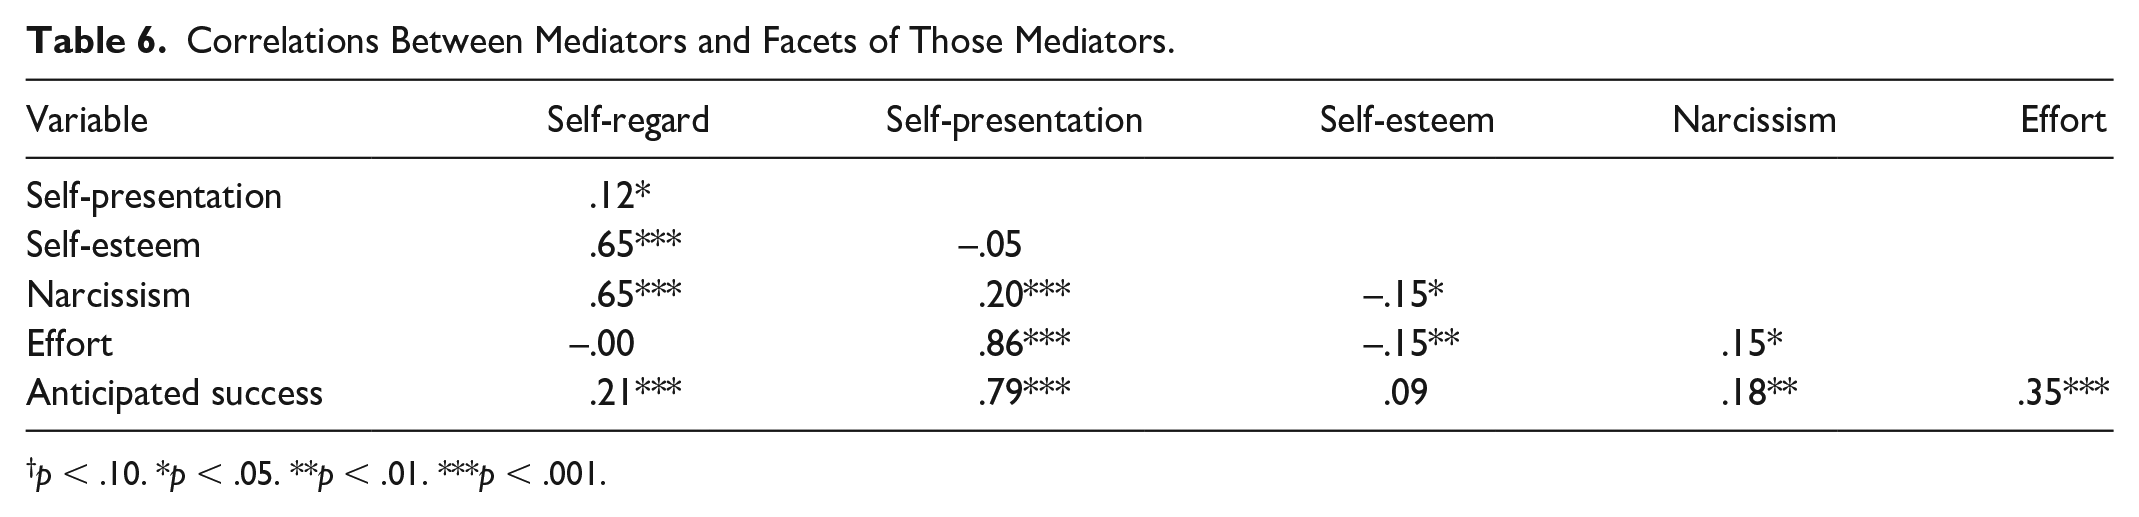
p < .10. *p < .05. **p < .01. ***p < .001.
Discussion
In Study 2, higher SES again predicted more positive meta-perceptions. Study 2 also found evidence for why: People with low SES think less of themselves and of their self-presentation abilities, both of which statistically mediated the relationship between SES and meta-perceptions. Similar mediation patterns emerged in a pre-registered replication (Study S13; see SOM).
However, Study 2 revealed more variation than Study 1 across dimensions of meta-perceptions and of SES. The overall effect emerged only with the subjective ladder measure and the exploratory rank composite. The other measures had no consistent effect (some predicted competence but not warmth meta-perceptions; others predicted neither).
In other words, Studies 1 and 2 revealed inconsistencies both between and within studies. To address these, before examining the consequences of meta-perceptions in Study 3, we report internal meta-analyses of the link between SES and meta-perceptions.
Internal Meta-Analyses: SES–Meta-Perception Link
These meta-analyses include Studies 1 to 3 as well as 14 supplemental studies. Some of these were studies where we tried (unsuccessfully) to manipulate SES; others were smaller-sampled pilot studies used to test predictions not relevant to this article. These studies are all fully described in the SOM. The meta-analyses consider all SES measures; Table 7 provides study-level sample sizes and results for the ladder measure only, because we consistently pre-registered it as primary. The SOM reports results for other individual SES measures.
All Studies Included in the Meta-Analyses of the Relationships Between SES and Meta-Perceptions, and the Standardized Effect Size in Each Study.
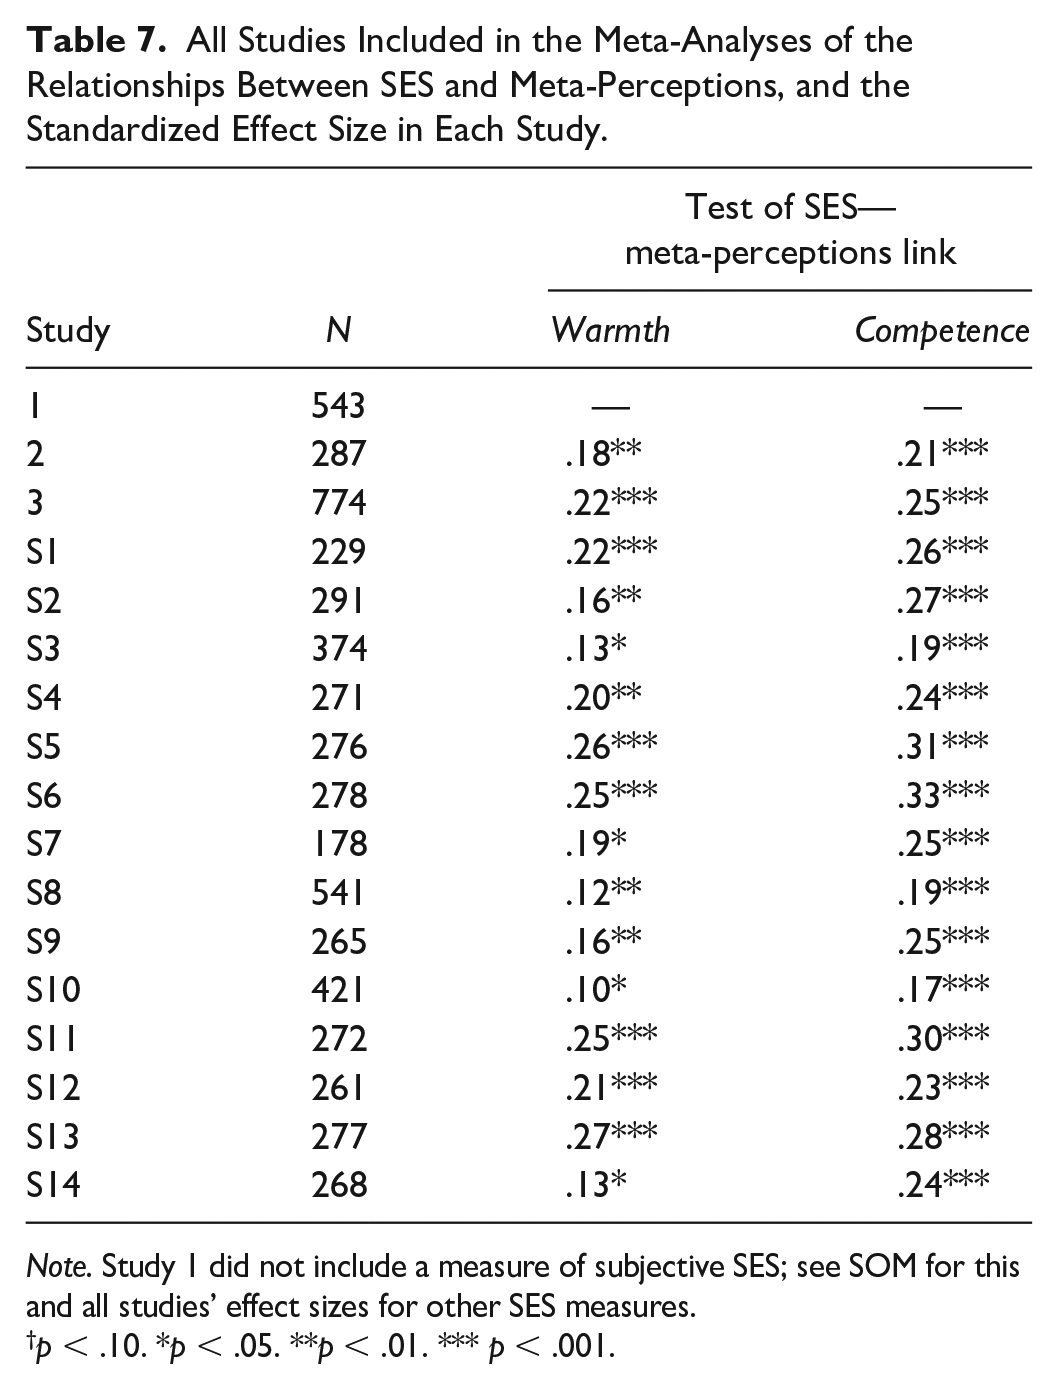
Note. Study 1 did not include a measure of subjective SES; see SOM for this and all studies’ effect sizes for other SES measures.
p < .10. *p < .05. **p < .01. *** p < .001.
Results
For each study and each SES measure (including the rank and culture composites, constituted of all available relevant measures in each study), we extracted the standardized regression coefficient and standard error linking SES with meta-perceptions, separately for warmth and competence, and meta-analyzed them using the metafor package (Viechtbauer, 2015); see Figure 3 (and SOM for full results). Study 1 did not directly measure warmth and competence meta-perceptions; the closest effects to extract were the simple effects of SES on meta-perceptions on traits rated high (+1 SD) in warmth and competence. Because of this difference, we conducted analyses both including and excluding Study 1.
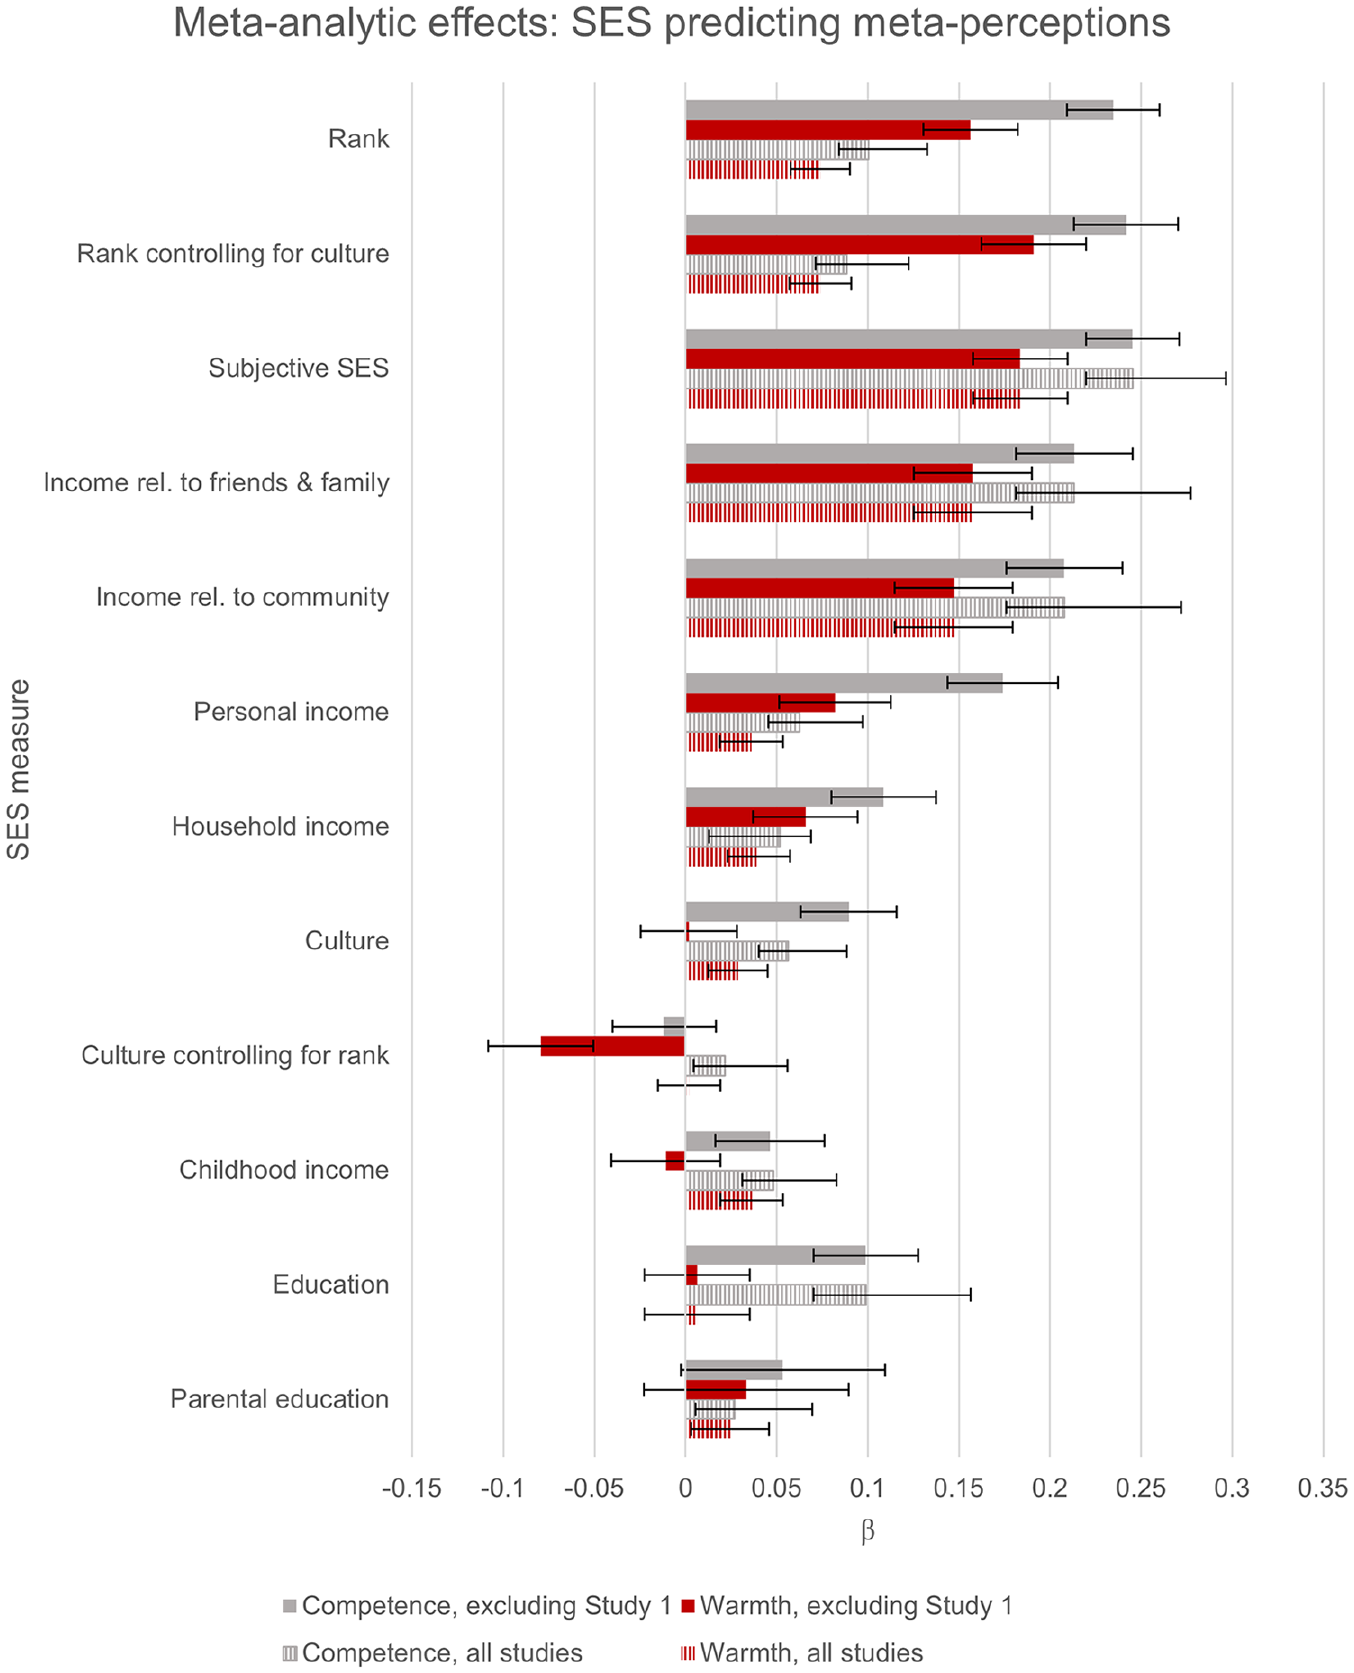
Meta-Analytic Effect Sizes for SES Predicting Meta-Perceptions.
Participants with lower current rank (subjective SES; relative, personal, and household income) expected to be seen as less warm and competent. In contrast, participants from lower-class cultural contexts (childhood income; personal and parental education) did not consistently expect to be seen as less warm, and though they expected to be seen as less competent, the effect size was often smaller than that for rank.
This same picture also emerged from our analyses of the exploratory rank and culture composites: Current rank was overall a stronger predictor of meta-perceptions, and cultural background consistently predicted only competence meta-perceptions (and less strongly than rank). When both composites were entered as simultaneous predictors, the largest effect of cultural background was negatively predicting warmth meta-perceptions.
The results with and without Study 1 highlight that Study 1 found stronger effects for culture than the other studies. This could be because it was the only one that involved live interactions in a university context, where culture and fit may be particularly important in determining how students believe others see them (Phillips et al., 2020; Stephens et al., 2012). We did not measure belongingness or sense of fit, so this remains highly speculative.
Only one additional study beyond Study 2 tested for mediation through our hypothesized mechanisms: Study S13 (see SOM; methods and results were very similar). To meta-analyze across these two studies, we extracted the correlation matrix in each study between SES, meta-perceptions, self-regard, and self-presentation. We then used the metaSEM package in R (Cheung, 2015) to pool these correlations and run meta-analytic structural equation models on the pooled matrix testing our mediation model (SES predicting meta-perceptions, mediated by self-regard and self-presentation). We ran each model separately for warmth and competence; see Table 8.
Meta-Analysis Over Study 2 and Study S13 of the Effect of SES on Warmth (W) and Competence (C) Meta-Perceptions Through Self-Regard (SR) and Self-Presentation (SP).
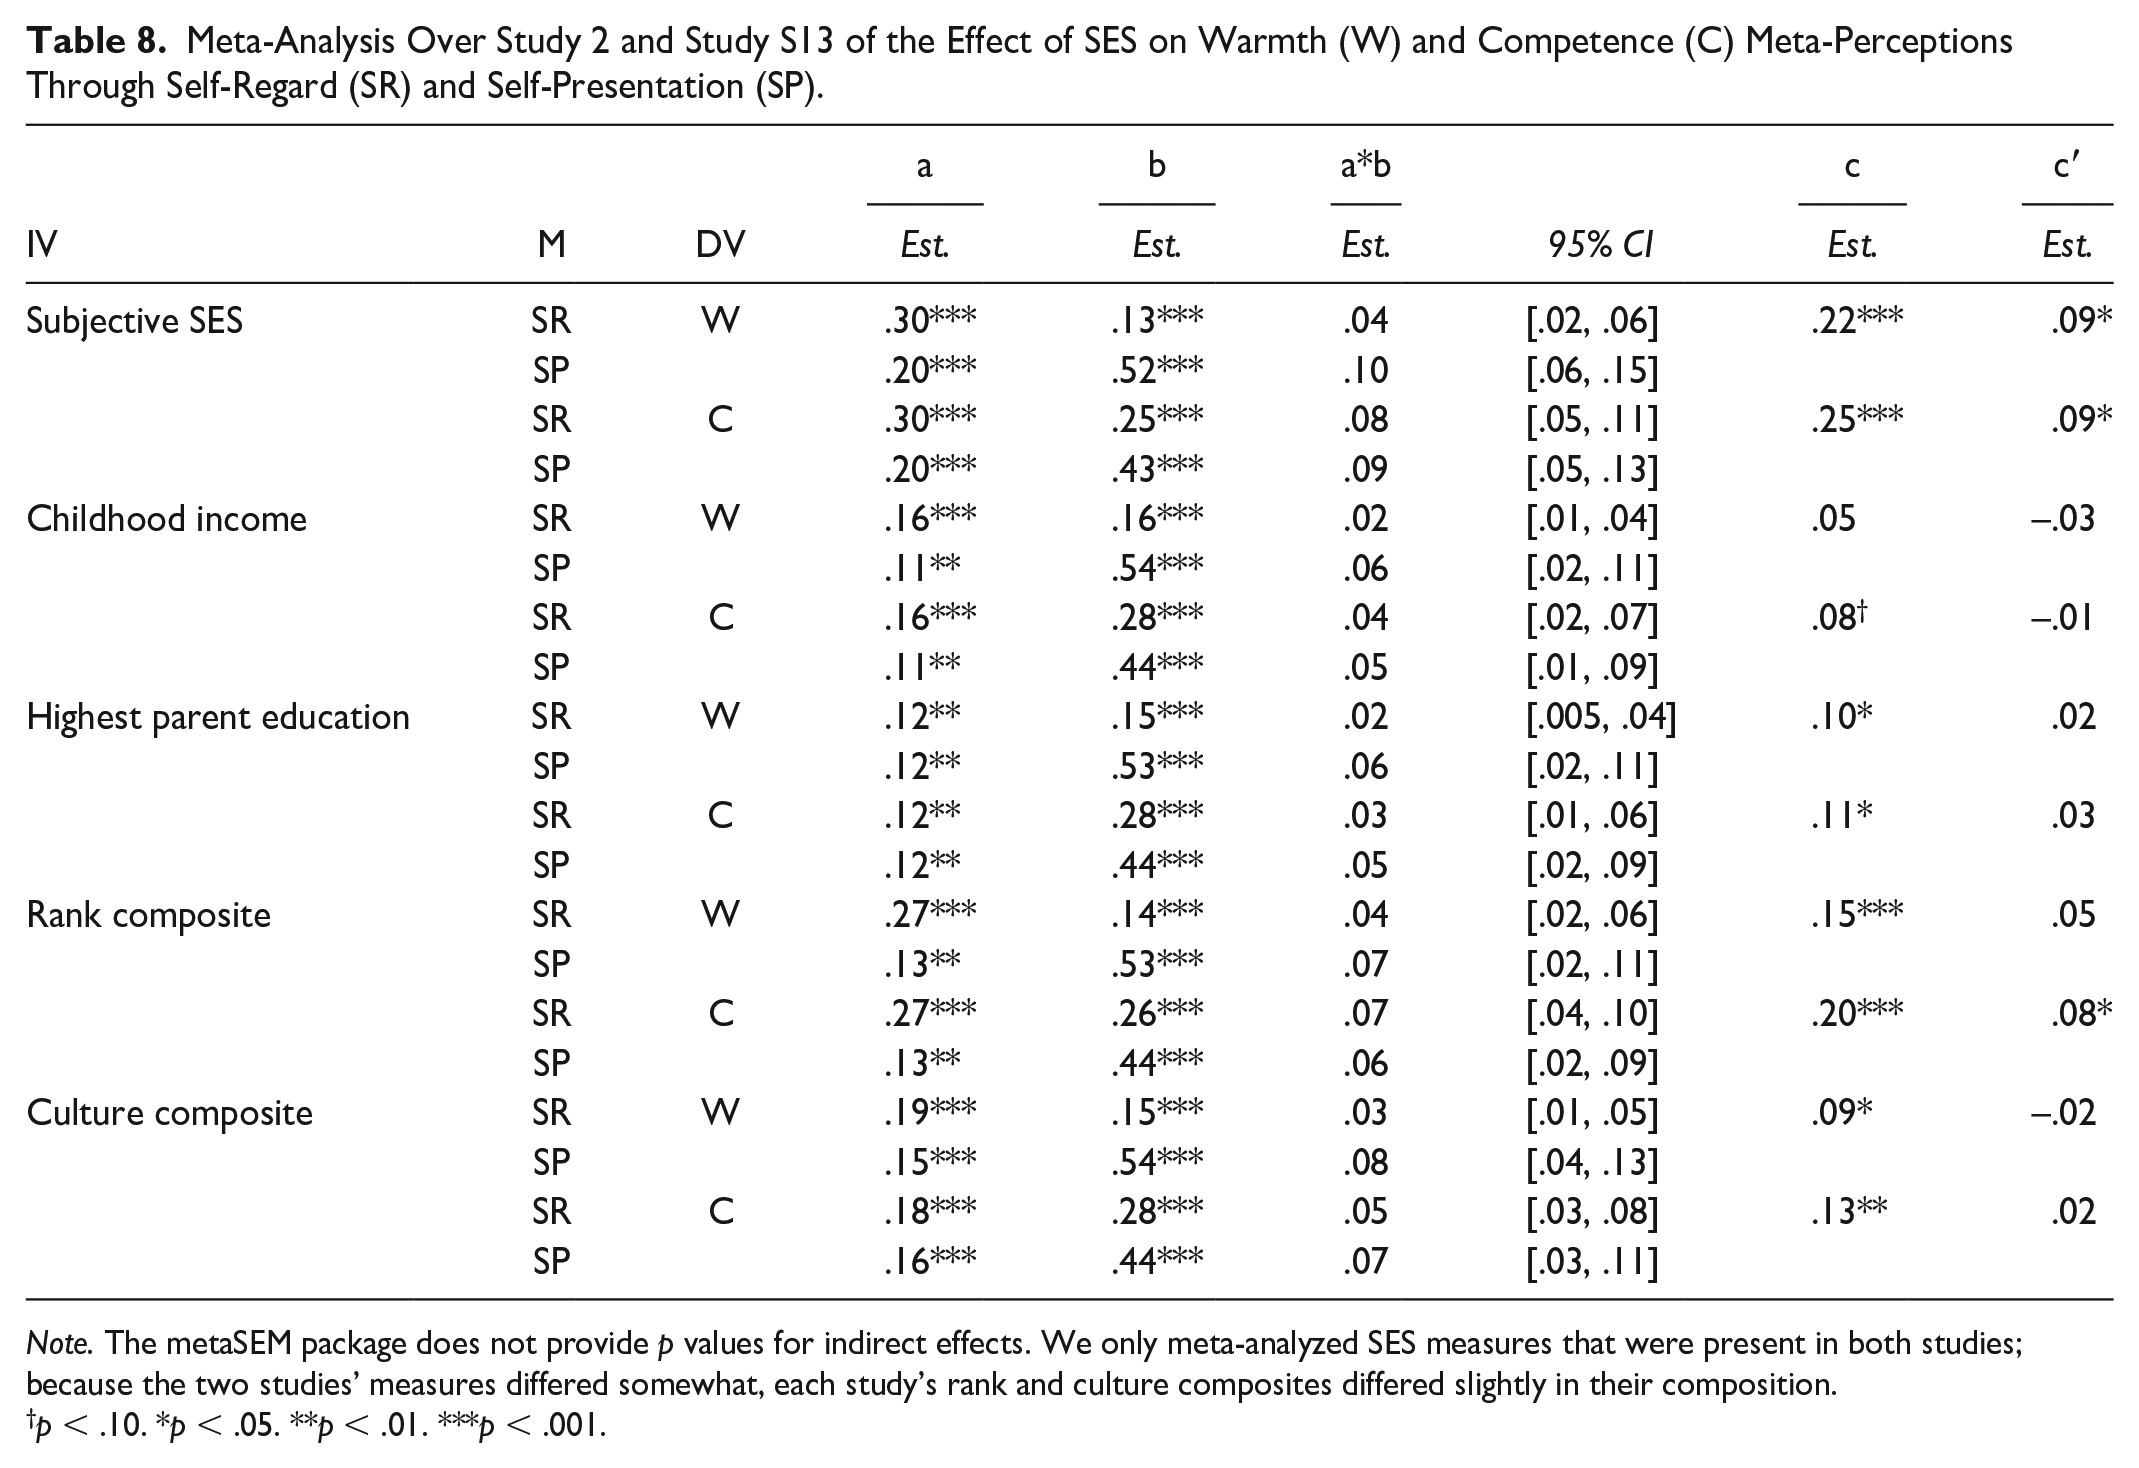
Note. The metaSEM package does not provide p values for indirect effects. We only meta-analyzed SES measures that were present in both studies; because the two studies’ measures differed somewhat, each study’s rank and culture composites differed slightly in their composition.
p < .10. *p < .05. **p < .01. ***p < .001.
Results were consistent across SES measures and meta-perception dimensions: In every model, SES was positively related to both self-presentation and self-regard, which were both independently positively related to meta-perceptions. All indirect effects were significant.
Discussion
These internal meta-analyses showed that people with low (vs. high) rank consistently had more negative competence and warmth meta-perceptions, but that people from lower-(vs. higher-) SES cultural contexts only had (somewhat) more negative competence meta-perceptions. We observed this rank versus culture difference on every individual measure as well as in composite measures. Moreover, the meta-perception effects were mediated by self-regard and self-presentation.
Partner Perceptions and Accuracy
In Study 1 (but no other study), we also measured how people were actually perceived by others, allowing us to evaluate SES differences in these perceptions and in meta-perception accuracy. Meta-perception accuracy offers important context for interpreting differences in meta-perceptions. For example, the accuracy of a person’s positive meta-perceptions may determine whether the consequences of flirting with a friend, or asking for a raise, are desirable or disastrous. We explain these analyses in full in the SOM and summarize the results here. First, people were perceived as equally warm and competent regardless of their SES (see Table S9 in SOM). Second, people with low, compared with high, SES had less accurate meta-perceptions (see Table S8 in SOM). In other words, though people with lower SES expected others to view them negatively, in fact, others saw them equally positively as those with higher SES. Moreover, their (more negative) expectations were worse predictors of how others actually saw them, compared with high SES people’s (more positive) expectations. Together, these findings indicate people with low SES had overly pessimistic meta-perceptions.
Study 3
These internal meta-analyses establish a clear pattern linking SES, and specifically rank more so than culture, to meta-perceptions. We pre-registered Study 3 (https://osf.io/v9mtn?view_only=267fca9d9b49499ca5b5ac8acf026f5e) to test how this might predict attributions for interpersonal failure. When a person with lower SES is rejected, that should match their expectations, so they might blame themselves for the rejection. In contrast, when a person with higher SES is rejected, this should clash with their expectations, so they might blame external factors instead. Participants chatted with a partner who subsequently chose to end their relationship; we predicted SES differences in attributions regardless of whether the rejection was based on warmth or competence (manipulated between subjects). We tested this using similar paradigms with similar results in Studies S3 to S9, and a different paradigm again with similar results in Study S10. After Study 3, a second internal meta-analysis examines attributions across all studies.
Method
Participants
We collected data from 1,381 MTurk participants using the same eligibility criteria as Study 2. After excluding participants who failed our attention check, n = 317, 1064 participants remained (see Table 1); we included all these participants in analyses testing the SES—meta-perception links. For analyses involving attributions for interpersonal failure, as pre-registered, we further excluded participants who expressed suspicion, n = 31, did not chat with a partner, n = 252 (a high number because participants could only chat if they arrived at that portion of the study within a few seconds of another participant), or did not complete the attribution measures, n = 10, leaving us with 778 usable participants for these analyses (some exclusions were overlapping). This was slightly below our target sample of 800 (derived from Fritz and MacKinnon [2007]’s simulations, seeking to exceed their recommended sample to obtain 80% power to detect a and b links of around β = .2, estimated from our pilot studies’ results), but technical issues made it impossible for us to recruit the 22 missing participants: Participants were paired based on arriving to the chat at approximately the same time; this would require an extraordinary coincidence if we sought so few additional participants.
Procedure
Participants reported demographics, including all SES measures from Study 2 except parental education, along with two new subjective rank measures (adapted from Ostrove & Long, 2007): “How does your income compare to the average income of your friends and family?,” and “How does your income compare to the average income of your community?” (1 = my income is much lower, 7 = my income is much higher). We pre-registered the ladder measure as primary. Participants also reported self-esteem.
Participants then learned they would chat with another participant via instant messaging and rated how they expected their partner would perceive them (i.e., their anticipatory meta-perceptions). Participants learned the first chat would be followed by a second one with the same partner unless one of them preferred to meet a new partner instead.
After the initial 4-min chat, participants rated how they thought their partner did perceive them (i.e., their post-interaction meta-perceptions) using the same items, then indicated whether they wanted to remain with the same partner. (We pre-registered anticipatory meta-perceptions as our primary measure; these post-interaction meta-perceptions yield similar results, see SOM.) They then received negative feedback: Their partner had chosen to meet a new partner for the second chat. In the competence condition, participants had learned that this second chat would involve a problem-solving task, so being rejected implied their partner doubted their competence. In the warmth condition, participants learned only that it would be a second conversation, so being rejected implied the conversation partner doubted their warmth. Pilot testing (see SOM) verified that participants viewed rejection as intended in each condition.
Participants completed two measures of attributions for this feedback. The first was task-specific: They indicated how plausible four internal and four external attributions were for the rejection (see Table 9). We averaged across items to create composites for each attribution type; some reliabilities were low (see Table 9), but exploratory analyses using individual items found similar (though generally nonsignificant) results (see SOM). The second was a validated general attribution measure: They rated three items about the locus of causality for the rejection (McAuley et al., 1992), e.g., [were you rejected because of something] “1 = Inside of you”–“7 = Outside of you” (α = .87). We pre-registered the task-specific measure as primary and the general measure as secondary.
Items Measuring Task-Specific Attributions, Study 3.
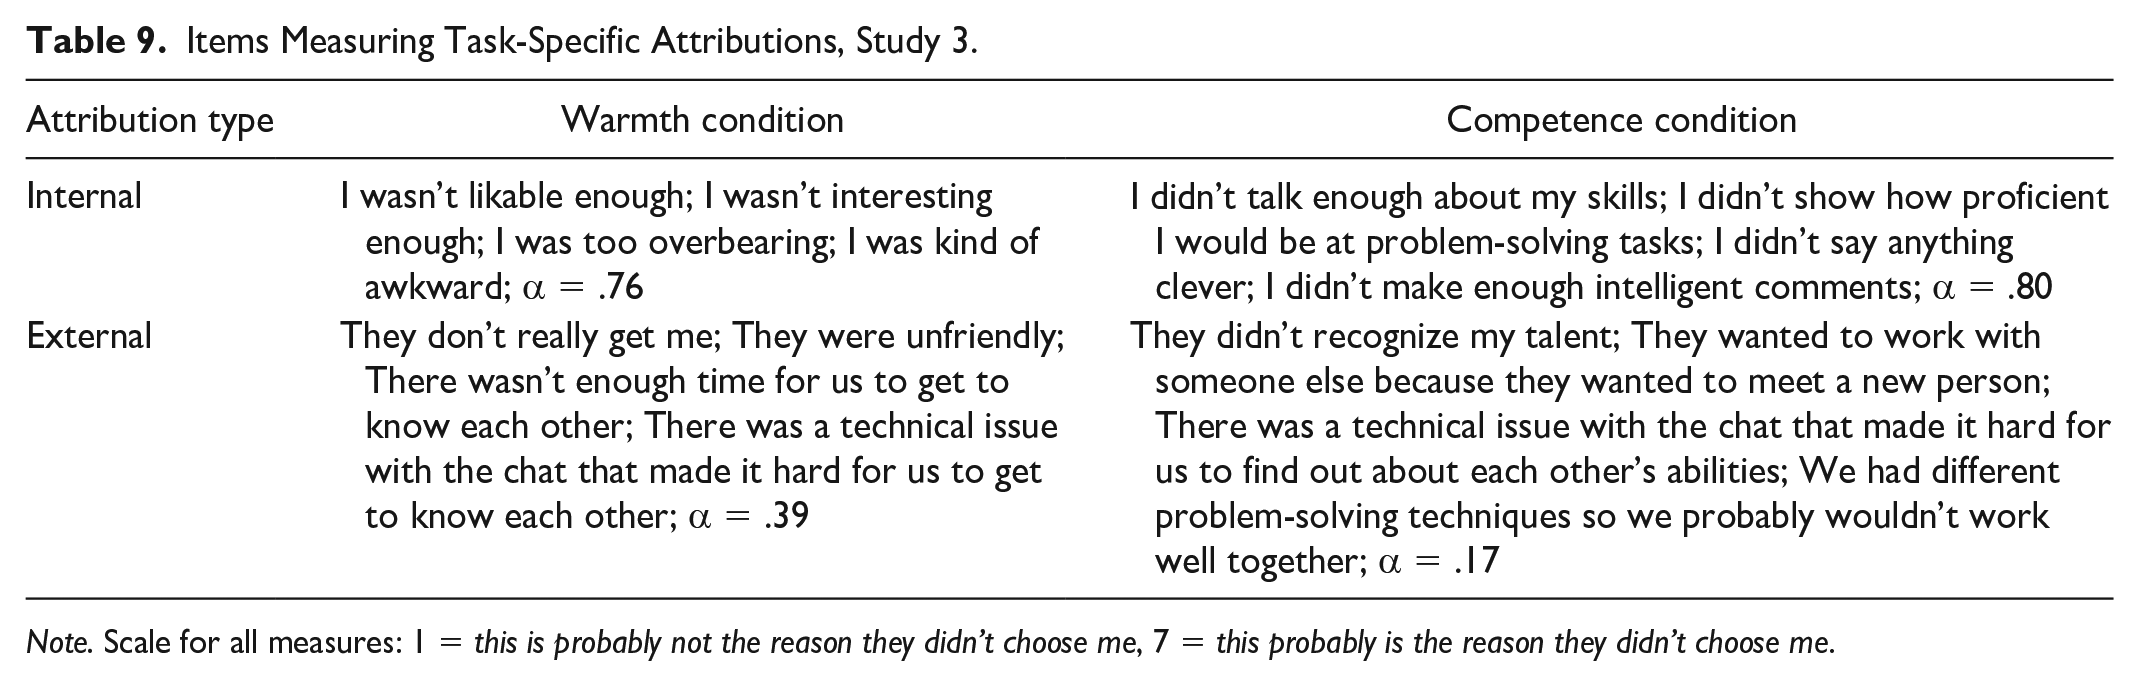
Note. Scale for all measures: 1 = this is probably not the reason they didn’t choose me, 7 = this probably is the reason they didn’t choose me.
Results
SES—Meta-Perceptions Link
As pre-registered, we ran the same analyses as in Study 2 predicting anticipatory meta-perceptions (see Table 10). Consistent with the meta-analyses, all rank-based SES measures showed that participants with higher (vs. lower) rank expected their partners to see them more positively overall, and specifically as warmer and more competent. This effect was consistently stronger for competence than warmth. Culture-based SES measures showed weaker and less consistent main effects, but consistent interactions: These measures predicted expecting to be seen as more competent, but not generally as warmer.
SES Predicting Expected Meta-Perceptions, Study 3.
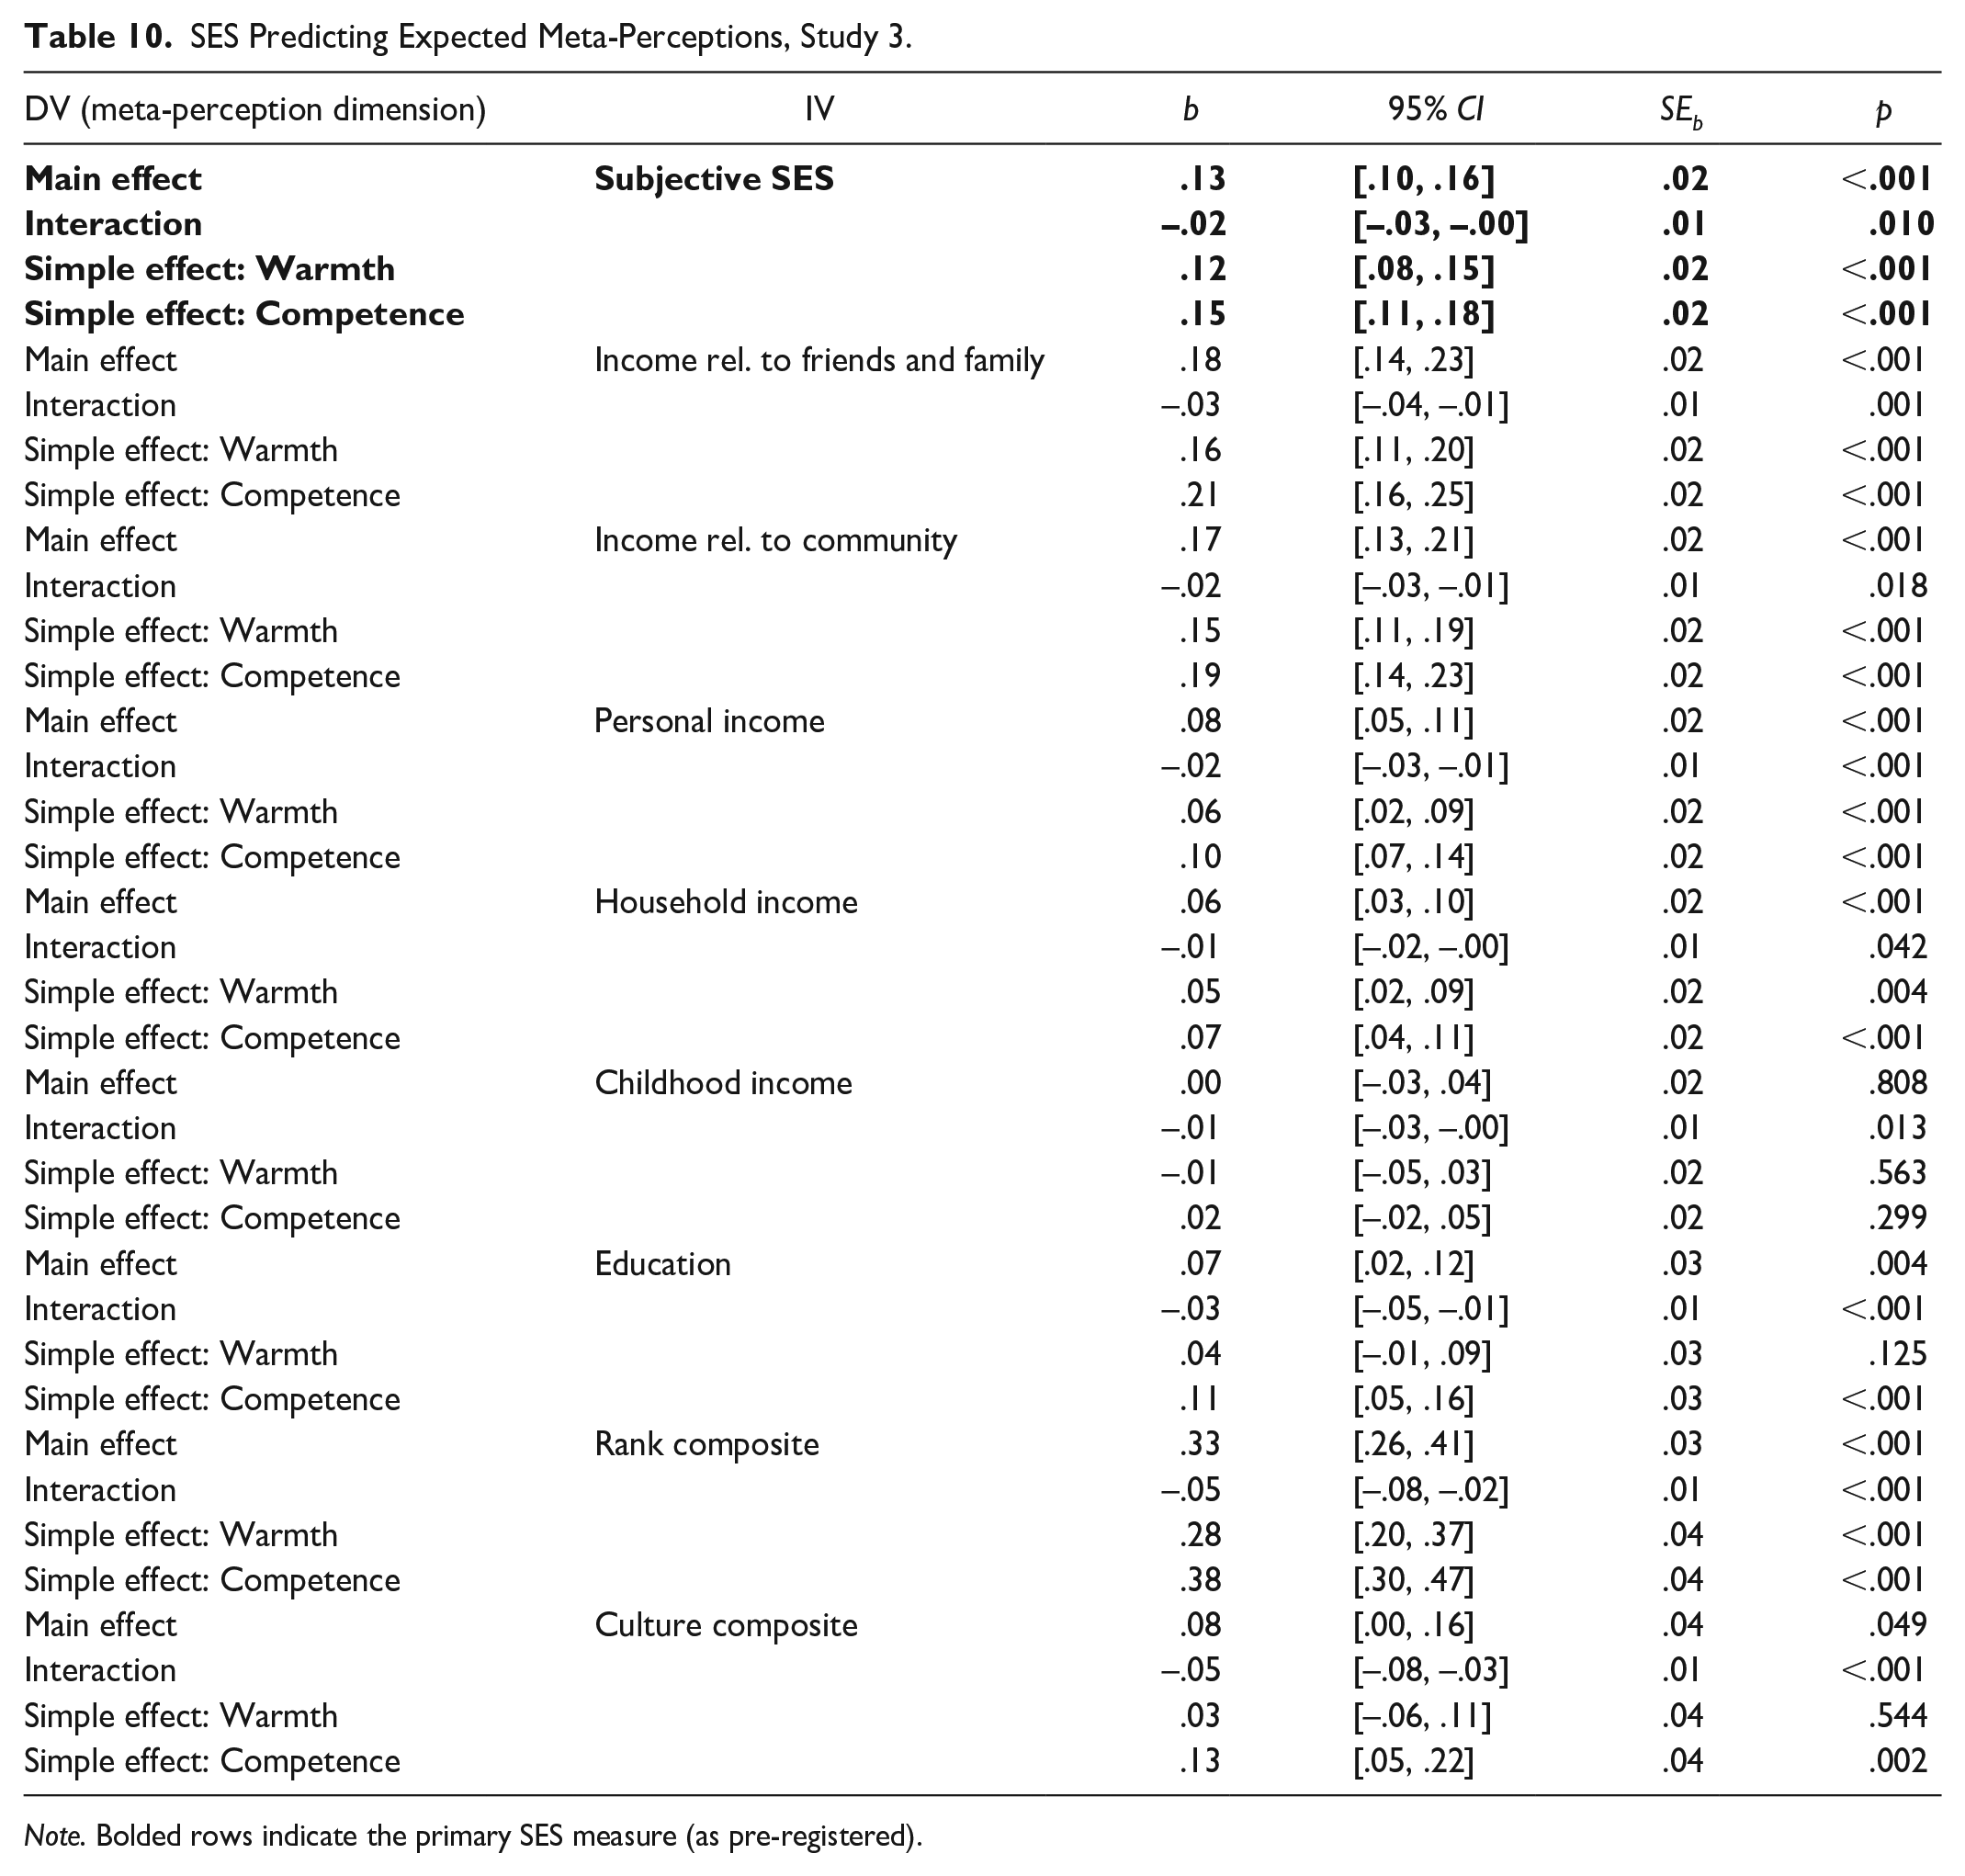
Note. Bolded rows indicate the primary SES measure (as pre-registered).
Attributions for Negative Feedback
Next, we tested how SES was associated with attributions for interpersonal failures. For the task-specific measure, we expected positive SES × Attribution Type (0 = internal, 1 = external) interactions: Participants with higher (vs. lower) SES should endorse more external and less internal attributions. For the general measure, we expected positive main effects of SES: Participants with higher SES should endorse the external end of the bipolar scale over the internal one. Table 11 and Figure 4 display the results; further analyses reported in the SOM found similar effects within the warmth and competence conditions separately.
SES Interacts With Attribution Type to Predict Task-Specific Attributions, and SES Predicts General Attributions, Study 3.
Note. The bolded row indicates the primary SES measure (as pre-registered). Higher numbers indicate that high SES is associated with more external (less internal) attributions for both measures. The task-specific attributions analyses use multilevel models with random effects for participants (because participants rated both internal and external attributions); the general attributions analyses use linear models (because participants rated attributions on one scale ranging from internal to external).
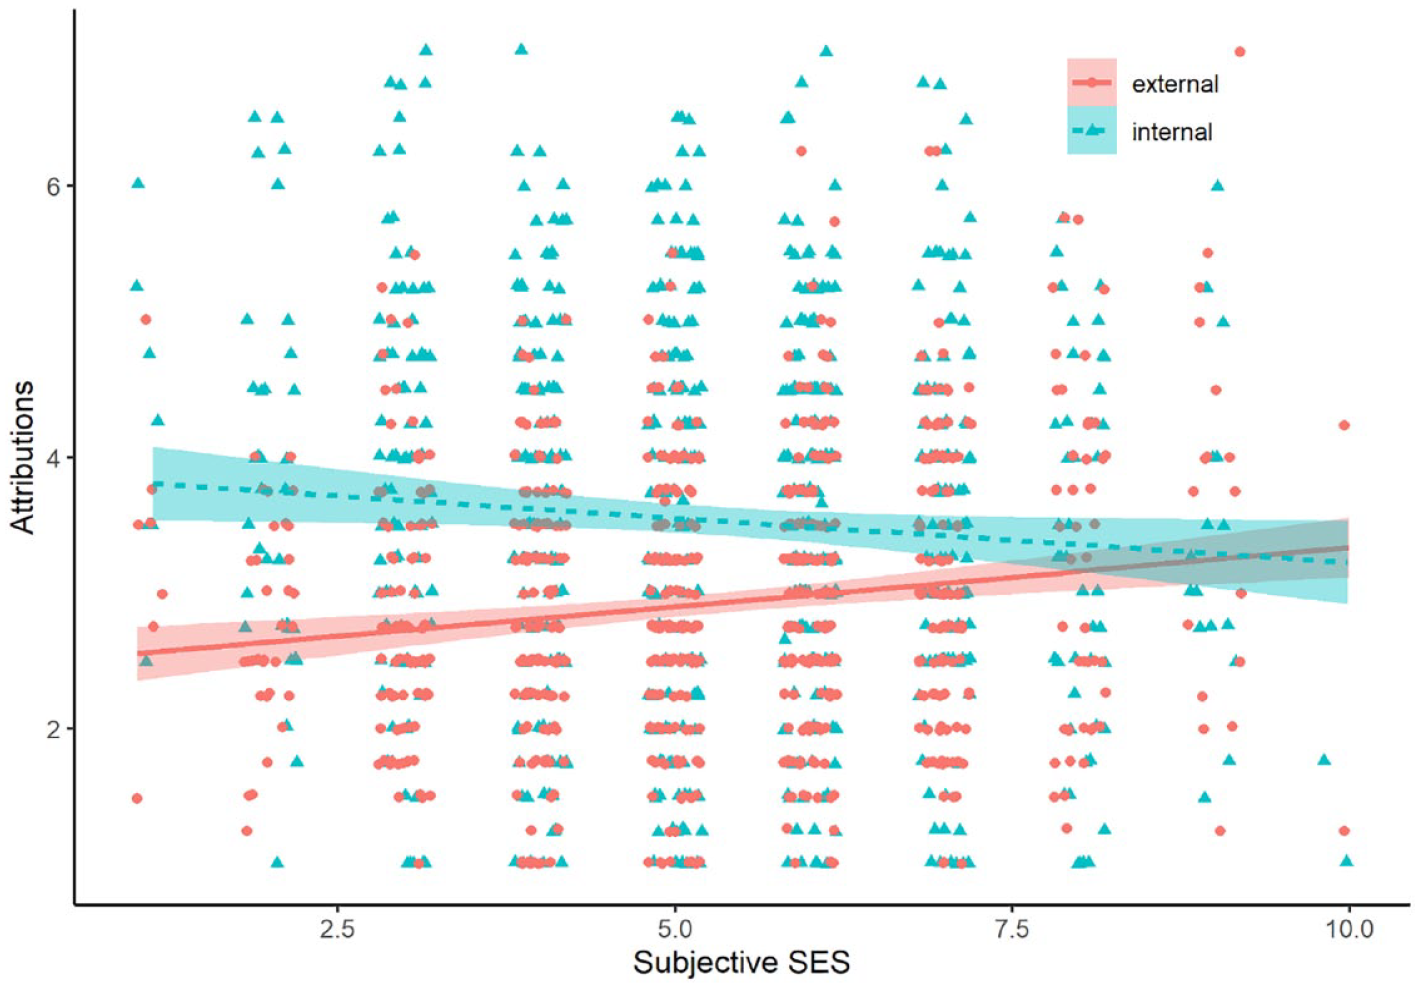
Attributions for Negative Feedback, Study 3 (Task-Specific Measure).
The predicted effect emerged in 11 of 12 tests involving rank-based measures (the exception: household income did not show the expected pattern on the task-specific measure, though it did on the general measure). In contrast, only two of six tests (and a third marginally significant test) involving culture-based measures showed the predicted effect.
Table 12 reports simple slopes probing significant interactions on the task-specific measure. Higher-rank (vs. lower-rank) participants made fewer internal attributions for interpersonal failure (four significant, one marginal, of five tests); they also tended to compensate for this with more external attributions, though results were somewhat weaker (three significant, one marginal, of five simple effects tests).
Simple Effects of SES on Each Attribution Type (From the Task-Specific Attribution Measure), Study 3.
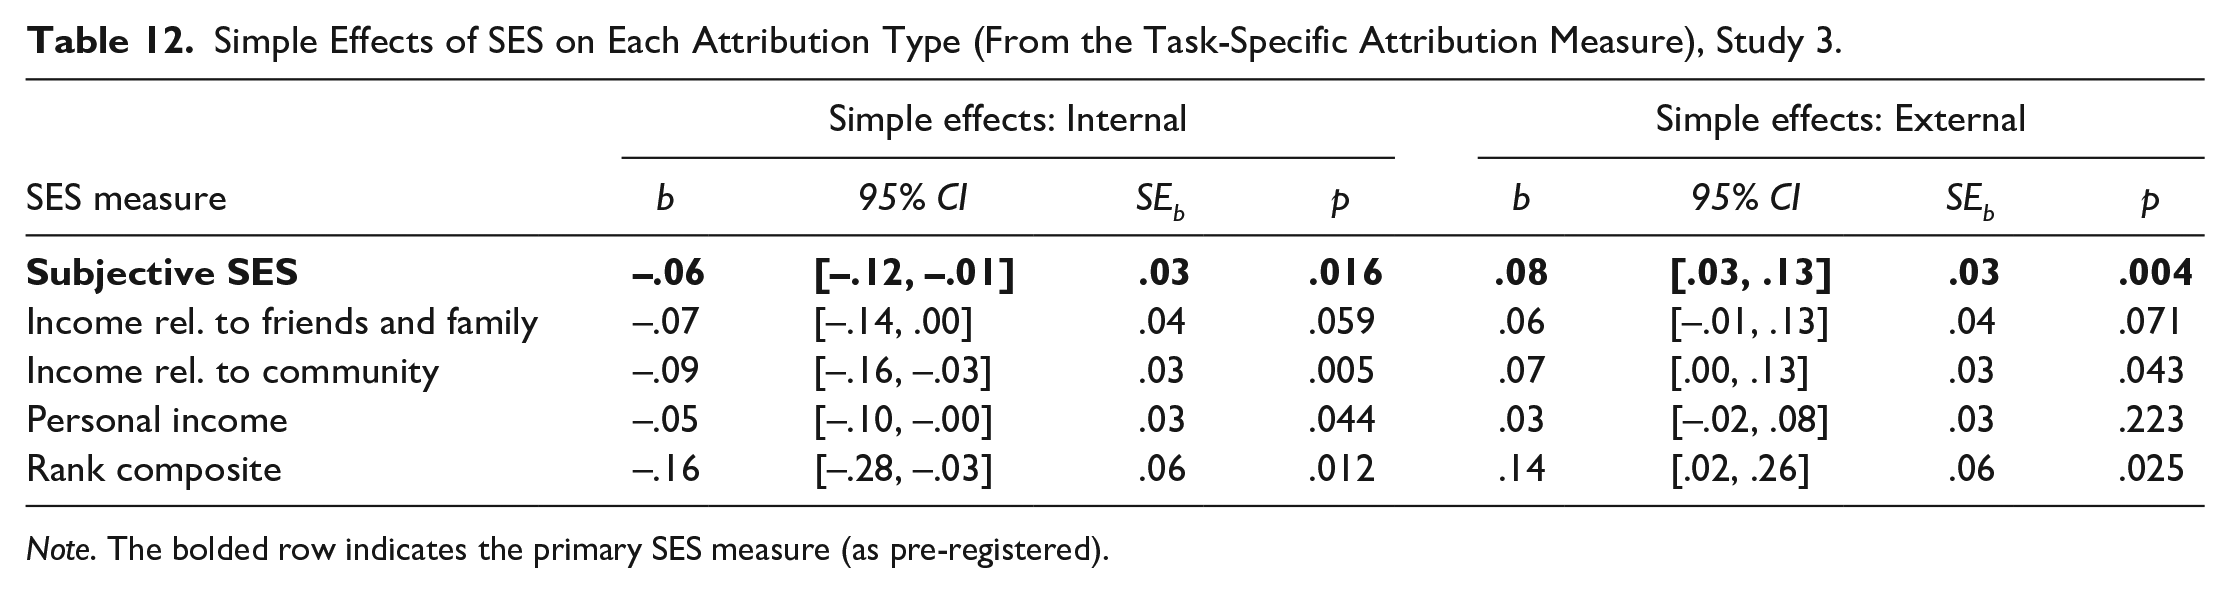
Note. The bolded row indicates the primary SES measure (as pre-registered).
Mediation Analyses
Using separate models for our two attribution measures, we tested whether SES differences in meta-perceptions statistically accounted for SES differences in attributions; see Table 13. For the task-specific measure, to calculate a single DV we computed the difference between external and internal attributions; 3 for the general measure, the raw scores on the bipolar scale served as the single DV. In all cases, the mediator was warmth (competence) meta-perceptions if they were in the warmth (competence) condition. Rank-based SES measures revealed consistent indirect effects: Higher-rank participants reported more positive meta-perceptions, which partially accounted for their more external attributions. Culture-based measures revealed indirect effects only for education.
Meta-Perceptions Mediate the Link Between SES and Relative Externality of Attributions, Study 3.
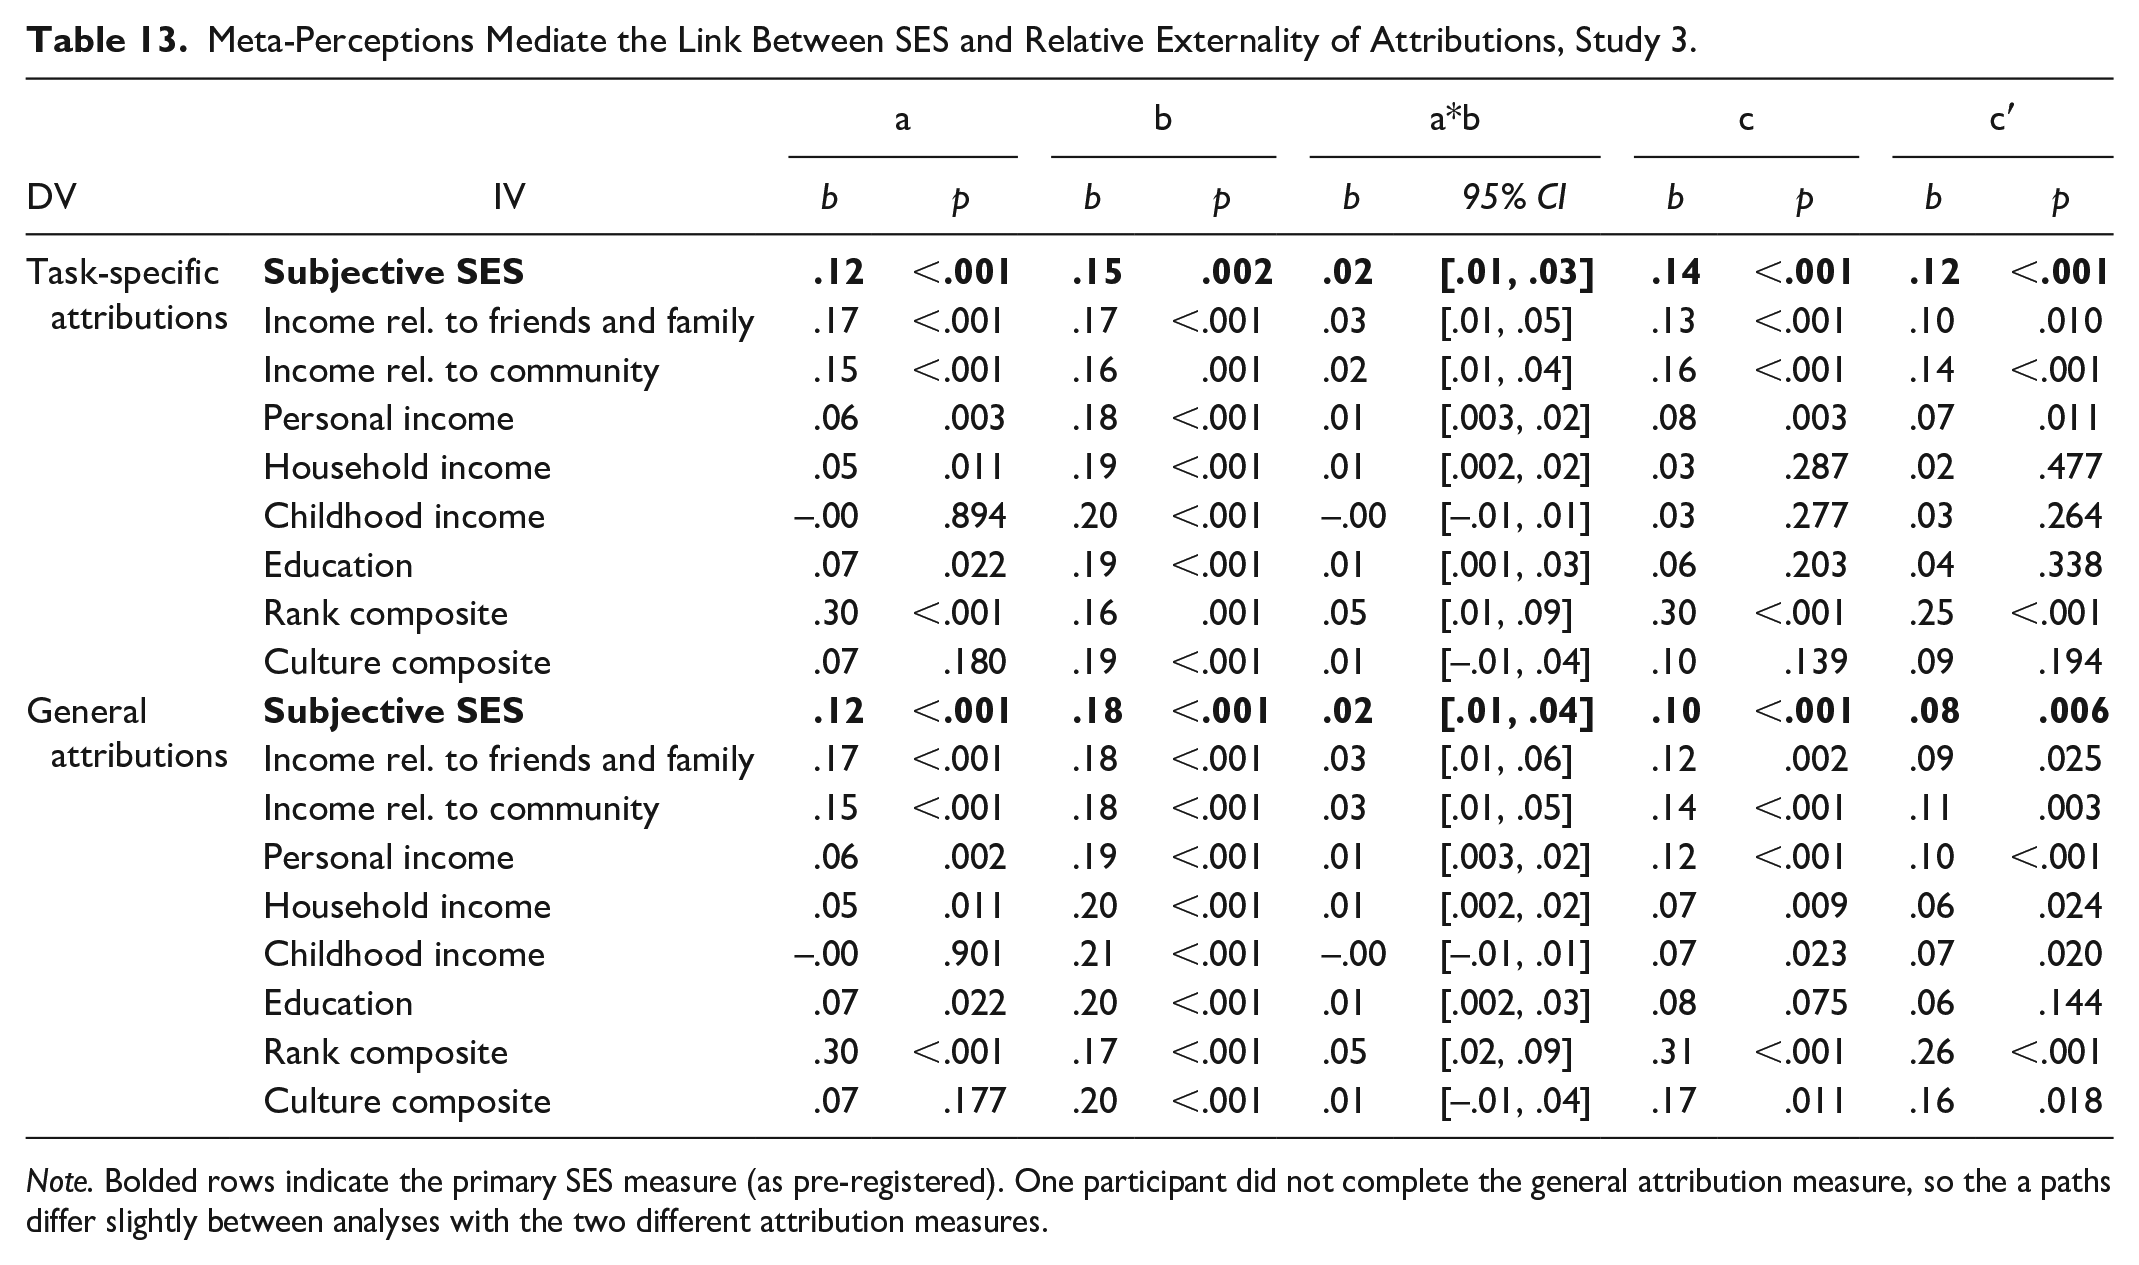
Note. Bolded rows indicate the primary SES measure (as pre-registered). One participant did not complete the general attribution measure, so the a paths differ slightly between analyses with the two different attribution measures.
Discussion
Again, participants with lower (vs. higher) SES expected conversation partners to see them as less warm and competent. These participants also blamed themselves more and external factors less for interpersonal failure. Moreover, results were consistent with mediation through meta-perceptions. Again, effects were stronger for rank-based measures than culture-based ones.
Eight supplemental studies further tested our hypotheses about attributions. We therefore conducted a second set of internal meta-analyses to further examine variation in effects across dimensions of meta-perceptions and of SES.
Internal Meta-Analyses: Consequences for Attributions
The meta-analyses consider all SES measures for each study measuring attributions, but Table 14 provides sample sizes and results for the ladder measure only, again because we pre-registered it as primary. The SOM reports effect sizes for other SES measures.
All Studies Included in the Meta-Analyses of the Relationships Between SES, Meta-Perceptions, and Attributions, and the Effect Sizes in Each Study.
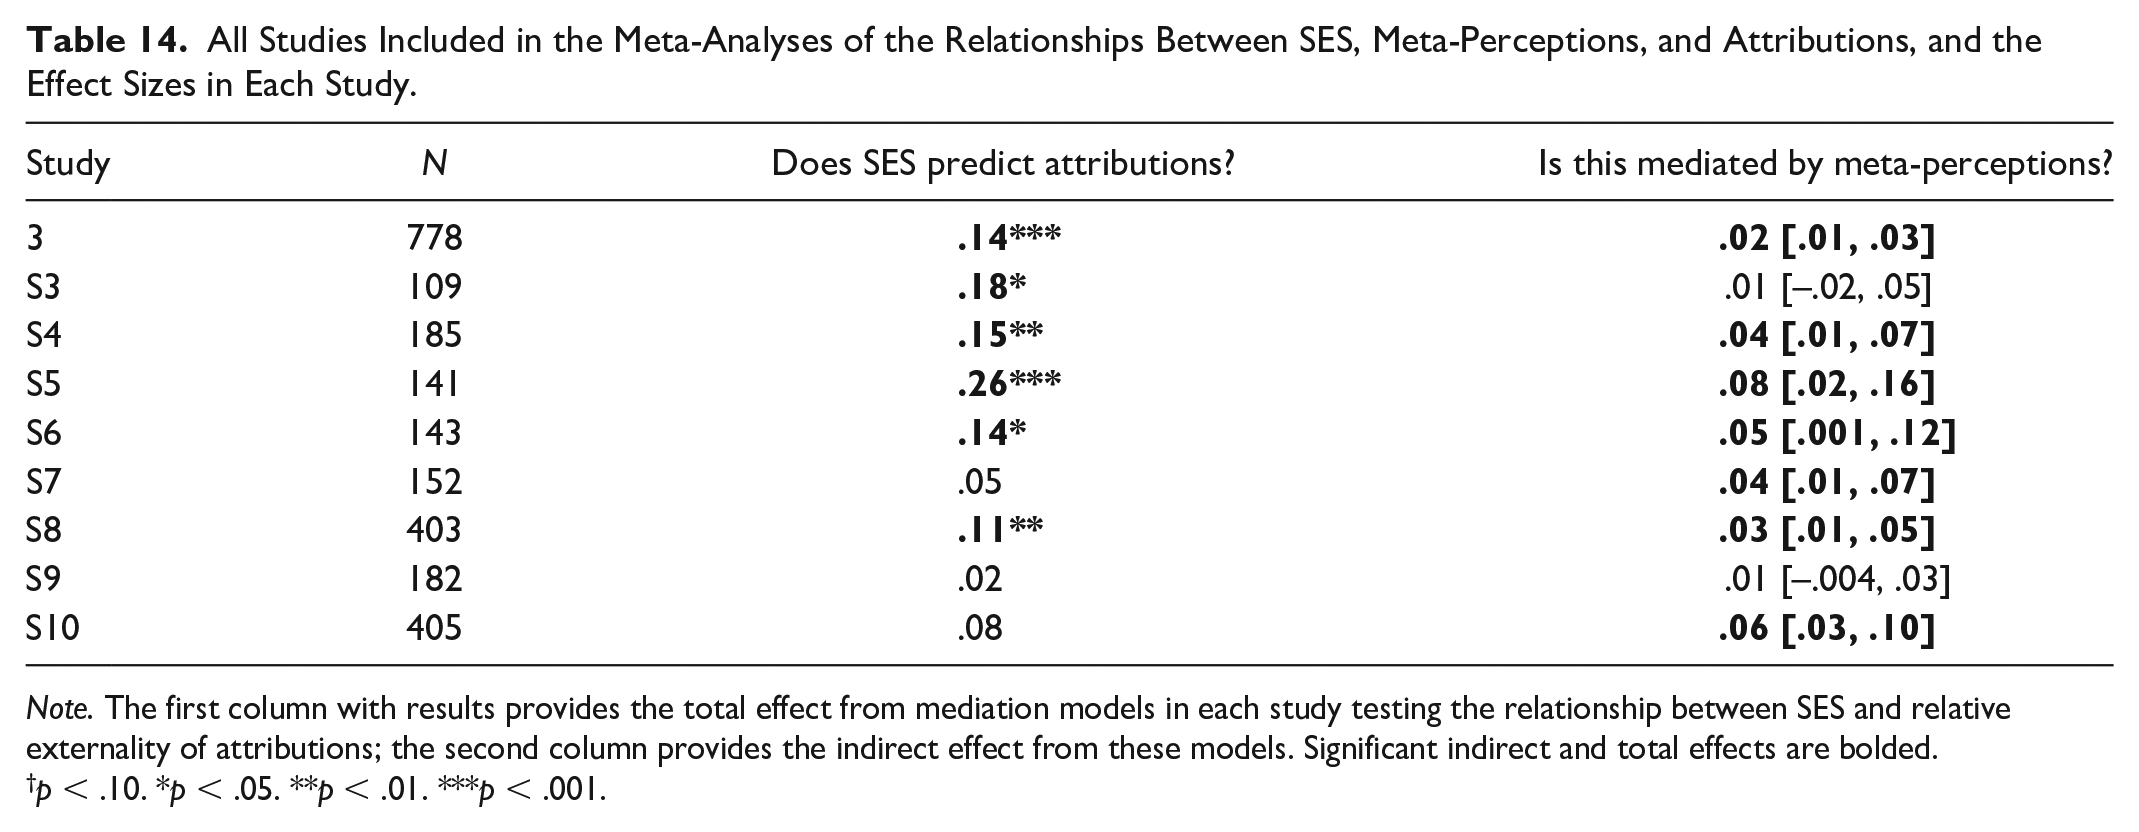
Note. The first column with results provides the total effect from mediation models in each study testing the relationship between SES and relative externality of attributions; the second column provides the indirect effect from these models. Significant indirect and total effects are bolded.
p < .10. *p < .05. **p < .01. ***p < .001.
Results
For each study, we extracted the correlation matrix between attributions, SES, and meta-perceptions (on the relevant dimension according to the rejection domain, i.e., warmth meta-perceptions if participants learned their partner did not want to talk to them again; competence if participants learned their partner did not want to complete a problem-solving task with them). We separated the studies examining rejection based on warmth (Study 3, warmth condition, and Studies S3, S4, S7, S8, and S9; total N = 1,465) and competence (Study 3, competence condition, and Studies S5, S6, and S10; total N = 1,016). We then used the same method as above for meta-analytic structural equation modeling. For each model, we report the total effect (SES predicting attributions; see Figure 5) and indirect effect (meta-perceptions mediating this link; see Figure 6).
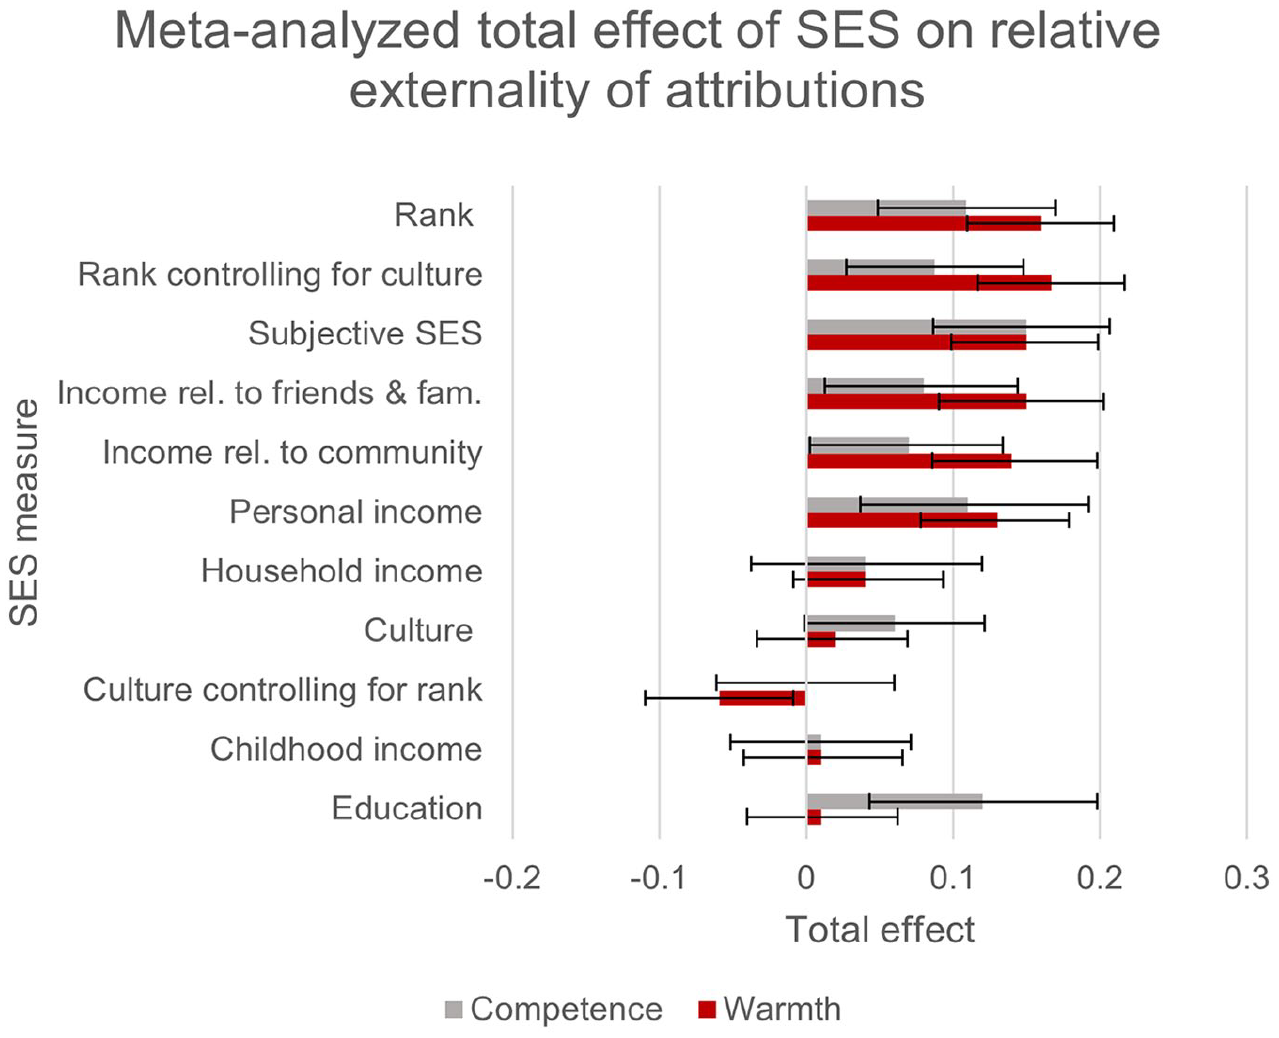
Meta-Analytic Total Effects of SES on Relative Externality of Attributions for Rejection Based on Warmth and Competence.
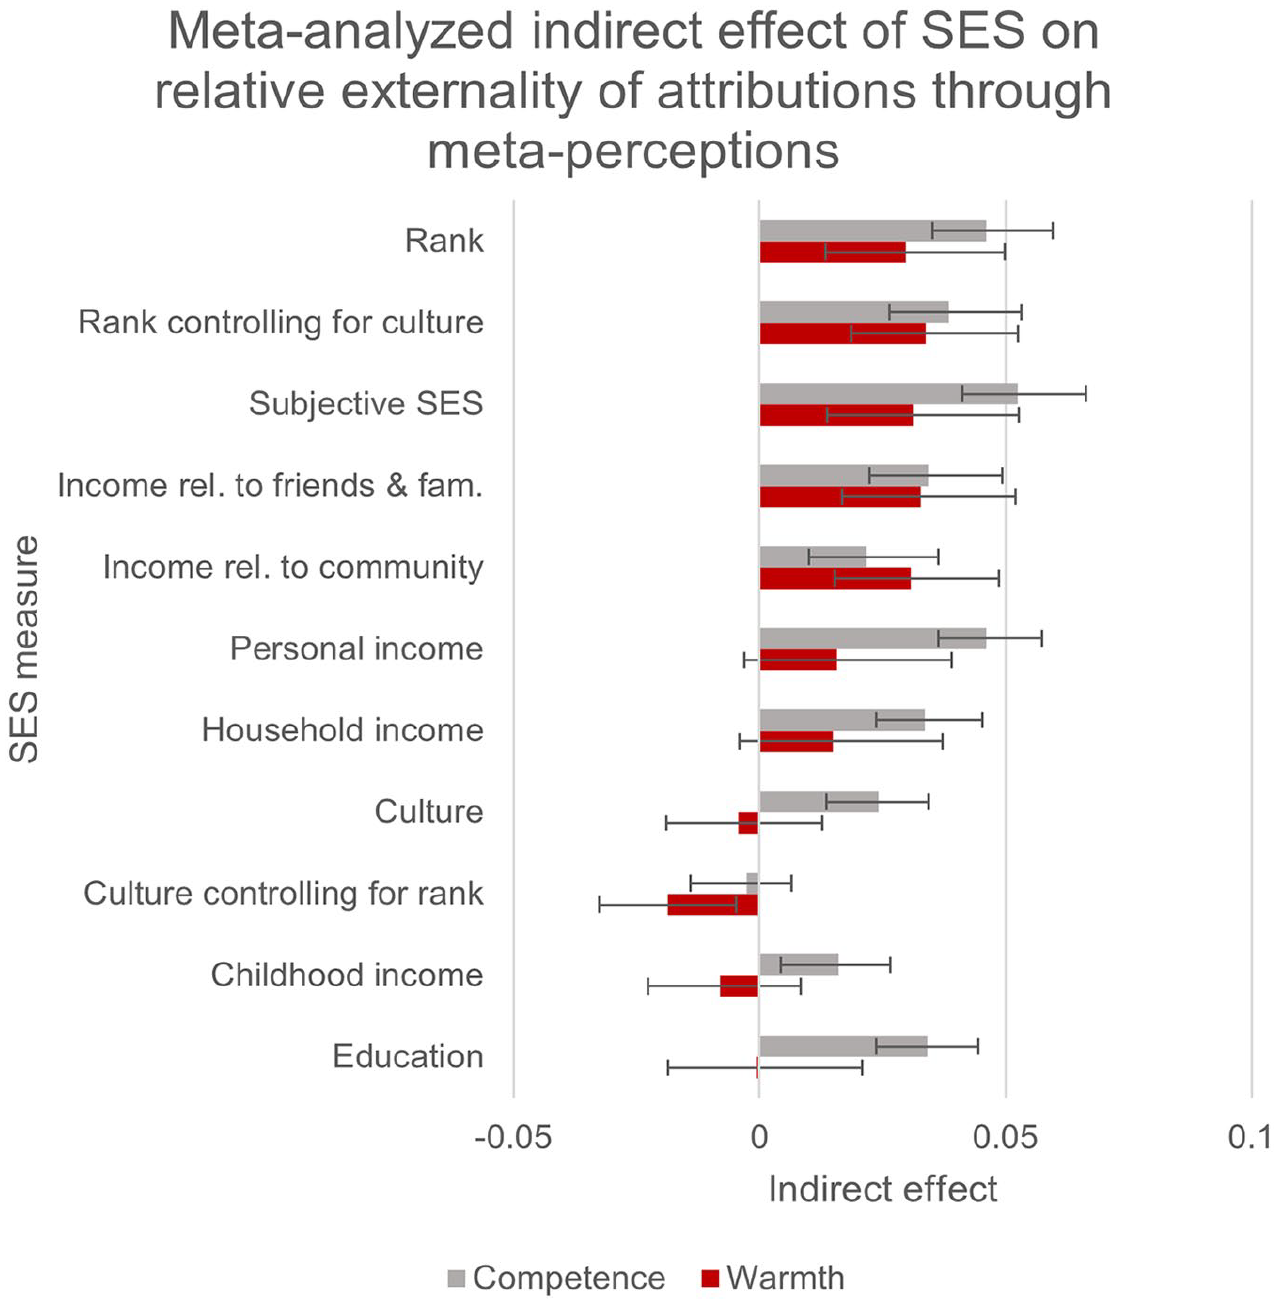
Meta-Analytic Indirect Effects of SES on Relative Externality of Attributions Through Meta-Perceptions of Warmth and Competence.
Overall, we found a strikingly similar pattern to the previous meta-analyses. People with lower current rank were generally more likely to attribute negative feedback internally than externally (the one exception to this trend was household income). This was true for both warmth and competence and was significantly mediated by meta-perceptions. In contrast, people of different cultural backgrounds generally made more similar attributions: We found much smaller effects in the competence domain and none in the warmth domain.
Discussion
Even though they relied on different sets of studies and tested different questions, our two sets of internal meta-analyses revealed a consistent pattern. People with low current rank expect others will see them as less warm and competent; in turn, this predicts blaming themselves more than external factors for failures in both warmth and competence domains. People from lower-SES cultural backgrounds, though, do not exhibit this same pattern: They expect others to see them as somewhat less competent, but no less warm, and they are just as likely to exonerate themselves following failure in warmth domains (and only slightly more likely to blame themselves in competence domains) compared with those from higher SES cultural backgrounds.
General Discussion
Across three primary studies and 14 supplemental studies (total N = 5,806), nearly half pre-registered and including many direct replications, people with lower SES thought others saw them as colder and less competent than those with higher SES. This pattern was statistically explained by the lower self-regard and weaker self-presentation expectations held by people with lower SES. Moreover, it explained people’s reactions to negative feedback: When they actually were seen as cold or incompetent, people with lower SES blamed themselves, while those with higher SES blamed external factors.
Dimensions of SES
This link consistently emerged using measures of people’s current rank (SES ladder; current relative/personal/household income), and less consistently with measures of people’s cultural context (childhood income, education, parental education). Researchers rarely distinguish between these dimensions of SES empirically (for theory see Kraus et al., 2013; Stephens & Townsend, 2013). Our research illustrates the utility in disentangling these dimensions. For example, if meta-perceptions are linked more to rank than culture, they should be more malleable (as relative rank changes based on one’s comparison group) than inflexible (as it is difficult to change one’s social class cultural group).
The cultural context variables were particularly weak predictors of warmth meta-perceptions, and in our meta-analysis, when controlling for rank, having a lower social class cultural context predicted having more positive warmth meta-perceptions. This may be explained by social class stereotypes. Some research indicates that lower-SES people are stereotyped as less competent but warmer than those with higher SES (Durante et al., 2017). People raised in low or high SES cultural contexts may expect to be stereotyped based on their SES more so than those with currently low or high SES rank because SES culture involves long-term experiences of being part of a stereotyped group (unlike the more transient experience of current rank). If those from low (vs. high) SES cultural contexts expect positive warmth stereotyping, this could somewhat counteract their more negative self-regard and self-presentation expectations, resulting in the weak or null relationships observed between cultural SES variables and meta-perceptions.
Another possibility is that culture does influence warmth meta-perceptions, but that it does so specifically in contexts that trigger SES-linked concerns about belongingness or cultural fit (Phillips et al., 2020; Stephens et al., 2014). For example, first-generation students attending university may feel they do not fit in and worry that others will judge them negatively. Indeed, the only time we found culture to strongly predict both warmth and competence meta-perceptions was Study 1, also our only study involving in-person interactions in a university context. Future research could explore whether concerns about fit and belonging account for the cultural effects on meta-perceptions in contexts like university.
This SES—meta-perceptions link was stronger for subjective SES measures; links with objective measures tended to be weaker. One possible explanation for this is that objective SES predicts psychological outcomes through subjective SES experiences (e.g., Kraus & Park, 2014). We did not test this idea here, in part because doing so would take an overwhelming number of analyses given how many SES measures each study contains. As well, it would be difficult to draw conclusions from these analyses because we did not have any subjective measures linked to culture (as opposed to rank), and our findings revealed interesting differences between the two conceptualizations. Future research could measure subjective culture by asking what social class group people identify with, to enable comparisons between culture and rank and between subjective and objective SES.
Although we did not measure subjective culture, we did measure a wide variety of other SES indicators. It is informative to examine the patterns that emerge overall across measures (or broad classes of measures, like rank- vs. culture-based measures); we caution against overinterpreting results for any individual measure, as many of these have limitations. For example, the same income provides different purchasing power depending on cost of living in one’s area, and subjective SES may covary with self-regard and meta-perceptions because all involve positive subjective ratings. The meta-analytic figures make the broad patterns especially apparent.
Overly Pessimistic Meta-Perceptions and Their Consequences
Although people with low SES believed others viewed them more negatively than those with high SES, Study 1 suggested this was inaccurate. This means people with low SES may hesitate to take interpersonal and professional opportunities they would actually benefit from. Moreover, because people with low SES are more likely to blame themselves when they receive negative feedback, they may prematurely abandon their goals when they run into obstacles, while those with high SES, blaming all failures on the obstacles, may persist (Nauta et al., 1999). This may further compound material inequalities across the SES spectrum.
However, there are benefits to accepting responsibility for failure: Doing so can motivate people to improve themselves (Ilgen & Davis, 2000). Moreover, taking the risk of assuming others will see oneself positively may result in costs if that risk fails, and those with lower SES have fewer resources to bear such costs. For example, a high SES person might not be unduly affected if she believes she can succeed in a job interview on charisma alone–even if she does not land the job, she likely has savings or family connections to fall back on. In contrast, a low SES person is less likely to be able to afford this same mistake. Future research may investigate further the balance of helpful and harmful consequences of low SES individuals’ meta-perceptions and attributions.
This attribution finding is likely specific to negative and self-relevant social feedback. Research on attributions for events that happened to other people finds that lower- (vs. higher-) SES individuals make more external (less internal) attributions (Kraus et al., 2009, 2012). We reasoned that meta-perceptions—beliefs about how other people perceive the self—likely predict attributions specifically for social events that happen to the self. There is no theoretical reason to expect meta-perceptions would predict attributions for other types of events, like events that do not involve the self, or ones that do but are non-social. The pattern of increased internal attributions for social failure among lower- (vs. higher-) SES individuals seems like an exception to these individuals’ generally more external attributional style and demonstrates the importance of considering meta-perceptions in understanding how SES affects social cognition.
Limitations and Alternative Explanations
We were unable to successfully manipulate subjective SES (see SOM Studies S11-S13), so we could not test the causal role of SES. One interpretation is that, rather than SES causing meta-perceptions, a third variable causes both SES and meta-perceptions. Perhaps the most likely such variable is self-regard, as people with more negative self-regard might think they are both relatively low in rank and seen negatively by others. We instead view self-regard as a mechanism that connects social rank to meta-perceptions, and consider it unlikely to be the first link in the causal chain, based on research and theory on socialization and acculturation in early development (e.g., Bourdieu, 1984, 2018; Reay et al., 2009; Stephens et al., 2014). Although self-regard could cause people to feel relatively high status, it seems unlikely that self-regard would cause people to have parents with higher incomes and more education, suggesting self-regard cannot fully explain the relationships we observed between these SES measures and meta-perceptions. Moreover, the link between SES and meta-perceptions held controlling for self-perceptions (on the exact same items as meta-perceptions). Even when a low and high SES person both believe themselves to be equally warm and competent, the high SES person is more confident that her warmth and competence will be recognized by others. However, it is very possible that these effects feed forward into SES, which would make the causal pathway more cyclical than linear. For example, if individuals with low SES are less confident others will like and respect them, they may perform worse in interviews or be less likely to apply for prestigious jobs, cementing their low SES position.
Another alternative explanation invokes ethnicity, which is confounded with SES in North America (Akee et al., 2019; Block et al., 2019). However, our data indicate this is unlikely: All effects hold controlling for ethnicity (see SOM), and in Studies 2 and 3, effects of ethnicity tended to be the opposite of effects of SES. People from disadvantaged ethnic groups had more positive meta-perceptions and made more external, less internal attributions than those from more advantaged groups. Advantaged ethnic groups were heavily overrepresented in our samples, making it difficult to draw conclusions about this effect, but future research might investigate this further.
Finally, results could have differed if we had sampled more participants from extremely high or low SES groups. Our samples roughly paralleled U.S. census SES demographics, though our participants had lower incomes and more education than the general U.S. population; see Table 1 notes. Thus, for example, the education—meta-perceptions link may have been stronger if we had recruited more participants without college degrees. We also had few participants at the extreme ends of the SES spectrum, a limitation of MTurk (which can only be accessed by computer, preventing those with very low SES from participating, and which provides small incentives for participation that are unlikely to appeal to the wealthy) and undergraduate samples (who are all pursuing higher education and therefore have at least moderately high SES). We can therefore only draw conclusions about individuals in the most populated area of the SES distribution, not those at the ends. Future research might target these populations more specifically.
Conclusion
As one participant with low SES put it when asked to describe why he placed himself where he did on the SES ladder, “I don’t make a lot of money, and I don’t have much social standing. I’m a nobody.” These feelings of lacking social standing, of being a nobody, are linked to how people expect others to see them. People with lower, versus higher, current socioeconomic rank expect to be seen more negatively across domains, as both cold and incompetent. Though these expectations are not borne out in reality, they still lead people with low SES to conclude they are at fault when they discover they have performed poorly. This may have consequences for persistence, motivation, and receptivity to feedback, and thereby may also have consequences for inequality.
Supplemental Material
sj-docx-1-psp-10.1177_01461672231171435 – Supplemental material for Socioeconomic Status and Meta-Perceptions: How Markers of Culture and Rank Predict Beliefs About How Others See Us
Supplemental material, sj-docx-1-psp-10.1177_01461672231171435 for Socioeconomic Status and Meta-Perceptions: How Markers of Culture and Rank Predict Beliefs About How Others See Us by Holly R. Engstrom, Kristin Laurin, Nick R. Kay and Lauren J. Human in Personality and Social Psychology Bulletin
Footnotes
Data Availability Statement
Declaration of Conflicting Interests
The author(s) declared no potential conflicts of interest with respect to the research, authorship, and/or publication of this article.
Funding
The author(s) disclosed receipt of the following financial support for the research, authorship, and/or publication of this article: Study 1 in this paper was partially supported by Social Sciences and Humanities Research Council (SSHRC) of Canada Grants (435-2016-0499) and funding from the Canada Research Chairs program to Lauren J. Human. All other studies were supported by SSHRC Grants (435-2019-0424) to Kristin Laurin.
Supplemental Material
Supplemental material is available online with this article.
Notes
References
Supplementary Material
Please find the following supplemental material available below.
For Open Access articles published under a Creative Commons License, all supplemental material carries the same license as the article it is associated with.
For non-Open Access articles published, all supplemental material carries a non-exclusive license, and permission requests for re-use of supplemental material or any part of supplemental material shall be sent directly to the copyright owner as specified in the copyright notice associated with the article.