



Abstract
Objectives
To compare patients’ perception of their degree of subglottic stenosis to their endoscopic exam findings, Clinical Dyspnea Questionnaire, and peak flow results.
Study Design
Prospective Multi-Institutional.
Setting
Tertiary Care Clinic.
Methods
A study of 50 patients comparing patients’ perception of their degree of subglottic stenosis to their endoscopic exam findings. All patients filled out a Clinical Dyspnea Questionnaire and a 10-point scale reflecting their perceived degree of stenosis in 10% intervals. Surgeons filled out the same scale based on measurements from the patients’ exam. Accuracy was defined as +/-1 on a 10-point scale. Pulmonary function testing, number of dilation procedures undergone, cause of stenosis, and demographic information were collected.
Results
Data complete for 49/50 patients. 48 (98%) were female, 47 (97.9%) Caucasian, 44 (89.8%) had idiopathic subglottic stenosis, and 28 (58.3%) had Grade I subglottic stenosis on the Cotton-Meyer scale. Spearman correlation coefficient was 0.67 indicating moderate correlation overall but 0.88, or high correlation, for those with normal Body Mass Index. Increased Dyspnea Index scores and higher Body Mass Index were correlated with decreased accuracy. Number of previous procedures was not correlated with accuracy. Higher Body Mass Index was correlated with increased dyspnea and lower peak flow volume.
Conclusion
Patients with normal Body Mass Index have strong predictive accuracy regarding their degree of subglottic stenosis. Better dyspnea scores were correlated with improved accuracy. There is no standard consensus on subglottic stenosis patient follow up. Prior studies have looked at using peak flow meters and validated questionnaires to monitor symptoms.
Introduction
Subglottic stenosis is a diagnosis that is frequently managed in laryngology practices. Most patients need multiple interventions over decades and several tools to aid with follow up have been published. Questionnaires, such as the commonly used Dyspnea Index (DI), have been validated to follow symptoms of patients with subglottic stenosis.1-3 Naunheim et al used four questionnaires (European QOL–Five Dimensions; RAND 36-Item Health Survey; Clinical COPD [Chronic Obstructive Pulmonary Disease] Questionnaire; and the Airway, Dyspnea, Voice, and Swallowing Summary Assessment) to validate an assessment tool by identifying the questions that correlated best with objective measures. These questions included overall breathlessness, difficulty catching breath, cough within the past week, dyspnea with moderate activity, perception that voice changes are restricting social life, and overall general health. 4
Spirometry has been used in the diagnosis of subglottic stenosis and to differentiate it from other pathologies. 5 In recent years it has been utilized to provide objective measures to follow patients’ disease as well.
Peak Expiratory Flow (PEF), Peak Inspiratory Flow (PIF), and Forced Inspiratory Volume (FIV1) can be used to compare each patient to themselves over time.6,7 However, since these measurements change with age, height, weight, and sex, we cannot use them to compare subjects. Patients can be compared utilizing the Peak Expiratory Flow Percentage (PEF%), defined as the patient’s measured PEF divided by the predicted PEF for someone of the same age, gender, and height for standardization.4,8 Creating an index combining questionnaires and pulmonary function (PFT) measurements has also been discussed. Ntouniadakis et al found that although utilizing PFT measurements and DI alone did not represent the severity of stenosis, combining them together may indicate need for treatment. 2
Since most patients need multiple trips to the operating room, some form of follow up is necessary. There is no standard workflow dictating whether patients should be examined regularly or reach out when symptoms worsen. Validated questionnaires suggest that patients overall can accurately assess their symptoms. However, the correlation between exam findings and symptoms has not been, to our knowledge, evaluated previously. Anecdotally, there is a wide range of stenosis severity shown on endoscopic examination despite patients’ perceptions of increasing shortness of breath. This study aims to compare patient perception of their degree of subglottic stenosis to their endoscopic exam findings.
Methods
This is a prospective multi-institutional study comparing patient perception of their degree of subglottic stenosis to their endoscopic exam findings. Approval was obtained from the Mayo Clinic Institutional Review Board (IRB). All patients were recruited from a tertiary care laryngology clinic presenting for either initial evaluation, worsening of symptoms, or patient desire to check severity of disease. All patients underwent a recorded in office or operative bronchoscopy which was later reviewed by the surgeon to estimate degree of stenosis. All patients were symptomatic. All patients were given a validated Dyspnea Questionnaire which was scored out of 10 points with 0.5 being extremely mild and 10 being unbearable.
9
They were also given a form to circle their perceived degree of stenosis in 10% intervals with a total of 10 choices (Figure 1). Patients were instructed to choose their estimated degree of stenosis based on the symptoms they were experiencing. These forms were completed right before the exam was performed. The same form was given to the surgeon to identify the degree of stenosis seen on endoscopic exam. This was calculated by taking a snapshot of the stenosis at its worst point, measuring the area of the stenotic lumen, and subtracting it from the total area of the subglottic lumen. This was then divided by the total area to give a percentage. Percent of subglottic stenosis in 10% intervals

The surgeon also classified the grade of stenosis via the Cotton-Meyer Grading Scale. 10 Grades I-III were included in the study; however, patients with Grade IV stenosis, or no detectable lumen, were excluded from the study. The number of dilation procedures the patient had previously undergone, the underlying cause of stenosis, comorbidities, and demographic information were also documented. Patients with tracheostomies or scheduled for open tracheal resections were excluded. Four surgeons participated in the study.
Statistical Analysis
Descriptive statistics were presented for patient demographics and clinical characteristics. The 10-point scales for patient perception of degree of subglottic stenosis and physician noted degree of subglottic stenosis on endoscopic findings were correlated using Spearman method. Demographics and clinical characteristics were compared between patients who were accurate in their perceived degree of subglottic stenosis verses those who were not using Kruskal-Wallis test or Chi-Sq test, where appropriate. Accurate perceived degree of subglottic stenosis was defined as within plus or minus one point (on a 10-point scale) difference from the physician documented degree of subglottic stenosis on endoscopic findings. The difference between patient reported subglottic stenosis and exam findings was assessed using paired t-test. A-priori power analysis determined a sample size of 34 patients would achieve 80% power to detect an effect size of 0.5 (half of the standard deviation) using a paired t-test with a 0.05 two-sided significance level. The mean difference between patient reported subglottic stenosis and exam findings was 0.510 (95% CI -0.052, 1.073), p=0.0745. Therefore, we fail to reject the null hypothesis that the patient report and exam findings were the same for the group. We then compared the same characteristics between patients with BMI of 25 or less (normal or underweight) versus those with BMI of 26 or greater (overweight). We repeated this analysis dividing the data in three BMI groups as well; less than 25 (n=17), 26-30 (n=11), and greater than 30 (n=15). Six patients were not included as BMI data was missing. All analyses were two-sided and considered statistically significant at the p<0.05 level. Analyses were performed in SAS v9.4 (SAS Institute; Cary, NC).
Results
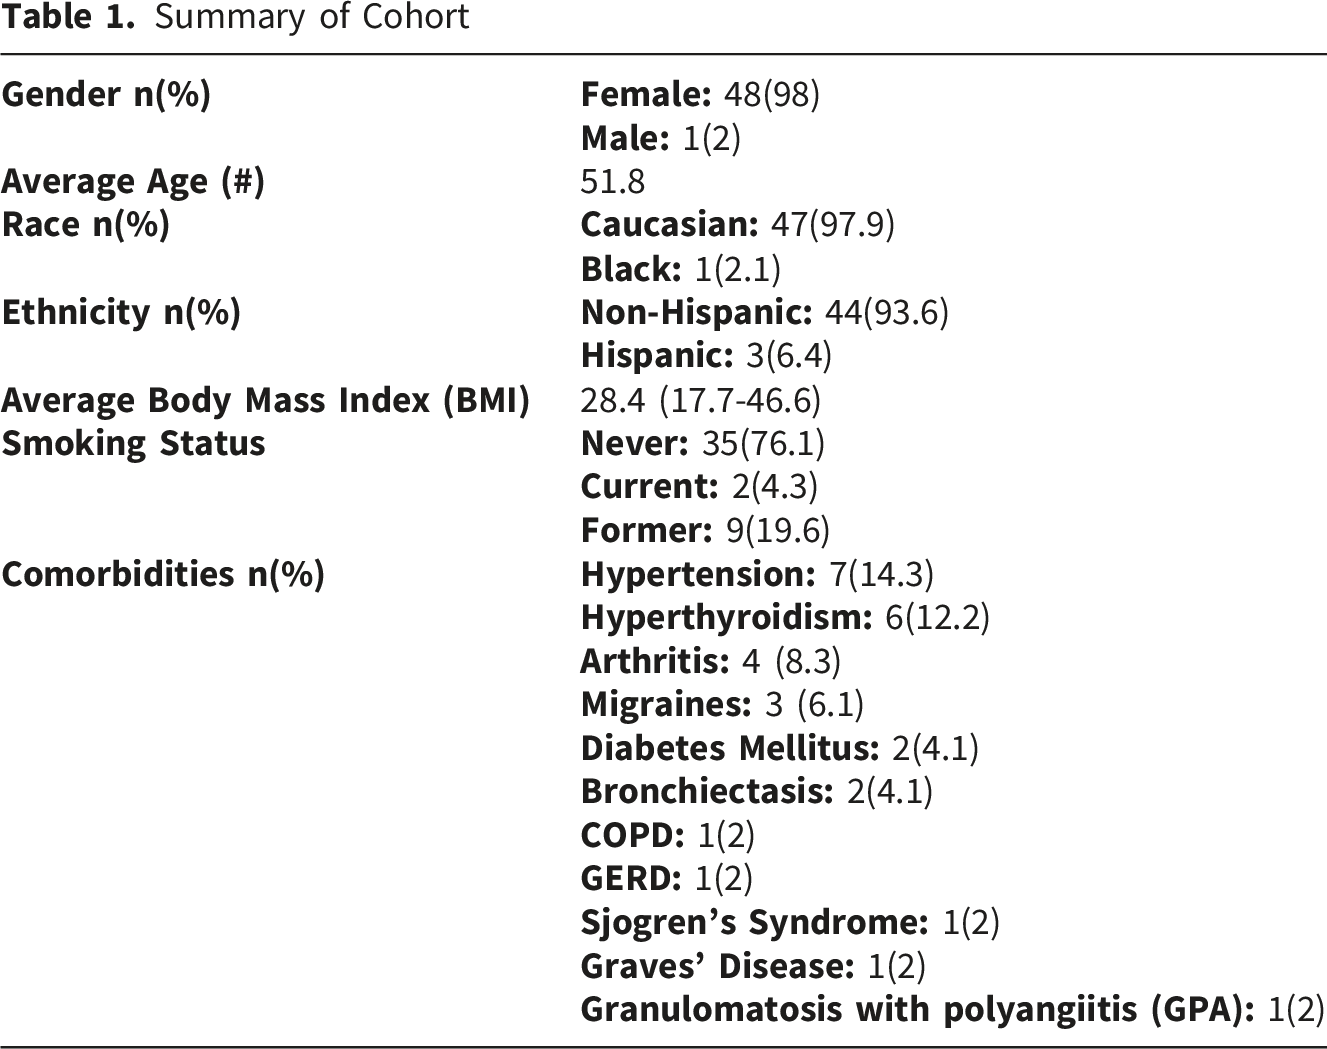
Data Summary
Summary of Cohort
Patient Perception vs Endoscopic Exam Findings
Degree of Subglottic Stenosis--Both Patient Perception and Endoscopic Findings


Degree of subglottic stenosis—patient perception vs endoscopic exam findings for cohort overall and three BMI groups: <25, 25-30, and >30
Body Mass Index
In Figure 2, the correlation coefficient was also calculated for three BMI groups; <25 (normal weight), 25-30 (overweight), and 30< (obese). We found that the group with normal weight had a correlation coefficient of 0.88 or a high correlation (0.7-0.9). 11 Those with higher BMI estimated their stenosis to be worse than what was found on their endoscopic exam. They also had more severe stenosis on average (41-50%) than the patients with BMI less than 25 (21-30%, p=0.03). They also had a history of fewer previous procedures on average (2.5) than the group with lower BMI (5.8, p=0.02). Regarding their Clinical Dyspnea Questionnaire score, those with higher BMI scored higher on average at 3.9 (moderate to intense) in comparison to the lower BMI group, whose average score was 2.5 (mild to moderate) (p=0.0004). PEF was lower for the higher BMI group, with a mean of 225, compared to an average of 287 (p=0.03).
Discussion
Although this study was open to all patients with subglottic stenosis, the majority of the patients enrolled had idiopathic subglottic stenosis. Therefore, our conclusions refer specifically to this group of patients. Generally, we found them to be accurate at estimating their degree of stenosis, regardless of the number of procedures they have had in the past or the severity of their disease. Those with a BMI greater than 25 were not found to be accurate in their predictions. This group also had fewer previous procedures which can contribute to their inaccuracy. We can trust patient perception of their degree of subglottic stenosis as long as their BMI is not greater than 25.
Idiopathic subglottic stenosis is primarily seen in middle age, Caucasian females which was reflected in our results. Gender, race, and ethnicity did not reach statistical significance with regards to accuracy, which is expected in such a homogenous group of patients. As previously documented in the literature, 12 patients with idiopathic subglottic stenosis tend to be otherwise healthy. This was also seen in our cohort with only 3 patients with other respiratory diseases (Table 1) and thus comorbidities were not found to be a significant confounding factor.
Overweight and obese patients were found to have more severe disease both on exam and with PEF results. These factors did not seem to influence accuracy with the cohort in general and thus were not found to be confounding factors. Their perception of symptoms did, however, influence their accuracy, as those with higher BMI did have higher dyspnea scores and high scores were also correlated with lower accuracy when estimating their stenosis.
Patients with subglottic stenosis have symptoms that greatly impact their quality of life. Patients have turned to online support groups, which has been shown to influence their decisions about surgical procedures and medication. 13 Many studies have highlighted the importance of a quicker diagnosis of subglottic stenosis, as well as strategies to diagnose these patients earlier. A study done by Gnagi et. al. looking at 160 patients with subglottic stenosis revealed that the time to diagnosis for patients was often very delayed, with 58% of patients with idiopathic subglottic stenosis not diagnosed for at least 18 months since symptom onset and 45% not diagnosed for more than 2 years. 14
Subglottic stenosis is a resource intensive disease that often requires multiple operating room procedures and clinic visits. In a study by Yin et al, health care costs and cost effectiveness in laryngotracheal stenosis was evaluated. It was found that the mean annual costs for these patients was $4,080.09 with intubation related stenosis requiring significantly higher costs than idiopathic stenosis. 15 This can be burdensome for patients due to the chronicity of disease. Based on the results of our study, strong consideration should be made to avoid routine clinic follow up for this disease. Instead, follow up in most instances can be determined by patients’ symptoms.
Conclusion
Subglottic stenosis is often a chronic disease with a high impact on quality of life and associated with a high healthcare cost burden. In our study we found that patients have strong accuracy regarding their degree of subglottic stenosis. Better Dyspnea Index scores and normal BMI were correlated with improved accuracy. This information can help shape follow up planning for these patients to minimize burden on quality of life and improve cost effectiveness.
Footnotes

Ethical Consideration
This study was approved by the Mayo Institutional Review Board (approval no. 19-000757) on March 8, 2019.
Consent to Participate
All participants provided written informed consent to conduct the study and publish the study.
Author Contributions
All authors listed have made a significant contribution to the concept, design, acquisition, analysis and interpretation of data. Dr Abdel-Aty drafted the article and all authors revised it critically for important intellectual content. All authors approved the final version of the article for publication and agreed to be accountable for all aspects of the work and resolved any issues related to its accuracy or integrity.
Funding
The authors received no financial support for the research, authorship, and/or publication of this article.
Declaration of Conflicting Interests
The authors declared no potential conflicts of interest with respect to the research, authorship, and/or publication of this article.
Data Availability Statement
The datasets generated during and/or analyzed during the current study are available from the corresponding author on request.