
Abstract
Objective:
To investigate changes in the serum allergen-specific IgE (sIgE) profile in allergic rhinitis (AR) before and after widespread mask usage, home isolation, and reduced outdoor activities.
Methods:
This retrospective study enrolled 3715 patients with AR in Wuhan (September 2020-October 2024), with a cutoff date of January 8, 2023, when the coronavirus disease-19 control policy transitioned from “category B with class A management” to “category B with class B management.” Changes in the allergen profile before and after the implementation of mask wearing, home isolation, and reduced outdoor activities were compared in analyses stratified by age, sex, and season.
Results:
Post-policy adjustment, most allergen sIgE positivity rates declined, and significantly for inhalant allergens (Dermatophagoides farinae, 12.9% vs 9.9%, P = .005; mulberry tree, 12.1% vs 9.5%, P = .012; and cockroach, 9.4% vs 6.3%, P < .001) and food allergens (56.3% vs 39.9%, P < .001), especially for milk, egg white, and crab. Trends remained consistent after adjusting for age and sex through propensity score matching. Individuals aged 18 to 59 showed marked declines, except for D. farinae, cat/dog dander, and short ragweed. In males, most allergens decreased, except cat/dog dander, short ragweed, mixed trees, and mango (P < .05). In the autumn subgroup, allergen positivity rates decreased for most allergens, excluding short ragweed, Dermatophagoides pteronyssinus, cat dander, dog dander, and beef (P < .05).
Conclusion:
Policy relaxation was associated with reduced positivity rates for most inhalant and food allergens, particularly among adults, males, and during the autumn. Changes in environmental exposure significantly influenced allergen profiles.
Keywords
Introduction
Recently, the worldwide prevalence of allergic rhinitis (AR), one of the most common allergic diseases has steadily increased. AR significantly impacts quality of life, daily functioning, and social participation. 1 The World Health Organization reports indicate that global AR prevalence is 10% to 30% and exceeds 30% in some developed countries. 2 In 2019, the AR prevalence in China was 13.2% (~15% in urban areas). 3 Particularly prevalent in children and adolescents, AR coexists with asthma and allergic conjunctivitis. 4 Thus, AR is a growing public health concern and warrants more clinical and research attention.
Current clinical guidelines emphasize AR management that prioritizes allergen identification and avoidance strategies 5 ; however, their population-level impact on allergen sensitization patterns remains unclear owing to a lack of systematic evidence. Serum allergen-specific IgE (sIgE) profiles were primarily ascertained under natural conditions without notable environmental interventions. A 4-year longitudinal study demonstrated that 12.3% of adults who initially tested positive on skin prick testing subsequently tested negative whereas 8.8% of initially negative individuals developed new sensitizations. 6 A 9-year follow-up study of 6371 young and middle-aged adults (mean age: ~30 years) demonstrated that, despite a decrease in total IgE levels, the largely unchanged prevalence of IgE sensitization to common aeroallergens—including house dust mites, grasses, and cats—remained. 7 Thus, in the absence of substantial environmental perturbations, sIgE sensitization profiles within a fixed population remain relatively stable over time. During the coronavirus disease-19 (COVID-19) pandemic, widespread public health interventions, including mask wearing, home isolation, and reduced outdoor activities, substantially altered population-level environmental exposures, which potentially influenced both AR incidence and allergen-sensitization patterns. It is essential to systematically evaluate whether such large-scale environmental interventions could meaningfully shift allergen-sensitization profiles. This phenomenon has been elucidated from 2 perspectives. First, mask usage and reduced outdoor activities significantly decrease exposure to airborne allergens, such as pollen and air pollutants, to thereby alleviate AR symptoms. A multicenter study with 1824 participants confirmed significant improvement in nasal symptoms of AR nurses with routine mask use 8 ; another study reported a slowdown in AR incidence during the pandemic. 9 Second, prolonged indoor confinement may increase exposure to indoor allergens (eg, Dermatophagoides pteronyssinus, molds, pet dander). A study of 1570 dust-mite-sensitized children revealed a surge in medical visits during lockdowns and marked improvements after easing of restrictions, suggesting that changes in exposure strongly influence AR symptoms. 10 COVID-19-related shifts in exposure provide a unique “natural experimental” scenario to study allergen sensitization. However, systematic data on this topic remain limited.
This study aimed to elucidate the role of changes in environmental exposure in AR pathogenesis and to inform more precise prevention and treatment strategies. We compared inhalant- and food allergen-sensitization profiles before and after China’s January 8, 2023 policy change (the transition to “category B with class B management,” which lifted most mask and isolation mandates).
Materials and Methods
Subjects
We retrospectively analyzed sIgE data from 3715 patients who were diagnosed with AR and visited the otolaryngology outpatient clinic, General Hospital of The Central Theater Command, Wuhan, between September 2020 and October 2024. The inclusion criteria were: (1) the presence of at least 1 typical nasal allergic symptom (nasal congestion, itching, sneezing, or clear rhinorrhea); (2) nasal endoscopy revealing pale, edematous nasal mucosa with clear secretion; (3) at least 1 positive sIgE result for an inhalant allergen; and (4) no prior sIgE testing before the initial consultation; this was to prevent duplicate enrolment as some patients undergo repeated allergen testing.11,12 On January 8, 2023, China implemented the “category B with class B management” policy for COVID-19, which removed most public health restrictions, including mask wearing and home isolation. Using this cutoff date, the participants were divided into 2 groups: the pre-policy and post-policy groups (pregroup, n = 1824; postgroup, n = 1891). The overall analytical workflow is illustrated in Figure 1.
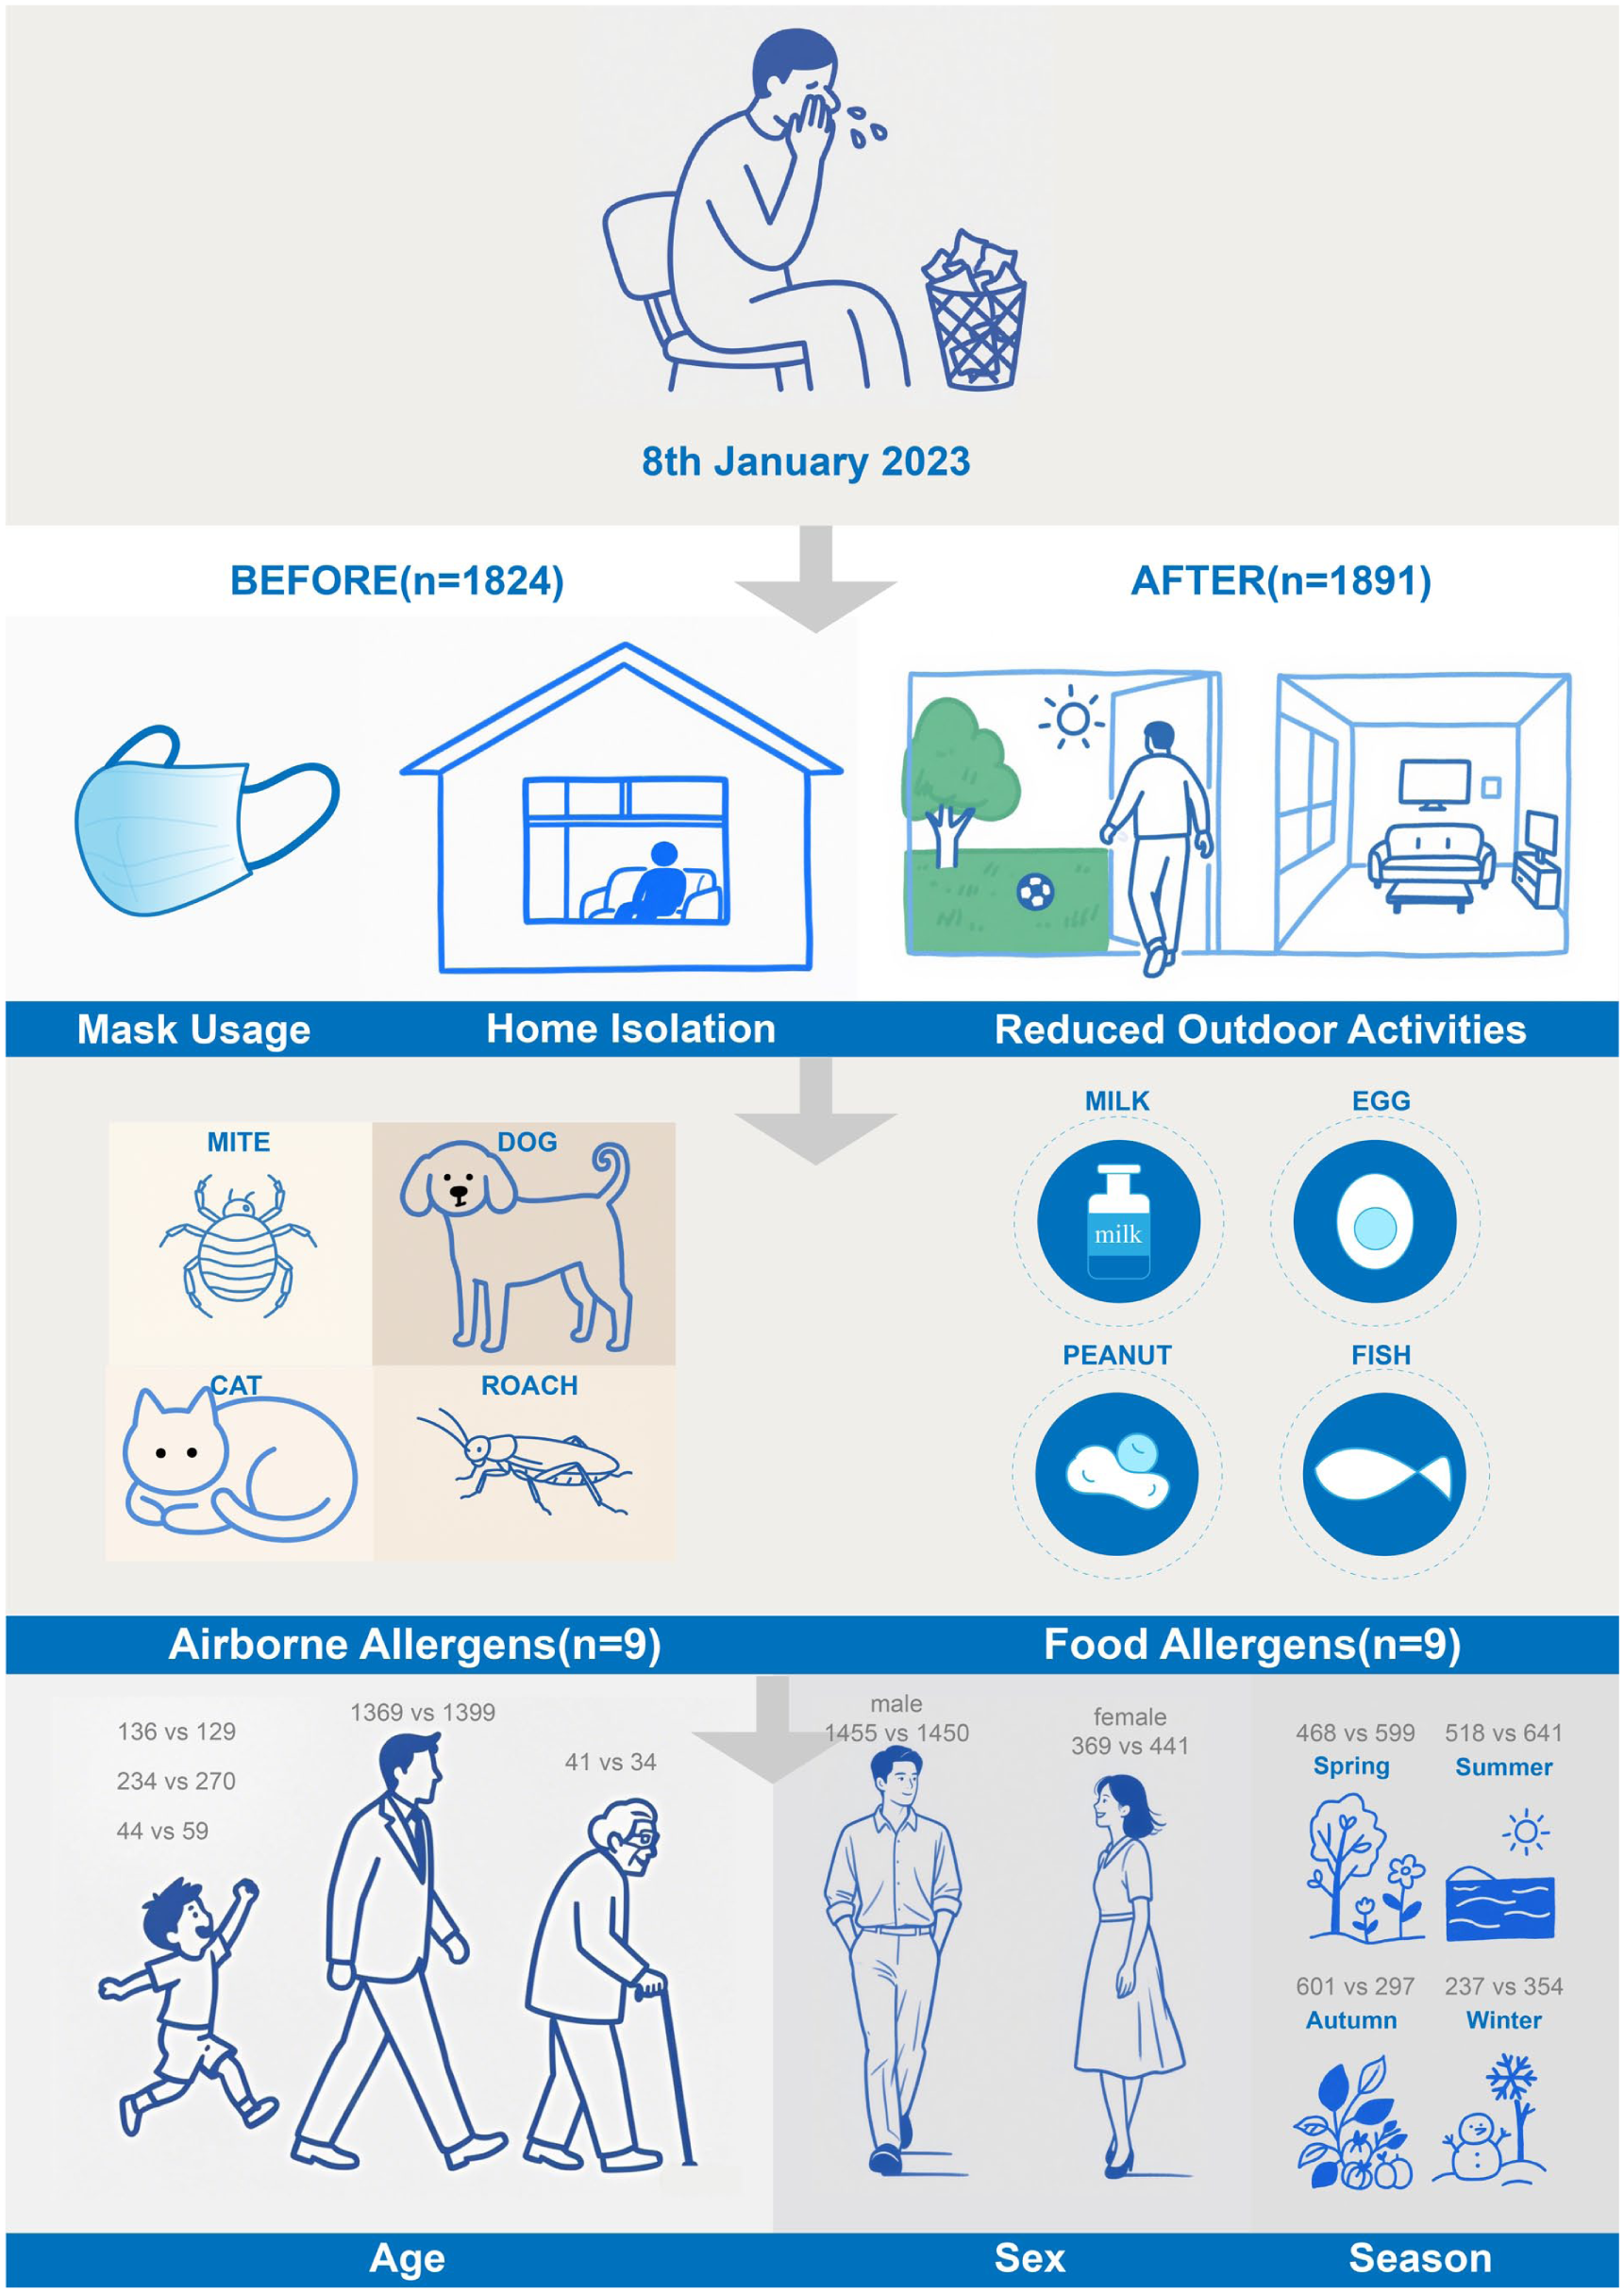
Flowchart of the overall study design. The bottom labels indicate the number of participants’ pre- and post-policy implementation.
Peripheral venous blood samples (5 mL) were collected from all participants, centrifuged, and the serum was collected for total IgE and sIgE detection, using an immunoblot assay kit (Shaoxing Medical BioTech Co, Ltd, China, WR200102Z~WR241022Z; product batch numbers in Supplementary Table 1). To ensure the reliability and consistency of allergen detection, all tests were performed by trained technicians, supervised by a quality-control officer, in a single certified laboratory using standardized protocols. Although assay kits from different batches were used, each batch underwent internal quality verification before application. Each test strip included a built-in internal control line; the absence of this line was considered test failure and triggered immediate retesting. Negative control strips in each testing batch ensured monitoring of assay specificity. To further control intra- and inter-batch variability, a quality-control officer conducted monthly random sample selection wherein ~5% of all serum samples processed underwent duplicate testing. Tests lacking the internal control line were automatically invalidated and repeated, and results demonstrated good consistency, in line with the expected variation range for immunoblot assays (<15% and 20% within and between runs, respectively). 13 All these procedures were implemented across all test batches to ensure robust and reliable sIgE detection. The sIgE panel included 9 inhalant allergens (D. pteronyssinus, Dermatophagoides farinae, cat dander, dog dander, short ragweed, mulberry tree, cockroach, mold mixture, and tree pollen mixture). Considering the increasing recognition of food allergens in AR, we tested sIgE levels for 10 common food allergens (ie, cashew, egg white, milk, fish, crab, shrimp, shellfish, beef, lamb, and mango) to ensure a more comprehensive characterization of sensitization profiles.14,15 Sensitization was defined as sIgE ≥0.35 IU/mL, 16 and sIgE levels were categorized into 7 grades—0, 1, 2, 3, 4, 5, and 6 (0-0.34, 0.35-0.69, 0.70-3.49, 3.50-17.49, 17.50-49.90, 50.00-100.00, and >100.00 IU/mL, respectively).
Statistical Analysis
All statistical analyses were conducted using R Software (version 4.3.0. R Core Team (2024). R Foundation for Statistical Computing, Vienna, Austria. https://www.R-project.org/). Continuous variables with non-normal distribution were expressed as medians with interquartile ranges (IQRs), and compared using the Wilcoxon rank-sum test. Categorical variables were presented as frequencies and percentages, and compared using the Chi-square test. To minimize intergroup confounding effects of age and sex, propensity score matching (PSM) was performed using the MatchIt Package (version 4.6.0. Daniel Ho, Kosuke Imai, Gary King, et al. https://kosukeimai.github.io/MatchIt/), by applying a 1:1 nearest-neighbor matching algorithm. 17 Subgroup analyses were conducted based on sex (male vs female), age groups (0-5, 6-12, 13-17, 18-59, and ≥60 years), and seasons of sample collection (spring: March-May; summer: June-August; autumn: September-November; winter: December-February). A 2-sided P < .05 was considered statistically significant.
Results
Overall sIgE Changes Before and After the COVID-19 “Category B With Category B Management” Policy Adjustment
Among the 3715 participants (1824 pre-policy; 1891 post-policy), the median total IgE level was significantly higher in the postgroup (455.34 vs 410.12 IU/mL, P = .025). Most inhalant allergens showed reduced positivity rates post-policy change (Table 1), notably D. farinae (12.9% vs 9.9%, P = .005), mulberry tree (12.1% vs 9.5%, P = .012), cockroach (9.4% vs 6.3%, P < .001), and mold mixture (7.4% vs 5.2%, P = .007) albeit without significant changes for D. pteronyssinus, ragweed, tree mix, and pet dander. Importantly, the Level 6 sensitization rate for D. pteronyssinus declined significantly (29.2% vs 16.6%, P < .001; Supplementary Table 2). The proportion of patients with inhalant allergen-monosensitization was significantly higher before the policy adjustment compared to after (30.7% vs 26.3%, P = .003). All food allergens demonstrated significant decreases, especially milk (21.5% vs 9.7%), egg white (15.7% vs 7.9%), and crab (14.6% vs 8.6%), which reduced overall food allergen positivity from 56.3% to 39.9% (all P < .001; Table 1). Potential confounding factors, such as age, sex, and seasonal distribution, may influence allergen-sensitization patterns, we performed PSM to adjust for these variables, with 1501 matched individuals in each group. After adjustment, some findings changed slightly: the intergroup difference in total serum IgE levels and mold mixture positivity became statistically nonsignificant (P = .453 and P = .095, respectively); the positivity rate for the tree mix allergen significantly decreased in the post-policy group (10.5% vs 7.7%, P = .009). The trends for the remaining inhalant and food allergens remained unchanged (Table 1 and Supplementary Table 2).
Baseline Characteristics and Allergen Sensitization Status of Patients With AR Before and After Category B Management, With and Without PSM.
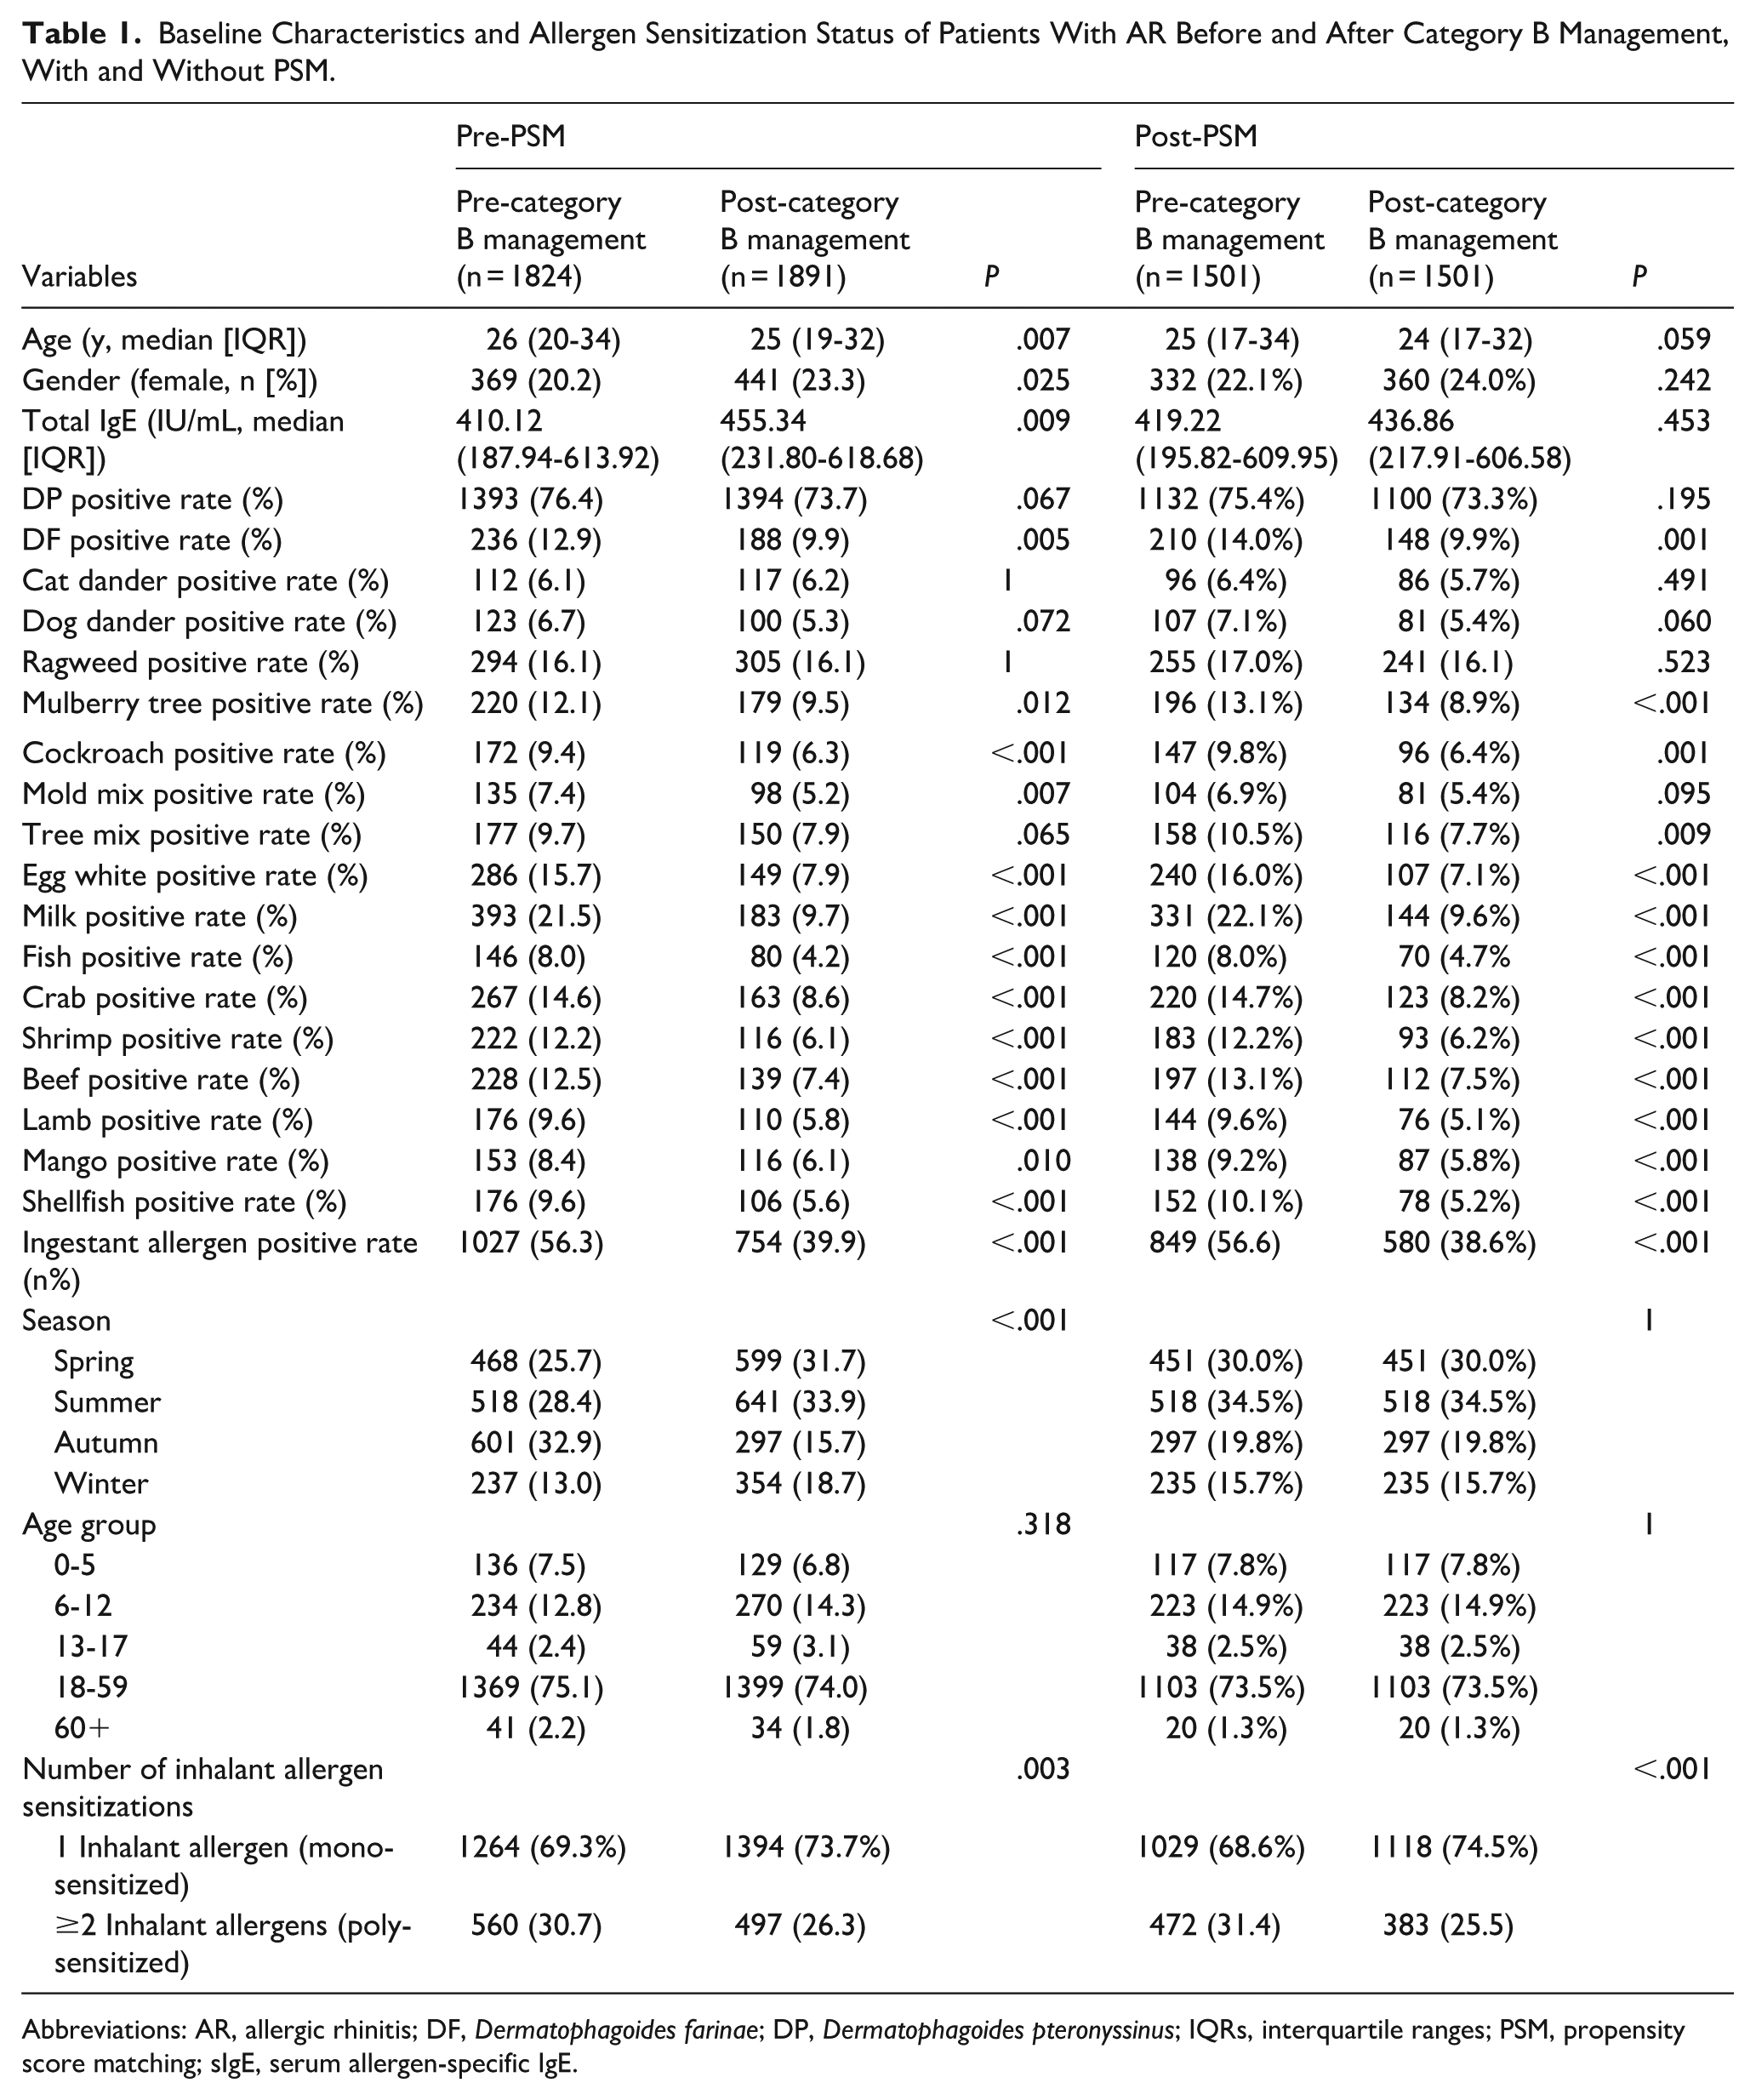
Abbreviations: AR, allergic rhinitis; DF, Dermatophagoides farinae; DP, Dermatophagoides pteronyssinus; IQRs, interquartile ranges; PSM, propensity score matching; sIgE, serum allergen-specific IgE.
Age-Group Stratified Changes in sIgE Levels
Patients were stratified into 5 age groups. In the 0 to 5 years group, only D. farinae sensitization significantly declined (13.2% vs 5.4%, P = .040; Figure 2A). Among 6 to 12 year-olds, D. pteronyssinus (level 6) sensitization (27.4% vs 14.8%, P = .004) and positivity to milk (19.2% vs 8.9%, P = .001), egg white (15.8% vs 7.4%, P = .005), and lamb (11.1% vs 4.8%, P = .013) significantly decreased, with total food allergen positivity decreasing from 50.9% to 36.7% (P = .0002; Figure 2B). No significant change was observed in the 13 to 17-year-old group (Figure 2C). In adults aged 18 to 59, total IgE increased (382.71 vs 445.52 IU/mL) whereas sensitization decreased for most allergens, except D. pteronyssinus, ragweed, and pet dander; Level 6 rates for D. pteronyssinus (29.9% vs 16.3%, P < .001) and ragweed (3.1% vs 1.6%, P = .011) significantly declined, and food allergen positivity decreased from 57.9% to 40.2% (P < .0001; Figure 2D). In patients ≥60 years, milk was the only allergen, with a significant decline of sIgE (34.1% vs 5.9%, P = .007; Figure 2E). Adults aged 18 to 59 showed the most pronounced changes (Figure 2 and Supplementary Tables 3 and 4).
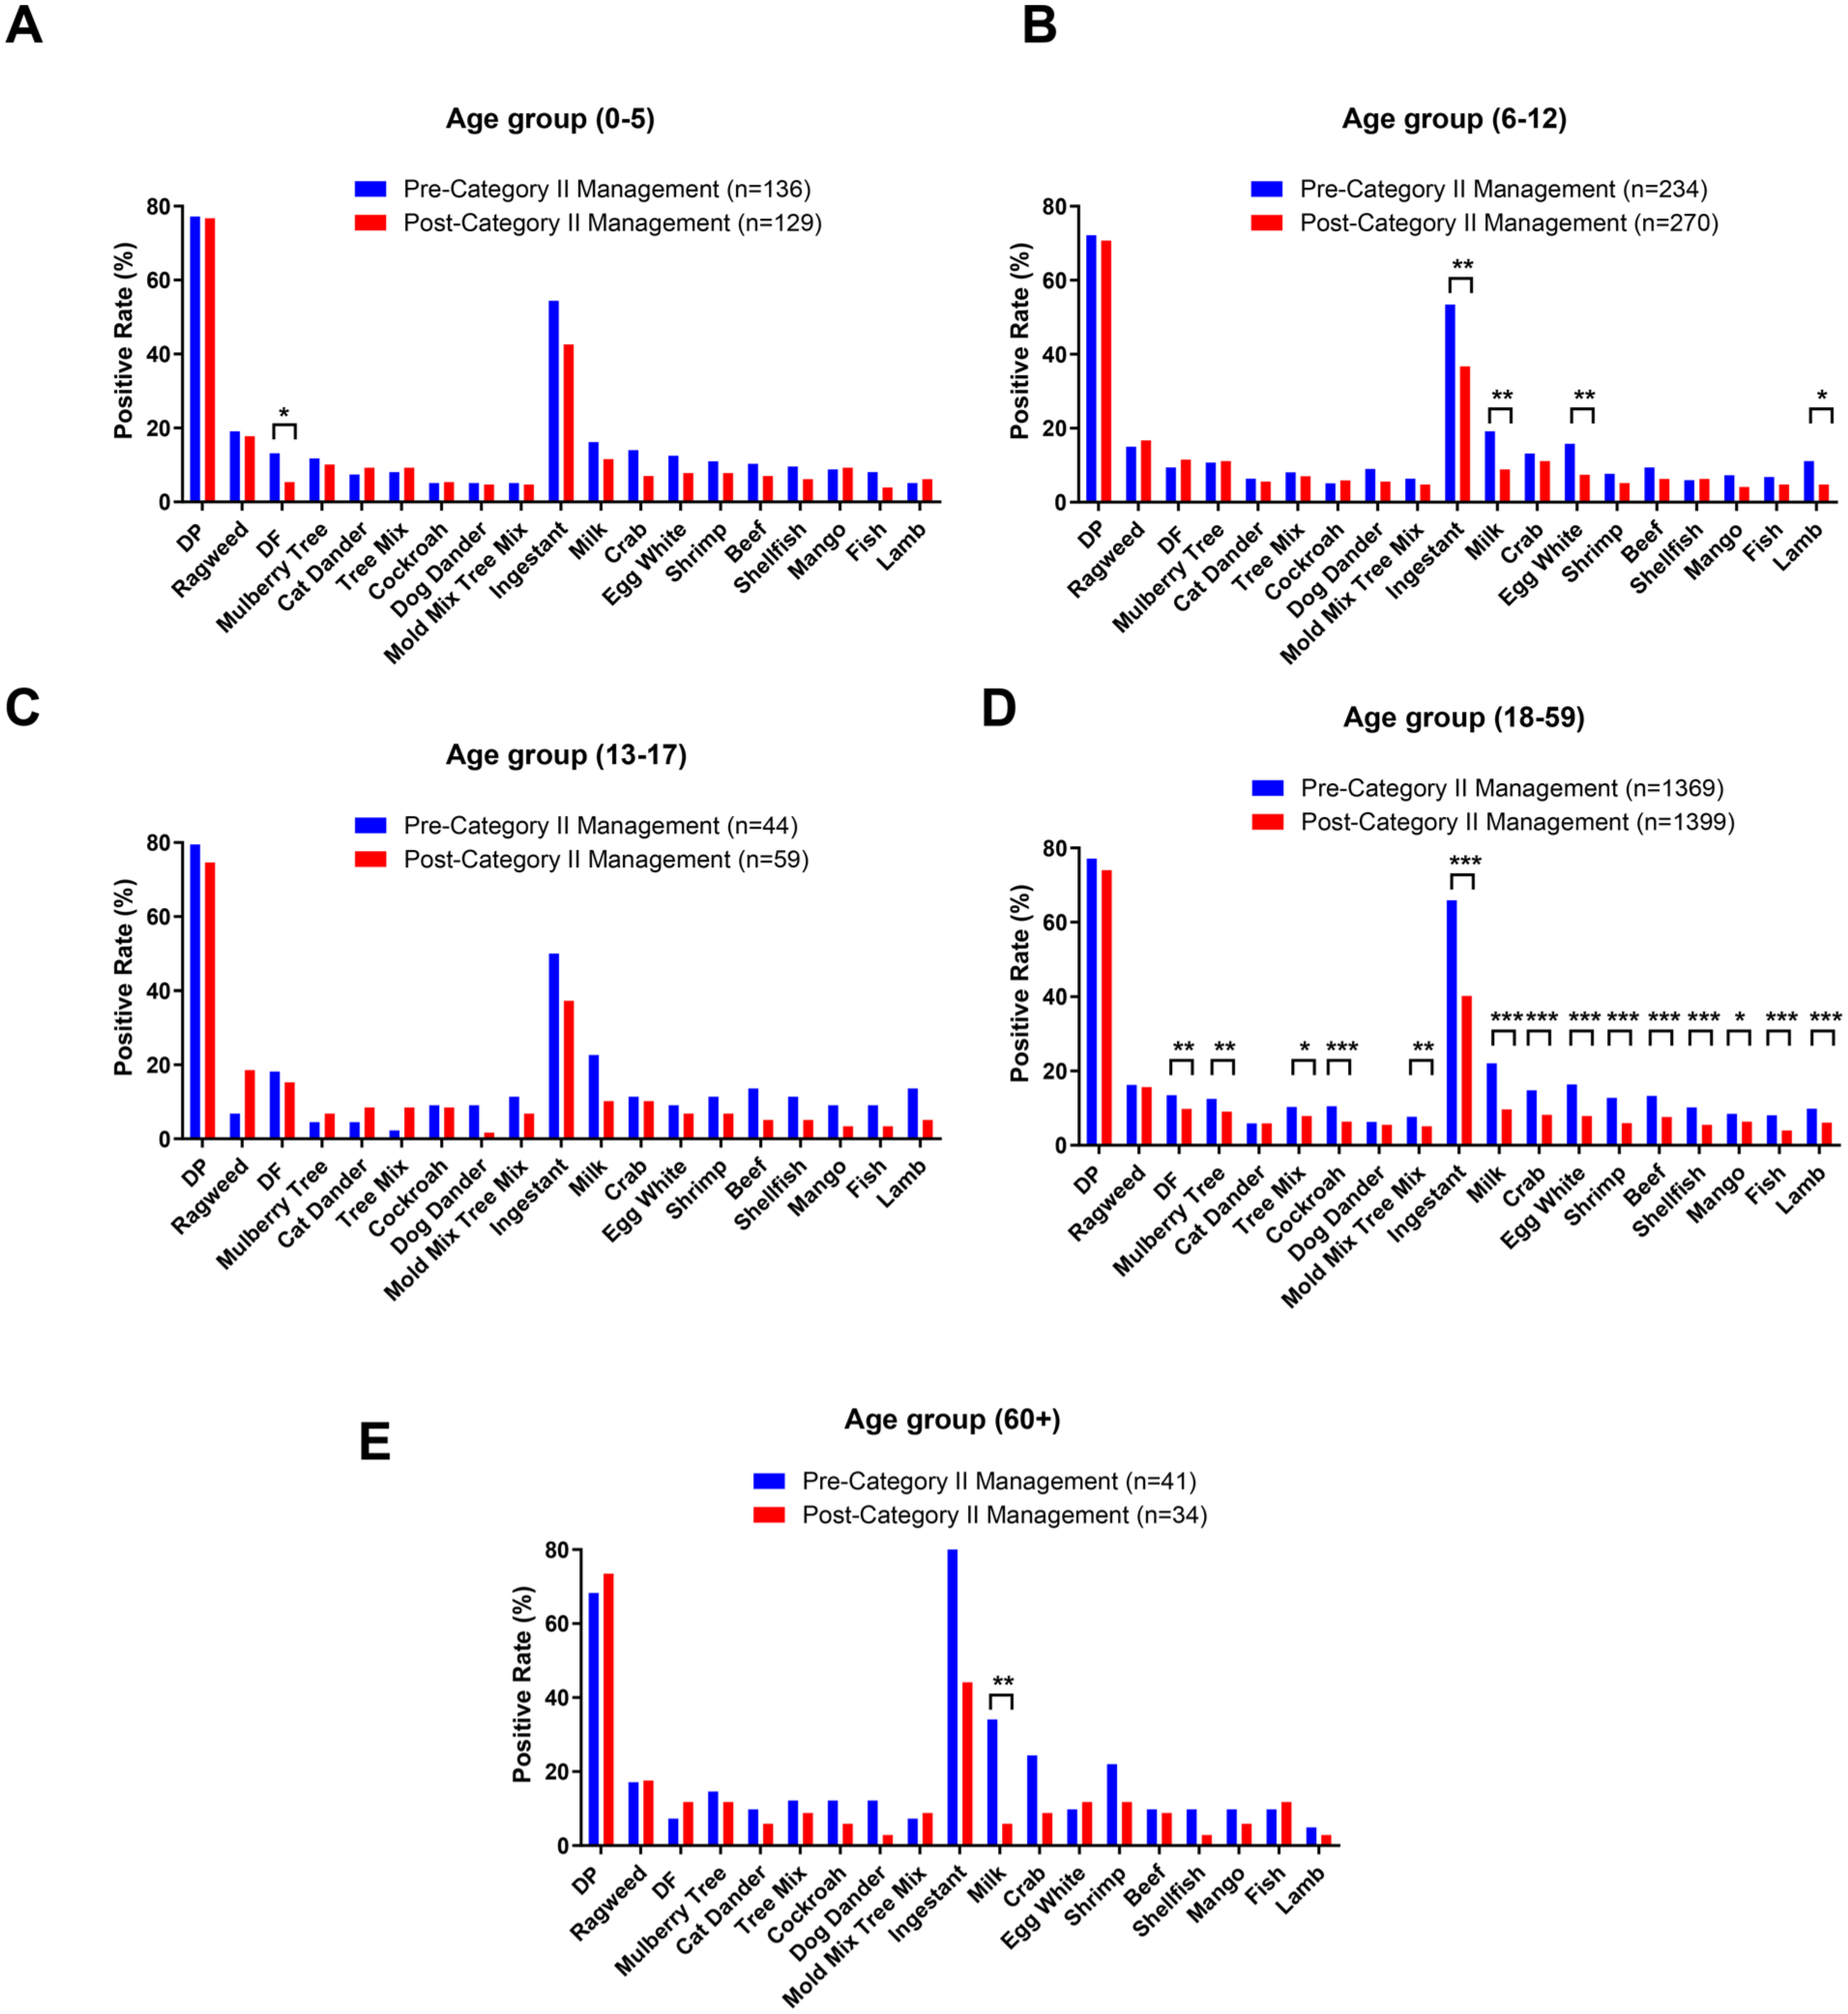
Changes in the positivity rates of sIgE in patients with AR across different age groups before and after the declaration of the COVID-19 “category B with category B management” policy. (A) 0 to 5 years, (B) 6 to 12 years, (C) 13 to 17 years, (D) 18 to 59 years. (E) ≥60 years. AR, allergic rhinitis; COVID-19, coronavirus disease-19; sIgE, serum allergen-specific IgE; DP, Dermatophagoides pteronyssinus; DF, Dermatophagoides farinae.
Sex-Stratified Changes in sIgE Levels
In male patients, total IgE significantly increased (402.36 vs 458.72 IU/mL, P = .003) whereas sensitization rates to 5 inhalant allergens—D. pteronyssinus (77.8% vs 73.4%, P = .007), D. farinae (13.0% vs 9.5%, P = .004), mulberry tree (12.3% vs 9.0%, P = .004), cockroach (9.4% vs 6.3%, P = .002), and mold mixture (7.6% vs 5.0%, P = .005)—significantly declined (Supplementary Tables 5 and 6). Food allergens decreased, except mango; positivity to milk (21.4% vs 10.2%), egg white (15.9% vs 7.9%), and shrimp (12.3% vs 6.1%) all significantly reduced, and decreased the overall positivity rate from 56.4% to 40.4% (P < .001; Figure 3A and Supplementary Tables 5 and 6). In female patients, total IgE levels remained stable (P = .895), and only IgE to dog dander significantly decreased (8.4% vs 3.9%, P = .010). However, most food allergens, including milk (22.2% vs 7.9%, P < .001), egg white (14.9% vs 7.7%, P = .002), and shrimp (11.7% vs 6.3%, P = .011), decreased significantly, reducing food allergen positivity from 56.1% to 38.1% (P < .001; Figure 3B). Males showed more widespread allergen reduction whereas females primarily exhibited reduction in food allergies.
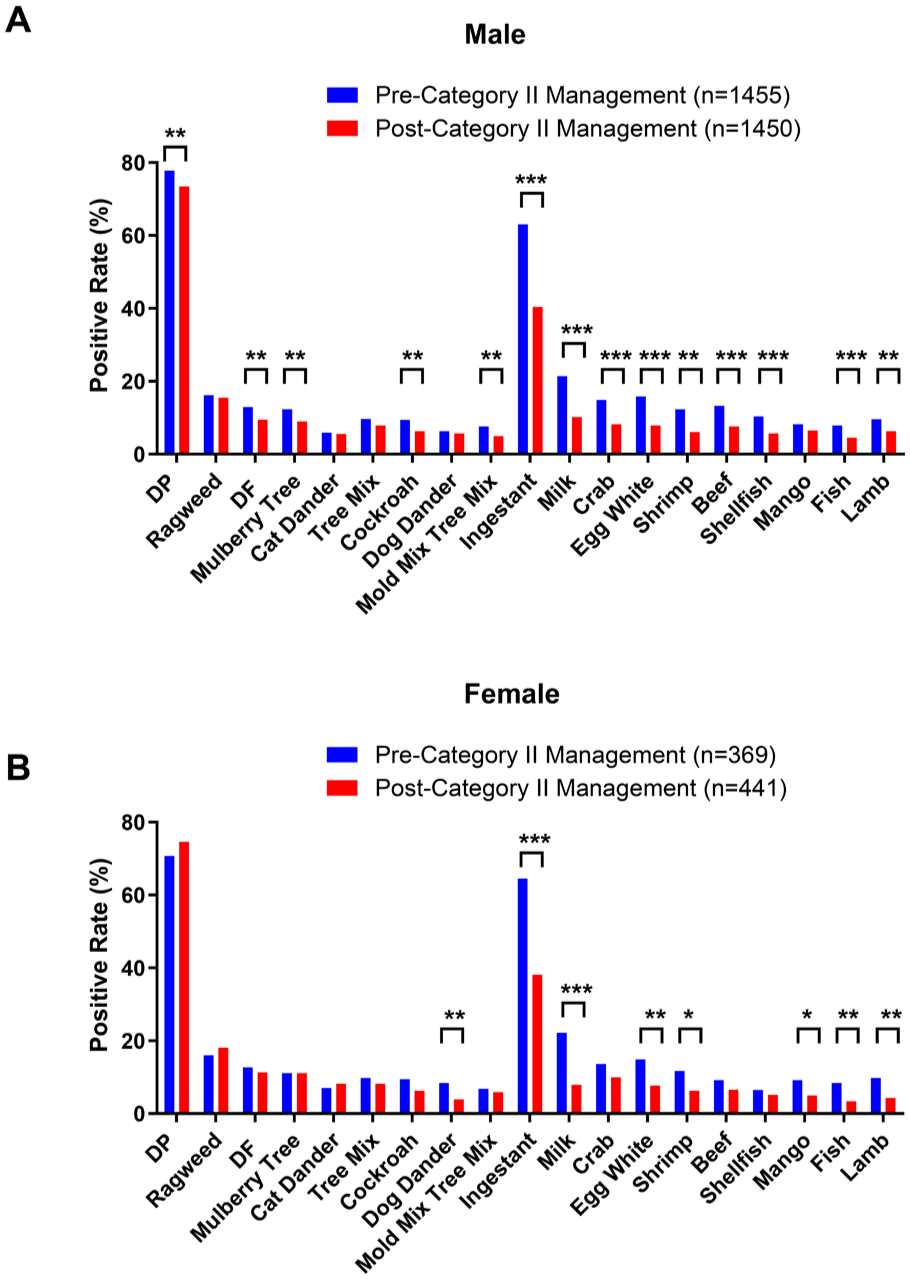
Sex-stratified changes in the positivity rates of sIgE in patients with AR before and after the COVID-19 “category B with category B management” policy. (A) Male, (B) female. AR, allergic rhinitis; COVID-19, coronavirus disease-19; sIgE, serum allergen-specific IgE; ns, no significant difference.
Seasonal Changes in sIgE
Seasonal subgroup analysis revealed varying trends (Figure 4 and Supplementary Tables 7 and 8). In spring, despite no significant change in total IgE (515.36 vs 526.69 IU/mL), positivity rates for mulberry tree (14.5% vs 8.5%), cockroach (10.3% vs 5.8%), and mold mixture (6.2% vs 3.3%) declined significantly, along with overall food allergen positivity (57.9% vs 41.6%, P < .001; Figure 4A). In summer, total IgE increased (392.90 vs 444.33 IU/mL, P = .009) as did sensitization to mulberry tree (7.3% vs 11.1%, P = .039) and tree mixture (5.2% vs 8.9%, P = .022); however, other food allergens decreased, reducing total food allergen positivity from 49.8% to 37.4% (P < .001; Figure 4B). In autumn, total IgE did not change significantly (329.53 vs 420.22 IU/mL, P = .068); however, most allergens—except ragweed, house dust, pet dander, and beef—decreased (Figure 4C), with significant reductions in D. pteronyssinus (77.4% vs 69.4%, P = .012), cockroach (12.3% vs 4.4%, P < .001), and milk (22.3% vs 8.4%, P < .001). In winter, inhalant sensitization remained stable although food allergen positivity decreased from 56.5% to 39.8% (P < .001), with significant reductions (Figure 4D) in milk (19.8% vs 10.7%, P = .003), shrimp (14.8% vs 5.4%, P < .001), and lamb (12.2% vs 4.5%, P < .001). Seasonal trends showed food allergen declines in all periods, with reductions in indoor inhalant sensitization in spring and autumn.
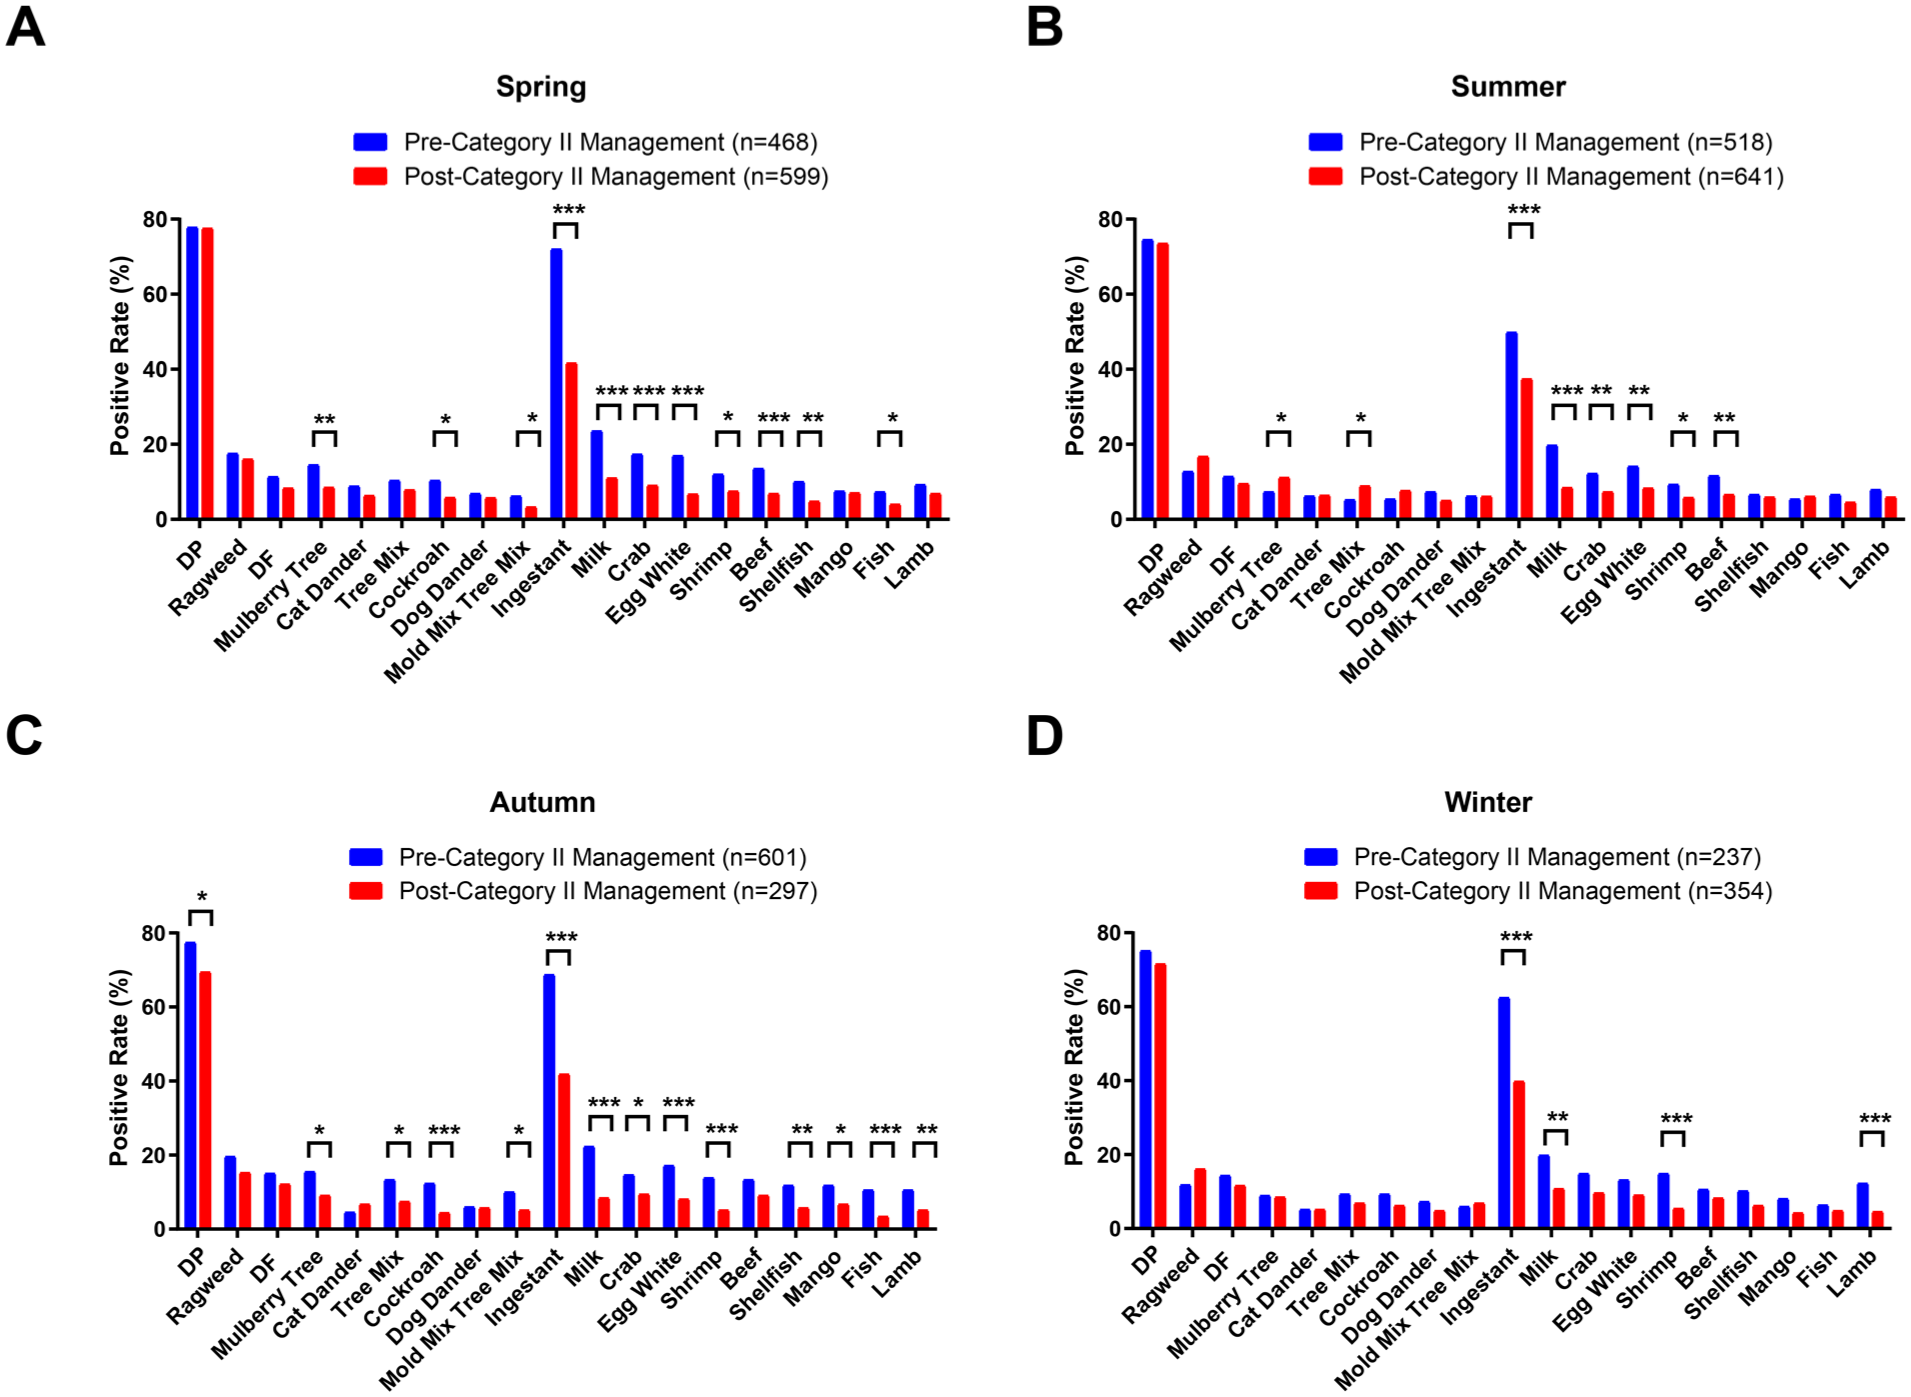
Changes in the positivity rates of sIgE in AR patients across different seasons, before and after the implementation of the COVID-19 “category B with category B management” policy. (A) Spring, (B) summer, (C) autumn, (D) winter. AR, allergic rhinitis; COVID-19, coronavirus disease-19; sIgE, serum allergen-specific IgE; DP, Dermatophagoides pteronyssinus; DF, Dermatophagoides farinae.
Subgroup Comparison Within the Pre-Policy Period
To further explore the temporal trends within the pre-policy period, we compared the early phase (September 2020-December 2021) and the late phase (January 2022-January 8, 2023). Before matching, patients in the late phase were younger (median age 25 vs 27 years, P < .001) and comprised a higher proportion of females (25.2% vs 16.4%, P < .001). Total serum IgE levels was significantly elevated in the late phase (median [IQR]: 525.17 [289.44-712.02] vs 326.61 [126.94-527.40], P < .001). After 1:1 PSM (n = 648/group), age and sex distributions were balanced (P > .05), but total IgE remained significantly higher in the late phase (P < .001). Regarding allergen sensitization, late-phase participants exhibited significantly higher sensitization rates to D. pteronyssinus (79.5% vs 71.6%, P = .001), and lower rates to D. farinae (10.5% vs 17.3%, P = .001). Ragweed, mulberry tree, cockroach, and tree mix showed notably reduced positivity in the late phase (all P < .001). For ingestant allergens, sensitization to egg white, milk, fish, shrimp, beef, mango, and shellfish were significantly lower in the late phase (all P < .05), with the overall positive rate for ingestant allergens declining from 63.9% to 48.8% (P < .001). Regarding inhalant allergen burden, the proportion of patients sensitized to ≥2 inhalant allergens (poly-sensitized) decreased from 39.8% to 25.9% (P < .001) whereas mono-sensitization increased from 60.2% to 74.1% (Table 2), further supporting a declining trend in multi-allergen sensitization even before the formal policy adjustment.
Baseline Characteristics and Allergen Sensitization Status of Patients With AR During Early and Later Category B Management, With and Without PSM.
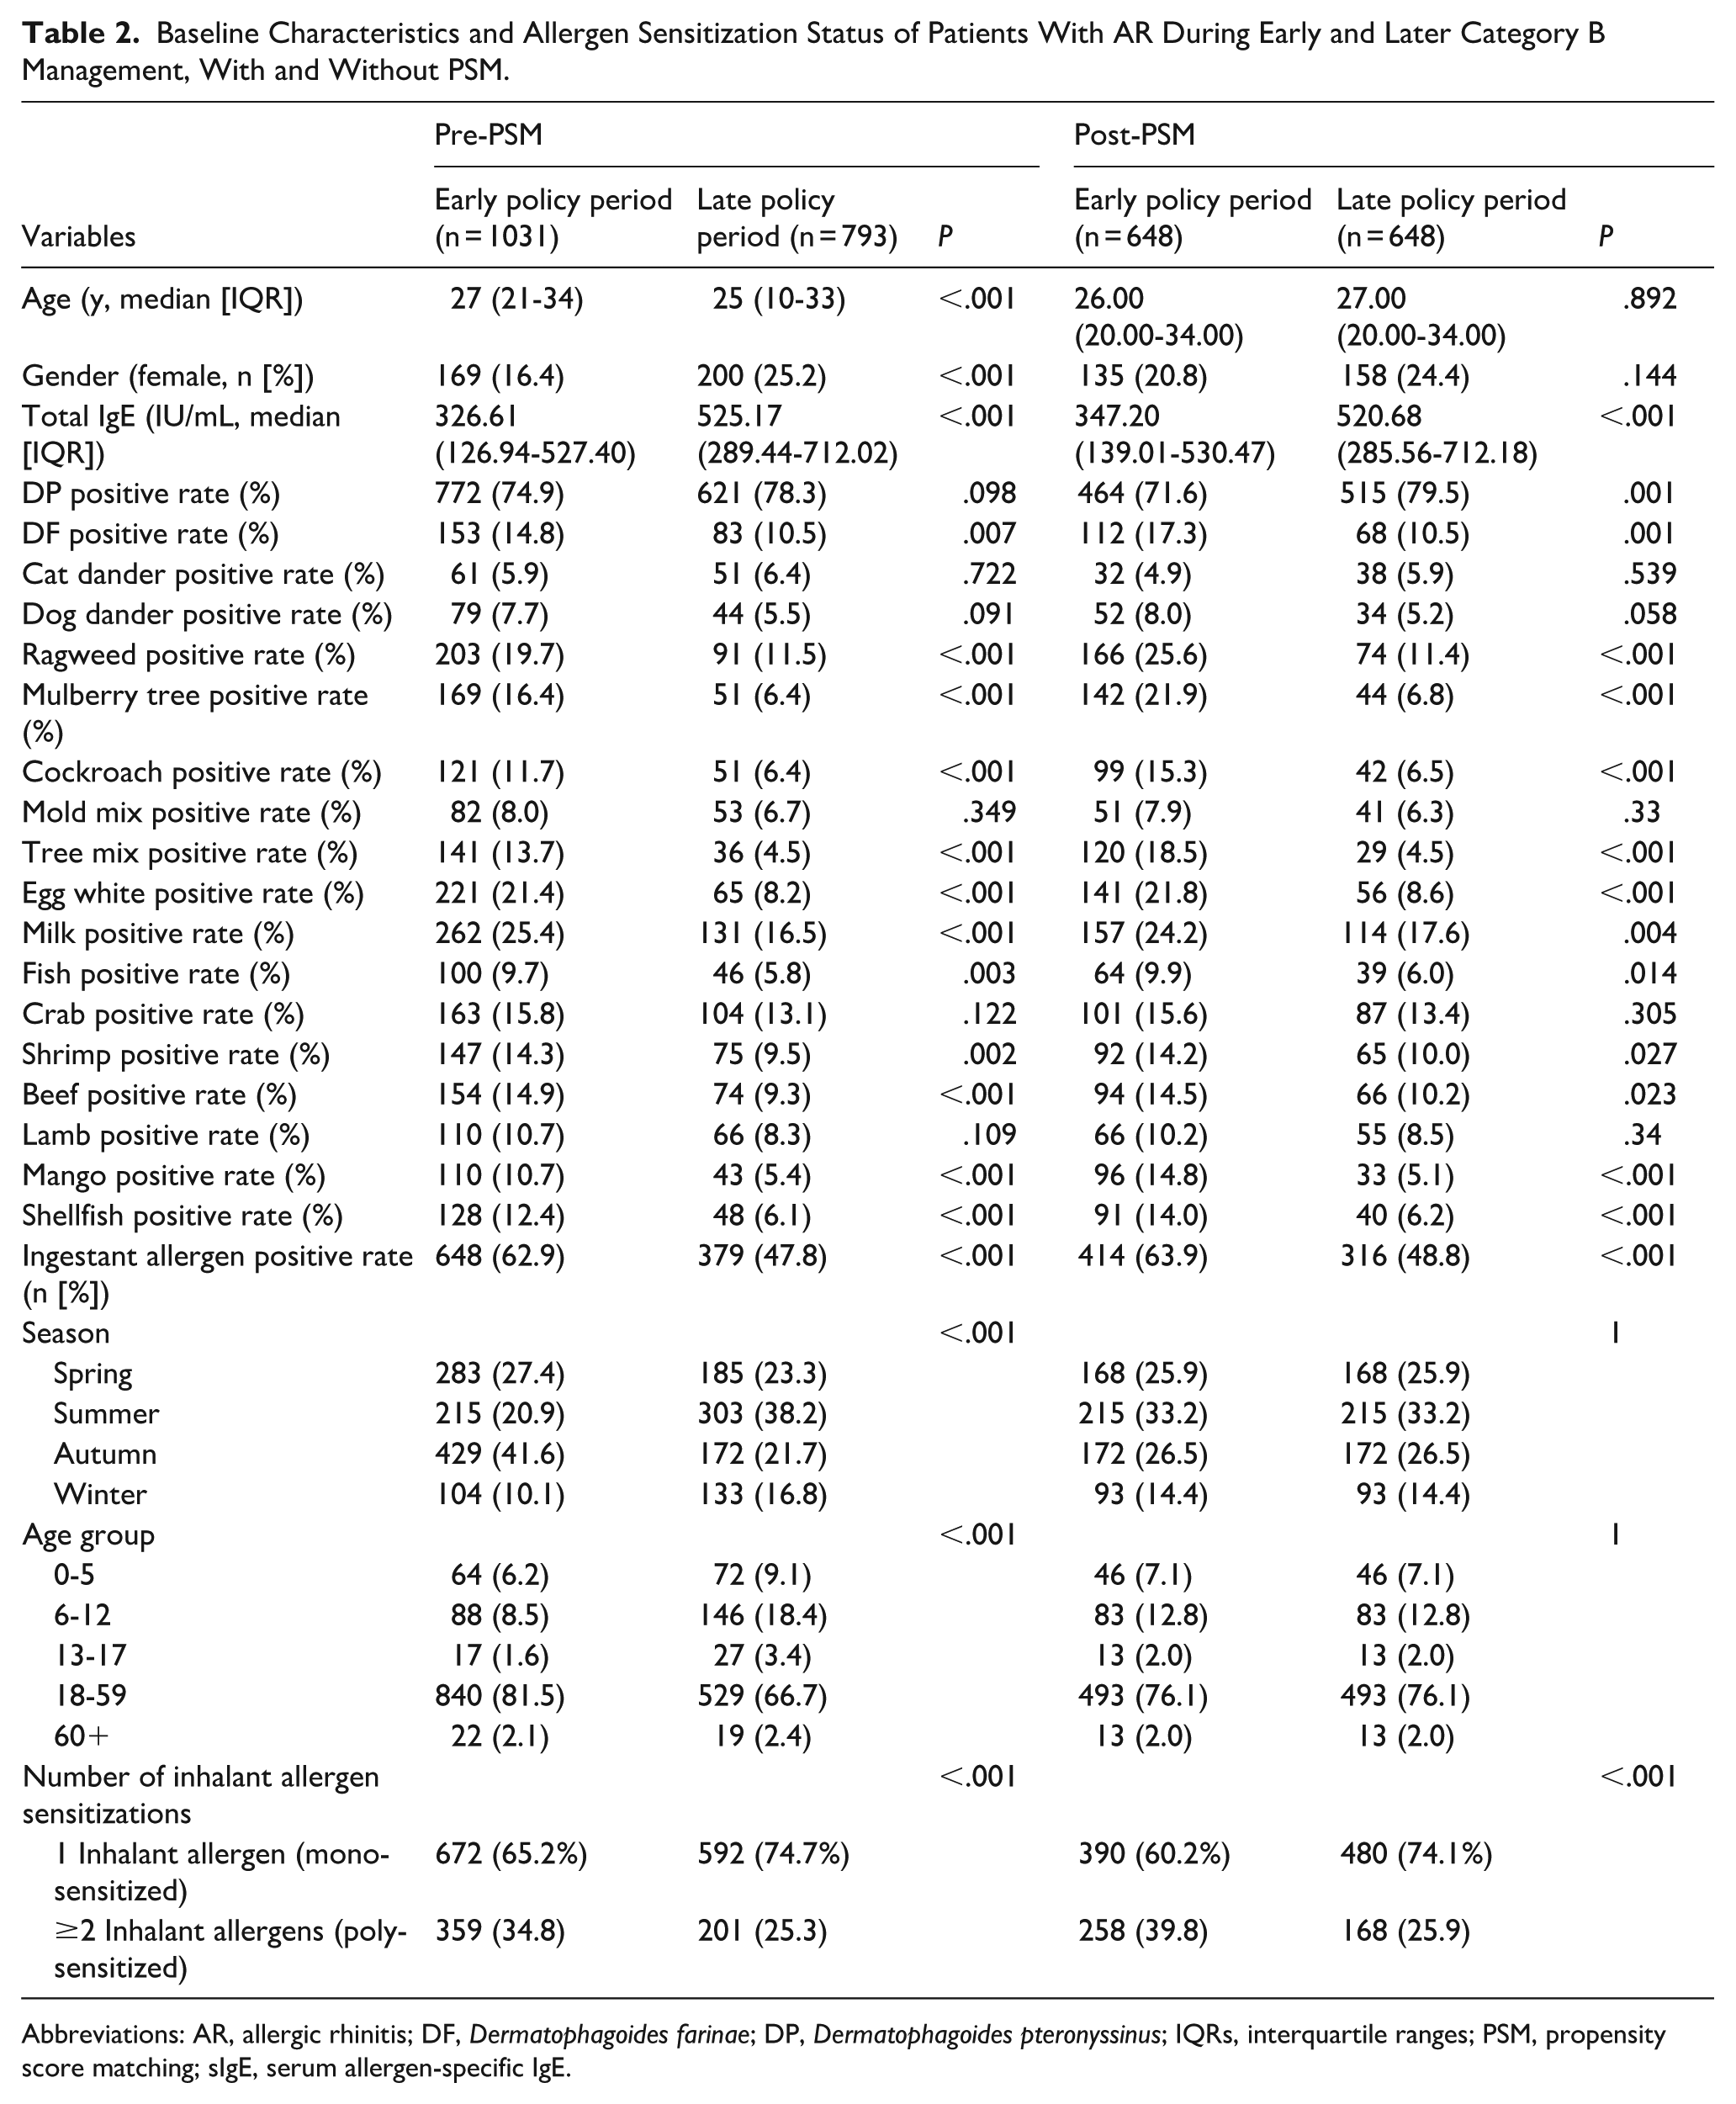
Abbreviations: AR, allergic rhinitis; DF, Dermatophagoides farinae; DP, Dermatophagoides pteronyssinus; IQRs, interquartile ranges; PSM, propensity score matching; sIgE, serum allergen-specific IgE.
Discussion
After China’s COVID-19 policy adjustment, sensitization rates to several indoor allergens among patients with AR decreased significantly. Notable reductions were seen in D. pteronyssinus (Grade 6), D. farinae, and cockroach. In contrast, most outdoor allergen sensitizations did not increase. Specifically, both overall and Grade 6 sensitization rates to the tree mix declined, along with decreased overall positivity to mulberry pollen. The proportion of patients sensitized to multiple inhalant allergens decreased. Sensitization rates to all tested food allergens significantly declined. Overall allergen-positivity rates tended to decrease after the relaxation of COVID-19 controls. This unexpected finding suggests that AR sensitization is governed by complex interactions of environmental and immune factors beyond simple exposure frequency.
A likely explanation is that strict pandemic measures had previously increased exposure to indoor allergens (from continuous home confinement); therefore, easing of restrictions reduced that exposure. Thus, sensitization to indoor allergens (Dermatophagoides, cockroach, etc) decreased after policy easing, consistent with prior reports that AR incidence increased during lockdown (from 8.2%, before 2020, to 17.3%-25.2%, during the control period). 18 The early stage of the pandemic was marked by more stringent measures—such as home confinement, widespread mask-wearing, and reduced outdoor activity; thus, we further analyzed and compared sensitization rates before and after the policy adjustment to better understand the potential impact of these interventions on AR. The results showed a general downward trend in sensitization to most allergens, with statistically significant decreases for several, such as D. farinae, whose positivity rate decreased from 17.3% to 10.5%. However, an unexpected finding was that sensitization to D. pteronyssinus increased from 71.6% to 79.5%. This trend may be explained by the influence of indoor humidity on the survival and allergenic activity of D. pteronyssinus. This species thrives at relative humidity levels of 75% to 80% whereas humidity <50% markedly limits its growth. Importantly, when humidity is excessively high (eg, >85%) or unstable for prolonged periods, mite proliferation may be suppressed. 19 During the strict lockdown period, reduced ventilation and prolonged indoor activity may have led to abnormally high or fluctuating humidity levels, which could have inhibited D. pteronyssinus growth or reduced the release of its major allergen, Derp1—resulting in lower sensitization rates in the earlier phase. After policy relaxation, with improved ventilation and shorter time spent indoors, indoor humidity may have gradually returned to the optimal range (60%-80% RH), thereby favoring D. pteronyssinus growth and allergen production. This ecological shift, combined with the high immunogenicity of Derp1, may have significantly increased sIgE detection rates even if the actual mite population increase was modest. 20
We observed a notable decline in sensitization rates to some inhalant allergens (eg, D. farinae, mulberry, cockroach, and tree pollen mixture) after the easing of COVID-19 restrictions. This trend may partly reflect the continued use of face masks during and after the pandemic, which effectively reduced exposure to airborne pollen and other particulate allergens. Immune tolerance potentially contributed to this phenomenon. Prolonged low-dose exposure to inhalant allergens can induce immunological tolerance, characterized by attenuated Th2-mediated responses, increased regulatory T cell activity, and upregulation of inhibitory cytokines, such as IL-10, thereby reducing IgE-mediated sensitization.21,22 During the extended period of pandemic restrictions, low-level exposure to indoor allergens and infiltrating outdoor allergens (eg, via open windows) possibly occurred, and potentially contributed to tolerance development. After reopening, this tolerance could have mitigated new sensitization, thereby explaining the sustained decrease in sIgE positivity. Initially, our unadjusted analysis suggested that total IgE levels increased after policy relaxation, despite an overall decrease in allergen-specific IgE positivity rates. However, after PSM, this difference in total IgE disappeared, which indicated that it was likely driven by confounding clinicodemographic variables rather than true immunological effects. Importantly, the total serum IgE and sIgE do not always correlate strongly in allergic patients. Koh et al reported only a modest predictive value of total IgE for specific IgE positivity after accounting for demographic factors. 23 Many individuals with normal total IgE levels still exhibit specific sensitizations, and vice versa, as noted in reviews of allergy diagnostics.24,25 Therefore, the lack of difference in total IgE after PSM supports the interpretation that the sIgE sensitization shifts were driven by changes in exposure patterns and possibly immune tolerance, rather than by generalized IgE elevation. Consequently, total IgE should not be interpreted in isolation when evaluating changes in allergen-sensitization profiles.
Subgroup analyses revealed heterogeneity by age and sex. Children and adolescents (0-17 years) and older patients (≥60 years) showed relatively stable sensitization profiles before versus after the policy change. These groups largely remained in similar environments (home and school) regardless of the pandemic, so their allergen exposures changed less; additionally, their immune systems (adaptable in youth, senescent in old age) may be inherently more stable.26 -28 Interestingly, among patients aged ≥60 years, only milk sensitization declined significantly (34.1%-5.9%), whereas other allergens remained stable. Besides limited environmental changes and immune senescence in this age group, the small sample size (n = 41 vs n = 34) may have amplified minor shifts. During lockdown, some older individuals may have consumed more milk owing to limited food choices or nutritional needs; however, after the restrictions were lifted, many reverted to their usual diet without milk, which possibly contributed to the decline in milk sensitization. In contrast, adults (18-59 years) showed significant changes: their total IgE increased, but sensitization rates decreased for many allergens. This may reflect lifestyle shifts: during lockdown, more cooking at home could have increased exposure to allergenic foods (nuts, dairy); after reopening and dining out, such exposures decreased. Similarly, returning to workplaces meant less time in allergen-rich indoor settings (eg, kitchens), thereby reducing indoor allergen contact. Thus, the adult immune system, while generally stable, may have readjusted to these new exposure patterns.
Sex differences emerged wherein male patients experienced a significant increase in total IgE and larger reductions in multiple allergen sensitivities; in female patients, total IgE remained unchanged, and reductions were mainly noted in food allergens. These patterns likely reflect the combined influence of behavioral changes during reopening and innate sex-based immunoregulation. Specifically, existing behavioral data suggest that, post-lockdown, men resumed outdoor movement and returned to the office more quickly than women, whereas women restricted mobility longer, undertook more domestic tasks, and maintained exposure to indoor or dietary allergens.24,25 From an immunological perspective, sex hormones modulate allergic responses differently: testosterone (predominant in men) generally suppresses Th2-mediated allergic reactions, dampening specific IgE responses; in contrast, estrogen (predominant in women) enhances humoral immunity and IgE production, promoting sustained or selective specific sensitizations. 29 Together, these factors offer a plausible explanation for our findings: men’s earlier return to work and outdoor environments likely reduced indoor allergen exposure, resulting in a broader decline of allergen sensitization even as nonspecific immune activation elevated total IgE. Women’s continued household exposure and estrogen-fueled immune responses may account for stable total IgE and more targeted reductions, mainly in food-related allergens.
These findings are consistent with published AR allergen profiles. Most studies reported dust-mite-sensitization rates of 78% to 84%,30,31 in line with our finding that >70% of patients were positive for D. pteronyssinus, both before and after the policy change. Reported cockroach sensitization rates (3%-13%) match our findings of 9.4% to 6.3%.32,33 Similar findings were seen for mold sensitization prevalence (1.5%-22.9%).33 -37 Food allergen patterns vary by region: for example, Saudi AR patients frequently have high sensitization to egg white, egg yolk, and milk, whereas Polish children with AR most frequently react to milk, egg white, and hazelnuts.38,39 Our cohort differs somewhat, but shows milk and egg white as the most common food allergens, which suggests both regional differences and global similarities.
This study has some limitations. The single-center retrospective design confers a risk of selection bias, and the generalizability of the results is uncertain. Environmental allergen levels were not measured, and individual exposure histories were not tracked. Behavioral changes during different phases of the pandemic (eg, mask use, indoor time) were not recorded, which limits the determination of a direct causal relationship between policy changes and sensitization trends. Multicenter, prospective studies—possibly incorporating longitudinal immune profiling or environmental monitoring—are needed to clarify how exposure patterns influence population-specific AR sensitization and immune responses.
Conclusions
Large-scale changes in environmental exposures caused by COVID-19 policy adjustments have altered allergen sensitization patterns in AR patients. These novel insights into how mask wearing, home isolation, and reduced outdoor activity reshaped AR pathogenesis potentially support the development of precise, individualized AR-prevention and -treatment strategies.
Supplemental Material
sj-xlsx-1-ear-10.1177_01455613251392127 – Supplemental material for Environmental Exposure Shifts and Their Impact on Allergen-Sensitization Profiles in Allergic Rhinitis: A Retrospective Pre–Post COVID-19 Policy Study in Wuhan, 2020 to 2024
Supplemental material, sj-xlsx-1-ear-10.1177_01455613251392127 for Environmental Exposure Shifts and Their Impact on Allergen-Sensitization Profiles in Allergic Rhinitis: A Retrospective Pre–Post COVID-19 Policy Study in Wuhan, 2020 to 2024 by Ting Cui, Guang Yang, Yue-Bin Yang, Er-Bao Liu, Peng Huang, Bin Ruan and Chang-Liang Yang in Ear, Nose & Throat Journal
Footnotes
Ethical Considerations
This study was approved by the Ethics Committee of the General Hospital of The Central Theater Command (approval number [2024]128-01).
Consent to Participate
The requirement for written informed consent was waived by the Ethics Committee owing to the retrospective nature of the study and the use of fully anonymized clinical data.
Author Contributions
Ting Cui and Guang Yang were responsible for the study design, data analysis, and manuscript drafting. Yue-Bin Yang and Er-Bao Liu collected and organized the clinical data and assisted with data interpretation. Peng Huang and Bin Ruan participated in the literature review and contributed to manuscript revisions. Chang-Liang Yang conceived and supervised the study, critically revised the manuscript.
Funding
The authors received no financial support for the research, authorship, and/or publication of this article.
Declaration of Conflicting Interests
The authors declared no potential conflicts of interest with respect to the research, authorship, and/or publication of this article.
Data Availability Statement
The data that support the findings of this study are available from the corresponding author upon reasonable request.
Supplemental Material
Supplemental material for this article is available online.
References
Supplementary Material
Please find the following supplemental material available below.
For Open Access articles published under a Creative Commons License, all supplemental material carries the same license as the article it is associated with.
For non-Open Access articles published, all supplemental material carries a non-exclusive license, and permission requests for re-use of supplemental material or any part of supplemental material shall be sent directly to the copyright owner as specified in the copyright notice associated with the article.