
Abstract
Objective:
To investigate the correlation of nasal obstruction symptom score (NOSE) and visual analogue scale (VAS) score with standardized computed tomography cross-sectional areas (CT-CSA).
Methods:
In this cross-sectional study, candidates for functional septo(-rhino)plasty due to chronic nasal obstruction, with a preoperative CT scan were eligible. Subjects filled out a NOSE (0-100) score and a VAS (0-4) score. Nine CT-CSA were segmented. We measured the absolute difference of the right from the left nose as a measure of asymmetry. We examined the correlation of NOSE and VAS score with the mean value of asymmetry of these CT-CSA and with the largest asymmetry among these CT-CSA.
Results:
In 40 subjects, the median value (minimum-maximum) of NOSE and VAS score was 75.0 (20-95) and 3.0 (1-4), respectively. NOSE score correlated significantly with VAS score (r = 0.74; P < .001). The median value of the mean asymmetry and largest asymmetry was 0.37 (0.18-1.11) and 0.83 (0.33-1.94) cm2, respectively. NOSE score correlated neither with the mean asymmetry (r = 0.28; P = .085) nor with the largest asymmetry (r = 0.22; P = .18). VAS score correlated significantly, still poorly, with the mean asymmetry (r = 0.51; P < .001) and lesser with the largest asymmetry (r = 0.39; P = .012).
Conclusion:
Despite the limited sample size, VAS score correlated significantly, but poorly, with CT-CSA in candidates for functional nasal surgery. On the contrary, NOSE score did not correlate with CT-CSA preoperatively.
Introduction
The nasal speculum was developed in its current form by Peret (18th century) and Wilhelm Kramer (1801-1875). 1 According to a survey among otorhinolaryngologists, it is the most-frequently-used instrument to examine the nose, 2 preceding endoscopy, rhinometric procedures and imaging.
The advantages of the nasal speculum include minimal costs, worldwide availability, easiness of use and documentation of several parameters. Among others, these would be hyperplasia and color of the inferior turbinate, amount and color of secretions, hyperplasia and color of the mucosa, presence and grade of nasal polyps, as well as the deviation and grade of the deviation of the nasal septum. The latter is one of the most essential findings before indicating septoplasty, one of the most frequent otorhinolaryngologic procedures. 3
Hardcastle et al investigated the agreement of those parameters among 2 different examiners. The authors found a Cohen’s kappa value of 0.25, 4 which is considered poor, according to Greve and Wentura. 5 Furthermore, Cohen’s kappa value at 2 different timepoints among the same examiner was 0.43, 4 which might be considered barely acceptable. 5
The results of Hardcastle et al indicate the necessity of objectifying the findings of rhinoscopy with the nasal speculum. The color of the inferior turbinate and the mucosa, and the amount and color of secretions might be hard to objectify. On the contrary, hyperplasia of the inferior turbinate and the mucosa, and the grade of the deviation of the nasal septum result into the nasal airway, from which the nasal airflow passes through. The nasal airway could summarize the hyperplasia of the inferior turbinate and/or the mucosa, as well as the degree of nasal septum’s deviation into 1 parameter, that is, the size of the nasal airway. Therefore, some of rhinoscopy’s findings with the nasal speculum could be potentially objectified as the size of the nasal airway.
The objectification should be reproducible, not error-prone, verifiable and not examiner dependent. These characteristics can be found in computed tomography (CT), since it depicts the exact nasal anatomy. Recently, several studies have investigated the importance of standardized cross-sectional areas (CSA), perpendicular to the direction of the nasal airflow, defined by bony landmarks (CT-CSA).6 -8 Here, the authors found more narrow CSA in subjects with nasal obstruction due to skeletal nasal obstruction than those in trauma controls. These were studies with a newly-introduced design. They used standardized CT-CSA, perpendicular to the direction of the nasal airflow, defined by bony landmarks that compared subjects with and without clinically-relevant nasal obstruction at a hospital-based setting.
Nevertheless, due to the absence of subjective assessment scores of nasal patency, these studies investigated nasal obstruction in cases and controls qualitatively, not quantitatively; that is, they did not investigate to what extent the size of the nasal airway could contribute to nasal obstruction.6 -8 Obviously, the size of the nasal airway is not the only parameter, which affects the feeling of breathing through the nose. Mucosal factors, that is, allergies or irritants, contribute to an unknown extent to the feeling of breathing through the nose. Also, there is a bidirectional causal complex relationship between nasal obstruction and psychological factors. 9 Guven and Gorgulu concluded that the preoperative mental state of patients undergoing septoplasty and inferior turbinate ablation surgery affects postoperative satisfaction and quality of life. 10 Indeed, Chandler and Patterson informed about the psychosomatic nasal disorder back in 1986. 11 Moreover, the subjective perception of airflow is mediated by the trigeminal system.12,13 Specifically, Konstantinidis et al reported that the trigeminal function of 21 subjects with empty nose syndrome after partial or total turbinectomy was significantly more impaired than the trigeminal function of 18 subjects without empty nose syndrome after partial or total turbinectomy. 13
In this study, we intended to investigate the correlation of CT-CSA with subjective assessment of nasal patency. We aimed to identify to what extent the objective findings of rhinoscopy with the nasal speculum, that is, the size of the nasal airway in the CT scan, contribute to nasal obstruction in candidates for septoplasty or septorhinoplasty.
Patients and Methods
Study Design
This was a cross-sectional study with prospective data collection. Subjects presenting for septoplasty or septorhinoplasty with a preoperative CT scan of the head and face, between February 1, 2023, and January 31, 2025, at the First Department of Otorhinolaryngology – Head and Neck Surgery, Metropolitan General, Athens, Greece, were eligible. Eligible subjects filled out preoperatively a NOSE score, 14 and a VAS score of breathing through the nose (between 0 and 4). Subjects with clinically-relevant opacification in the nasal cavity or paranasal sinuses, facial or cephalic dysmorphic syndromes, or facial bone trauma were excluded. The local institutional review board approved the study (23-01-2023/501).
Imaging Parameters and Segmentation
CT used a slice thickness of 0.8 mm, with a window width 1500 and a window level of 300. Segmentation was carried out in the RadiAnt DICOM Viewer (version 2023.1- 2025.1; Medixant, Poznan, Poland).
Using multiplane reconstructions, axial, sagittal and coronal planes were simultaneously visualized in a multi-window display. Firstly, the midsagittal section was defined in the axial plane by setting the caudal nasal septum in the midline. Then, the bony landmarks for the desired CSA were defined in the sagittal plane. Lastly, the area of the right and left CSA were measured separately in the coronal plane (2D segmentation). Measurements were carried out by a single investigator, which was an otorhinolaryngologist, as in previous studies.6 -8 The investigator used the mouse to outline the right and left airspace of the nasal cavity appearing black on CT, with the drawing polygon function, exactly on the border between the black space of the nasal airway and the grey area of the surrounding tissue.6 -8 The grey area of the surrounding tissue was the mucosa, which was not included in the segmentation of the CSA. Therefore, possible mucosal congestion and decongestion would result in less or more airway and smaller or larger CSA, respectively.
According to the previous studies, we examined 8 CT-CSA, perpendicular to the direction of the nasal airflow (Figure 1). These were defined by bony landmarks, defined in a midsagittal plane.6 -8 The latter allowed for standardization and reproducibility.
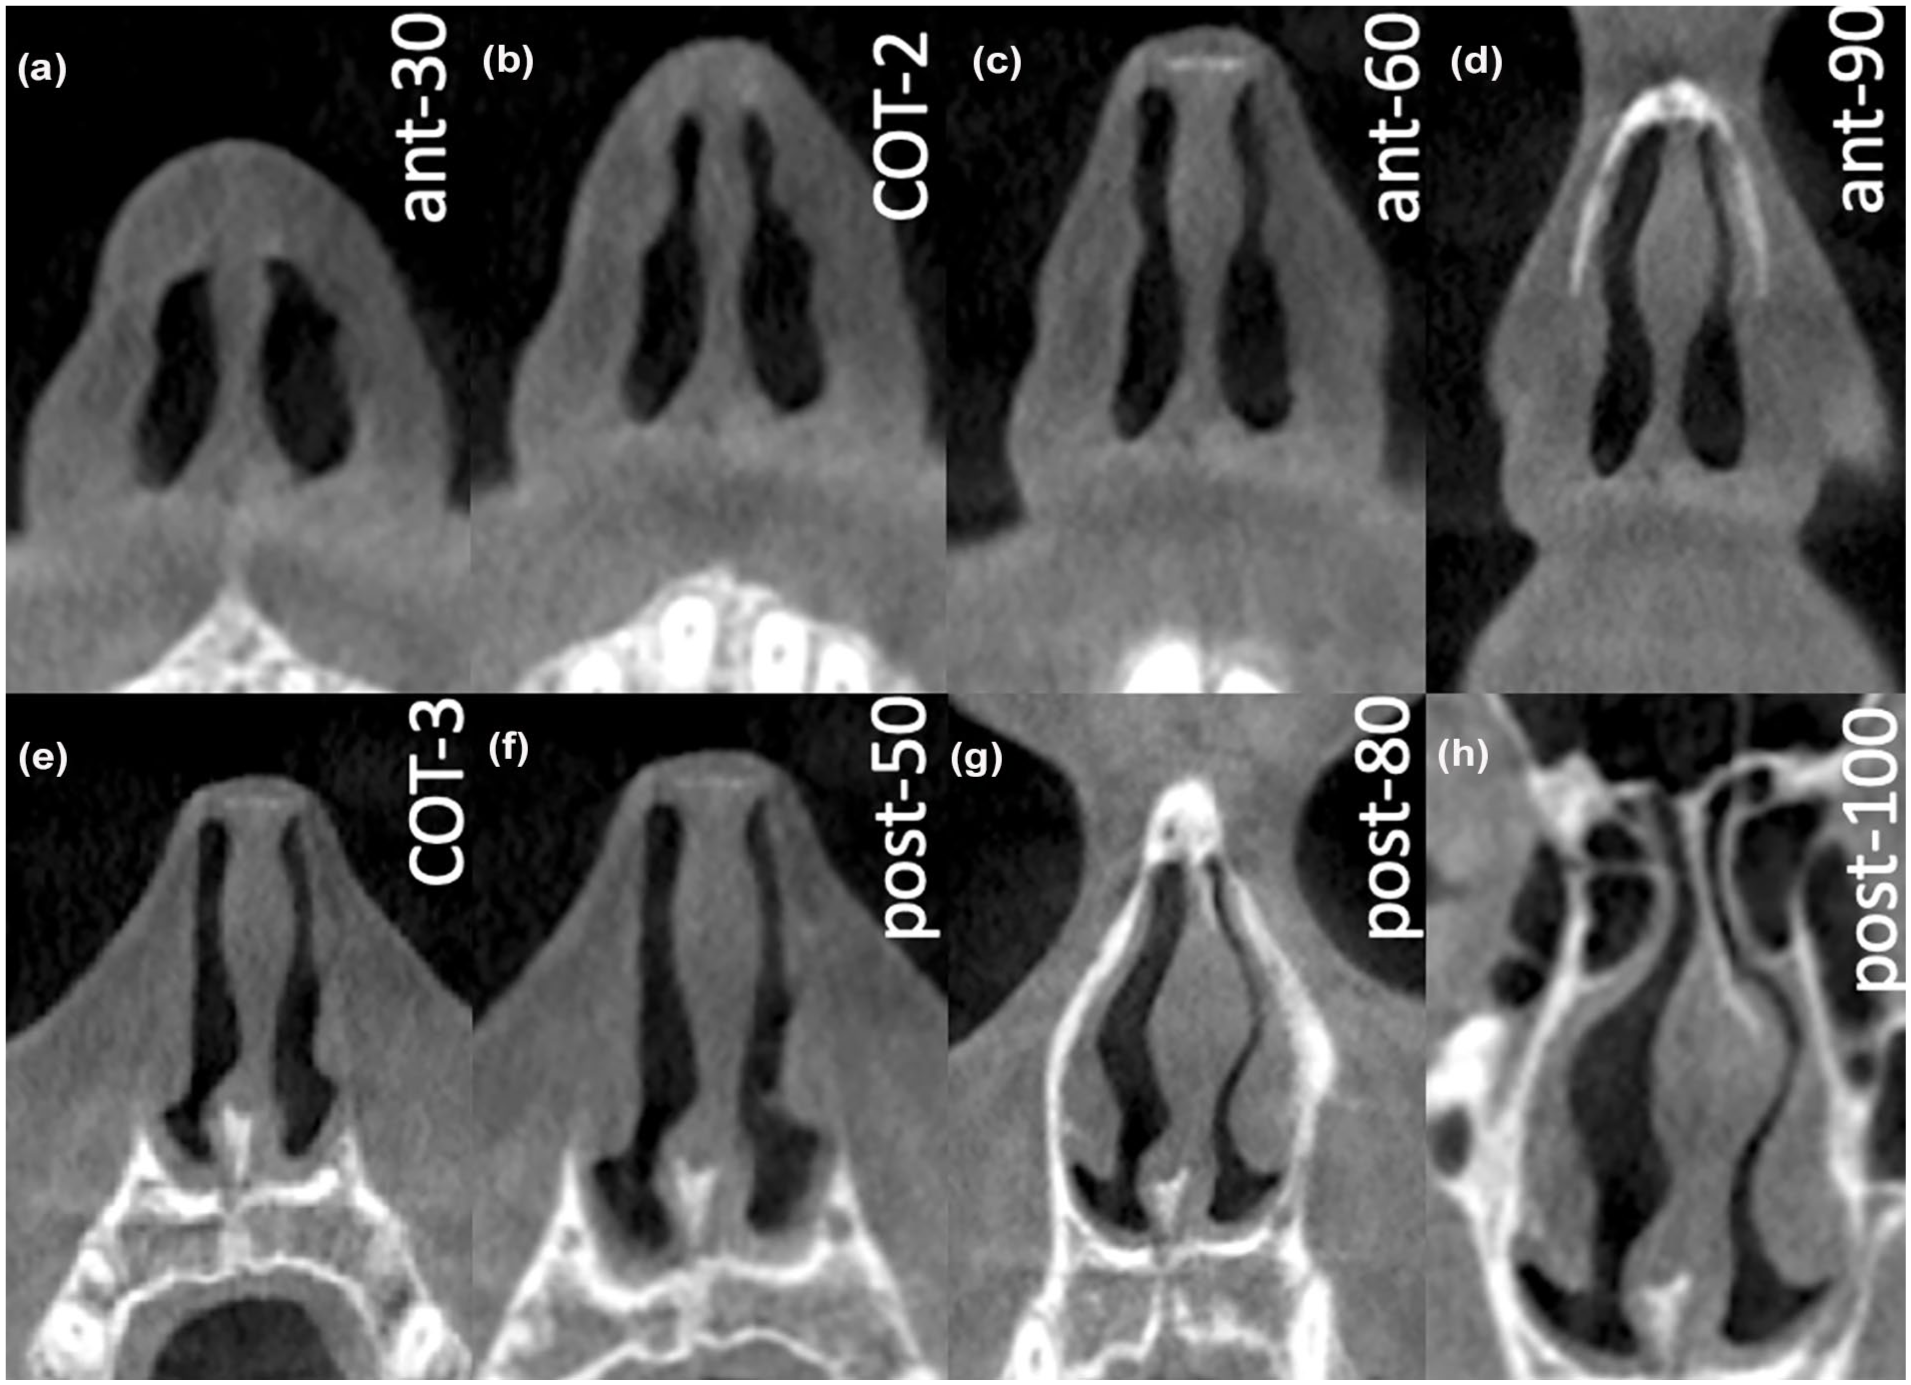
CT-CSA in the anterior nose: (a) CT-CSAant-30, (b) CT-CSACOT-2, (c) CT-CSAant-60 and (d) CT-CSAant-90; and in the posterior nose: (e) CT-CSACOT-3, (f) CT-CSApost-50, (g) CT-CSApost-80 and (h) CT-CSApost-100. CT-CSA, computed tomography cross-sectional areas.
Computed Tomography Cross-Sectional Areas
Four CT-CSA were located anterior the piriform aperture. This area is considered as the area with the highest resistance to the airflow. 15 The first was defined by the anterior nasal spine and the posterior edge of the inferior ostium of the incisive canal (tilted about 30° to the nasal floor; CT-CSAant-30). The second was defined by the anterior nasal spine and the anterior edge of the intranasal suture (tilted about 60° to the nasal floor; CT-CSAant-60). The third was defined by the anterior nasal spine and the most ventral part of the frontal bone (tilted about 90° to the nasal floor; CT-CSAant-90). 6 The fourth CT-CSA was defined by the anterior nasal spine and the middle of a line drawn along the nasal dorsum that started from the anterior edge of the intranasal suture (K-area) and ended when it intersected the line of the CT-CSAant-30 (a plane similar to the second plane described by Cottle; CT-CSACOT-2). 8
The rest 4 CT-CSA were located posterior the piriform aperture. The fifth CT-CSA was defined by the anterior border of the intranasal suture and the most cranial edge of the premaxilla at the level of the anterior borders of the ascending processes of the maxilla (a plane similar to the area 3 described by Cottle; CT-CSACOT-3). 8 The sixth CT-CSA was defined by the anterior edge of the superior ostium of the incisive canal and the anterior edge of the intranasal suture (tilted about 50° to the nasal floor; CT-CSApost-50). The seventh CT-CSA was defined by the anterior edge of the superior ostium of the incisive canal and the most ventral part of the frontal bone (tilted about 80° to the nasal floor; CT-CSApost-80). The 8 CT-CSA was defined by the anterior edge of the superior ostium of the incisive canal and the posterior edge of the inferior ostium of the incisive canal (tilted about 100° to the nasal floor; CT-CSApost-100). 7
Lastly, we segmented an additional CT-CSA, which was located near the choanae (CT-CSAchoanae). Here, at the sagittal view, a line was set between the anterior and posterior nasal spine to standardize the tiltation of the coronal plane, that is, the axial plane. Subsequently, the sagittal view was set at the level of the crista galli. Then, we measured the CSA at the coronal view at the level of the posterior border of the crista galli (Figure 2).
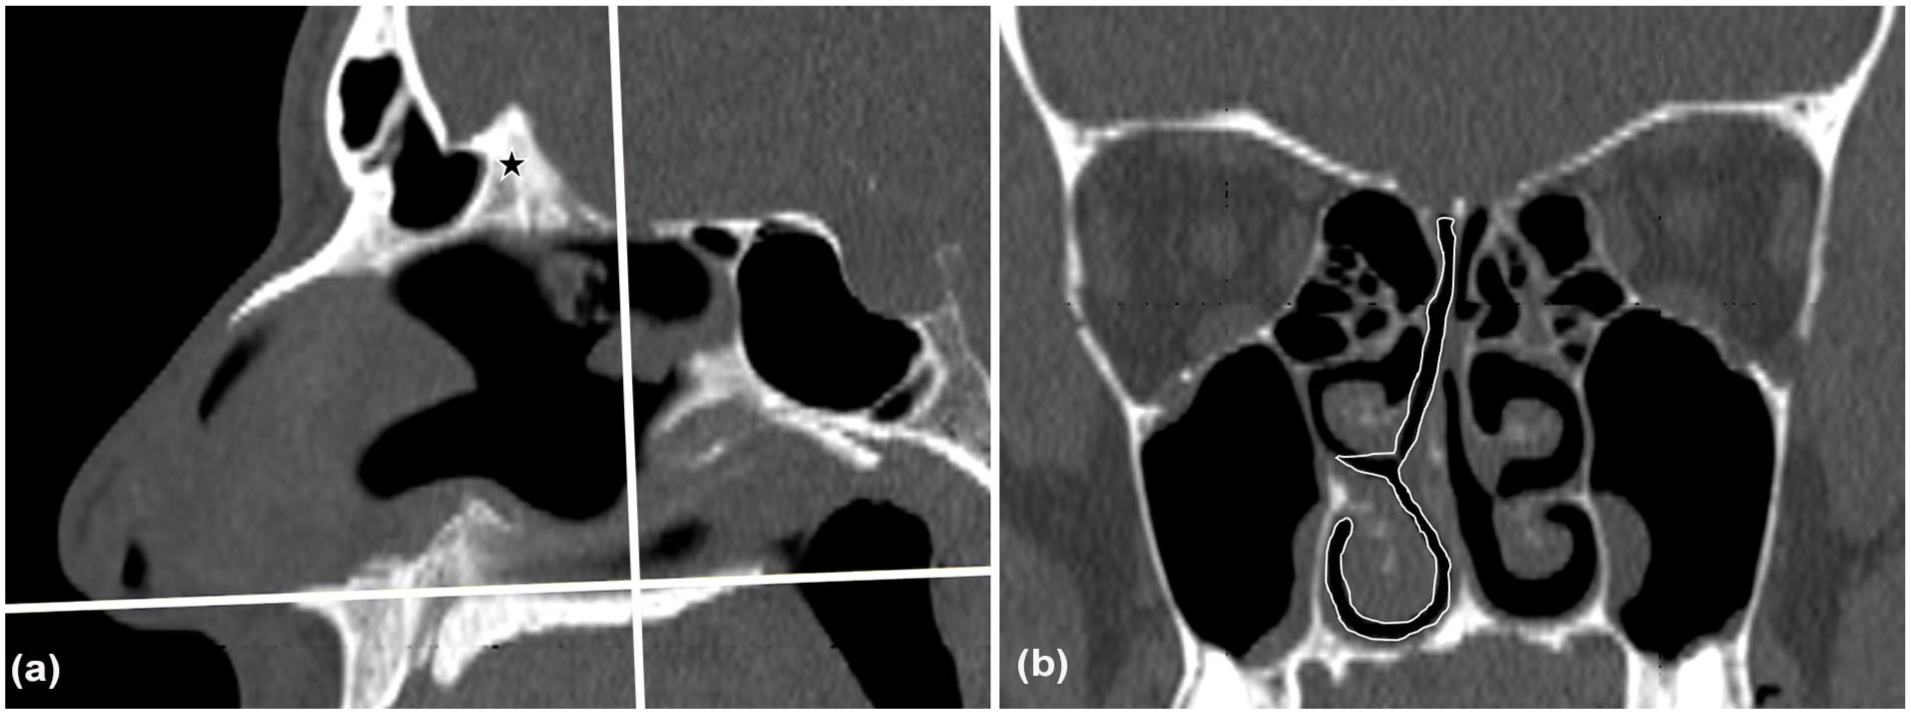
Design of CT-CSA at the level of the choanae in a 41 year-old man with a NOSE score of 95 and a VAS score of 4. (a) A line was set between the anterior and posterior nasal spine (horizontal white line). Then, the coronal view was set at the level of the posterior border (vertical white line) of the crista galli (black star). (b) Resulting CT-CSAchoanae. The right CT-CSAchoanae, demarcated by the white continuous line, was 1.33 cm2, while the left one was 2.04 cm2. CT-CSA, computed tomography cross-sectional areas.
Data Analysis
We used the SPSS 30.0 statistic package (SPSS, Inc, Chicago, IL, USA) to analyze the data. We used tables for count data, and means, standard deviations and 95% confidence intervals for metric data. We used the Shapiro-Wilk test to check for normality of distribution of variables. Correlations for continuous parameters were examined with Pearson’s correlation coefficient. Since we examined the correlations of 9 CT-CSA, the significance level was adjusted to α = .0055 (α = .05/9) after applying the Bonferroni correction for multiple correlations. Correlations were categorized as strong, if r > |0.8|, moderate, if |0.8| > r > |0.6| and weak, if r < |0.6|. Power analysis indicated that 38 subjects were considered sufficient to obtain a significant moderate correlation (r = 0.60) with a power of 0.9 and a significance level of 0.0055. The following parameters were derived from the raw data.
The first parameter was the absolute difference of the right and left nose at each of the 9 CT-CSA. This resulted in the parameter “mean asymmetry,” which served as a measure of asymmetry of the entire nose. This was correlated to each of the subjective assessment values of nasal patency, that is, NOSE and VAS score. Moreover, we investigated the correlation of the asymmetry of each CT-CSA with NOSE and VAS score.
Secondly, the largest asymmetry was also correlated to each of the subjective assessment values of nasal patency, that is, NOSE and VAS score. Usually, before indicating septoplasty by rhinoscopy with the nasal speculum, otorhinolaryngologists focus on the narrowest area of the nasal airway or else on the most deviated part of the nasal septum. The largest asymmetry intended to quantify this observation.
Thirdly, we investigated by linear regression to what extent the mean asymmetry and the largest asymmetry could potentially predict the degree of nasal obstruction, that is, NOSE and VAS score.
Results
Study Population
During the study period, 40 subjects were included. Thirty were men. The median age was 36.0 years (range: 18-58 years). The median NOSE score was 70.0 (range: 20-95) and the median VAS score was 3.0 (range: 1-4). Septoplasty was indicated for most subjects (34/40).
Cross-Sectional Areas
The smallest CT-CSA was that of the nasal valve (CT-CSACOT-2). The mean value of both sides ± standard deviation was 1.00 ± 0.22 cm2 (range: 0.65-1.46 cm2). CT-CSA of the Cottle-area-3 was slightly larger (1.06 ± 0.26; 0.70-1.82 cm2). The largest CT-CSA was CT-CSApost-100 (1.48 ± 0.36; 0.99-2.30 cm2), which was somewhat larger than CT-CSA of the choanae (1.44 ± 0.42; 0.80-2.28 cm2; Table 1). The median value of the mean asymmetry was 0.37 (0.18-1.11) cm2, while that of the largest asymmetry was 0.83 (0.33-1.94) cm2. Also, the mean value ± standard deviation of the mean asymmetry was 0.43 ± 0.22 cm2, while that of the largest asymmetry was 0.87 ± 0.39 cm2.
CT-CSA in the Study Population.
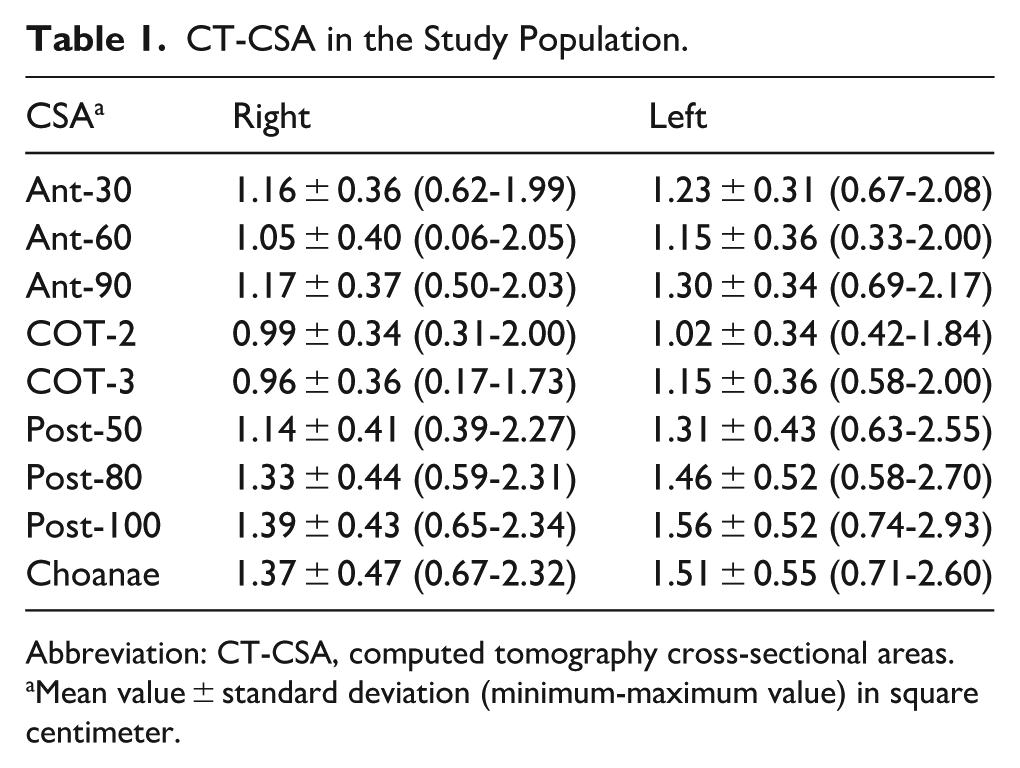
Abbreviation: CT-CSA, computed tomography cross-sectional areas.
Mean value ± standard deviation (minimum-maximum value) in square centimeter.
Moreover, we investigated how frequently each CT-CSA was the CT-CSA with the smallest proportion. CT-CSA of the nasal valve (CT-CSACOT-2) was with the smallest proportion in 8/40 subjects, alongside with the CT-CSApost-80 (8/40 subjects). In total, an anterior CT-CSA was with the smallest proportion in 15/40 subjects, whereas a posterior CT-CSA was with the smallest proportion in 25/40 subjects (Table 2).
Correlation of Each CT-CSA Asymmetry With NOSE and VAS Score.
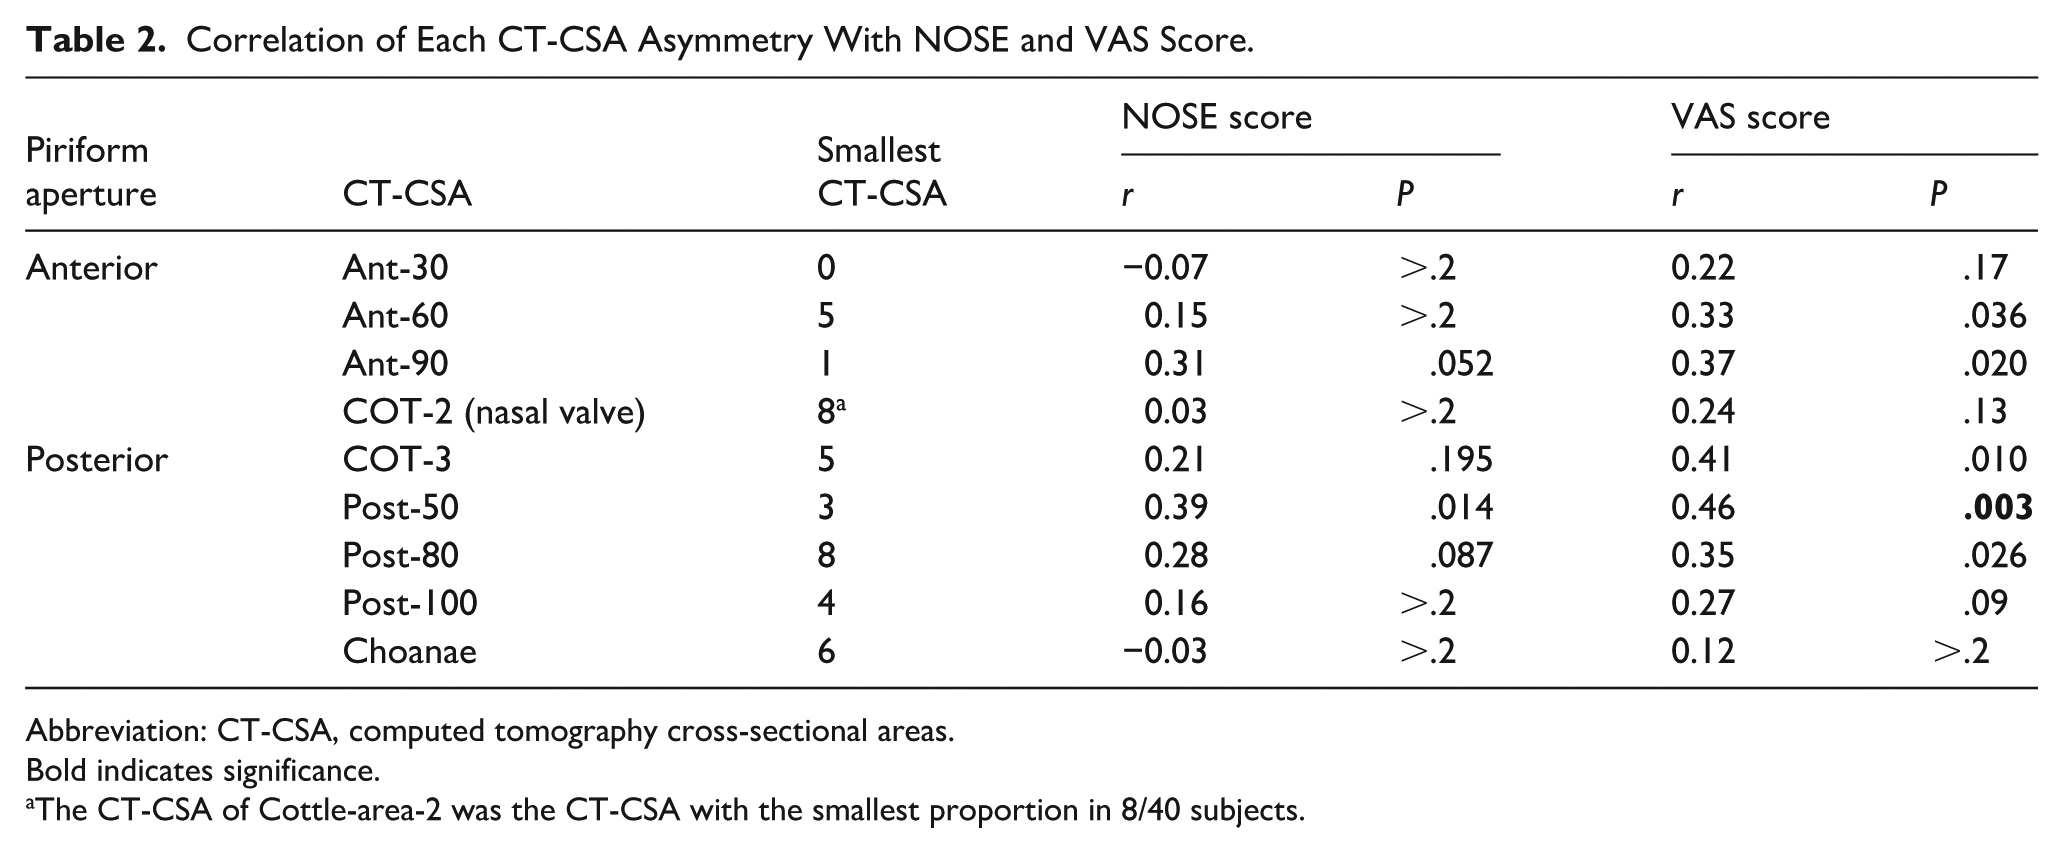
Abbreviation: CT-CSA, computed tomography cross-sectional areas.
Bold indicates significance.
The CT-CSA of Cottle-area-2 was the CT-CSA with the smallest proportion in 8/40 subjects.
Correlation Between CT-CSA and Subjective Assessment of Nasal Patency
NOSE score did not correlate significantly neither with the mean asymmetry (r = 0.28; P = .085) nor with the largest asymmetry (r = 0.22; P = .18; Figure 3). Only VAS score correlated poorly, still significantly, with the mean asymmetry (r = 0.51; P < .001) and even less with the largest asymmetry (r = 0.39; P = .012; Figure 4). NOSE score correlated significantly with VAS (r = 0.74; P < .001). When examined per each CT-CSA, CT-CSApost-50 did not correlate significantly with NOSE score (r = 0.39; P = .014). On the contrary, CT-CSApost-50 correlated poorly, still significantly, with VAS score (r = 0.46; P = .003; Table 2).
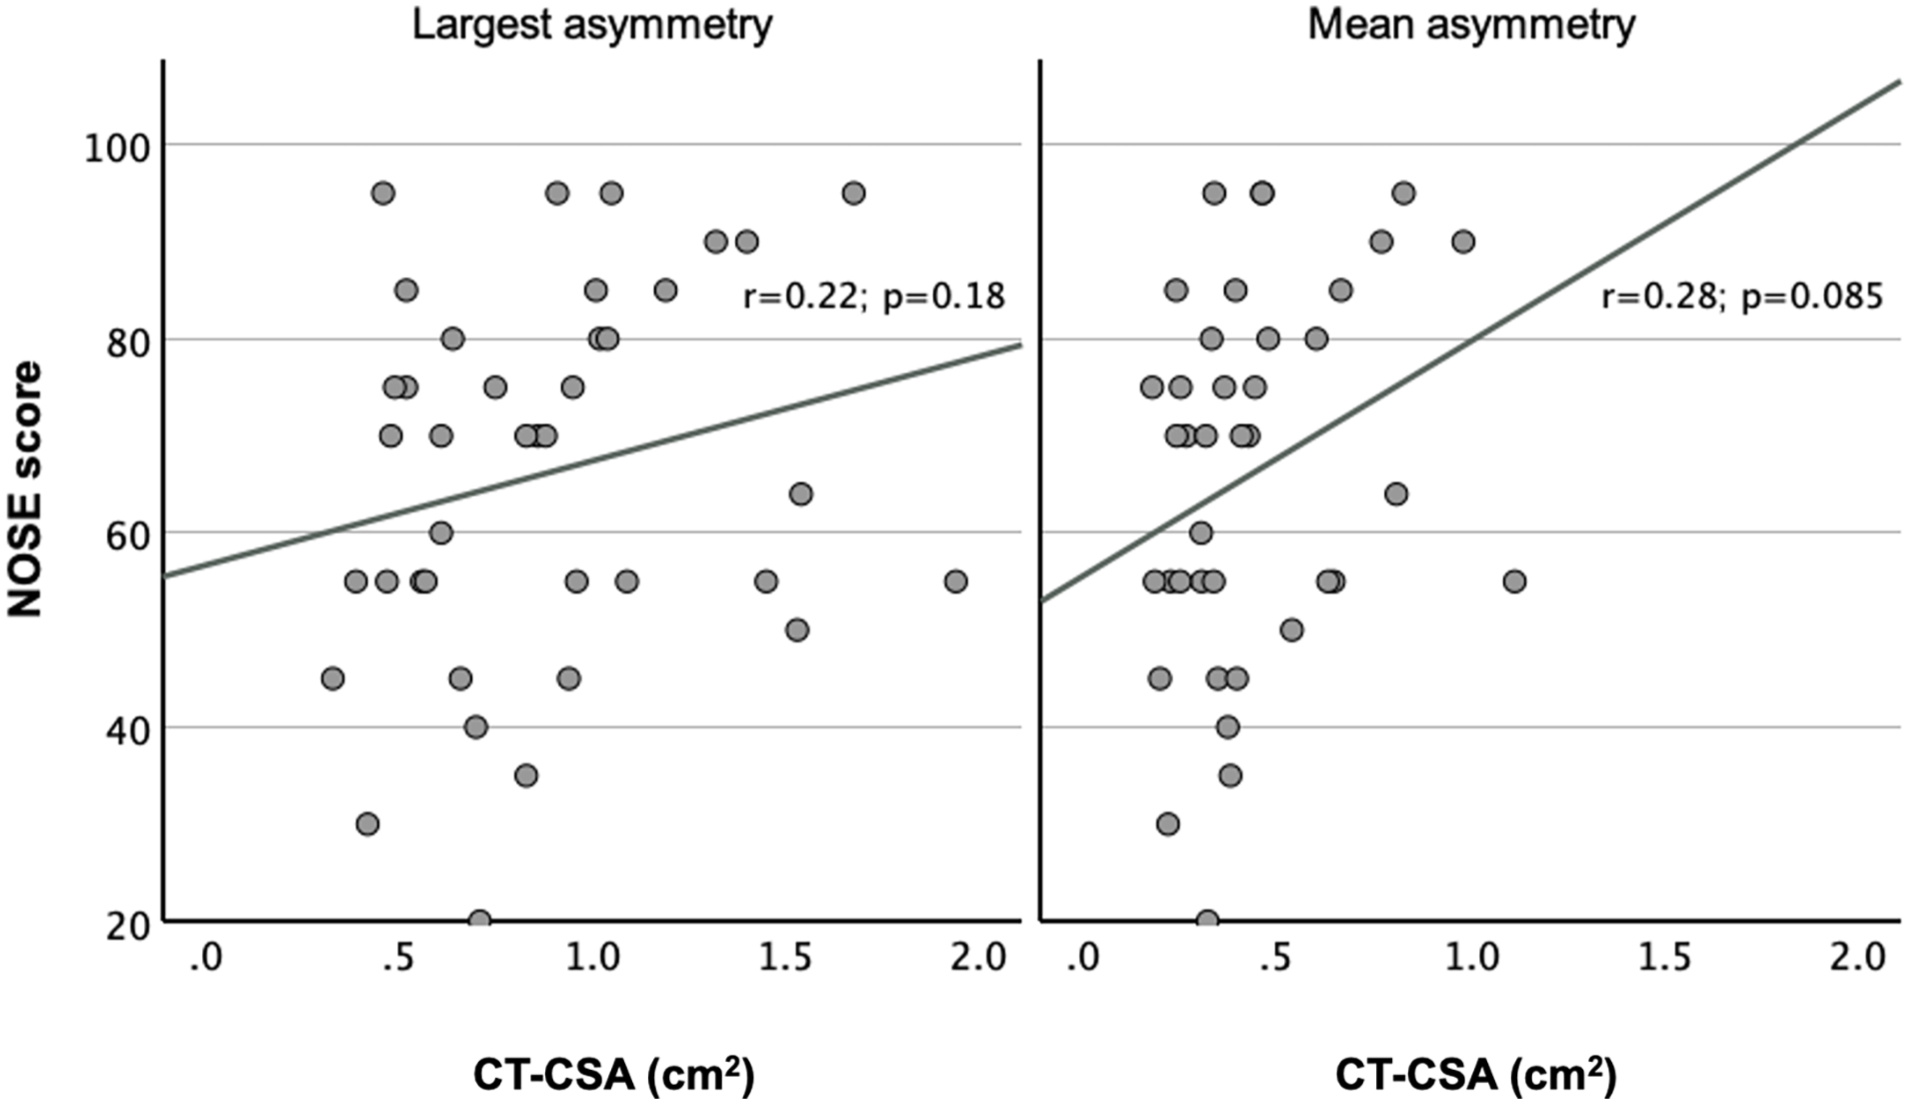
Correlation of NOSE score with asymmetry. Y-axis: NOSE score; X-axis: asymmetry at the level of each CT-CSA in square centimeter. The left and right diagrams indicate the largest and mean asymmetry, respectively. The correlation between NOSE score and largest asymmetry was r = 0.22 (P = .18), while that between NOSE score and mean asymmetry was r = 0.28 (P = .085). CT-CSA, computed tomography cross-sectional areas.
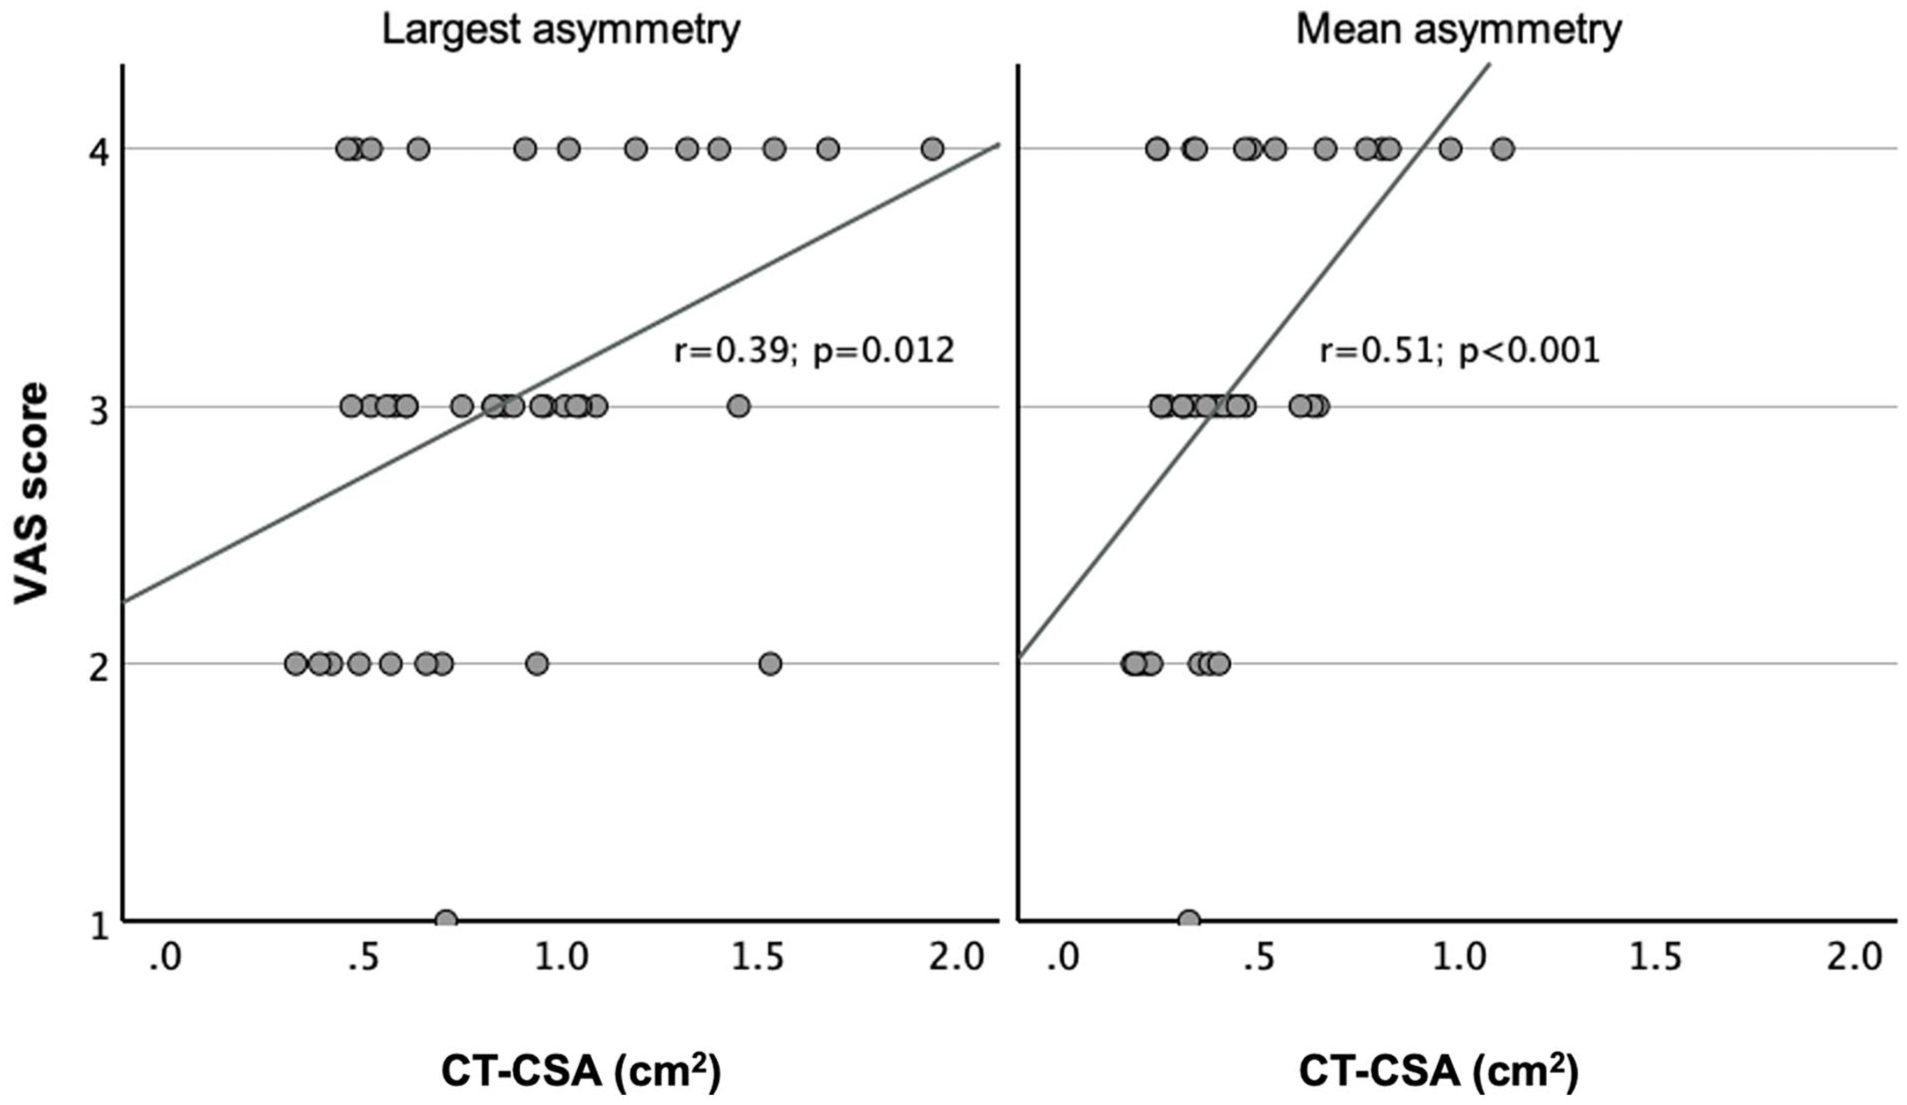
Correlation of VAS score with asymmetry. Y-axis: VAS score; X-axis: asymmetry at the level of each CT-CSA in square centimeter. The left and right diagrams indicate the largest and mean asymmetry, respectively. The correlation between VAS score and largest asymmetry was r = 0.39 (P = .012), while that between VAS score and mean asymmetry was r = 0.51 (P < .001). CT-CSA, computed tomography cross-sectional areas.
Prediction of the Degree of Nasal Obstruction Caused by the Anatomy
Assumptions to carry out a linear regression between mean asymmetry and VAS score were met. There was a linear correlation between both variables, a sufficient number of samples, without outliers and with proper standardized residuals (−2.61 to 1.90), which were normally distributed (Shapiro-Wilk test; P > .2). Mean asymmetry and VAS score were set as the predictor and outcome variable, respectively. The R2 for the model was 0.258 (adjusted R2 = 0.239; P < .001).
Discussion
In this cross-sectional study, we investigated whether and to what extent the findings of rhinoscopy with the nasal speculum predict nasal obstruction in candidates for septoplasty or septorhinoplasty. CT could aid as a reproducible, quantifiable, verifiable, not examiner-dependent snapshot of the nasal anatomy. Moreover, CT is less error-prone than rhinometric procedures (eg, anterior active rhinomanometry or acoustic rhinometry). Therefore, we examined the correlation of 9 standardized CT-CSA6 -8 with NOSE and VAS scores in candidates for septoplasty or septorhinoplasty.
In contrast to NOSE and VAS scores, handling the data of 9 CT-CSA was not that straightforward. Multiple parameters of the 9 CT-CSA were available, that is, total of both sides, difference between sides, ratio of narrower to wider side, proportion of narrow to both sides and the narrower or wider side only. Due to the examination of 9 CT-CSA, correlations were adjusted by applying the Bonferroni correction. For differences, ratios and proportions, we noted significant correlations. We chose to investigate a parameter used in previous studies,6,7 which was the difference between sides or else the asymmetry. Another study has also used asymmetry as an outcome. 16
Our results revealed a poor, still significant, correlation between the mean value of CT-CSA asymmetries and the VAS score only (r = 0.51; P < .001). Furthermore, the largest CT-CSA asymmetry, which could represent the airway at the most deviated part of the nasal septum, correlated less with the VAS score only (r = 0.39; P = .012; Figure 4). Our results revealed no correlation of NOSE score with CT-CSA. These findings are not contradictory to recent data. 17 Ardeshirpour et al reported very poor correlations (all P > .05) between NOSE score and CT. 17 These results indicated that VAS score correlated better with CT than NOSE score correlated with CT.
The latter might be intriguing, since NOSE score is considered one of the most suitable questionnaires for nasal obstruction in subjects with nasal septal deviation. 18 While VAS score reports the degree of nasal breathing, NOSE score reports also nasal blockage, nasal congestion, troubled sleeping and problems with nasal breathing during exercise. While NOSE score has been extensively examined, 18 these symptoms might be affected by pathologies other than nasal septal deviation. Thus, VAS score could be more specific and targeted to the degree of nasal breathing. Corredor-Rojas also reported that VAS score stands out as a possible interchangeable scale with NOSE score to measure nasal obstruction in subjects undergoing septoplasty. 19 Also, Hsu et al concluded that the nasal resistance on the narrow side of subjects undergoing septoplasty correlated significantly with VAS score, but not with NOSE score. 20 Interestingly, the NOSE has been found superior to VAS score when used to compare the pre- with the postoperative feeling of nasal breathing. 21 The latter has not been performed in the current study, the design of which did not allow for further investigation of the differences between NOSE and VAS scores.
However, the mean asymmetry of the 9 CT-CSA did not predict the VAS score (adjusted R2 = 0.239; P < .001). This percentage could indicate that variations in the size of the 9 CT-CSA could explain or predict variations of the VAS score up to a 24%. This could broadly imply that the anatomy of the airway could explain or predict the subjective feeling of nasal obstruction up to a 24%. However, the adjusted R2 was very low, which implied that the model failed to predict VAS score.
This percentage was observed specifically in subjects presenting for septoplasty or septorhinoplasty. The majority of them underwent surgery, and all subjects were very satisfied a week postoperatively. One of the study weaknesses was the lack of postoperative documentation of subjective nasal breathing. If nasal breathing was very satisfying after surgery, then the anatomy of the airway could have theoretically explained the subjective feeling of nasal obstruction up to a 100%, not only up to 24%.
Several reasons could explain this difference. Firstly, the anatomy of the airway may not be sufficiently represented by the 9 standardized CT-CSA. Secondly, long term results after septoplasty might be unsatisfactory, 22 and our results originated from a week postoperatively. Thirdly, we did not document other factors, such as allergy, laryngopharyngeal reflux and trigeminal sensitivity.
The design of this study might have not sufficed to support this observation, that is, the prediction of 24%. The latter should be further investigated in larger studies with more groups, that is, in subjects without and with accompanying allergic rhinitis or even in subjects with incidental septal deviation found in random CT scans. Since more pathologies (eg, allergy) lead to subjective nasal obstruction, it would be interesting to investigate to what extent each pathology contributes to nasal obstruction. Also, investigation of the nasal cavity’s volume could be another alternative.
The clinical implications of this study are worth discussed. Patients often ask otorhinolaryngologists to what degree their septum is deviated and to what extent a deviation could explain their symptoms. Our results depending on each CT-CSA could elaborate these explanations. Indeed, best correlations were observed for CT-CSAant-90, CT-CSACOT-3 and CT-CSApost-50. This would imply that variations of septal deviations around the nasal valve could explain variations of nasal patency. Nevertheless, a larger effect would be expected in the area anterior the piriform aperture, since this area is considered as the area with the highest resistance to the airflow. 15 These results were contradictory to the results of similar qualitatively studies.6 -8 However, the latter cannot be explained by the design of the current study. A well-designed multicentered case-control study with multiple subjects, multiple pathologies and preoperative, as well as long-term postoperative documentation of subjective nasal breathing might explain most of these discrepancies and lead to creation of normative data which would enhance our understanding for nasal pathologies and improve patient counseling. These normative data would probably not create cutoff values, from which nasal breathing would be characterized as sufficient and insufficient. On the contrary, they would rather result in a continuous scale, from which nasal anatomy could predict the degree of nasal obstruction based on the septal or pyramid deviation. More future applications might be possible by artificial intelligence tools, which could be used to facilitate the measurements in CT.
The strengths of this study have been reported in similar studies.6 -8 However, several limitations should be noted. The 9 CT-CSA certainly do not represent the whole nose. Moreover, the measurements of the 9 CT-CSA have been carried out by a single investigator. Adding more investigators after data acquisition was not possible, since CT scans were not available for the authors at that time. Therefore, no inter-rater analysis could be performed. Nevertheless, unpublished data of similar studies carried out by the authors indicate an excellent reproducibility by the Bland-Altman method, with retest values of all CT-CSA being ~0.97 times higher than original values. Furthermore, the CT-CSA in the current study were ~10% larger than CT-CSA in similar studies.6 -8 The different ethnicity of the subjects or the different measurement program could explain this difference. Also, the effect of the nasal cycle has not been studied here. However, since the nasal cycle is part of the nasal physiology, it remains questionable if the effect of the nasal cycle should be neutralized.
A further limitation included the absence of other objective assessment methods of nasal patency, such as active anterior rhinomanometry, acoustic rhinometry and computational fluid dynamics. Equipment for rhinometric procedures and/or computational fluid dynamics was not available at our hospital. Furthermore, there was a lack of funding. Nevertheless, correlation of CT-CSA with active anterior rhinomanometry and acoustic rhinometry has been sufficiently examined in previous studies.6 -8 Further investigations would exceed the resources of this manuscript. Lastly, the limited number of subjects (n = 40) did not allow for thorough investigation of the correlations between each CT-CSA and subjective nasal obstruction or investigation of the role of the inferior turbinate by dividing CT-CSA anterior and posterior the piriform aperture. Therefore, the current study could be characterized as a pilot cross-sectional study.
Concluding, VAS score, in contrast to NOSE score, correlated poorly, still significantly, with CT in candidates for functional nasal surgery. The 9 standardized CT-CSA could not sufficiently predict the degree of subjective nasal obstruction.
Footnotes
Ethical Considerations
The study protocol was approved by the local institutional review board (23-01-2023/501).
Consent to Participate
Patients signed an informed consent form to participate.
Consent for Publication
Patients signed an informed consent form regarding publishing their anonymized data.
Author Contributions
Conceptualization: A.I.G. Data curation: A.I.G., I.K. Formal analysis: A.I.G. Investigation: A.I.G., I.K. Methodology: A.I.G. Project administration: A.I.G. Software: A.I.G., I.K. Supervision: A.I.G. Validation: A.I.G. Writing – original draft: A.I.G., I.K. Writing – review and editing: A.I.G., I.K.
Funding
The authors received no financial support for the research, authorship and/or publication of this article.
Declaration of Conflicting Interests
The authors declared no potential conflicts of interest with respect to the research, authorship and/or publication of this article.
Data Availability Statement
Data used for this article are available from the corresponding author upon reasonable request.