
Abstract
Background:
There is growing evidence throughout medicine, including otolaryngology, that reimbursements have consistently been falling over the last 2 decades, which no obvious end in sight. Herein, we aim to educate otolaryngologists on the macro and microeconomic forces acting on health economics, detail the trends in reimbursements, and discuss how these trends affect providers and patients.
Methods:
A narrative review of changes in reimbursements and practice patterns within otolaryngology was performed.
Results:
Otolaryngology procedures have experienced as much as a multifactorial 50% decrease in inflation-adjusted Medicare reimbursement since 2000. On a macroeconomic level, the decline has been driven by the 1997 Balanced Budget Act, which threatened a decrease in conversion factor (the rate per relative value unit [RVU] physicians are paid) year-after-year (often blunted by congressional acts). On a microeconomic level, many otolaryngologic procedures have been targets for bundling and decreased RVUs, most notably rhinologic procedures in 2018. Decreasing reimbursements may be contributing to increasing procedural volume, increasing demand for ancillary sources of practice income (eg, in-office CT scans), and increasing private equity/large hospital practice buyout. These may expose patients to decreased quality of care.
Conclusions:
Otolaryngologic payments have been in continued decline for 2 decades, with potential important consequences for providers and patients. Awareness of the issues surrounding this key trend are vital.
Introduction
Reimbursements are an extremely contentious, highly politicized, and fundamentally complicated topic across all of medicine. Perhaps as a result, reimbursements have essentially only fallen over the recent decades. Using Medicare reimbursements as an example (to which many private payors reimbursements are linked to and often mirror 1 ), reimbursements have been detailed to be falling in virtually every field of medicine, 2 including otolaryngology and its many subspecialties,3 -15 especially when considering inflation. In fact, otolaryngology was noted to have the second greatest fall in reimbursement (−31.5%) after adjusting for inflation among all surgical specialties. 2 Reimbursements within rhinology, in specific, have fallen as much as 50% between 2000 and 2021. 4 In this review, we will discuss many of the mechanisms that go into reimbursements, further detail evolving trends in reimbursements within otolaryngology, and discuss important consequences of these changes. Amid downward pressure and rising inflation, otolaryngologists’ awareness of each step of the reimbursements process is becoming increasingly important for advocacy. This is of utmost importance for both subspecialty and comprehensive otolaryngologists.
Materials and Methods
A narrative review of changes in reimbursements and compensation strategies within the various subspecialities of otolaryngology was performed utilizing PubMed via the following search terms: ([medicare reimbursement OR medicare utilization OR billing] AND [otolaryngology OR rhinology OR otology OR head and neck OR laryngology OR Facial Plastic Surgery OR Pediatric Otolaryngology]) AND (“2015/01/01” [Date – Publication]: “3000” [Date – Publication]). . Given the focus on contemporary trends, articles from the last decade (2015 onwards) were selected for our initial review for inclusion. Further relevant publications were found via the bibliographies of selected articles. Exclusion criteria included non-English articles, health economics articles related to countries outside of the United States, editorials, and commentary pieces.
Results
Mechanism of Medicare Reimbursements on a Microeconomic Level
On the smallest scale, one can think of reimbursements as being determined per procedure. Since 1992, Medicare has determined per procedure reimbursements via the “Medicare Physician Fee Schedule Payment Rates Formula” 16 (Figure 1). Essentially, each procedure for which there is a Current Procedural Terminology (CPT) code is given 3 different “relative value units (RVUs)” – a work RVU (wRVU), a practice expense RVU, and a malpractice RVU – each of which represents a standard unit of payment within its respective category (eg, wRVU is the standard unit for “time and intensity” across all physician services). Each of these RVUs is multiplied by a geographic practice cost index (ie, a value that adjusts for cost of living in various locales). They are then added up to create what can be thought of as a geographically adjusted global RVU representing all that goes into a particular procedure. This is then multiplied by a “conversion factor (CF)” which can be thought of as “dollars per RVU” rate, thus determining a dollar value for every procedure performed. This CF value is adjustable and further detailed in the following section on macroeconomics.
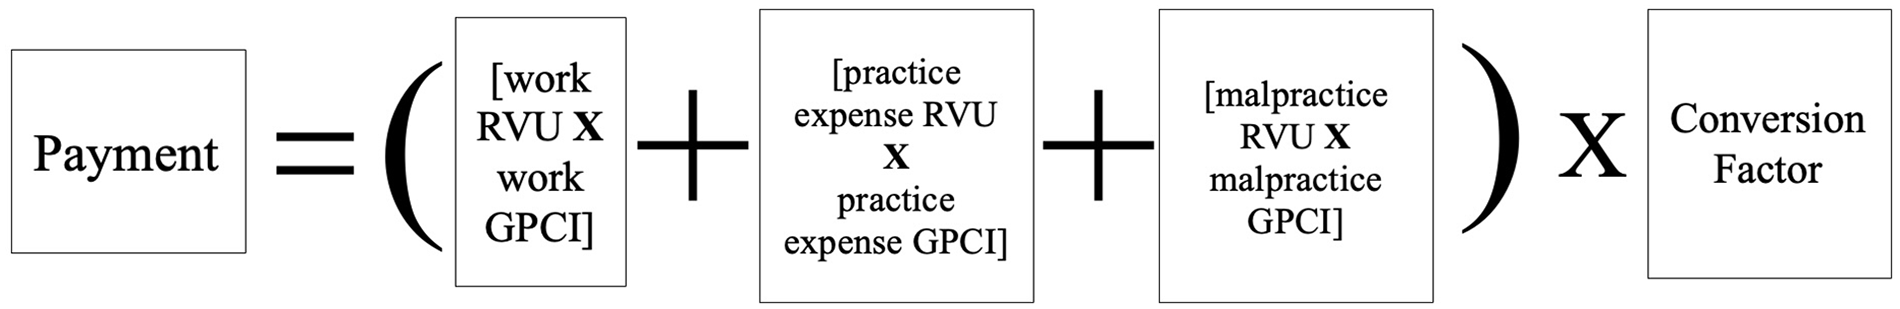
Medicare physician fee schedule payment rates formula.
Looking more specifically at each component, RVUs are set by the Centers for Medicare & Medicaid Services (CMS). However, the American Medical Association (AMA) runs the Relative Value Scale Update Committee (RUC), which is a group of 32 physicians representing each specialty 17 ; the RUC meets roughly 3 times a year and are responsible for proposing RVU values to CMS. Though the CMS is under no obligation to accept the RVU proposals, the RUC states that >90% of proposals are accepted by CMS. 18 The RUC valuation process is informed by the RUC survey, which is a relatively lengthy survey sent to relevant physicians querying time and effort involved in performing the “typical” procedure for a given CPT code (including both new codes and established codes that are being revalued). 19 As can be expected for a survey tool, response rates are low, averaging 2.2%,20,21 opening up significant room for inaccuracies. As such, there is evidence to suggest otolaryngology procedure RVUs are undervalued compared to peer specialties when comparing factors such as operative times to RVUs across specialties. 22
Mechanisms of Medicare Reimbursements on a Macroeconomic Level: Historical and Contemporary
On a macroeconomic level, physician reimbursements are often a hotly debated and politicized topic, which is not helped by the decline in the public opinion and trust in physicians. 23 For the majority of the past 3 decades (Figure 2), the Medicare budget was dictated by the 1997 Balanced Budget Act, the key feature of which was the enactment of the sustainable growth rate (SGR). The SGR linked the Medicare budget to the gross domestic product (GDP). At the time, this seemed wise – as GDP increased, so would the budget, thus keeping reimbursements “fair.” These changes in budget would come through various mechanisms, including changes to the aforementioned CF, linking the microeconomic Medicare formula to the macroeconomic forces at play.
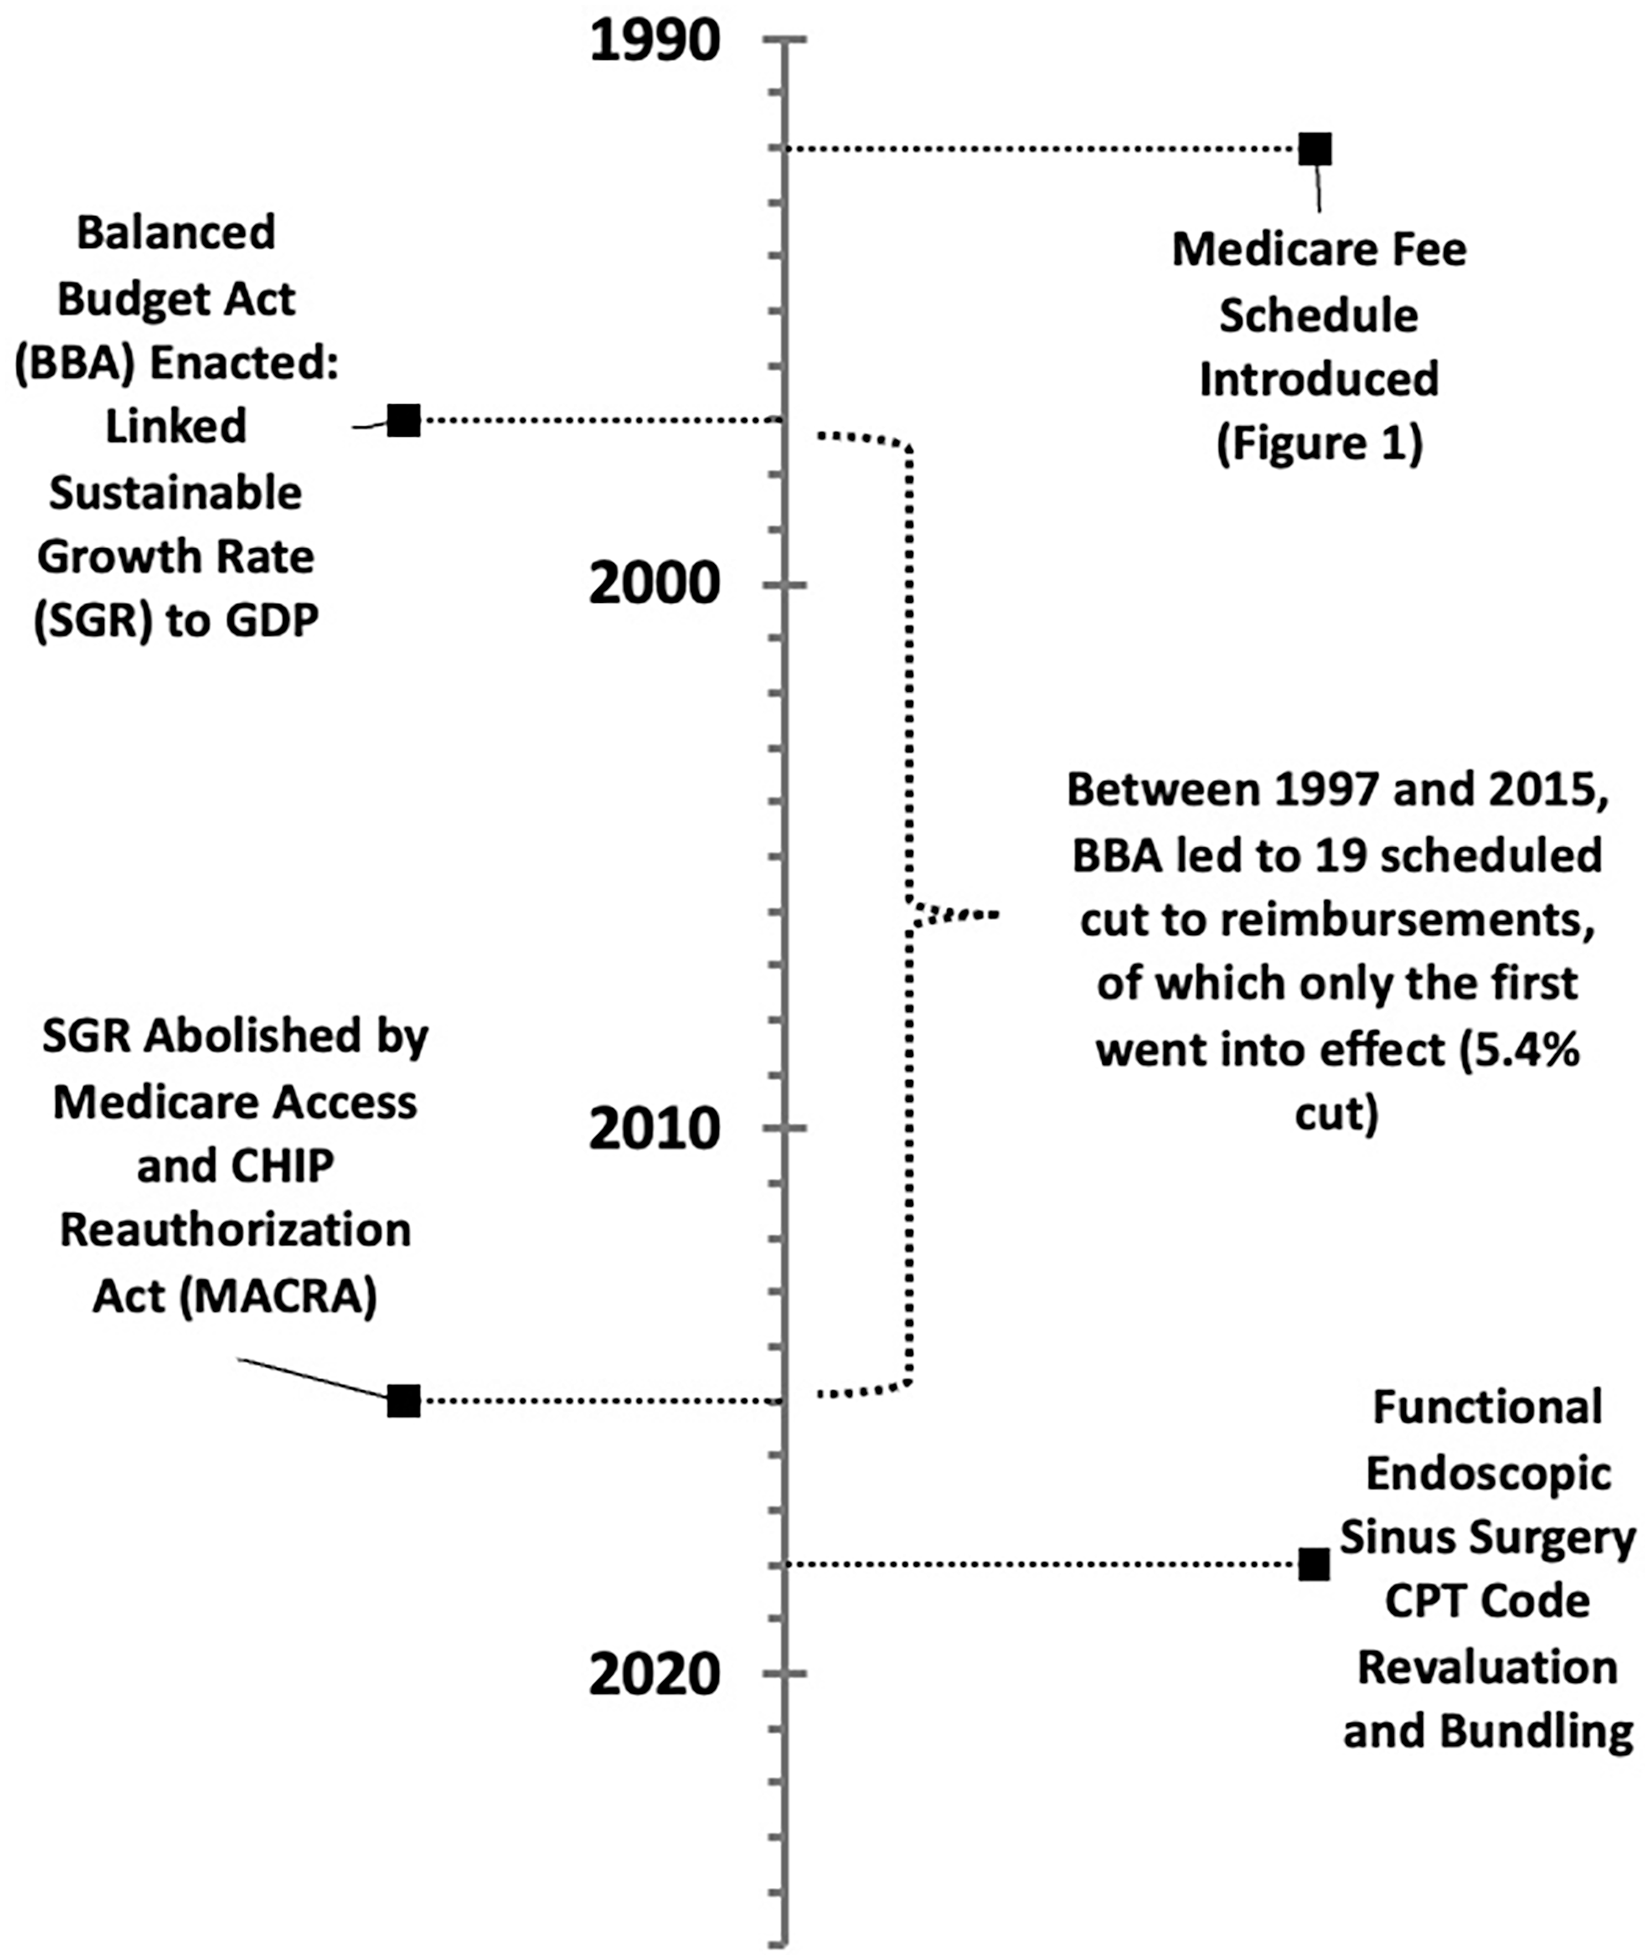
Timeline of major macro-level events on reimbursements.
Though GDP has only ever increased, health expenditures have only ever increased at a much higher rate. 24 As such, the SGR would dictate that Medicare would have to pay for more with less. Between 1997 and 2015, there were 19 SGR-dictated scheduled cuts to physician payments via the CF (up to a value of 24.7% cut at once), of which only the first went into effect (a 5.4% cut in 2002). Through intense lobbying by organizations such as the AMA, the other 18 of these cuts were blocked by often last-minute congressional acts. Twelve of these blocked cuts were replaced with no changes in payments, while 6 increased payments anywhere from 0.5% to 2.2%. 25 Accordingly, the CF, which started at $36.6873 in 1998, fell to $35.9335 in 2015, an overall nominal cut of 2.05%. 26 To put into perspective, during this time period inflation rose roughly 45%, 27 and for the per-procedure reimbursement to physicians to have remained the same in terms of “real dollars” (the term given to inflation-adjusted dollars), CF would have had to raise to over $53 in 2015. Normalized in terms of inflation, the CF actually experienced a 32.5% cut.
Fortunately, the SGR was abolished in 2015 by the Medicare Access and CHIP Reauthorization Act (MACRA), 28 though the effect (or, rather, lack of effect) SGR had over the 18 years of its life on the CF lingered, as it set the new inflation-adjusted baseline at 67.5% of what it once was. MACRA instead specified 0.5% a year increases in physician payments from 2015 to 2019, followed by a freeze in payments until 2026; these rates are, once again, lower than the average 3% inflation rate between 2015 and 2024. However, even so, there are many other macroeconomic downward forces on Medicare payments, such as the Pay-As-You-Go act of 2010, which dictates that as the federal budget increases in 1 area, another area must be cut; accordingly, in 2022, a 4% Medicare cut was threatened to offset the cost of the COVID-19 relief. 29 Once again, this was fortunately blocked by Congress after significant lobbying efforts. 29 Medicare is also subject to budget neutrality; if the costs increase in some domain of Medicare (eg, increased spending on drugs or increased number of procedures performed on the aging population), then it must decrease in another domain (eg, decreased reimbursement per procedure). 30 As such, despite MACRA’s promises, the CF has fallen from $35.9335 in 2015 to $33.2875 in 2024, 26 a 7.4% drop in the setting of 33% inflation in that time period. 27
Linking Medicare Reimbursements to the Private Insurance Reimbursements
Though it may seem that the above reimbursement mechanisms are only important for Medicare payments, CMS sets industry standards as private insurances that adopt RVU values for their own reimbursement methodologies. Though payments may not be one to one, evidence suggests that private insurances often pay a certain percent of the Medicare rate (whether above or below), and changes to Medicare rates are often mirrored by the private industry. 1 What’s more, Medicare is the largest insurer in the country, and thus virtually every provider is affected directly and/or indirectly by Medicare-led changes.
Reimbursement Trends in Otolaryngology
With an understanding of how physician reimbursement occurs on a micro and macro scale, otolaryngology-specific trends can be understood within the broader healthcare market. Within rhinology, the most commonly utilized codes among comprehensive otolaryngologists, 31 an analysis of the 28 most utilized CPT codes since 2000 (grouped into in-office endoscopies, in-office balloon ostial dilations (BODs), in-facility low-RVU surgeries [<10 wRVUs], and in-facility high-RVU surgeries [>10 wRVUs]), every single CPT code experienced a fall in reimbursement after adjusting for inflation. This ranged from 6.9% in the case of 31 257 (total ethmoidectomy, including sphenoidotomy; introduced in 2018) to 56.8% for 31 255 (total ethmoidectomy). 4 This fall, especially in the case of adjusted payments, is in major part driven by the lack of CF growth in the face of inflation.
However, even inflation-unadjusted reimbursements either roughly remained flat (for in-facility, high-RVU surgeries [1.7% fall] and in-office endoscopies [1.0% fall]) or fell (in-office balloon dilations [33.8% fall] and in-facility low-RVU surgeries [23.1% fall]), 4 indicating another mechanism by which reimbursements are falling. In 2015, despite protests by the American Academy of Otolaryngology – Head and Neck Surgery (AAO – HNS), CMS targeted functional endoscopic sinus surgery (FESS) and BOD procedures for re-evaluation. This triggered a series of changes that went into effect in 2018. Between 2017 and 2018, wRVUs for many FESS surgeries fell anywhere from 5.5% (from 3.29 to 3.11 for 31 256 [maxillary antrostomy]) to 23.6% (from 8.84 to 6.75 for 31 276 [frontal sinusotomy]). BOD codes were similarly affected, with 31 296 (frontal sinus ostium dilation) and 31 297 (sphenoid sinus ostium dilation) wRVUs falling 5.8% and 7.6%, respectively. 32 These trends have been mirrored in anterior skull base, pituitary, and skull base reconstructive surgery, which experienced a 22.9%, 44.2%, and 38.7%, decline in inflation-adjusted reimbursement between 2000 and 2022, respectively. 33
In addition, another major change to rhinology reimbursements went into effect in 2018 as a result of CMS efforts – bundling. 34 This is another cost-control mechanism instituted by the CMS across medicine.35 -37 CMS rationalizes bundling by arguing that certain CPT codes are billed together often (upward of 75% of the time), and thus should be treated as a single procedure. Four new codes were created, bundling ethmoidectomy with frontal sinusotomy (31 253), ethmoidectomy with sphenoidotomy (31 257), ethmoidectomy with sphenoidotomy and removal of tissue from sphenoid sinus (31 259), and frontal and sphenoid sinus ostia dilation (31 298). 32 Comparing the newly bundled 2018 CPTs to the sum of the previously unbundled corollary 2017 CPTs, wRVUs experienced a 24.1% to 43.0% fall.
The AAO – HNS states that CMS initially sought even more drastic changes, though the AAO – HNS was able to successfully lobby to prevent this. 32 Insurances are further seeking to decreasing utilization via the use of prior authorizations, 38 though, to our knowledge, there is no national data of rates of denial within rhinology.
Although the trends detailed above apply to rhinology-specific codes, other fields of otolaryngology have not been spared. In fact, a recent 2025 analysis by Dorius et al suggests that every single subspecialty has seen an >23.7% average decrease in Medicare reimbursement between 2013 and 2024. 39 Within laryngology, unadjusted reimbursements have been noted to fall >6% between 2000 and 2021, which translates to a >25% fall in inflation-adjusted dollars. 9 Head and neck oncology has seen a 19.4% inflation adjusted decline, otology a 21.2% decline, and pediatric otolaryngology a 27.5% decline between 2000 and 2020.10,11,40 Although many facial plastic surgery procedures are not covered by Medicare, between 2013 and 2024 forehead flaps have seen a 28.0% decline, rhinoplasty a 22.5% decline, and blepharoplasty a 26.9% decline.12,39 Interestingly, sleep surgery has been the most resilient to decreased reimbursement; although many procedures have experienced a decrease in inflation-adjusted reimbursement between 2000 and 2021 (eg, hyoid suspension 24.7%; uvulopalatopharyngoplasty 43.2%).3,5,7,9,10,14,40
Practice Responses to Decreasing Reimbursements and Consequences to Patients
Within the backdrop of falling reimbursements, inflation and labor costs have grown 41 ; practice overhead has almost certainly escalated, though there is no national analysis done yet. Otolaryngologists, and physicians more broadly, are all but obligated to adjust practice patterns to both provide excellent patient care and maintain their practices. Although more detailed, specific analysis needs to be performed, our group has garnered some insight into this topic.
Foremost in the ability to combat falling reimbursements is increasing procedural volume. For example, between 2000 and 2019, there has been an increase of 328%, 107%, and 75% in Medicare procedural volumes of nasal endoscopies, low-RVU rhinologic surgeries, and high-RVU rhinologic surgeries, respectively. Even after adjusting for the increase in Medicare beneficiaries in this time period, procedural volume grew 80%, 34%, and 6.3%, respectively. 4 Although likely multifactorial (eg, increase patient awareness and demand for sinonasal surgery), the increasing volume is certainly helping offset falling reimbursements. However, this has an obvious human and time limit, even with the utilization of advanced practice providers, 42 and ever-increasing volume is not sustainable. In addition, once again, Medicare is still subject to budget neutrality, and if every specialty simply increases volume, then further deflationary CF adjustments become necessary, creating a negative cycle. Even if increasing volume was not a losing battle, it comes at the cost of time with patient, potentially affecting quality of care.
In addition, otolaryngologists may be raising their prices relative to Medicare insurance payouts (a term known as “mark-up ratio [MUR]).”43,44,45 A higher MUR may reflect a higher negotiated price that gets passed on to those with private insurance, or those that are under or uninsured.
Otolaryngologists may also be turning to various ancillary services and streams of income. For example, between 2012 and 2018, there has been a 48.2% growth in the number of otolaryngologists who utilize an in-office Computed Tomography scanner for the purpose of sinonasal evaluation, with a 58.2% growth in number of in-office scans performed. 46 This may directly increase income and indirectly help capture market share and decrease time to intervention, though there is concern for overutilization and radiation exposure. There is also evidence that otolaryngologists are also increasingly turning toward ambulatory surgical centers (ASCs), 47 which may indicate increasing rates of ASC ownerships, mirroring broader trends in surgery. 48
When these and various other revenue-enhancing tools fail to offset declining reimbursement, there may be an opportunity for private equity (PE) or larger hospital systems to capture smaller practices seeking a buyout. 49 Research suggests younger and more rural physicians, compared to their more senior and urban counterparts, respectively, may not have the luxury of patient selection, taking on more time-consuming, complex patients with insurances that reimburse less; this may impact their ability to start and maintain an independent or small-group profitable practice.50 -53 Indeed, there is some evidence that PE is purchasing more otolaryngology firms over the past few years. 54 These systems have the benefits of economies of scale to keep practices afloat, but this comes at the cost of physician ownership and autonomy. With regards to patients, there is limited evidence within the urology world that PE firm-owned practices tend to be less likely to accept Medicaid 55 and Medicaid patients had a longer wait time, 56 compounding access to care issues Medicaid patients already face. 50 PE firm-owned practices also had a higher patient volume that non-PE firms, which, in the best-case scenario represents increased efficiency, but in the worst case can represent decreased quality of care. 57
Although this piece has been focused on the downward pressures of healthcare economics on physicians (and the downstream consequences to patients), patients are likewise directly affected by healthcare economics. For example, despite the benefit of continued innovation, new medications, like dupilumab, come at great cost.58 -60 Even simple, over-the-counter rhinologic sprays, such as azelastine, have experienced as much as a 21.9% inflation-adjusted increase in cost. 61 These factors may influence access to care and drug adherence.62,63
Conclusion
When it comes to reimbursements within medicine, the only direction is down. This downward trend, as detailed herein, has not spared otolaryngology and has been driven by deflationary CFs, decreased RVUs, and bundling. At the same time, though perhaps not directly related, there has been an increase in surgical volume (even relative to the aging population) and increase in ancillary services to increase revenue streams. Although still early in the otolaryngology realm compared to other specialties, PE may continue to purchase practices. All of these have important consequences for patient care. Awareness and advocacy are important to prevent further unjustified cuts.
Footnotes
Ethical Considerations
This article does not contain any studies with human or animal participants.
Funding
The author(s) received no financial support for the research, authorship, and/or publication of this article.
Declaration of Conflicting Interests
The author(s) declared the following potential conflicts of interest with respect to the research, authorship, and/or publication of this article: E.C.K. is a consultant for Stryker and 3-D Matrix and receives royalties from Springer Books; these conflicts of interests are not relevant to the current study. The other authors declare no relevant conflict of interest.