
Abstract
Introduction
Obstructive sleep apnea syndrome (OSAS) is a widely prevalent and insidious medical condition characterized by recurrent narrowing or collapse of the upper airway during sleep, leading to events of obstructive sleep apnea (OSA). Epidemiological studies estimate that OSAS affects a significant part of the general population, with prevalence rates ranging from 6% to 17%. 1 This disorder predominantly affects men, obese people, smokers, people with upper airway obstructions, and the elderly. OSAS is identified as a risk factor for serious health problems such as hypertension, coronary artery disease, diabetes mellitus, and stroke. 2 As a result, patients often present with symptoms that include snoring, excessive daytime sleepiness, and apneic episodes witnessed by family members, which led them to visit ear, nose, and throat (ENT) clinics.
The diagnosis of OSAS relies on the gold standard overnight polysomnography (PSG). However, this diagnostic approach imposes significant patient burden and financial costs. Given the prevalence of OSAS, the limited number of diagnostic centers often leads to long waiting times for PSG, resulting in delayed diagnosis and treatment. Such delays, particularly in moderate to severe cases of OSAS, expose patients to serious and potentially life-threatening risks.
Various screening questionnaires have been developed to prioritize early detection and treatment of severe OSAS, including widely used tools such as the STOP-Bang and Berlin sleep questionnaires.3,4 However, a method that can accurately assess the severity of OSAS before PSG testing remains necessary. This study evaluated the effectiveness of using anthropometric morphological characteristics to predict the severity of OSAS in patients before overnight PSG.
Materials and Methods
Participant Selection
This retrospective study included 149 adults 18 years of age who had symptoms such as snoring, excessive daytime sleepiness, and witnessed episodes of sleep apnea. Participants sought care at Dr. Suat Seren’s Hospital for Chest Diseases and the Izmir Tepecik Training and Research Hospital ENT clinic from March 2016 to September 2018. None of the participants had concurrent comorbidities, including cardiovascular, metabolic, neurological, or psychological conditions.
Clinical Examination
A team of 3 otolaryngologists, consisting of 2 specialists and a senior assistant, conducted a comprehensive clinical evaluation. To ensure the integrity of the study, people who could not undergo the examination or those with a history of bariatric surgery, tonsillectomy, or previous treatments for OSAS and snoring were excluded.
Assessment of Upper Airway and Body Morphology
The assessment involved both internal and external evaluations. Internally, subjective assessments of tonsillopalatine, oropharyngeal, and hypopharyngolaryngeal morphology were made. Externally, the measurements included neck circumference (NC) and body mass index (BMI; Figure 1).
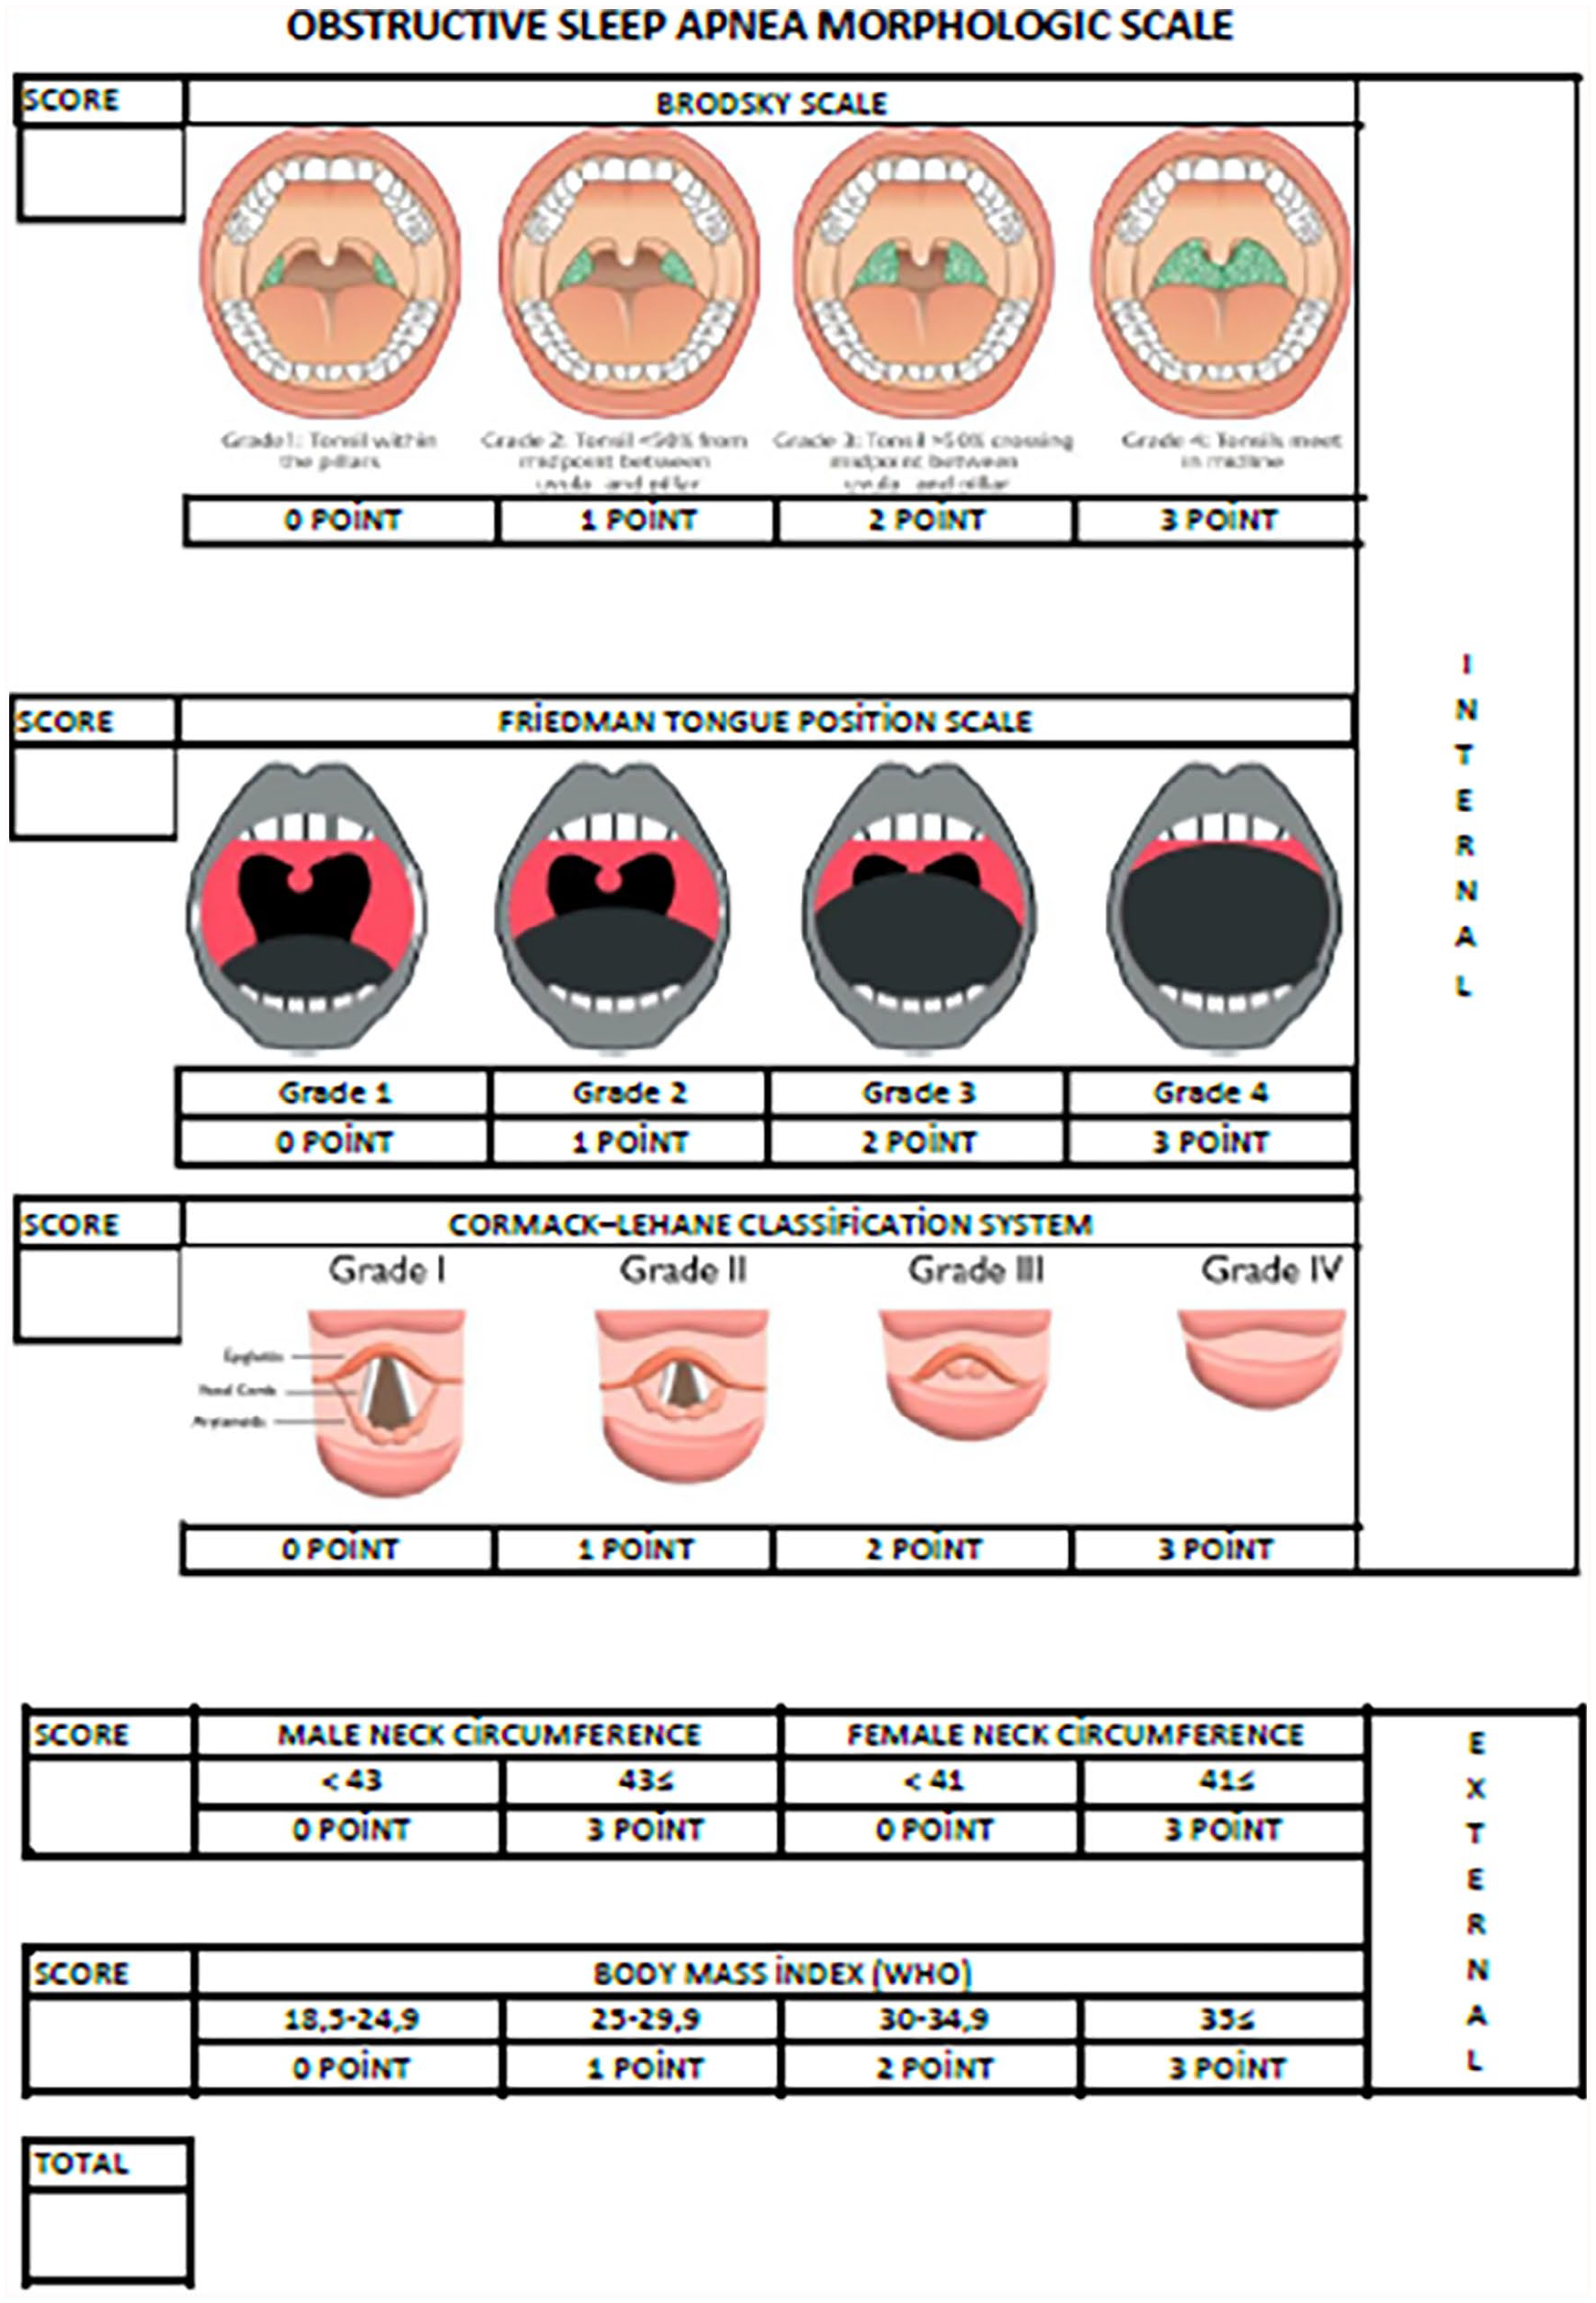
Obstructive sleep apnea morphological scale.
Internal Physical Examination
In the obstructive sleep apnea morphological scale (OSAMS), tonsil size was subjectively assessed using the Brodsky classification, with scores ranging from 0 for grade 1 to 3 for grade 4. The oropharyngeal passage was evaluated using the Friedman tongue position (FTP) classification, scoring from 0 for grade 1 to 3 for grade 4. The hypopharyngeal-laryngeal examination involved the application of 10% lidocaine (10% xylocaine pump spray) to each nasal cavity, followed by fiberoptic laryngoscopy using a 30-cm Storz flexible endoscope with a diameter of 3.5 mm. This procedure allowed visualization of key structures such as the base of the tongue, epiglottis, hypopharynx, and larynx. The rima glottis was scored using the Cormack–Lehane (CL) classification, with scores ranging from 0 for grade 1 to 3 for grade 4.
External Physical Examination
NC measurements were taken at the level of the thyroid cartilage notch using a tape measure. Reference values were set at 41 cm for women and 43 cm for men, with measurements below these thresholds scoring 0, and those exceeding the thresholds scoring 3. The BMI was classified as follows: 0 for 18 to 25 kg/m2, 1 for 25 to 30 kg/m2, 2 for 30 to 35 kg/m2, and 3 for >35 kg/m2. The grand total score (GTS) was calculated by summing the scores of the internal and external parameters.
Polysomnography
In total, 152 patients underwent PSG in a controlled laboratory setting. Prior to PSG, participants completed the STOP-Bang, Berlin Sleep, and Epworth sleepiness scale questionnaires. PSG recorded multiple parameters, including electroencephalography (EEG), electrooculography, submental electromyography, anterior tibialis electromyography, electrocardiography, finger pulse oximetry, thoraco-abdominal movements, airflow (measured using a nasal pressure cannula), oronasal thermistor, and a digital microphone for snoring detection. The PSG data were analyzed by a physician specializing in sleep disorders using TWin EEG/PSG software. Sleep and respiratory events were scored according to the standardized criteria of the American Academy of Sleep Medicine. 5
Severity Classification
The severity of OSA was determined based on the apnea-hypopnea index (AHI) of PSG. Patients were categorized as follows: AHI < 5 (no disease), 5 ≥ AHI < 15 (mild OSAS), 15 ≥ AHI < 30 (moderate OSAS), and AHI ≥ 30 (severe OSAS). 6 Three patients with a sleep efficiency <65% were excluded from the study.
Statistical analyses and methods
The correlations between the scores of the 5 parameters evaluated during the examination (tonsillopalatine size, oropharyngeal, hypopharyngolaryngeal, NC, and BMI) and the AHI scores were examined. Furthermore, the correlations between the scores of the internal and external subgroups and AHI were assessed. The study also explored correlations between the Berlin sleep questionnaire, the STOP-Bang questionnaire, and AHI scores. Subsequently, the relationships between these questionnaires and the GTS were investigated.
Data were analyzed using IBM SPSS Statistics Standard Concurrent User V 29. Descriptive statistics are presented as unit count (n), percentage (%), mean ± standard deviation, and median, minimum, and maximum values. The normal distribution of the numerical data was evaluated using the Shapiro–Wilk test. The homogeneity of variance between groups was analyzed using the Levene test. The independent sample t-test or the Mann–Whitney U test was used to compare numerical variables between 2 groups according to their distribution. The Kruskal–Wallis analysis was used for comparisons among more than 2 groups, and the Dunn–Bonferroni test was used for multiple comparisons. The relationships between the numerical variables were evaluated using the Spearman correlation coefficient. The Yates chi-square analysis was used to compare AHI groups with categorical variables. Subgroup analyses were performed using the Bonferroni corrected two-proportion Z test if the significant chi-square results were used. ROC curve analysis was used to evaluate GTS performance in predicting severe patients. The differences between the correlation coefficients were compared using the Z test. A P-value <.05 was considered statistically significant.
Results
In total, 149 patients were included in the study, including 122 males and 27 females. The mean age of the male patients was 44.4 ± 8.9 years, while the mean age of the female patients was 51.1 ± 10.7 years, statistically higher than that of the males (P = .001). The difference in BMI values between male and female patients was not statistically significant (P = .604). However, the NC values of male patients were statistically higher than females (P < .001). The distribution of smoking habits showed a statistically significant difference by sex, with a higher smoking rate among men (P = .047). However, the daily number of cigarettes smoked did not show a statistically significant difference by sex (P = .773). The GTS of the OSAMS were not statistically different based on sex (P = .070; Tables 1 and 2).
Descriptive Characteristics by Sex.
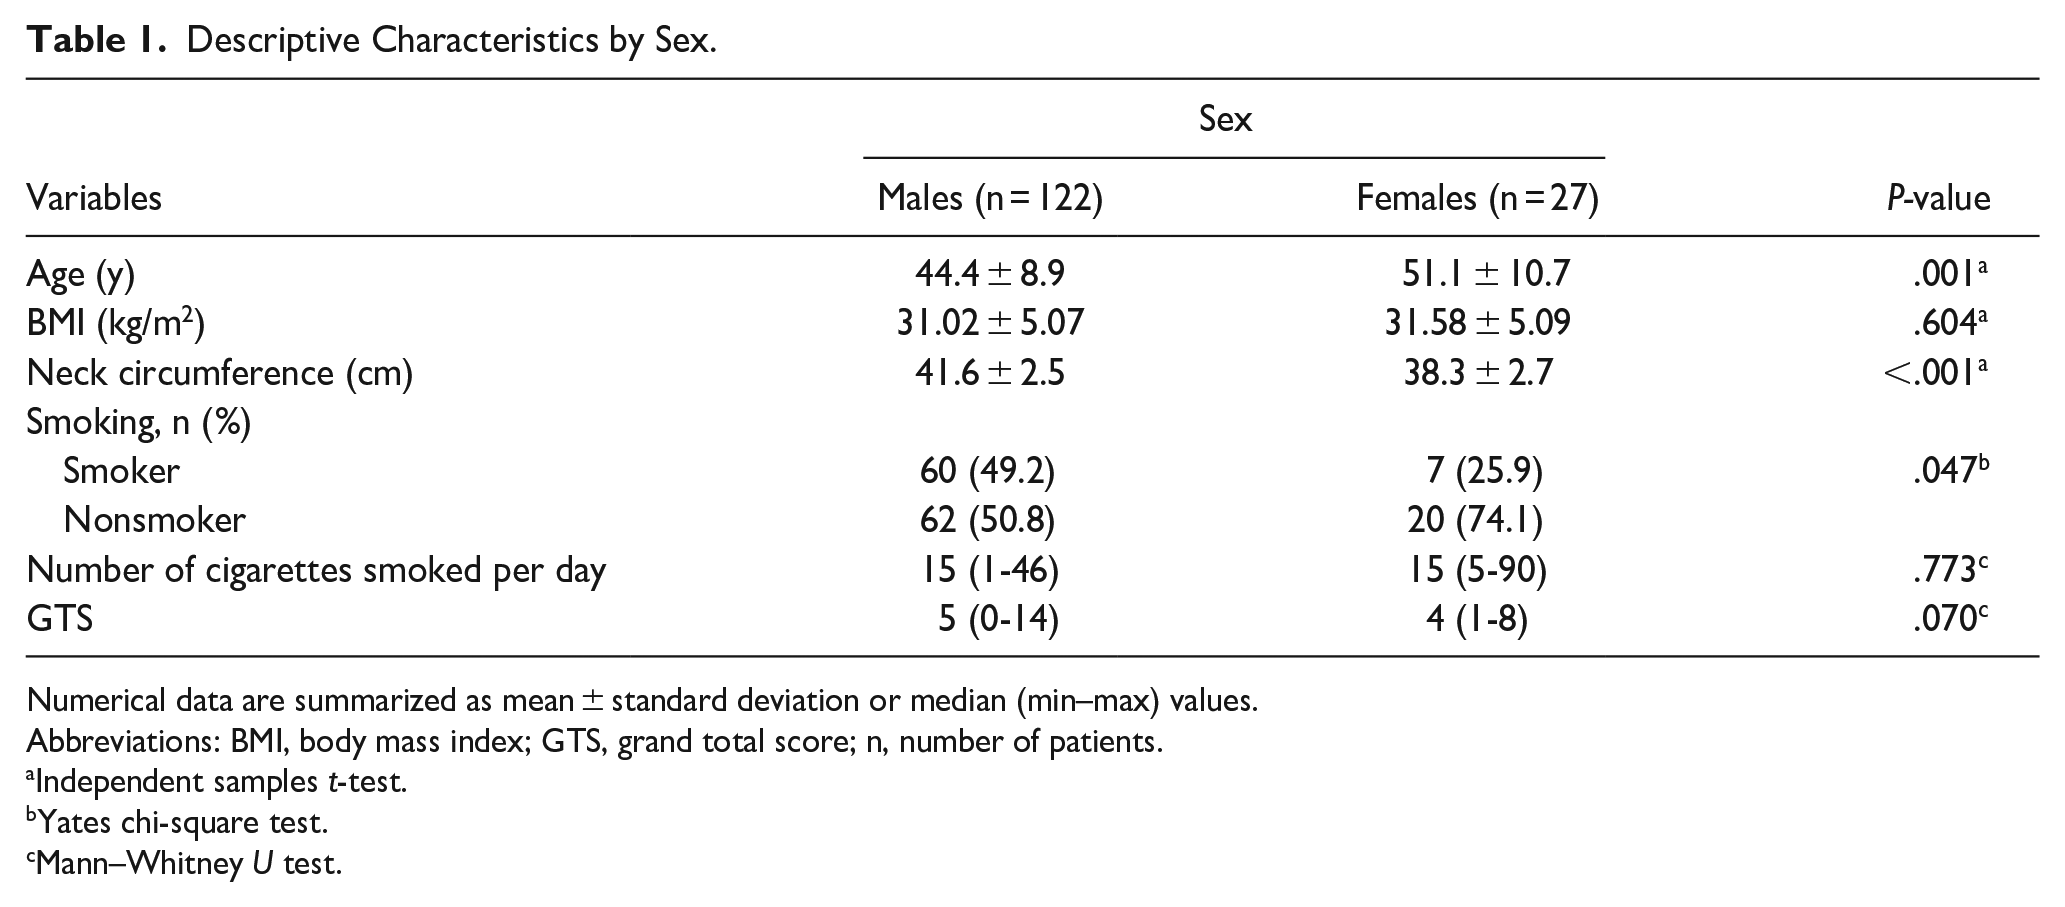
Numerical data are summarized as mean ± standard deviation or median (min–max) values.
Abbreviations: BMI, body mass index; GTS, grand total score; n, number of patients.
Independent samples t-test.
Yates chi-square test.
Mann–Whitney U test.
Patient Distribution by Obstructive Sleep Apnea Syndrome Severity.
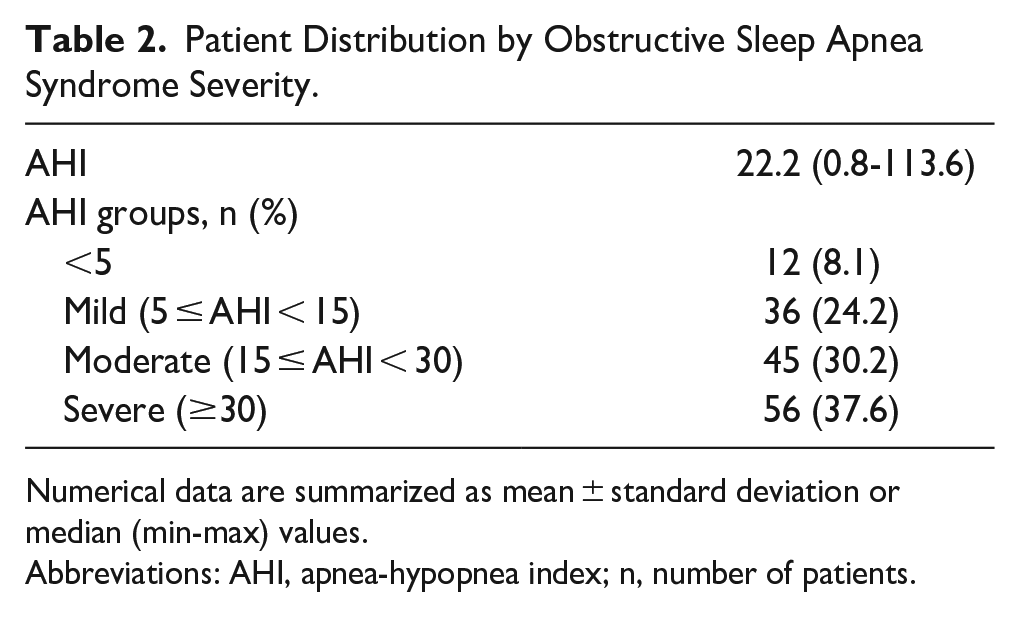
Numerical data are summarized as mean ± standard deviation or median (min-max) values.
Abbreviations: AHI, apnea-hypopnea index; n, number of patients.
The differences in GTS between the AHI <5, mild, and moderate groups were not statistically significant. However, the GTS of the severe group was statistically significantly higher than those of the other groups (P < .001; Table 3).
Comparison of GTS Across AHI Groups.
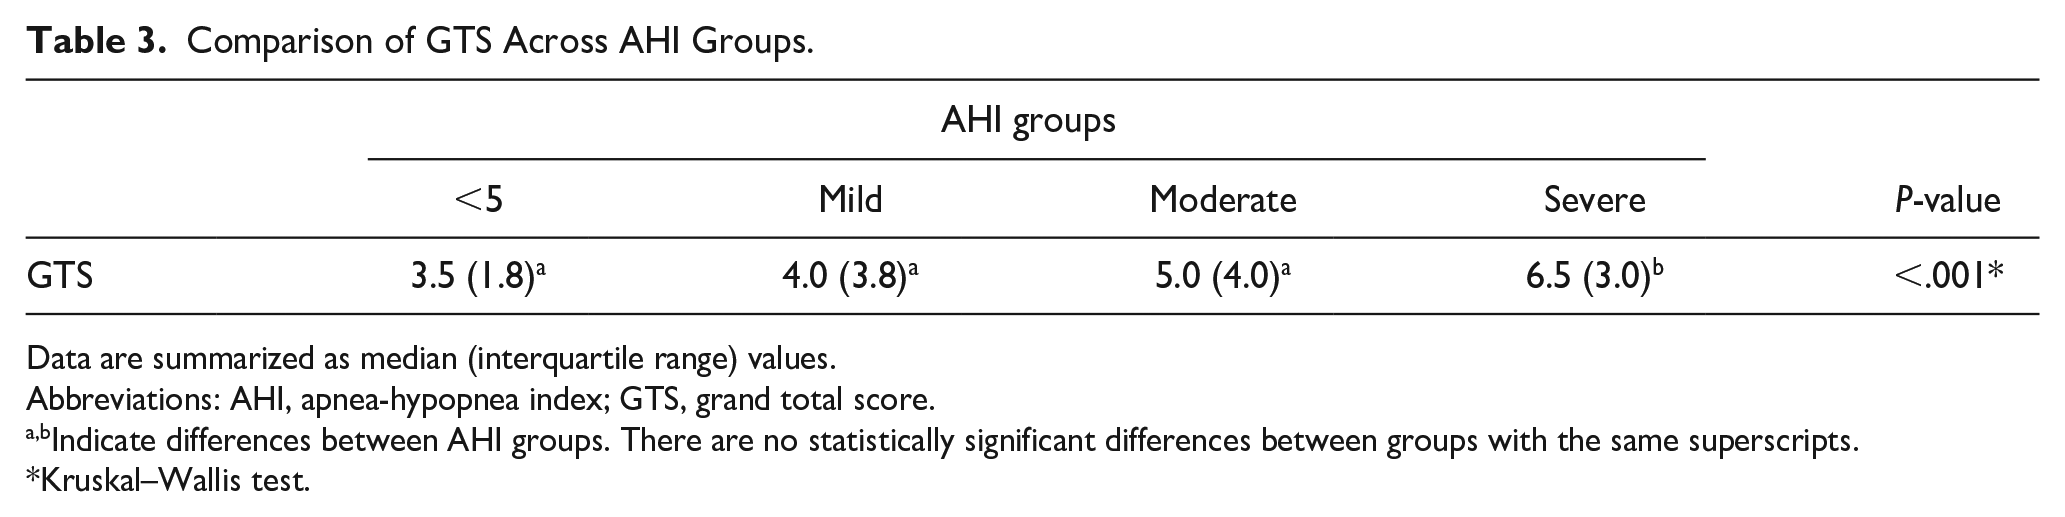
Data are summarized as median (interquartile range) values.
Abbreviations: AHI, apnea-hypopnea index; GTS, grand total score.
Indicate differences between AHI groups. There are no statistically significant differences between groups with the same superscripts.
Kruskal–Wallis test.
Table 4 evaluates GTS performance in predicting severe AHI patients using ROC curve analysis. With a score >4, a sensitivity of 80.3% and a specificity of 53.9% were obtained in the severe OSAS group. The area under the curve value was 0.743, indicating statistical significance (P < .001; Table 4, Figure 2).
ROC Curve Analysis of GTS for Distinguishing Severe AHI Group from Others (<5 + mild + moderate).
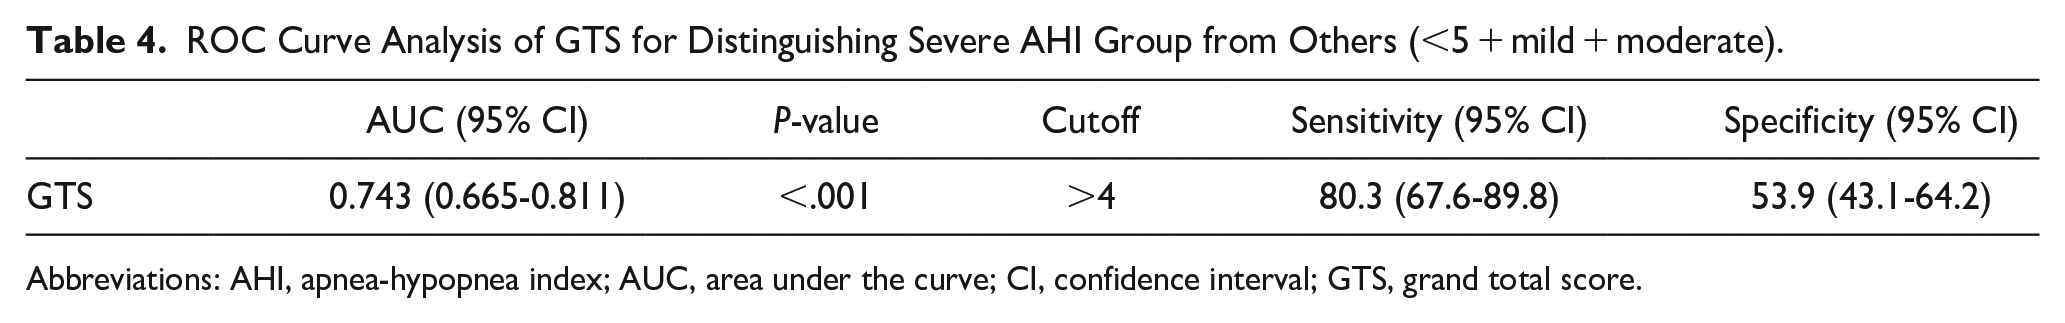
Abbreviations: AHI, apnea-hypopnea index; AUC, area under the curve; CI, confidence interval; GTS, grand total score.
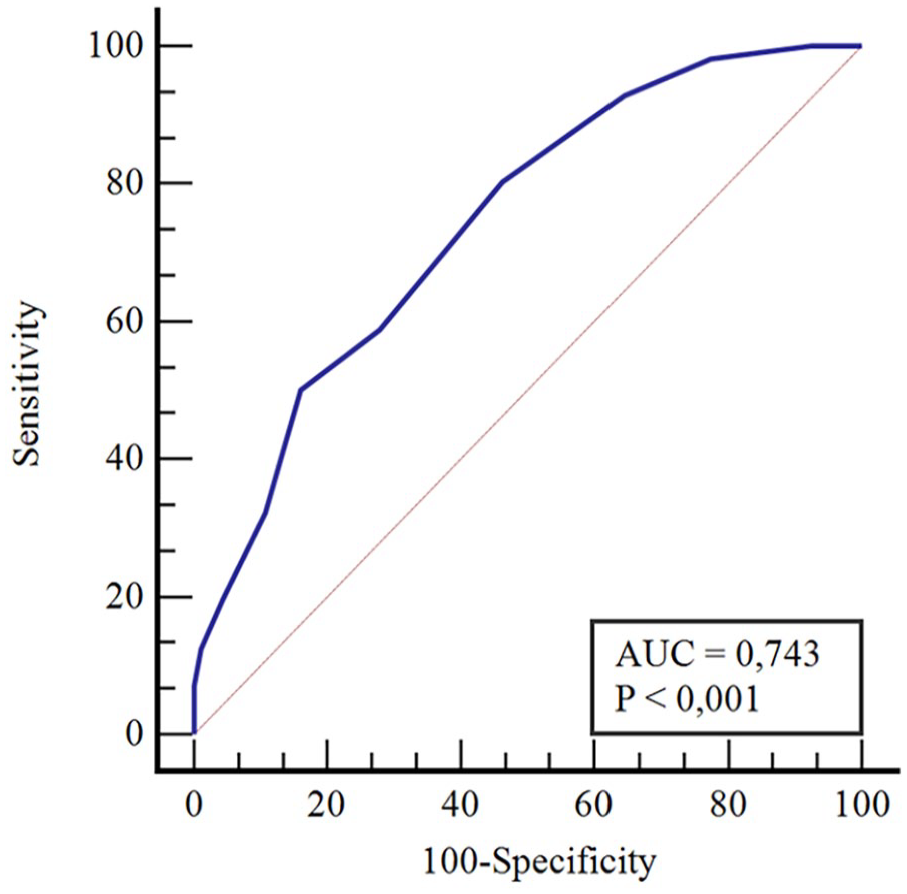
Performance of general total scores in distinguishing the severe AHI group from other groups. AHI, apnea-hypopnea index.
GTS and AHI had a statistically significant moderate positive correlation (rho = .491; P < .001). Furthermore, there was a weak positive correlation between the Berlin sleep questionnaire and AHI (rho = .229; P = .005), as well as between the STOP-Bang questionnaire and AHI (rho = .265; P = .001; Table 5).
Correlation Between Score Values and AHI Values.
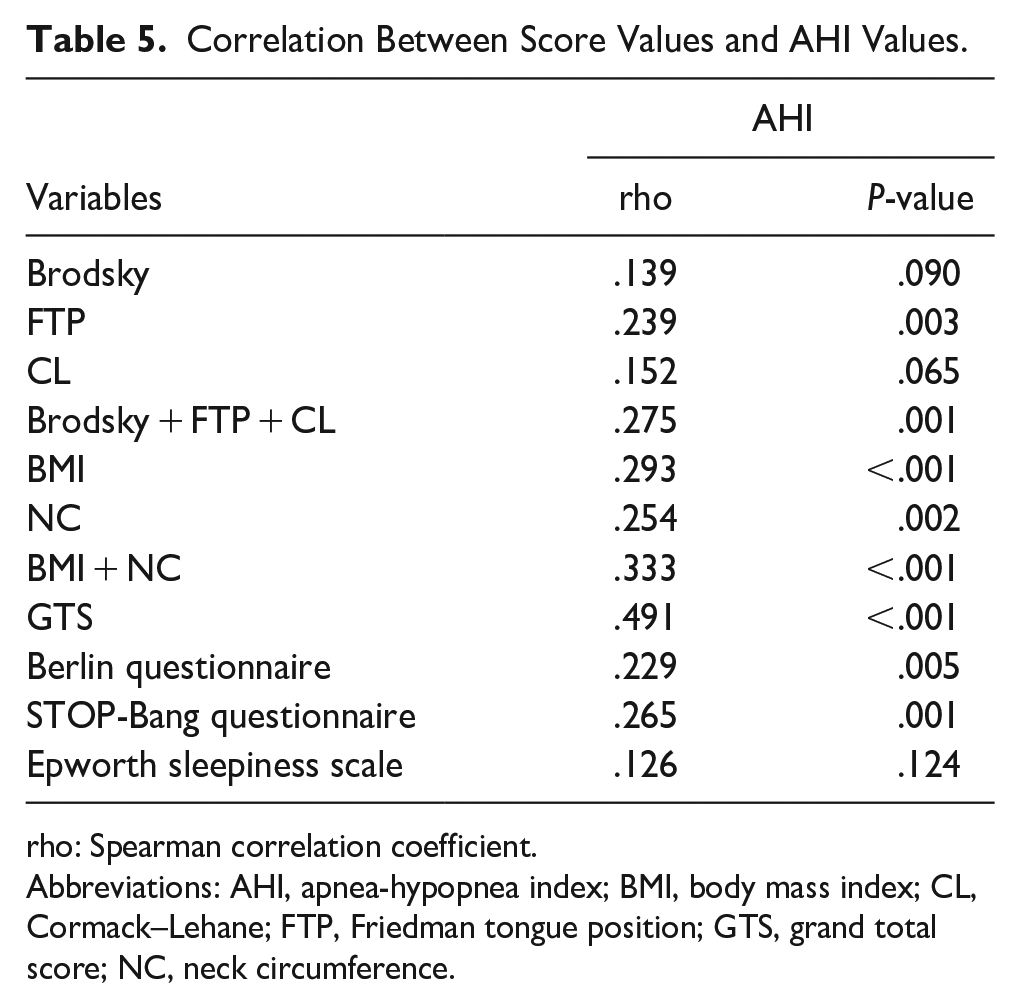
rho: Spearman correlation coefficient.
Abbreviations: AHI, apnea-hypopnea index; BMI, body mass index; CL, Cormack–Lehane; FTP, Friedman tongue position; GTS, grand total score; NC, neck circumference.
There was a statistically significant difference in the correlation coefficients between the GTS and the Berlin sleep questionnaire and between the GTS and the STOP-Bang questionnaire (P = .009; P = .023). There were no statistically significant differences between the Berlin sleep questionnaire and the STOP-Bang questionnaire (P = .743; Table 6).
Comparison of Correlation Coefficients from Correlation Analysis with AHI.
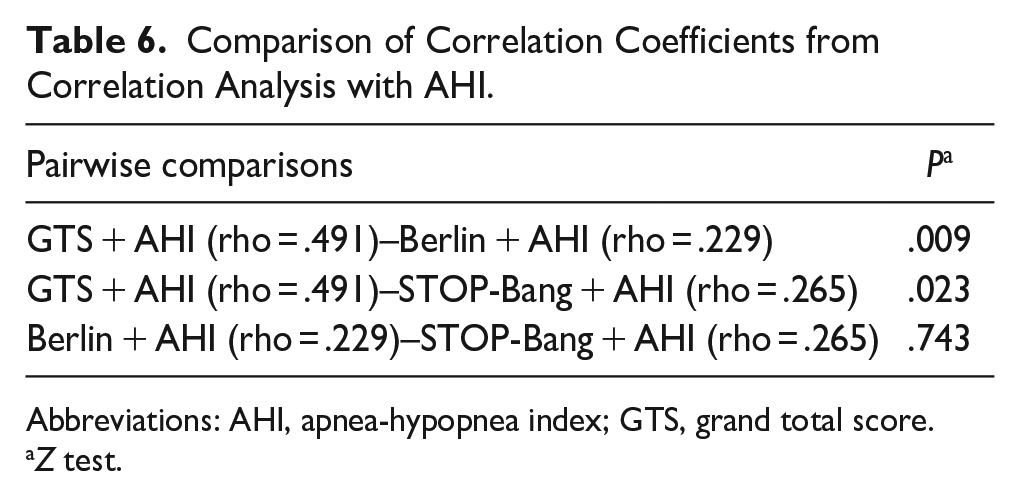
Abbreviations: AHI, apnea-hypopnea index; GTS, grand total score.
Z test.
Discussion
We determined the severity of OSA measured using the AHI and primarily using morphological anthropometric measurements to prioritize patients for PSG. Our findings revealed a statistically significant moderate positive correlation between AHI and the OSAMS scores (rho = .491; P < .001). In particular, when GTS >4, we achieved a sensitivity of 80.3% and a specificity of 53.9% in patients with severe OSAS. Compared to established screening questionnaires such as STOP-Bang and Berlin, our results demonstrated a superior correlation for OSAMS, with a correlation coefficient of rho = .491 and P < .001 for GTS, compared to rho = .229 and P = .005 for the Berlin questionnaire, and rho = .265 and P = .001 for the STOP-Bang questionnaire.
Traditional screening questionnaires, including the widely accepted STOP-Bang and Berlin sleep questionnaires, mainly focus on patient symptoms and observed apnea findings. However, they do not account for the findings of the oropharyngeal-laryngeal examination, which is critical for assessing the size and shape of the upper airways about OSA pathogenesis. OSAMS is primarily a screening tool developed based on the patient’s morphological characteristics, consisting of internal and external parameters. Internal parameters demonstrate mainly the upper airway morphology. The tonsilla palatina (TP) is one of the internal morphological features assessed. The correlation between TP and AHI is highly debated in the literature.
Most studies that have analyzed the relationship between subjective tonsil size and the severity of OSA in adult patients have confirmed a positive correlation. For example, a study conducted in an adult cohort in the United States found that an increase in tonsil size was significantly associated with increased OSA severity. 7 However, Nolan et al reviewed 20 publications in a pediatric group. They found that 11 studies showed a relationship between subjective tonsil size and objective OSA, while 9 did not, with high-quality studies that indicated no relationship. 8 Similarly, Howard et al reported no correlation between subjective tonsil size and AHI. However, they noted that subjective tonsil size measurements correlated well with objective tonsil volume measurements; only the latter significantly predicted objectively measured OSAS severity. 9 While most studies in adult patients confirm a positive correlation between subjective tonsil size and OSA severity, the findings in pediatric cases are inconsistent and generally weak.
Our study used the Brodsky subjective tonsil classification method, which is easily applicable in outpatient settings without imaging techniques. Although not statistically significant, we observed a trend suggesting a relationship between subjective tonsil grade and AHI (rho = .139, P < .090). We used the FTP classification for the second internal morphological parameter, a modification of the Mallampati score. This is an easy and reproducible method to assess the size and shape of the oropharynx and is also considered more suitable for sleep physiology with the tongue left in a natural position.
In Friedman’s initial study with 172 cases and a subsequent meta-analysis, a statistically significant relationship between FTP and AHI was established to determine the severity of OSAS10,11; another study 12 later confirmed this, but other studies contradicted these findings. For example, a smaller study involving only 8 cases found no statistically significant connection between the Mallampati classification and OSAS, concluding that the classification does not benefit prioritizing patients. 13 Our study demonstrated a statistically significant relationship between FTP and AHI in evaluating the oropharyngeal region (rho = .239, P < .003).
The third internal parameter focused on the hypopharynx–laryngeal region using awake flexible laryngoscopy and the CL classification. Although no previous studies have directly correlated this classification with AHI, our findings indicate a trend approaching significance, suggesting its potential as a marker of OSA risk (rho = .152, P < .065). 14 This relationship was stronger than tonsil grade but weaker than FTP. During these internal parameter examinations, patients remained sitting and awake, which we believe sufficiently demonstrates the upper airway morphological anatomy.
Combining all internal parameters (Brodsky + FTP + CL) produced a statistically more significant result compared to individual evaluations (rho = .275, P < .001). NC is a morphological parameter evaluated in the external group. The literature supports the finding that NC has a positive correlation with AHI,15,16 and clinically, NC is a strong determinant of OSA.17,18 Cizza et al reported that an NC <38 cm had a sensitivity of 58% and a specificity of 79% to predict the presence of OSA. 17 Soylu et al reported that the optimal cut-off values of NC to predict OSA were 35.5 cm for women and 39 cm for men. 15 Zhou et al reported NC values of 33 cm for women and 37 cm for men as the optimal cutoff values for metabolic syndrome in Chinese adults with OSA. 19 Our study found a weak relationship between subjective NC and AHI (rho = .254, P < .002). This may be due to our setting of higher baseline NC values at 41 to 43 cm for both women and men, with scores above these thresholds receiving a score of 3 and those below a score of 0. 20
BMI has a definite relationship with OSAS and is the most studied external morphological parameter.21,22 Recent research indicates that approximately half of OSA-positive individuals are obese, and sleep apnea is prevalent in ~40% of the moderately overweight population, both men and women. Additionally, the prevalence of sleep apnea is estimated to vary between 40% and 90% in cases of severe obesity.23,24 This relationship was statistically significant (rho = .293, P < .001). Among the parameters examined separately, the strongest correlation was with BMI, followed by NC, FTP, CL, and Brodsky, respectively.
Comparing the correlation of AHI with external morphological characteristics (BMI and NC, rho = .333, P < .001) versus internal morphological characteristics (FTP, CL, and Brodsky scale, rho = .275, P < .001), a robust statistical relationship was observed with external characteristics. This could be explained by the accumulation of fat in the neck area due to the higher BMI affecting the other parameters, which could lead to the narrowing and collapse of the structures of the upper respiratory tract.
OSAMS was more successful in detecting patients with severe OSA compared to the Berlin sleep and STOP-Bang questionnaires in our study group (GTS rho = .491, P < .001, Berlin sleep questionnaire rho = .229, P < .005, STOP-Bang questionnaire rho = .265, P < .001). This may be due to the positive effects of the 3 parameters obtained together during the physical examination of the upper respiratory airway and the exclusion of hypertensive patients from the study surveys. OSAMS, a simple and practical form, can be completed quickly and scored by an ENT physician during a physical examination. It is more based on objective findings than on subjective patient-reported data. To minimize personal differences, a visual-supported standardized OSAMS was used for each patient, and the score was determined by consensus among 3 physicians.
One notable limitation of our study is the relatively high rate of false positives observed when using the OSAMS to detect severe OSAS. Several factors may contribute to this issue: Internal morphological parameters, such as tonsil size and tongue position, are subjectively evaluated, which could lead to variability in scoring between different examiners. Despite efforts to standardize these evaluations, inherent subjectivity remains.
Variability in these assessments could lead to inconsistent scoring and higher rates of false positives. To reduce subjectivity and increase reliability, incorporate more objective tools, such as imaging techniques or digital measurements, to assess internal morphological features.
All physical examinations were performed with patients in an awake and seated position. This setting may not fully replicate the anatomical changes during sleep, which can affect the accuracy of internal morphological assessments. Performing sleep endoscopy to evaluate morphological characteristics closely mimic natural sleep physiology. This approach could provide more accurate information on airway dynamics during sleep.
The study cohort consisted of patients suspected of having OSAS, which could lead to a higher prevalence of positive findings. This could skew the sensitivity and specificity of OSAMS, as the scale was not validated in a general population sample.
The characteristics of the study population might not generalize well to other populations. For example, suppose the study predominantly involved individuals from a specific demographic or ethnic background. In that case, the tool may not perform as well in more diverse populations, increasing false positives.
By excluding patients with comorbidities, the study might have selected a population that does not represent the typical patient with OSAS. This exclusion could lead to overestimating the tool’s effectiveness and a higher rate of false positives when applied to a general population.
The current cutoff value of GTS >4 might be too low, potentially leading to a higher false positive rate. Similarly, the cutoff values for parameters such as NC and BMI may also be set too low, which could result in identifying individuals who do not have severe OSAS. Adjusting these thresholds could help balance sensitivity and specificity more effectively, thereby reducing the incidence of false positives.
To improve overall diagnostic precision, OSAMS should be used alongside other diagnostic tools, such as questionnaires or additional clinical evaluations. This multimodal approach would allow for a more comprehensive assessment. Additionally, incorporating further parameters or employing advanced diagnostic techniques could enhance the accuracy of the screening process.
Validating OSAMS in larger and more diverse population samples, including individuals without suspected OSAS, is essential for assessing its screening accuracy in a broader context. Refining the scoring criteria to better differentiate between varying degrees of morphological abnormalities is also recommended. This could involve incorporating additional parameters or adjusting existing ones to improve predictive accuracy. Developing a weighted scoring algorithm that considers the varying importance of different parameters might further improve the balance between sensitivity and specificity.
By addressing these factors, the rate of false positives can be reduced, enhancing the overall effectiveness and reliability of OSAMS as a screening tool for severe OSAS. Although OSAMS shows promise as a practical and quick screening tool, the high false positive rate observed in this study indicates the need for further refinement and validation. Incorporating more objective measurements, adjusting scoring criteria, and validating the scale in diverse populations are critical to improving its reliability and clinical utility.
Conclusion
Clinicians should recognize that OSAS is a multifaceted disorder influenced by various physiological factors, and its comprehensive understanding cannot be derived solely from a single physical examination finding. The OSAMS system, which includes multiple morphological features, has been proven to be a valuable tool for screening patients with severe OSAS. This scoring system is both quick and easy to administer. Our study indicates that OSAMS values exhibited superiority over conventional questionnaires designed for OSAS screening within our study group. In particular, the external morphological parameters demonstrated greater effectiveness than the internal parameters.
When GTS was >4, we achieved a sensitivity of 80.3% and a specificity of 53.9% to identify patients with severe OSAS.
Potential improvements in its success could involve the incorporation of additional parameters of the upper airways and the expansion of the scoring system to include patient symptoms and complaints. Subsequent research efforts should focus on generating larger data sets representative of the normal population for enhanced screening purposes. This would contribute to the ongoing refinement and validation of OSAMS as a reliable screening tool in clinical practice.
Footnotes
Declaration of Conflicting Interests
The author(s) declared no potential conflicts of interest with respect to the research, authorship, and/or publication of this article.
Funding
The author(s) received no financial support for the research, authorship, and/or publication of this article.
Ethical Considerations
This study strictly followed the principles outlined in the Declaration of Helsinki. Ethical approval was obtained from the local ethics committee (meeting date: 2023, Decision No.: 08-05).
Consent to Participate
Written informed consent was obtained from the participants.
Consent for Publication
Consent was obtained for publication from all participants involved in the study.