
Abstract
Introduction
Advances in the management of salivary disorders have evolved with a focus on the use of sialendoscopes for both assessment and treatment. 1 Sialendoscopy has offered new insights through its capacity to dynamically image the internal architecture of the salivary glands. However, a shortcoming to diagnostic sialendoscopy is the limited perspective provided coupled with the inability to image past strictures or secondary bifurcations.
A broader perspective is permitted through radiographic imaging of Stensen’s duct as has primarily employed static methods such as conventional sialography, digital subtraction sialography, cone beam computed tomography (CBCT) sialography, and magnetic resonance (MR) sialography.2-6 These techniques, except MR sialography, provide valuable images of all but the distal end of the ductal system where it is obscured by a catheter. MR sialography permits imaging of the ductal system unobstructed by a catheter but is limited in its resolution and ability to identify the tertiary ducts. 7 Additionally, each of the static imaging techniques fails to address changes that occur dynamically to the anatomy of the flexible salivary ductal system.
Sialography with fluoroscopy has been performed to assess pathologic processes and guide ductal dilation.8,9 Figure 1 demonstrates the straightening and elongation of Stensen’s duct that can occur with fluoroscopic balloon dilation, which is further demonstrated with traction on the duct of a parotidectomy resection specimen. To our knowledge, the dynamic changes to normal ductal anatomy have not been studied nor quantified.
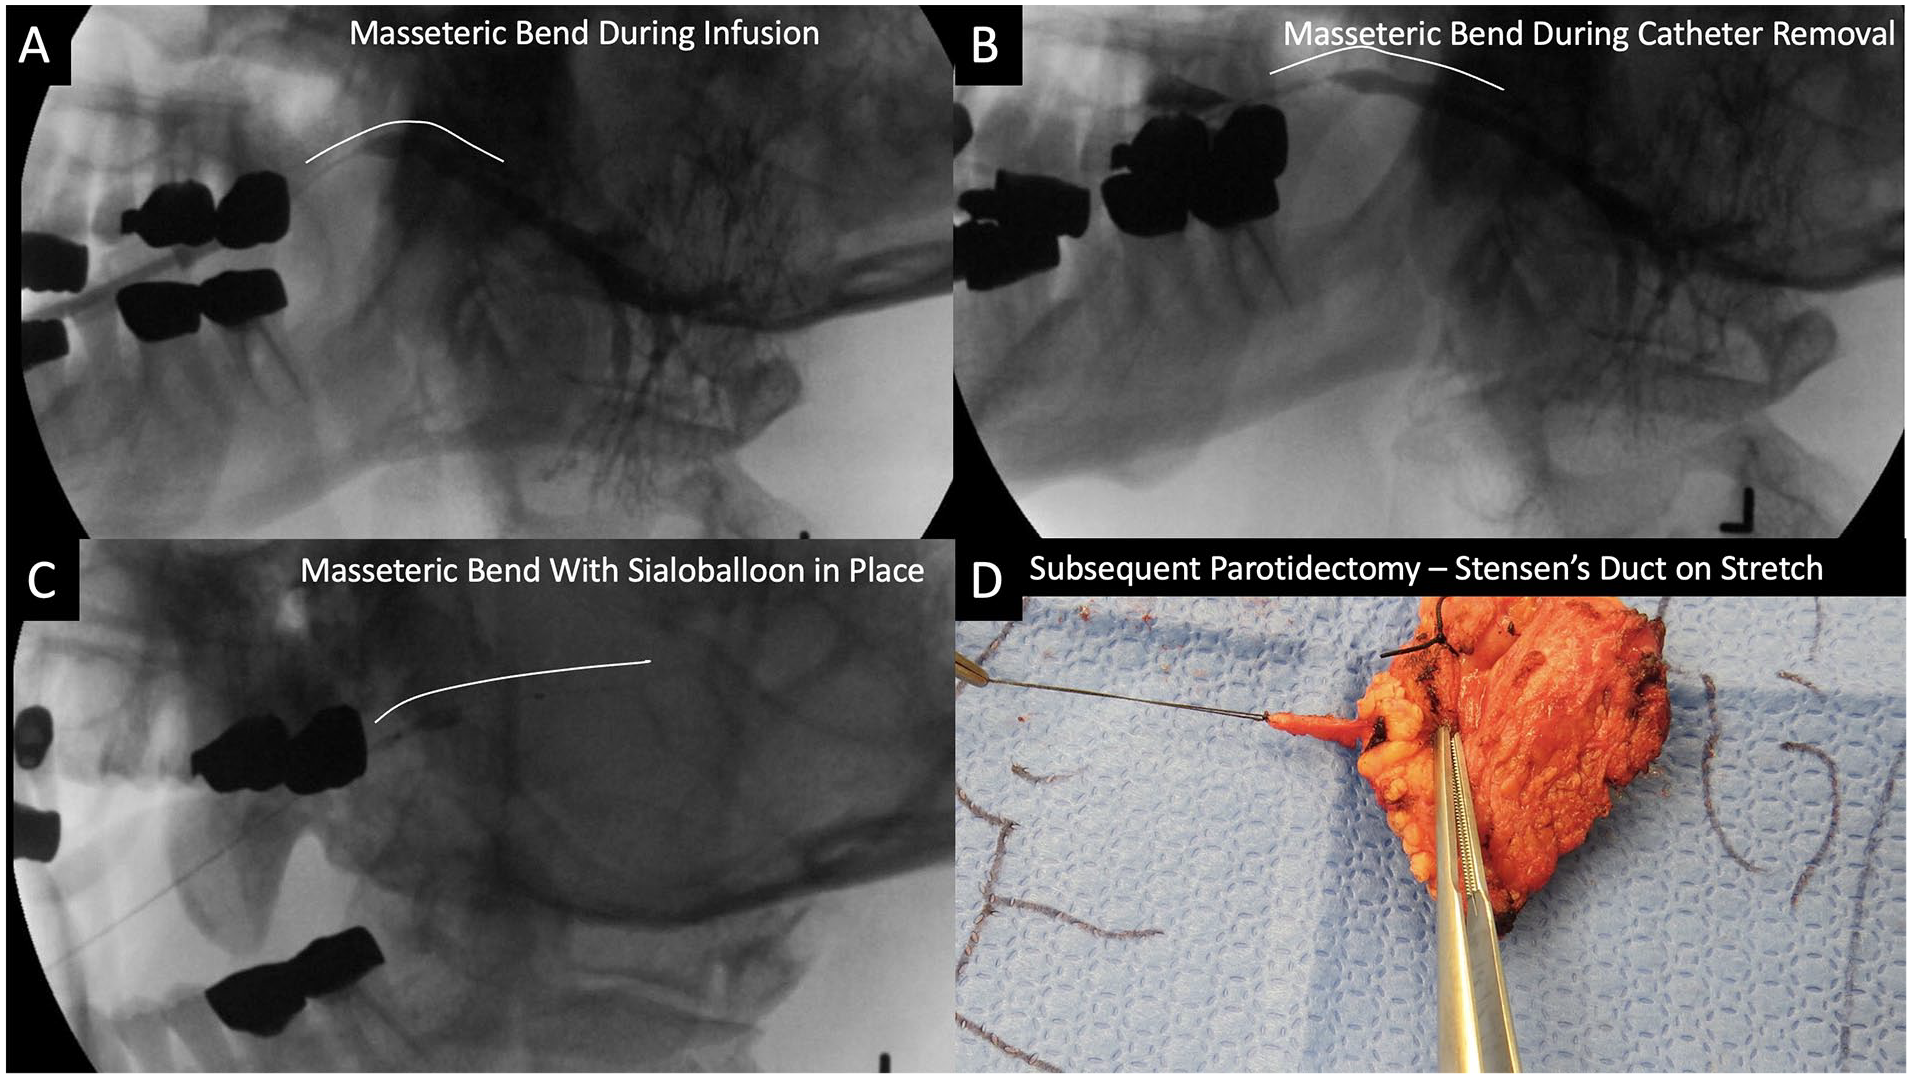
Sialography images demonstrating straightening of Stensen’s duct during fluoroscopic balloon dilation. (A) Masseteric bend during contrast infusion. (B) Masseteric bend during catheter removal. (C) Masseteric bend with sialoballoon in place. (D) Stensen’s duct can be elongated with pull (force) as identified in the excised gland with a segment of duct preserved.
We introduce a technique to permit imaging of the distal portion of Stensen’s duct unobstructed by the presence of a catheter, termed the “Maley Maneuver” in recognition of the radiologist who created it. Utilization of this technique is additionally valuable during contemporary digital infusion sialography to enhance assessment of ductal changes by emphasizing fluoroscopic imaging during catheter removal. Straightening of the duct occurs through traction created during catheter removal, and Stensen’s duct is oriented in a manner comparable to that experienced during sialendoscopy. Measurements of the lengths and angles of the duct with the infusion catheter in place (in repose), during removal (on stretch), and after removal (in recoil) can be compared. Through review of 14 contemporary fluoroscopic digital infusion sialograms utilizing the “Maley Maneuver,” we provide analysis of dynamic changes to the length and varying angulation of Stensen’s duct.
Patients and Methods
Study Population
Following institutional review board approval (#201909820), a retrospective chart review identified sialograms performed by one surgeon (HTH) at the University of Iowa Hospitals and Clinics from April 2008 to June 2023. Informed consent was waived because the study was retrospective. A database that records procedures performed in the fluoroscopy suite was used to identify 513 sialograms of which 409 were of the parotid. Corresponding medical record numbers were collected to review imaging reports and identify those which evaluated the parotid gland and had “normal” or “unremarkable” findings. Additionally, subgrouping of sialograms with stricture(s) was conducted to identify those with distal (punctal) strictures to determine the potential influence of the stricture on ease of catheter removal and association with duct lengthening. Exclusion criteria included incomplete video imaging or post-catheter removal imaging, modified imaging orientation, incomplete contrast filling of parotid gland, and incomplete catheter “hubbing.” Variables collected from the electronic medical record for the study patients included sex, age at timing of sialography, height, BMI, symptoms/indications warranting sialography, size of angiocatheter used in sialography, radiation dose received during sialography, and location of stricture noted on the sialography report, when applicable.
Parotid Sialography
All sialograms were performed in the fluoroscopy suite using consistent technique, as previously described. 10 A microscope was used to help direct placement of a 22- or 24-gauge angiocatheter into the main parotid duct orifice. Lateral traction on the cheek was employed to facilitate duct cannulation with fixation via clenching of the teeth over a 4 × 4 gauze placed around the angiocatheter. This fixation persisted throughout the study until catheter removal with concurrent jaw opening. Contrast was administered into the duct under fluoroscopic guidance. Isovue®-370 (Bracco Diagnostics, Milan, Italy) contrast was used for 13 of the subjects, and Gadavist® (Bayer, Whippany, New Jersey, USA) was used for one patient with reported iodine allergy. Once adequate duct opacification was achieved, radiographs were obtained including video imaging with fluoroscopy. During angiocatheter removal with concurrent contrast infusion, recording was performed. Static imaging (of higher quality than fluoroscopic imaging) was done immediately after angiocatheter removal (following withdrawal) and then repeated with delayed imaging following gland massage along with ingestion of lemon juice to stimulate salivation and clear the duct of contrast.
Image Interpretation/Data Collection
Retrospective assessment of the sialograms eligible for inclusion was performed by two radiologists in collaboration, each with greater than 10 years of experience interpreting sialograms. The PACS system of the University of Iowa Hospitals and Clinics (©2023 Koninklijke Philips N.V. Build 12.2.8.2130003) was used, which allows for the accurate measurements of lengths and angles.
Study images were oriented in a standard fashion with fluoroscopic imaging via a lateral approach and still images in both the lateral and anterior-posterior positions. Some images required modification from the true lateral position to avoid obstructed visualization from structures such as dental amalgams. Each sialogram was evaluated for adequacy of ductal imaging as reported in Sabotin et al., and each was described as “excellent.” 11 The main (primary) duct was determined to extend from the orifice (oral cavity) to the first major ductal bifurcation as defined by the Iowa Sialogram Classification System (Figure 2).12,13
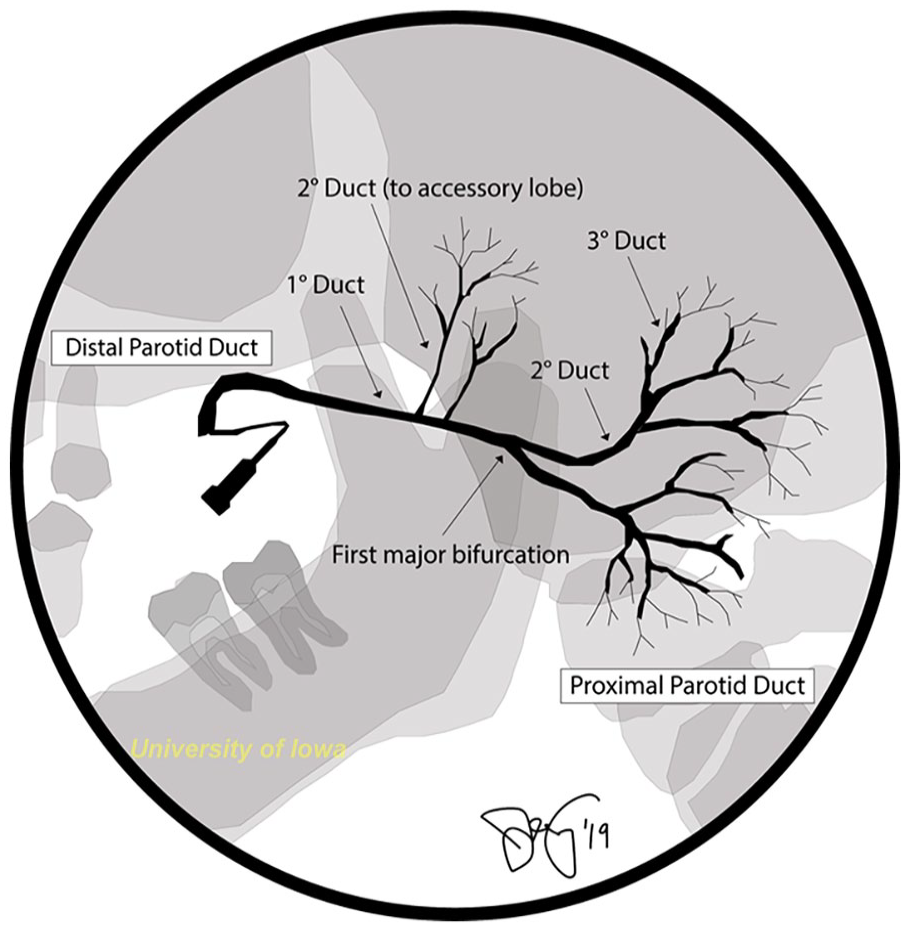
Ductal nomenclature (Iowa Sialogram Classification System).
The following variables were recorded from analysis:
Length (mm) of the main duct after the catheter had been placed (repose) using a still image. The hub of the catheter represented the presumed location of Stensen’s duct orifice (Figure 3A).
Length (mm) of the main duct on stretch during catheter withdrawal as video-imaged with fluoroscopy. The duct orifice was represented by a “spray” of contrast (Figure 3B).
Length (mm) of the main duct following recoil after catheter withdrawal using a still image (Figure 3C).
Angle of the masseteric bend for each of the three previously described duct positions. Angles were calculated using the angle tool on the previously described PACS system. A 3 to 5 mm line was drawn to the vertex on the proximal side of the duct, and a subsequent line was drawn from the vertex distally (Figure 4). Attention was given to evaluate landmarks to ensure that the same region of the duct was being measured for stretch and recoil images.
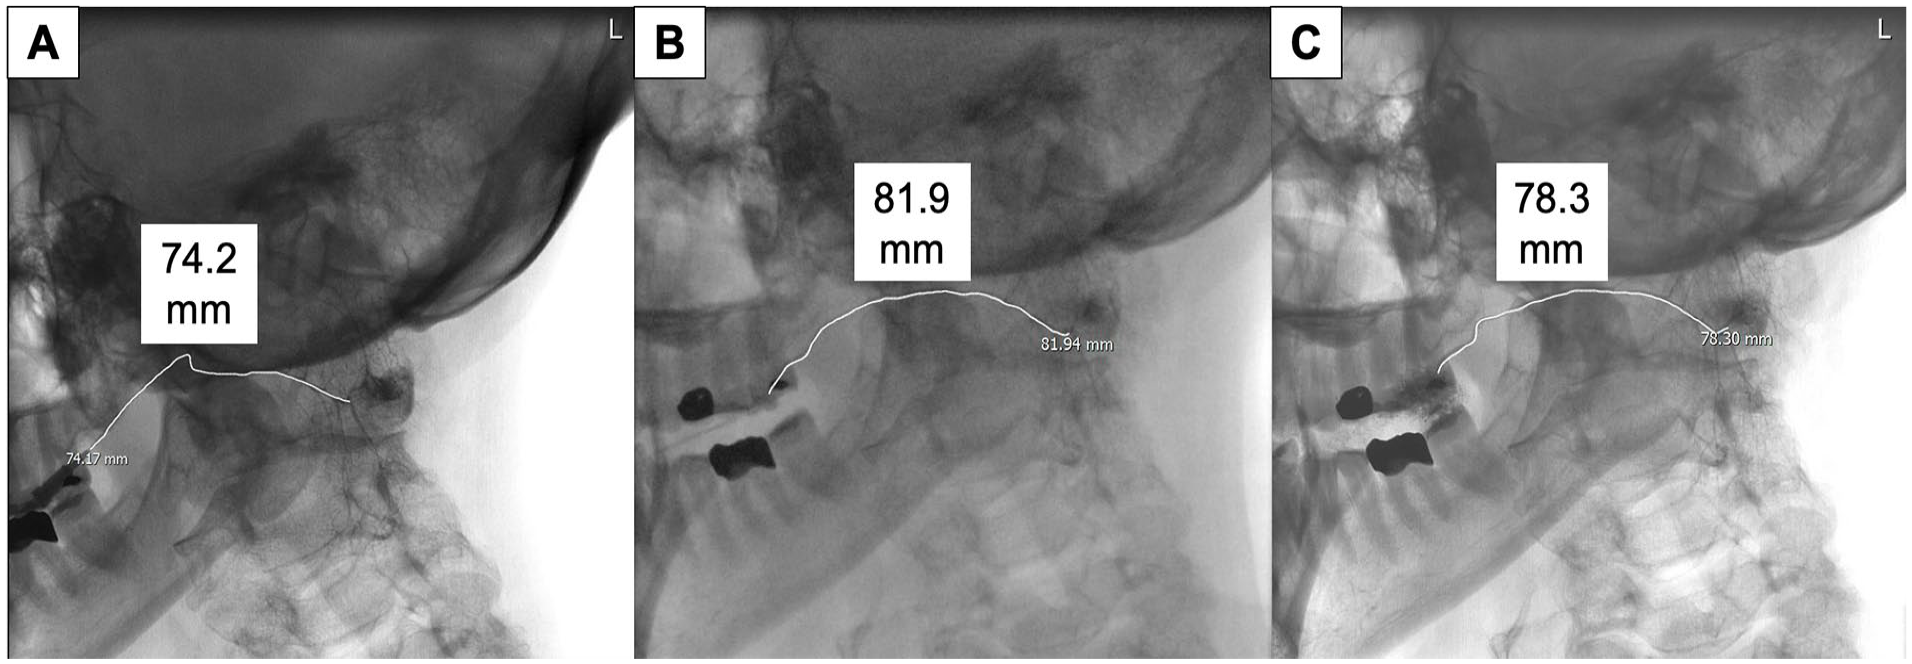
Sialography images demonstrating methods of measuring length of Stensen’s duct. (A) Length in repose. (B) Length on stretch. (C) Length on recoil.
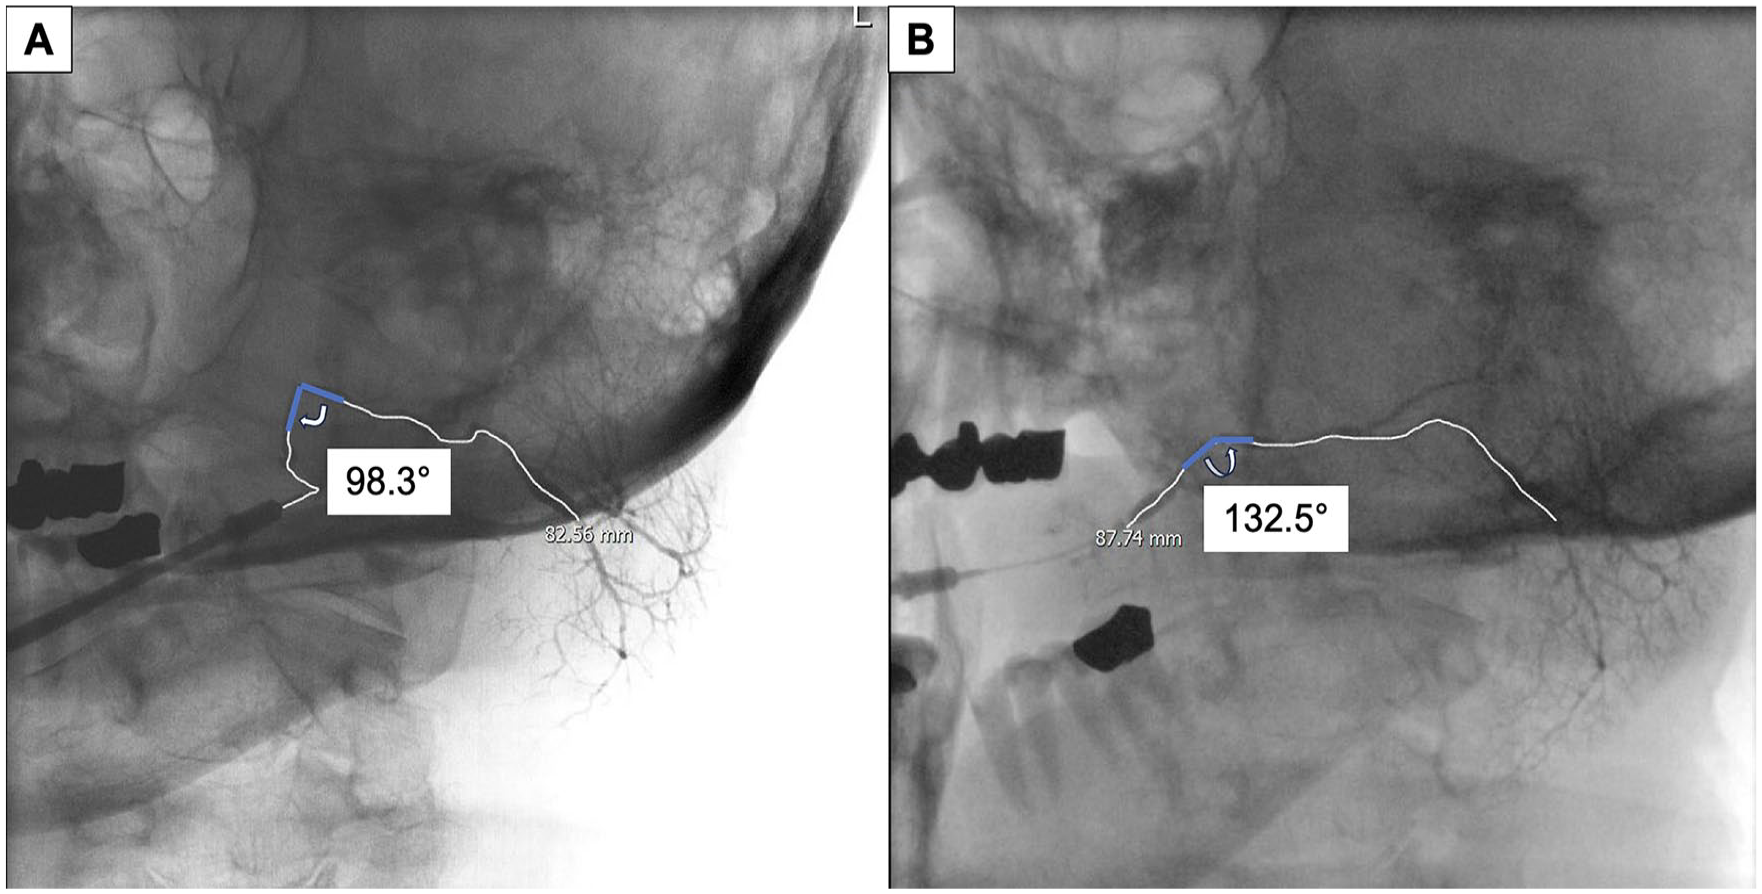
Sialography images demonstrating methods of measuring the angle of the masseteric bend. (A) Angle in repose. (B) Angle on stretch.
Statistical Analysis
All analyses were conducted using GraphPad Prism version 10.0.0 (San Diego, CA, USA). Descriptive statistics were performed for patient characteristics and radiographic features. Wilcoxon matched-pair signed rank and Mann–Whitney tests were used to analyze paired and unpaired data, respectively. Spearman’s rank correlation analyses were used to determine correlations between patient height and BMI and duct length. P-value < .05 was considered statistically significant.
Results
Patient Characteristics
Of the 513 sialograms evaluated, 409 were focused on the parotid gland. Forty-nine were identified to have findings described as “normal” or “unremarkable,” of which 23 had been performed after 2017, a time point selected to include only studies employing contemporary catheter removal techniques. Of those 23 sialograms, 15 were excluded for absence of complete video imaging or post-catheter removal imaging, and 1 was excluded due to dental artifact obscuring complete visualization of Stensen’s duct (Figure 5).
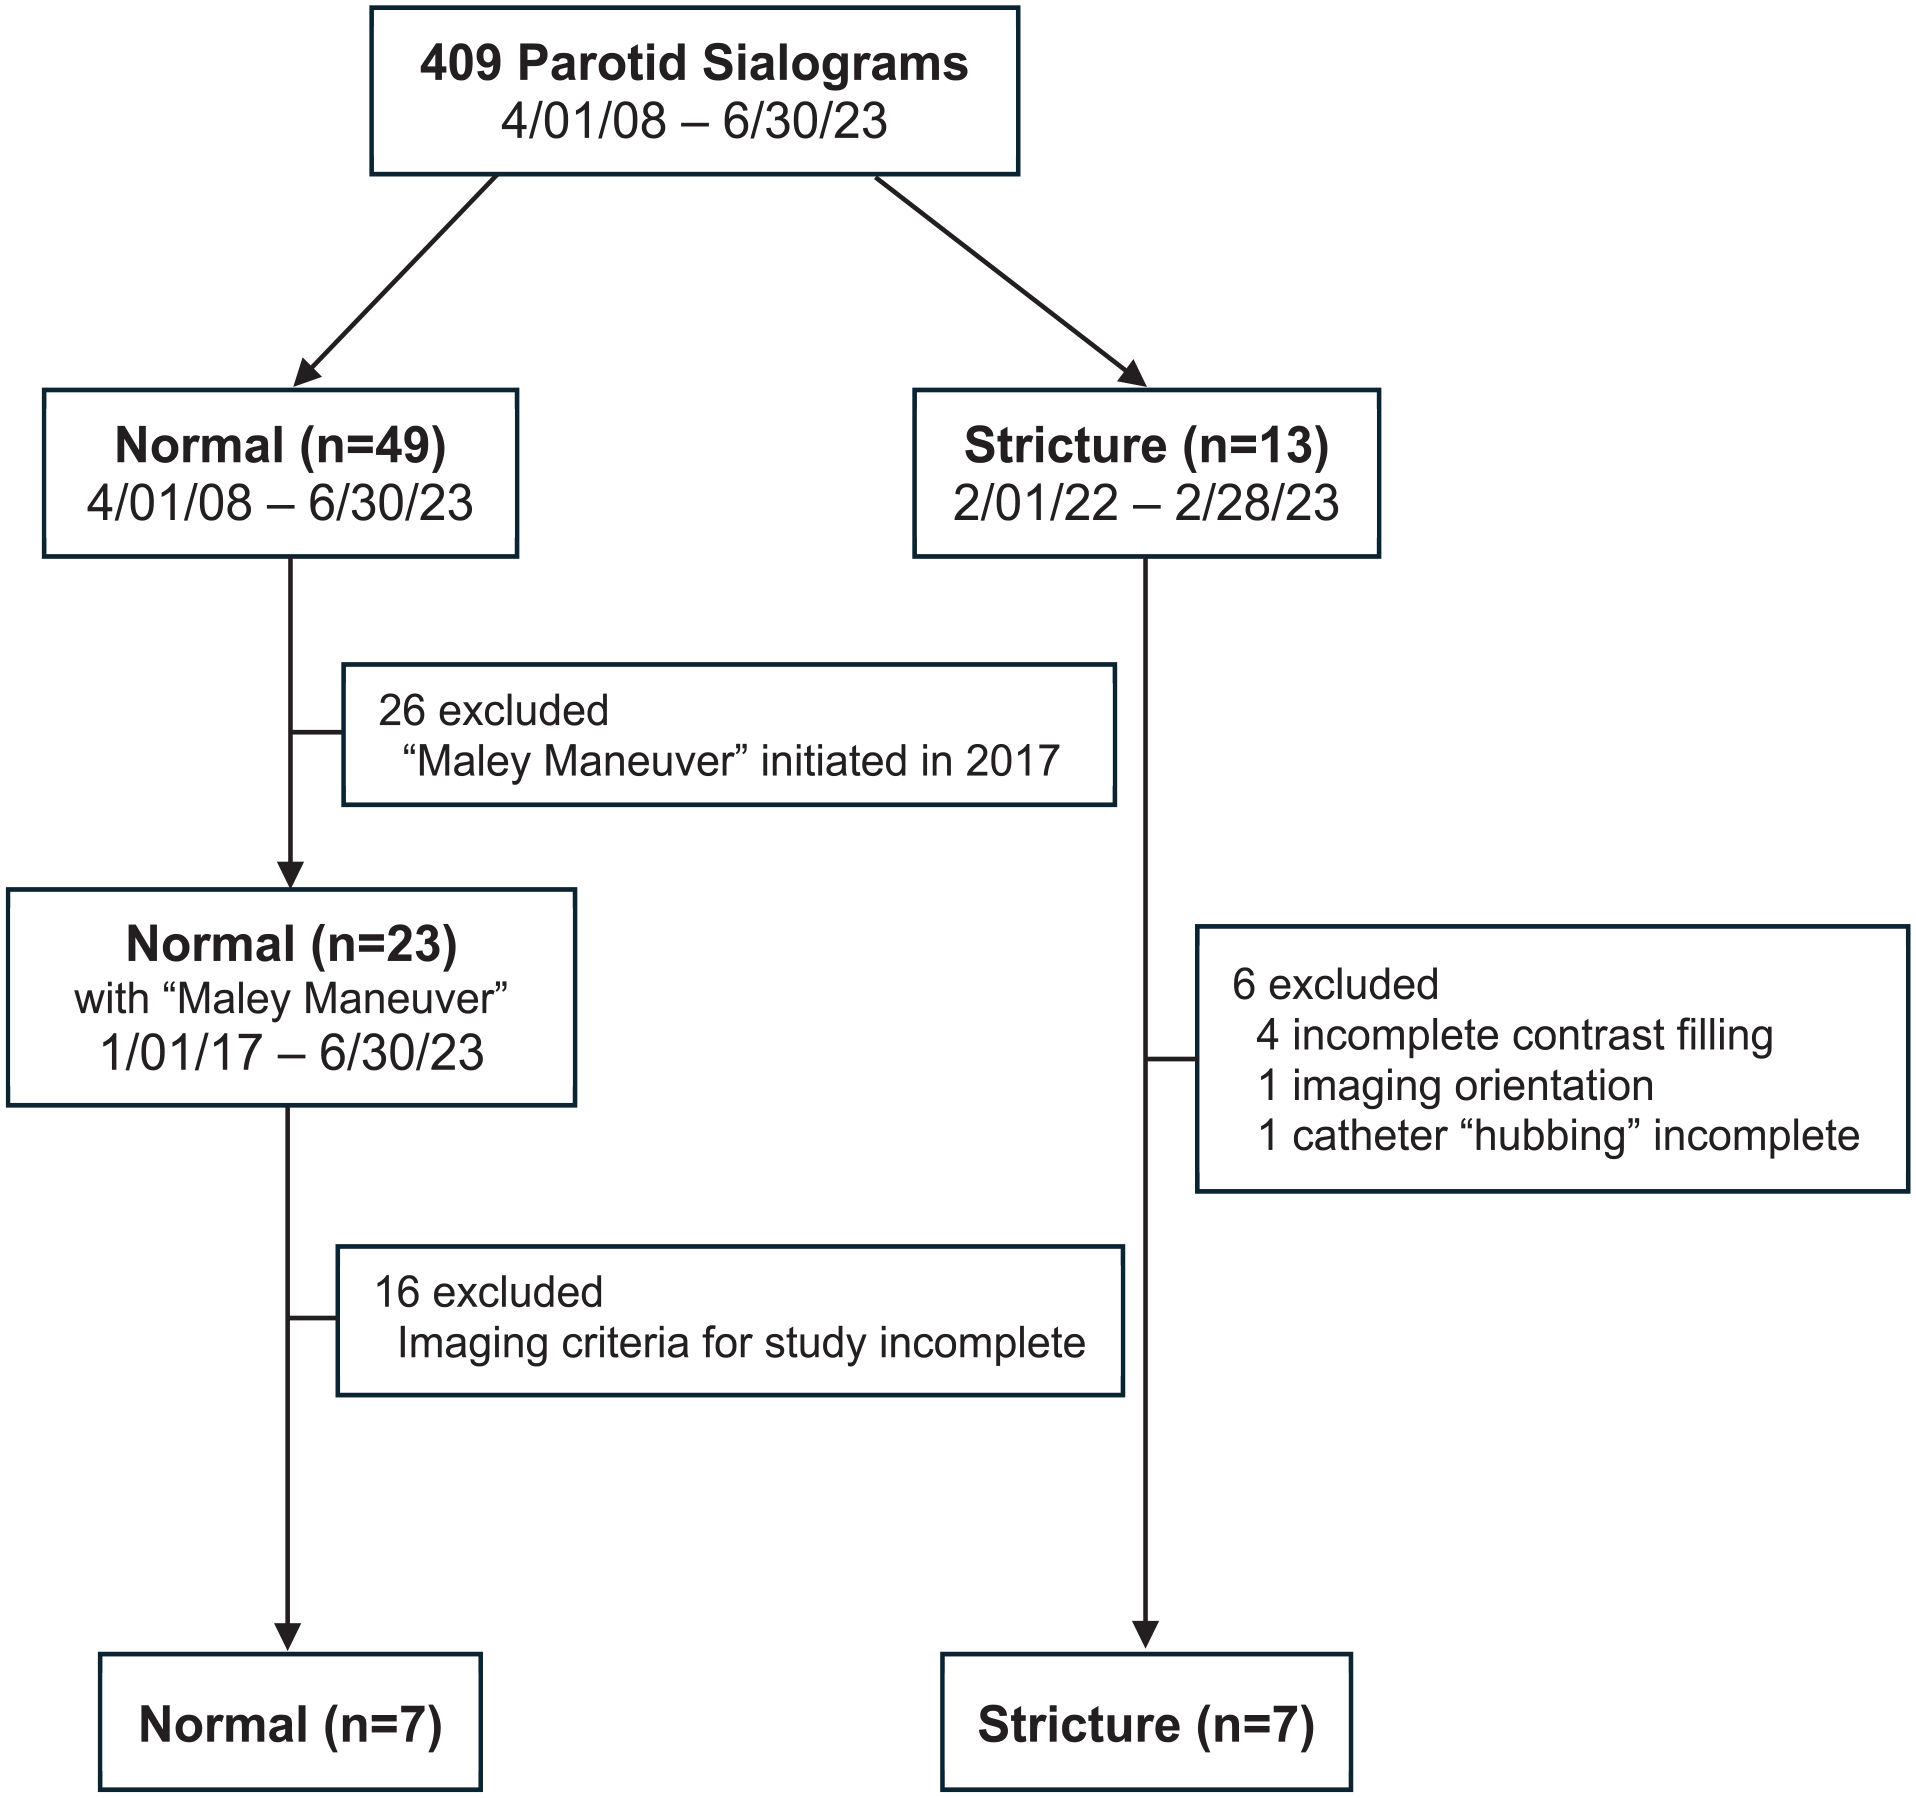
Flowchart of patient selection.
The 409 parotid sialograms were also screened for those identified to have strictures. Thirteen sialograms with strictures involving Stensen’s duct were identified in a 13-month period ending February 2023. Of those 13, 4 were excluded for incomplete contrast filling of the parotid gland due to the presence of a tight stricture, 1 was excluded for a modification of imaging orientation, and 1 was excluded for inability to advance the catheter to its full length (“hubbing”) despite completing the sialogram satisfactorily.
Patient characteristics are presented in Table 1. Fourteen patients were ultimately included, 7 with normal sialograms and 7 with strictures. The study population is 71% female (n = 10) with a median age of 55 years (IQR, 24.7; range, 31–80), median height of 165.1 cm (IQR, 15.8), and median BMI of 32.1 kg/m2 (IQR, 13.1). Indications warranting sialography included 4 patients with symptoms including xerostomia, pain, and/or swelling concerning for Sjogren’s syndrome, 9 patients with sialadenitis including one patient with a sialolith, and one patient with a normal sialogram performed to identify that a draining anterior facial lesion (possible salivary fistula) was not salivary in origin.
Patient Characteristics.
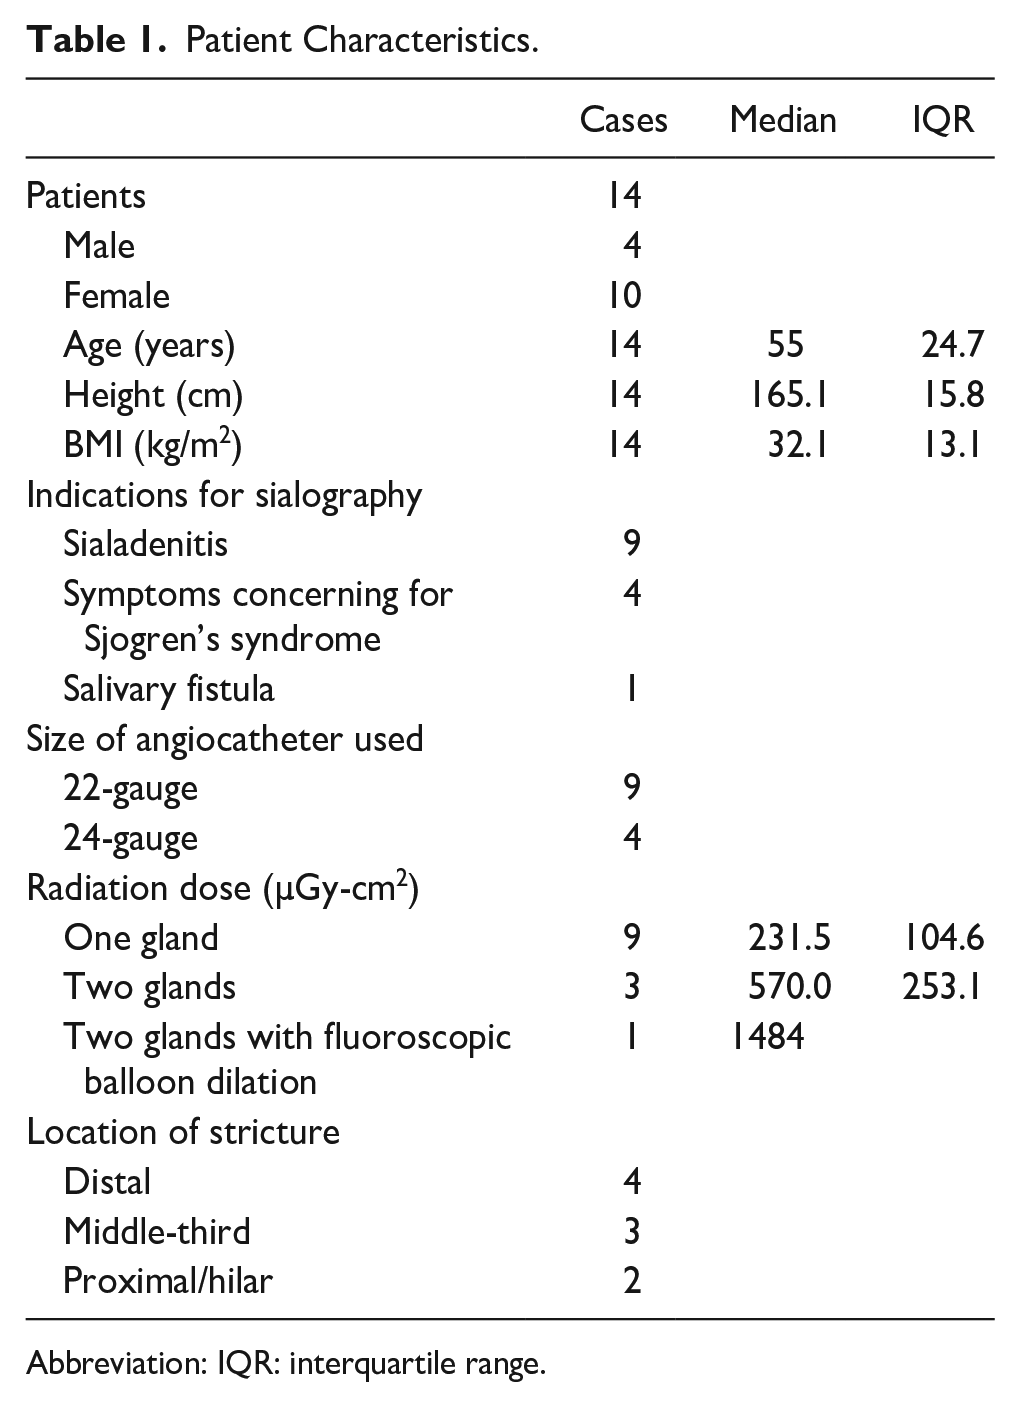
Abbreviation: IQR: interquartile range.
A 22-gauge angiocatheter was chosen preferentially for use during sialography (n = 9, 64%) with a 24-gauge angiocatheter employed for narrower ducts (n = 4, 29%), which in this cohort was employed exclusively in patients with strictures. The size of angiocatheter used for one patient was not recorded. The median radiation dose acquired during sialography was 231.5 µGy-cm2 for patients with one gland assessed (n = 9) and 570 µGy-cm2 for two glands assessed (either both parotid glands or parotid and submandibular gland) (n = 3). One patient underwent fluoroscopic balloon dilation during sialography producing a radiation dose of 1484 µGy-cm2. The radiation dose acquired for one patient with one gland assessed was unknown.
Among the 9 stenoses identified in the 7 patients with strictures, 2 were “proximal/hilar,” 3 were middle-third, and 4 were “distal duct including papillary region” as modified per the Goncalves classification of stone location.14,15
Sialographic Anatomy
Combined data (n = 14)
The median lengths (with IQR) in mm of Stensen’s duct in repose, stretch, and recoil were measured to be 81.5 (12.3), 88.0 (13.5), and 79.5 (20.0), respectively. The median difference in length (IQR) between repose and stretch was 5.0 mm (4.3), which was statistically significant (P < .001) (Table 2). Additionally, there was a significant difference in duct lengths in stretch and recoil (P < .001). There was no significant difference between the duct lengths in repose and recoil (P = .46). The median percent increase in duct length from repose to stretch and repose to recoil was 6.3% and 1.9%, respectively. We observed but did not quantify changes to duct caliber that routinely occurred during all sialography as pressure increased in the system with contrast infusion.
Length of Stensen’s Duct (n = 14).
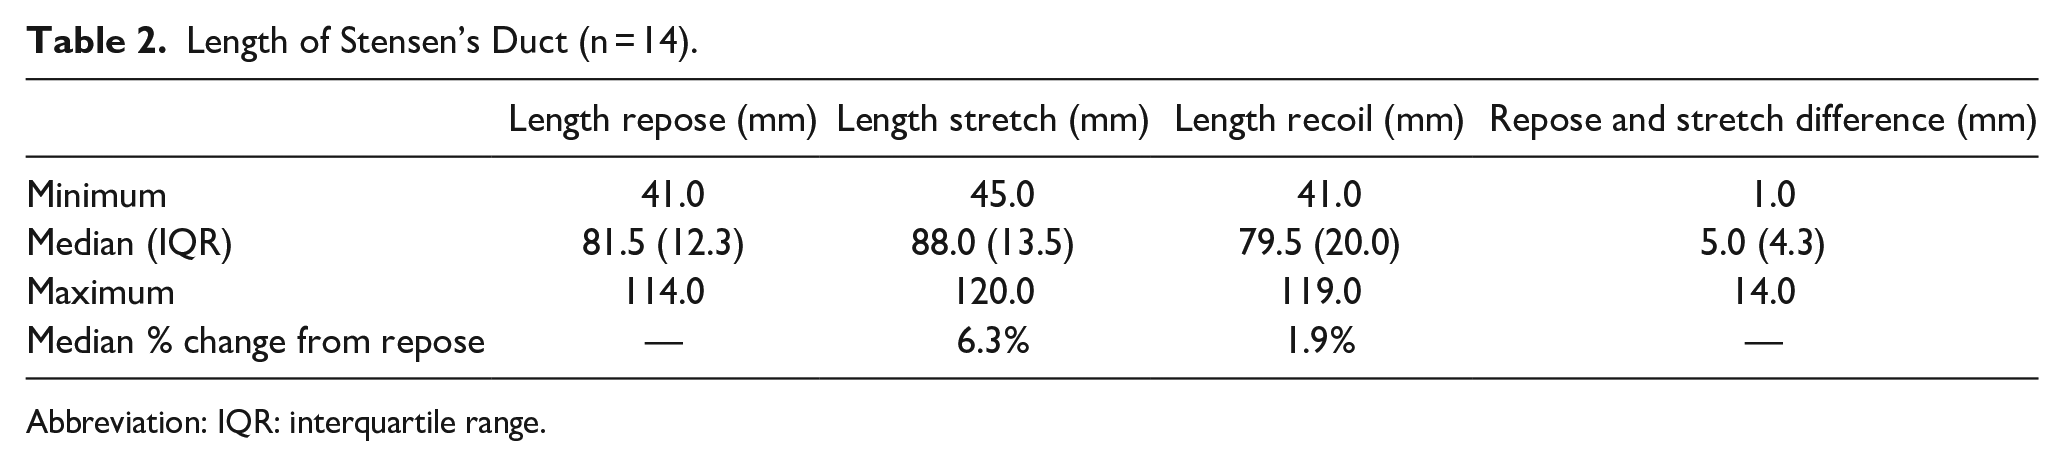
Abbreviation: IQR: interquartile range.
The median angles in degrees (IQR) of the masseteric bend in repose, stretch, and recoil (two-dimensional assessment) were 117.7 (62.4), 155.4 (22.6), and 160.0 (24.6), respectively (Table 3). The median difference in angle (IQR) between repose and stretch was 36.4° (40.0) which was statistically significant (P < .001). The median percent increase in masseteric bend angle from repose to stretch and repose to recoil was 32.9% and 31.1%, respectively.
Angle of Masseteric Bend (n = 14).

Abbreviation: IQR: interquartile range.
Normal sialograms (n = 7)
The median lengths (IQR) in mm of Stensen’s duct in repose, stretch, and recoil were measured to be 85.0 (19.0), 91.0 (21.0), and 90.0 (16.0), respectively. The median difference in length (IQR) between repose and stretch was significantly different at 6.0 mm (9.0) (P = .02).
Sialograms with distal stricture(s) (n = 4)
The median lengths (IQR) in mm of Stensen’s duct in repose, stretch, and recoil were measured to be 81.5 (9.0), 86.0 (7.8), and 74.5 (14.0), respectively. The median difference in length (IQR) between repose and stretch was not significantly different at 3.5 mm (3.3) (P = .13).
Normal sialograms (n = 7) versus sialograms with distal stricture(s) (n = 4)
The median percent change between duct length in the repose and stretch position for normal sialograms (9.8%) versus distal stricture sialograms (4.5%) was not statistically significant (P = .07).
Angiocatheter size and change in duct length
The median percent change (IQR) between duct length in the repose and stretch position was 9.8% (7.1) and 5.5% (3.4) for sialograms using a 22- and 24-gauge angiocatheter, respectively (P = .20, n = 13).
Patient demographics and duct length
There was no correlation between patient height and duct length for repose (r = .25, P = .39), stretch (r = .30, P = .30), or recoil (r = .09, P = .75). There was no correlation between patient BMI and duct length for repose (r = .10, P = .74), stretch (r = .07, P = .80), or recoil (r = .29, P = .31).
Median duct lengths in repose for males and females were 85.0 and 80.0, respectively (P = .61). Similarly, there was no significant difference between median duct lengths in males versus females for stretch (P = .61) or recoil (P = .82).
Discussion
The statistically significant differences (P < .001) in primary duct length and masseteric bend angulation from repose to stretch indicate the dynamic nature of Stensen’s duct occurring with manipulation during sialography. We observed that not only do the length and orientation of the duct change, but also the internal dimensions as the lumen diameter increases with contrast infusion and decreases as the catheter is removed and contrast empties from the duct. These findings offer perspective in the management of parotid abnormalities that require ductal manipulation, including sialendoscopy.
A key study conducted by Avishai et al. analyzed anatomical features of the parotid duct using CBCT sialography. Employing a PACS system (Vue Pacs Version 12.1.5, Carestream Health Inc.©, Rochester, NY, USA) to interpret static three-dimensional CBCT images using volume rendering, they identified a median distance of 75.4 mm between the papilla and hilus of Stensen’s duct. 4 These results are similar to ours which identified the median length (IQR) of Stensen’s duct to be 81.5 mm (12.3) during repose and 88.0 mm (13.5) during catheter withdrawal (stretch). Unlike studies limited to review of static images, our analysis identified changes in duct length from the baseline measurement in repose (catheter in place). Results demonstrated an elongation of 6.3% upon catheter removal and subsequent return to comparable lengths as repose with recoil shortening as evidenced by the lack of statistical significance between median duct lengths in repose and recoil (P = .46).
The measurements of length and angle in our study are limited to two dimensions, differing from Avishai et al. who conducted a multiplanar analysis through static CBCT imaging. It is possible that the changes we identified to the duct are neither due to lengthening nor due to stretching as the catheter is withdrawn but are rather a factor of being re-oriented in a way that cannot be definitively visualized in two dimensions. Interpretation of three-dimensional volumetric data through volume rendering using static CBCT imaging more clearly represents the true length of the duct in a static image. 4
Avishai et al. further provides a guide to advancing the endoscope based on their measurements of different sections of the duct and angles of the duct curvature. 4 Although the CBCT technique offers advantages by way of three-dimensional assessment, its use of static images fails to acknowledge the dynamic changes occurring to Stensen’s duct during manipulation as highlighted in our study.6,16,17 The novel technique we present provides greater perspective than static imaging to assess the full extent of the varying dimensions and curvature of Stensen’s duct. In addition, plain film sialography has been reported to identify strictures more accurately than CBCT. 17
The extent of duct lengthening on catheter withdrawal is likely proportional to the amount of force applied. The force is also likely a function of the resistance to removal of the angiocatheter which would be affected by the size of the angiocatheter (22- or 24-gauge) and the presence of narrowing (physiologic or pathologic) at the distal end of Stensen’s duct. To address this potential, we evaluated patients with strictures to test the hypothesis that distal strictures would have more pronounced elongation with catheter removal than those with proximal strictures or normal sialograms. The results showed no significant difference (P = .07); however, our hypothesis possibly could have been demonstrated with a larger sample size. Additionally, size of angiocatheter (24- vs 22-gauge) used did not significantly affect the percent change in length (P = .20).
Potential inconsistency in data collection may be associated with the inability to evaluate all images in the true lateral position, due to some cases of dental amalgams obstructing the duct. Difficulties encountered in assigning a location of the distal duct orifice when obscured by the catheter were overcome by our technique permitting imaging of the distal duct well-characterized as a “spray” of contrast extruding from the puncta during fluoroscopy. Additionally, the final recoil assessment was conducted without the catheter obscuring full visualization of the duct.
Limitations of the study include the retrospective design and small sample size; however, they do not compromise the introduction of a novel technique useful in imaging the full extent of the parotid duct including its orifice. Standardization of this technique is an advantage resulting from analysis from one institution—providing consistency in technique as all sialograms were performed by one otolaryngologist and two neuroradiologists.
We introduce novel imaging employing a new technique during fluoroscopic digital sialography and demonstrate its value in allowing visualization of the entire distal duct during salivary gland evaluation. This process permits analysis of dynamic changes to ductal anatomy which, in contrast to the static imaging of sialography with CBCT, highlights advantages to dynamic infusion digital sialography. Future study is targeted to correlate sialographic findings with the direct assessment of ductal length as is commonly evaluated during sialendoscopy utilizing centimeter markings on the endoscope.
Footnotes
Acknowledgements
None.
Authors’ Note
Data Availability Statement
The data that support the findings of this study are available from the corresponding author upon request.
Declaration of Conflicting Interests
The author(s) declared the following potential conflicts of interest with respect to the research, authorship, and/or publication of this article: Henry T. Hoffman, MD—Research Consultant for MeiraGtx and RiboX; author for UpToDate.
Funding
The author(s) received no financial support for the research, authorship, and/or publication of this article.
Ethical Approval
This study was approved by the University of Iowa Institutional Review Board (#201909820).
Statement of Human and Animal Rights
All procedures in this study were conducted in accordance with the University of Iowa Institutional Review Board’s (#201909820) approved protocols.
Statement of Informed Consent
Informed consent for patient information to be published in this article was waived because the study was retrospective.