
Abstract
Introduction
Obstructive sleep apnea (OSA) is closely related to daytime daily activities and social dysfunction, and sleep fragmentation causes daytime sleepiness and fatigue, which leads to clinical sequelae such as hypertension, diabetes, hyperlipidemia, cognitive dysfunction, cardiovascular events, and even all-cause death.1-3 As noted above, the latest global survey 4 estimated that about 1 billion adults aged 30 to 69 years have OSA and China had the highest number of affected individuals followed by the United States, Brazil, and India and the prevalence of OSA in China is higher than 20%, and the prevalence of moderate to severe OSA is 8.8%. However, the majority of cases remain undiagnosed, resulting in inadequate treatment of the disease, which imposes a high social and economic burden.
Western studies have reported long waiting time for polysomnography (PSG), which ranges from 2 to 60 months. 5 OSA patients in China face similar problems. Delayed diagnosis leads to delayed treatment of OSA, thereby leading to more comorbidities. The American Academy of Sleep Medicine (AASM) guidelines suggest using portable sleep monitoring devices (class II and III) as one of the PSG triage methods, but they are expensive, require professional guidance, and have certain limitations. Pulse oximetry with only single-channel blood oxygen signal may be also useful, but its oxygen detractive index and apnea index are not synchronized, which restricts the clinical use. Thus, there is a need for a simple, reliable way to identify and triage patients at high risk of OSA.
However, the results so far have not been satisfactory. Recent meta-analyses of sleep questionnaires have shown a specificity of 42% to 65%. 6 In addition, since OSA symptoms appear during sleep, the questionnaires are subject to bias. Due to uncertainties in the accuracy and clinical application of the screening tools mentioned above, 7 an assisted diagnostic tool that combines multiple objective clinical biomarkers to avoid bias needs to be developed.
Nomogram is a graphical tool that was widely used for complex calculations before the development of computers. Previous studies have shown8,9 that nomograms can be utilized to predict tumor survival rate. It is easier and less error-prone to develop a nomogram model than to write a formula on a computer beforehand or pull out a phone and manually enter all the beta coefficients. In recent years, researchers have also used nomograms to study sleep.
No studies have determined whether a combination of objective, clinical biomarkers provides a good diagnosis of OSA. Therefore, with a sufficient study population, this study constructed a nomogram risk assessment model for moderate to severe OSA based on existing diagnostic criteria, including clinical syndromes, demographic characteristics, anthropometric characteristics, and blood routine indicators. This survey may contribute to quantitative evaluation of the risk of OSA prior to costly and time-consuming PSG testing, thereby significantly reducing the number of unnecessary tests and saving on human and material costs.
Methods
Clinical Case Data
We collected data from patients visiting our hospital from January 2018 to December 2018 “all comer” patients, with and without suspected OSA. These patients received hospital diagnosis and treatment of sleep-related breathing disorder. All of them completed a questionnaire, including information on body mass index (BMI) and sleepiness scale. Two independent investigators collected and checked the questionnaires. The subjects’ medical history and health status were recorded. Blood routine monitoring was completed.
Our study was performed in accordance with the Declaration of Helsinki and its amendments. The Ethics Committee of Shanghai Fudan University Affiliated Eye & ENT Hospital confirmed that no ethical approval was required because all the procedures being performed were part of the routine care. Ethics approval was obtained from the Ethics Committee of the Eye & ENT Hospital of Fudan University (No. 2022140).
Inclusion and Exclusion Criteria
The inclusion criteria were as follows: snoring and daytime sleepiness symptoms. The exclusion criteria were as follows: age <18 years; other systemic acute and chronic inflammatory diseases except OSA; anemia or other diseases of the blood system; chronic liver or kidney disease; malignant tumor; use of anticoagulants, anti-inflammatory drugs, or hormones for the past 3 months; pregnancy; treatment history of OSA; loss of PSG data.
Sleep Evaluation
Objective total sleep was evaluated by standard PSG (Embla systems N7000 or S4500; Natus Medical Inc.). Following the AASM guidelines, 3 pairs of electroencephalograms, bilateral electrooculograms, modified lead II electrocardiograms, bipolar chin electromyograms, oronasal airflow, thoracic, and abdominal respiratory efforts, blood oxygen saturation, the posture, and snoring measurements were recorded. Sleep recordings were automatically diagnosed and compared with the manually checked results by 2 skilled technicians.
The apnea-hypopnea index (AHI) was calculated as the number of apnea and hypopnea events per hour of sleep. OSA was diagnosed as AHI ≥5. OSA was classified as mild (5-15), moderate (15-30), or severe (≥30). 10
All blood routine indicators were determined by a hematology analyzer (XN-1000).
Statistical Analysis
All of the analyses were conducted on a personal laptop (Intel i7-8650U, 16 GB RAM). Statistical analysis was performed with SPSS 20 (SPSS, Inc) and R software (version 3.5.1; R Development Core Team). The chi-squared test for categorical variables and the independent-samples t test for continuous variables were used to compare clinical features. P < .05 was considered statistically significant.
In this study, AHI ≥15 and <15 per hour were classified variables, and other variables were continuous variables. Univariate analysis based on demographic data and clinical characteristics was used to intuitively explore the relationship between continuous variables and categorical variables, and statistically significant variables from multivariate analysis were used to construct nomogram maps.
Results
Demographic and Blood Routine Data of Patients
A total of 685 consecutive participants who underwent full-night standard PSG were finally included in our study. The patients were randomly assigned to either the training group (about 70% of the patients) or the validation group (about 30% of the patients). Four hundred eighty patients (male/female: 393/87) were assigned to the training group, while 205 patients (male/female: 175/30) were included in the validation group by a random number table. The demographic characteristics of the training and validation groups are shown in Table 1. No obvious differences were found between the 2 AHI <15/hour groups or the 2 AHI ≥15/hour groups in terms of demographic characteristics. Patients in both AHI ≥15/hour groups were older, more obese, and had poorer metabolic profiles and desaturation (Table 2).
Characteristics of Subjects.
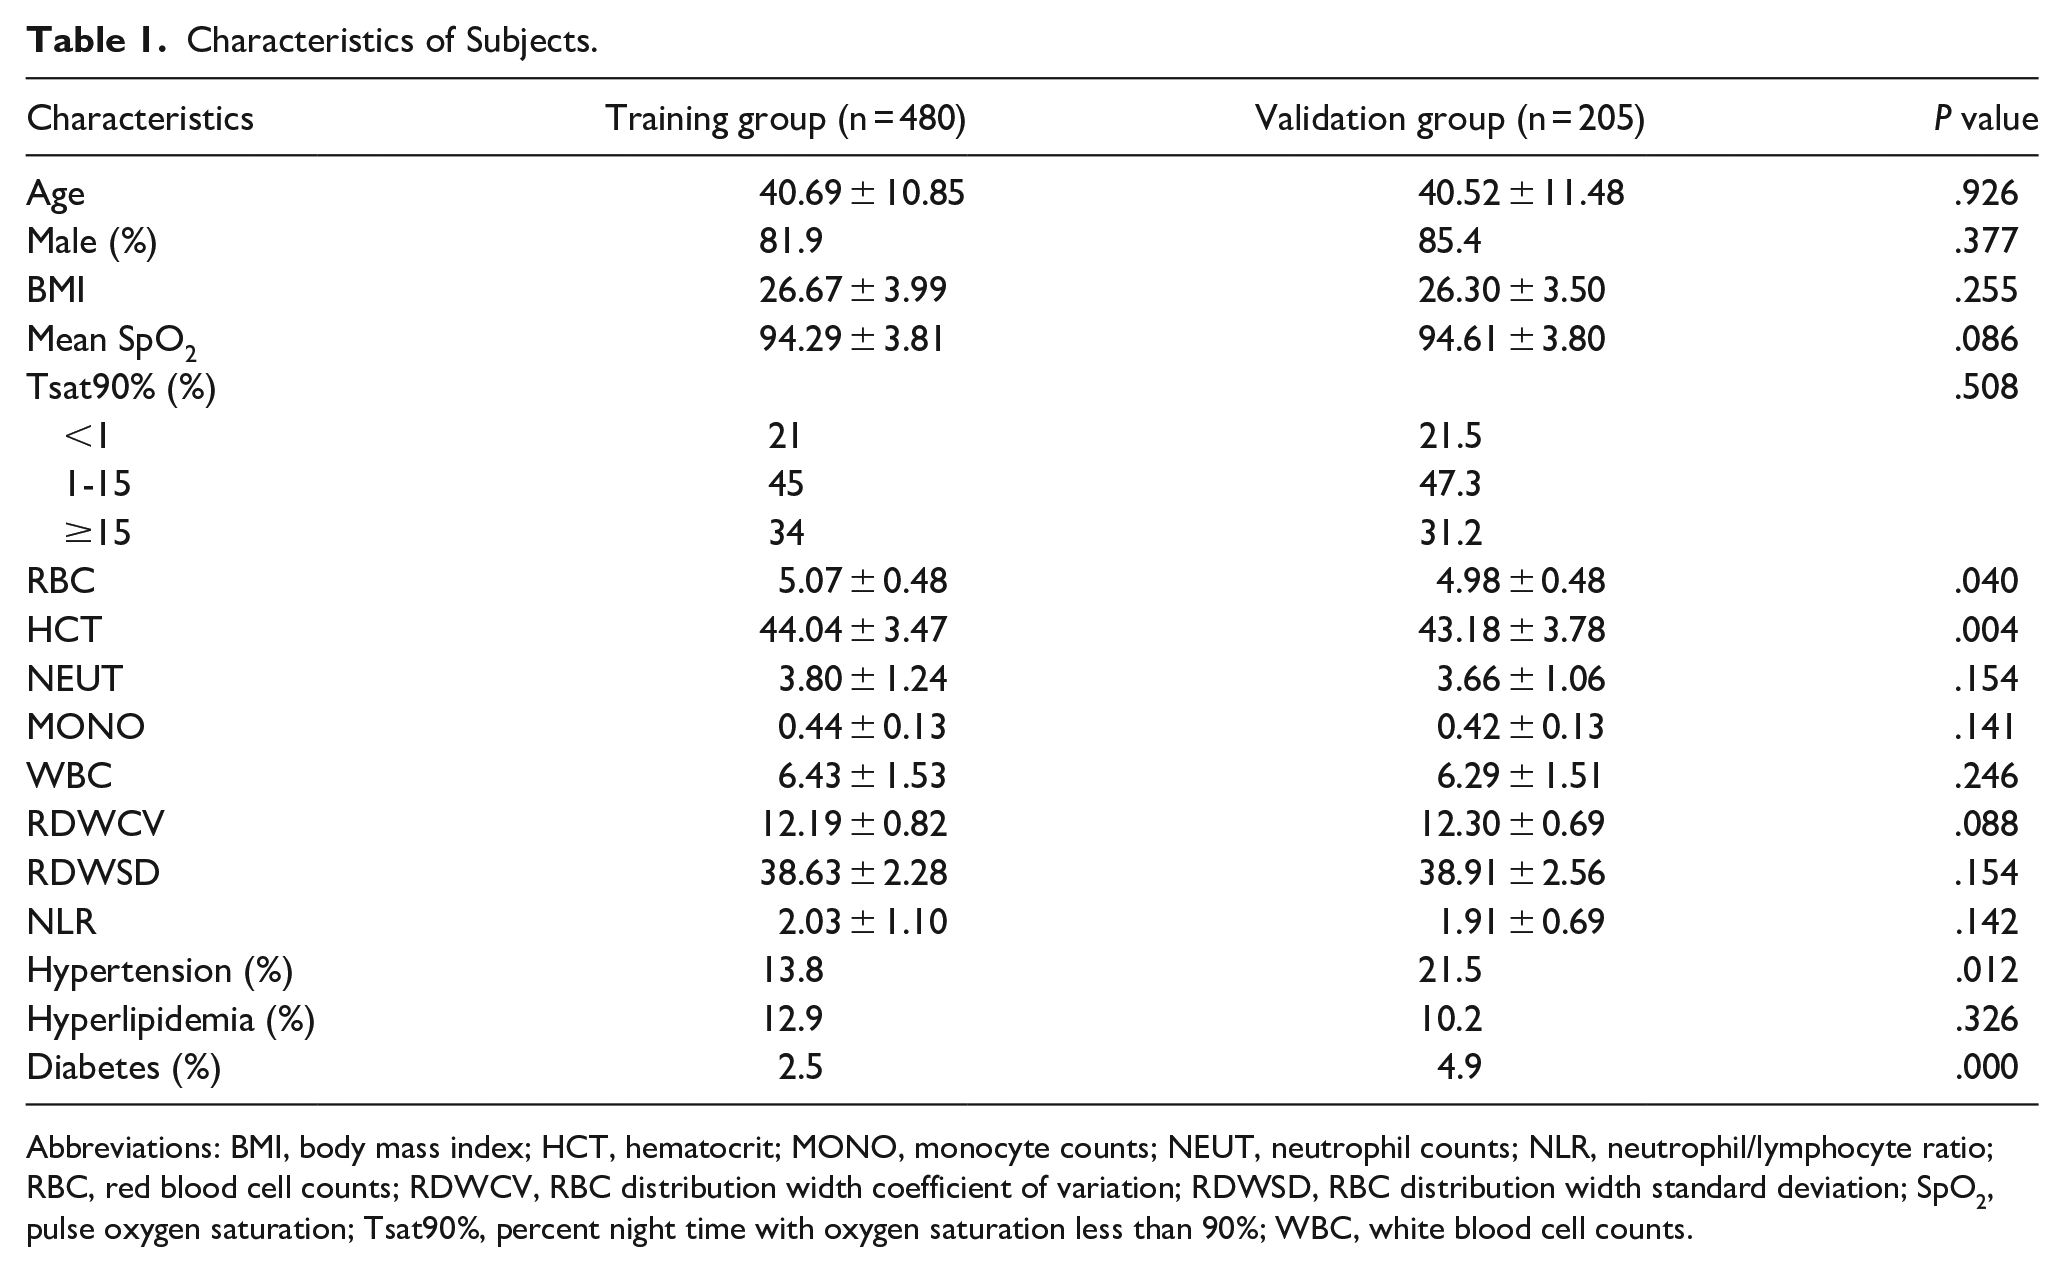
Abbreviations: BMI, body mass index; HCT, hematocrit; MONO, monocyte counts; NEUT, neutrophil counts; NLR, neutrophil/lymphocyte ratio; RBC, red blood cell counts; RDWCV, RBC distribution width coefficient of variation; RDWSD, RBC distribution width standard deviation; SpO2, pulse oxygen saturation; Tsat90%, percent night time with oxygen saturation less than 90%; WBC, white blood cell counts.
Characteristics of Subgroup Subjects.
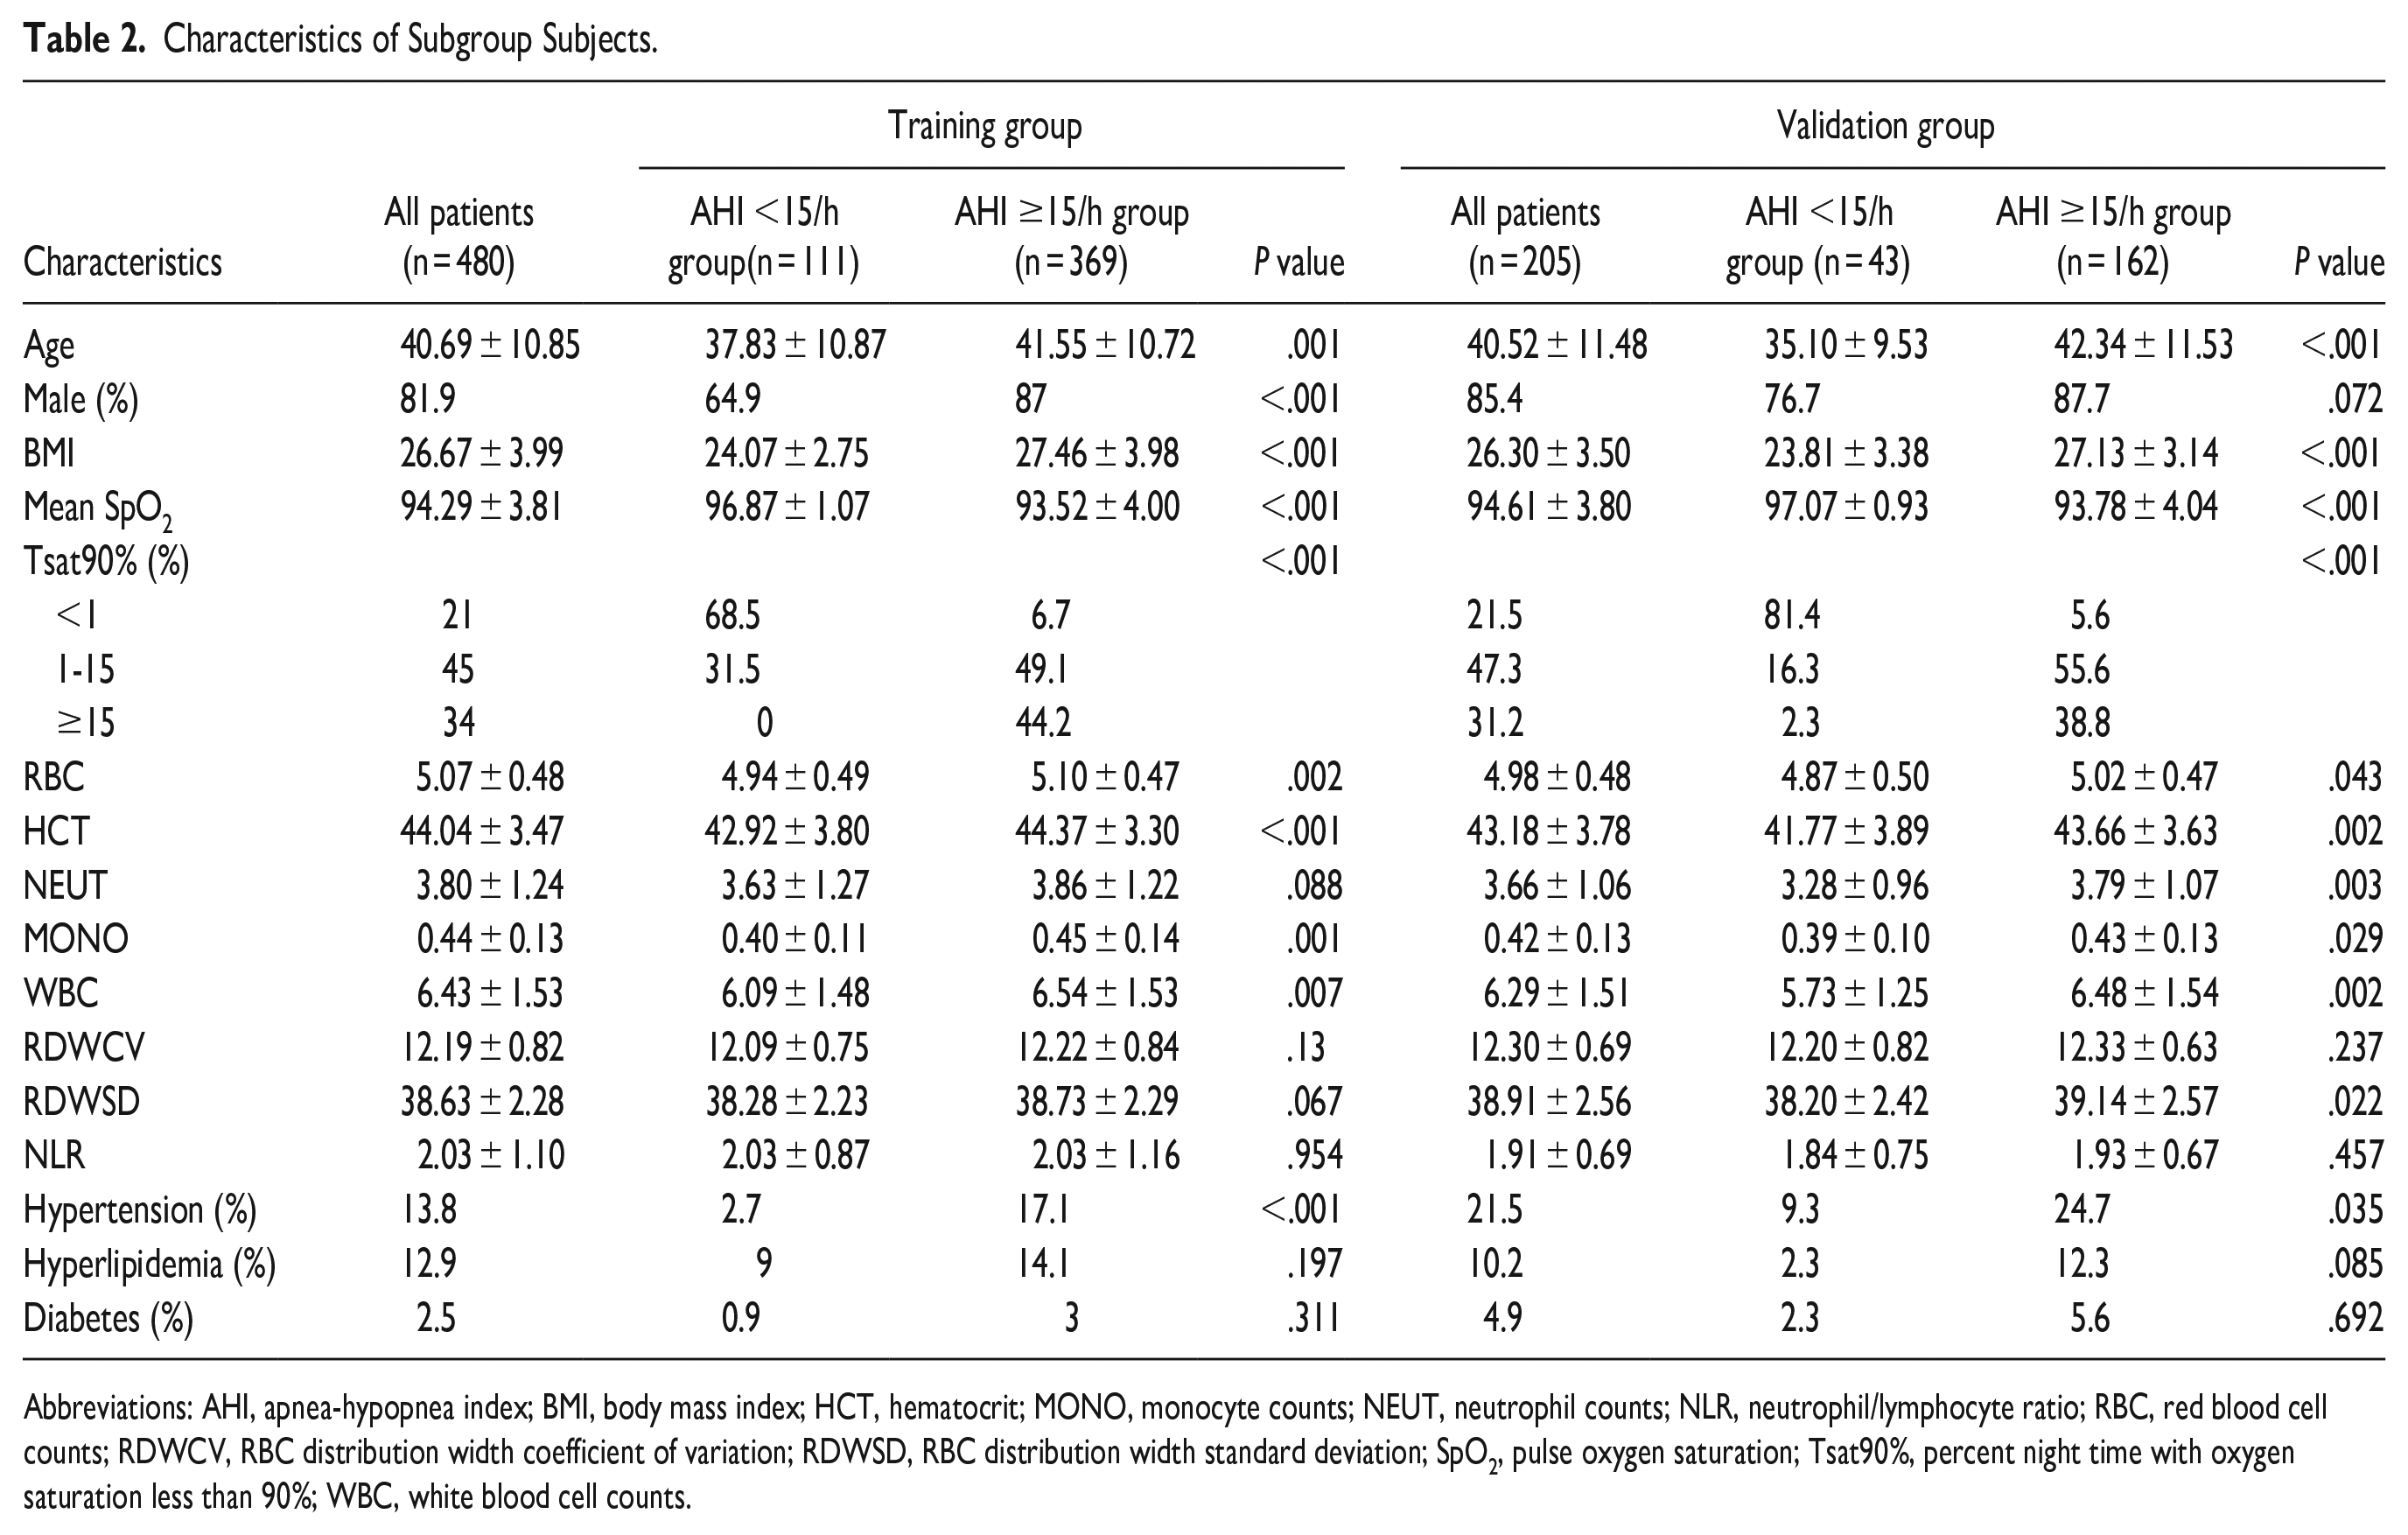
Abbreviations: AHI, apnea-hypopnea index; BMI, body mass index; HCT, hematocrit; MONO, monocyte counts; NEUT, neutrophil counts; NLR, neutrophil/lymphocyte ratio; RBC, red blood cell counts; RDWCV, RBC distribution width coefficient of variation; RDWSD, RBC distribution width standard deviation; SpO2, pulse oxygen saturation; Tsat90%, percent night time with oxygen saturation less than 90%; WBC, white blood cell counts.
Establishment of the Nomogram Model
In this study, the univariate analysis in the training group showed that age, gender, BMI, mean pulse oxygen saturation (SpO2), percent night time with oxygen saturation less than 90% (Tsat90%), red blood cell counts (RBC), hematocrit (HCT), neutrophil counts (NEUT), monocyte counts (MONO), white blood cell counts (WBC), hypertension, hyperlipidemia, and RBC distribution width coefficient of variation (RDWCV) significantly correlated with AHI (P < .05), while RBC distribution width standard deviation (RDWSD) nearly correlated with AHI (P = .088). Considering that the relationships between some independent variables and dependent variables in the univariate analysis may be affected by confounding factors, we included these variables into a multivariate model for further analysis. The aforementioned 14 variables, including RDWSD, were introduced into Cox regression analysis in a progressive manner, and we found that 8 variables, including age, sex, BMI, mean SpO2, Tsat90%, RBC, HCT, and RDWSD, significantly correlated with AHI (P < .05; Table 3). Next, we used these 8 independent variables to establish the nomogram model.
Univariate and Multivariate Analyses for OSA Patients.
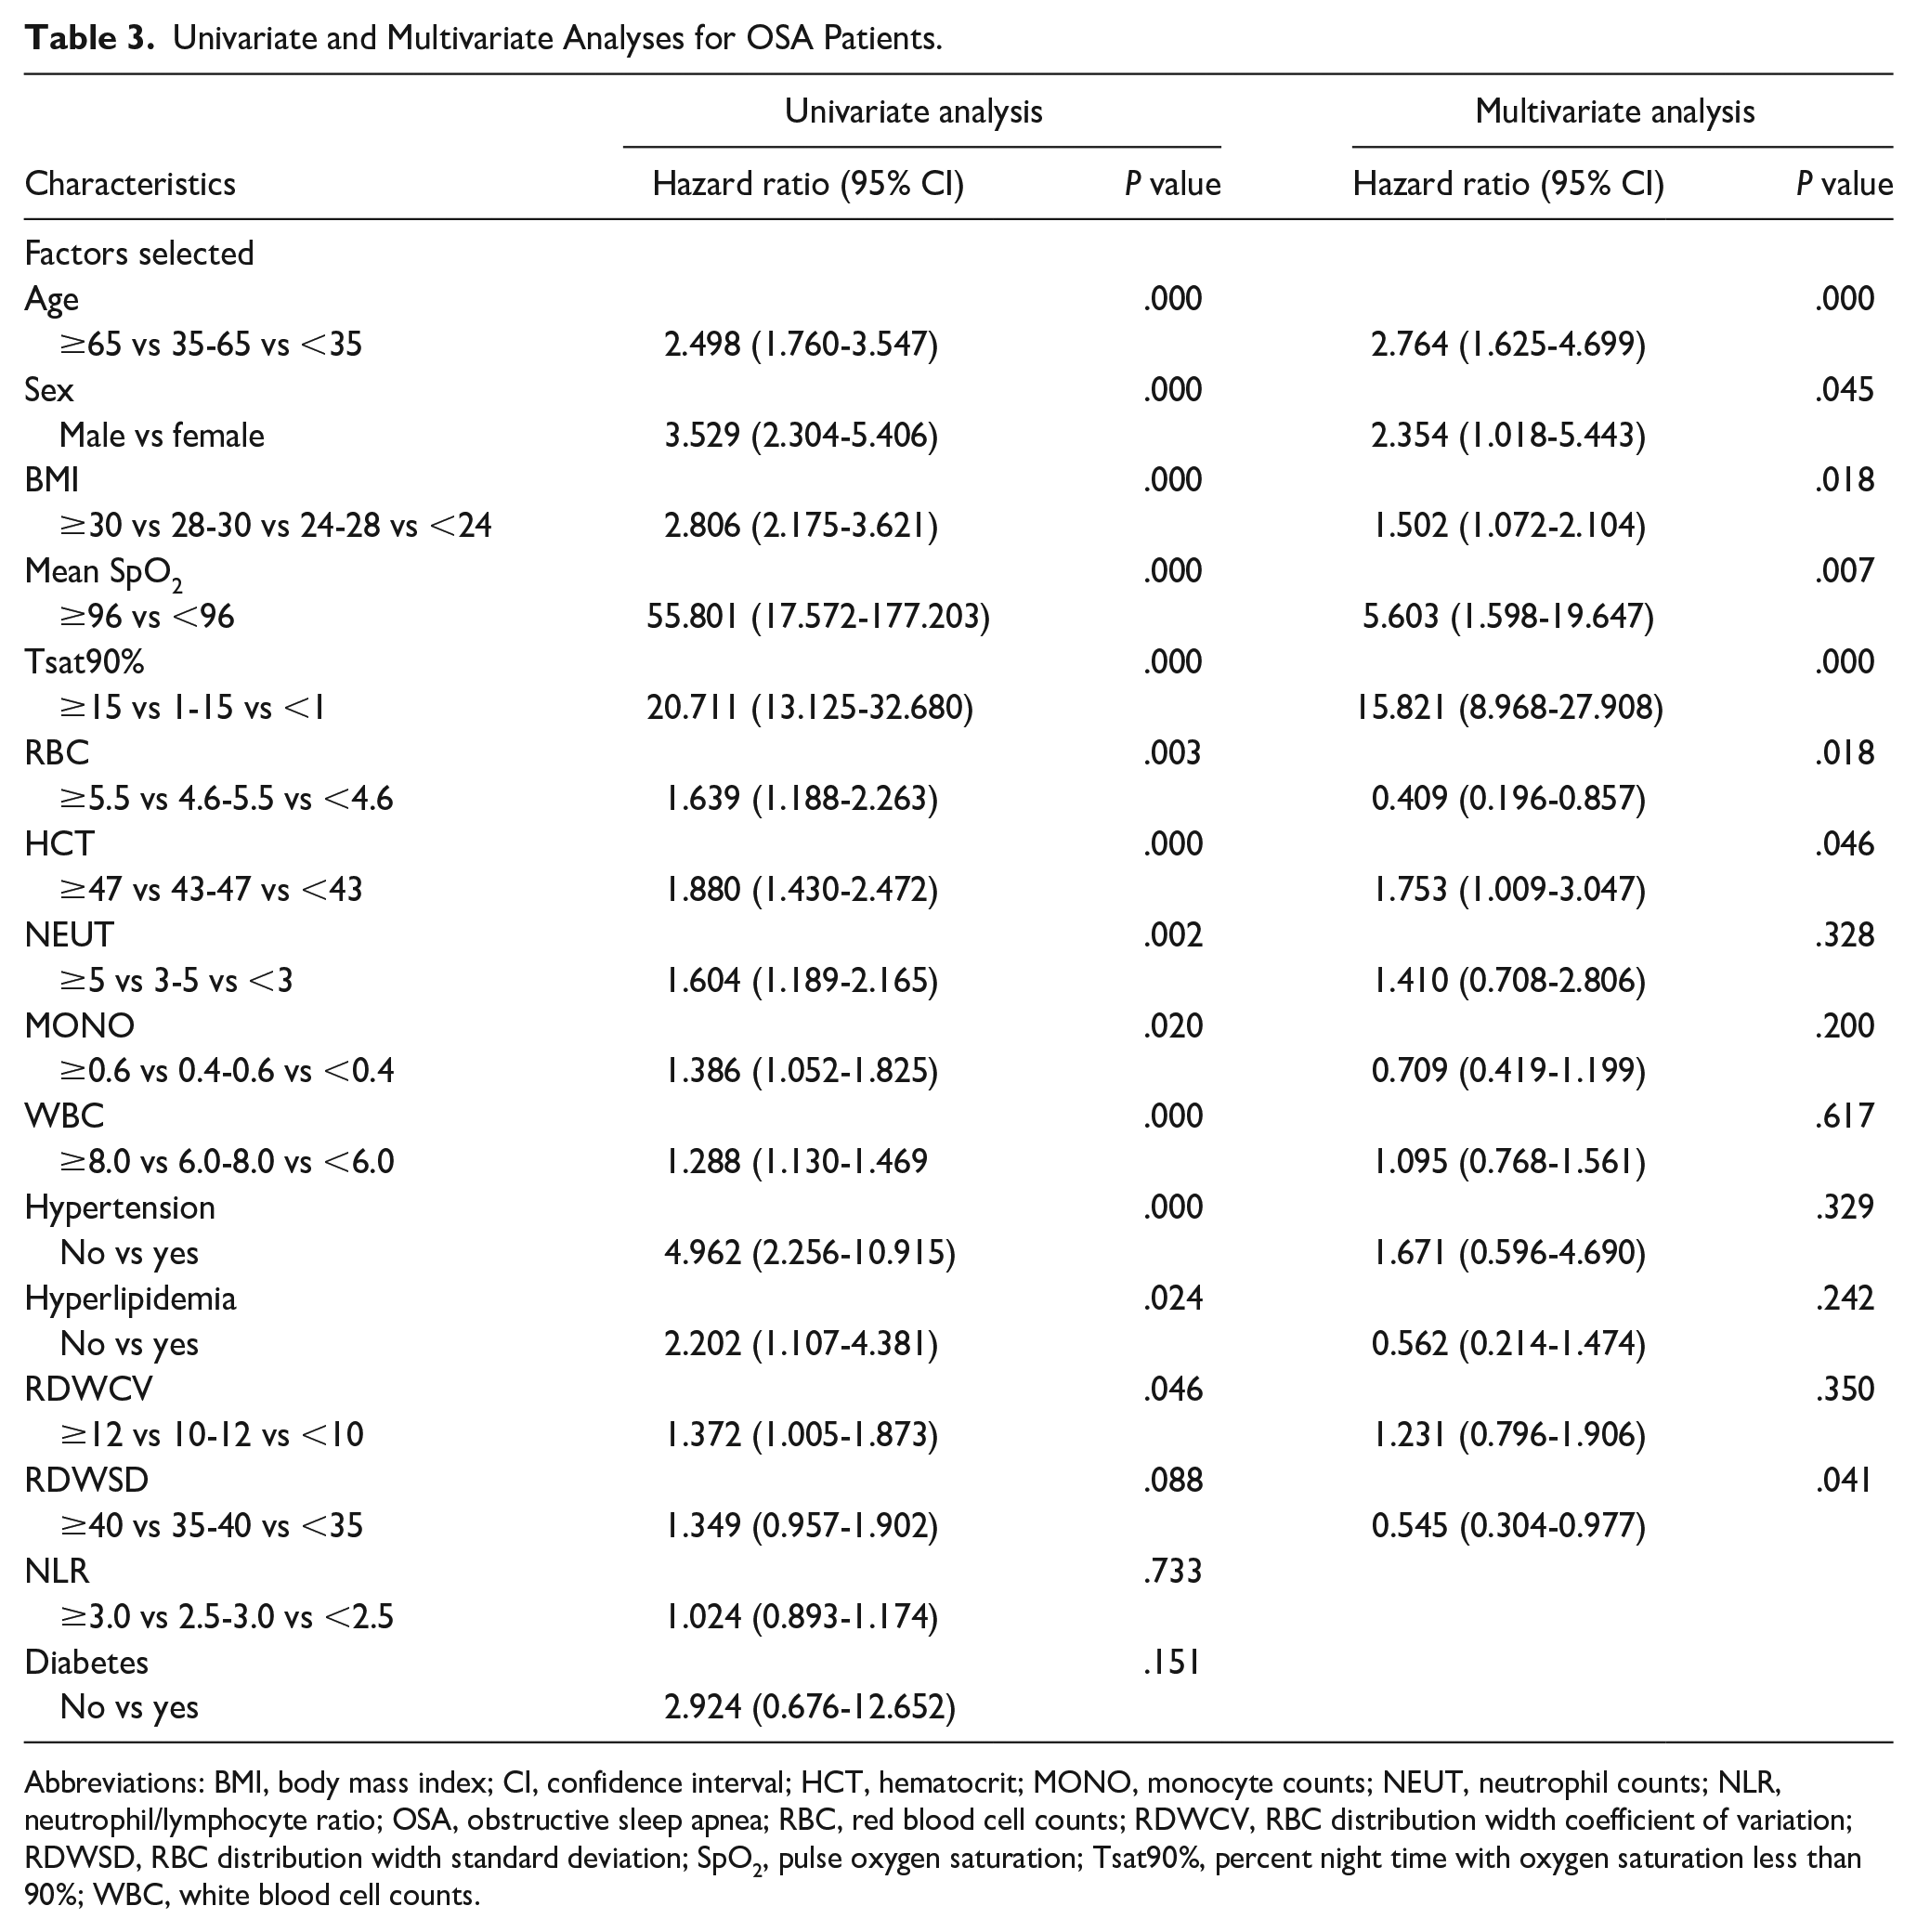
Abbreviations: BMI, body mass index; CI, confidence interval; HCT, hematocrit; MONO, monocyte counts; NEUT, neutrophil counts; NLR, neutrophil/lymphocyte ratio; OSA, obstructive sleep apnea; RBC, red blood cell counts; RDWCV, RBC distribution width coefficient of variation; RDWSD, RBC distribution width standard deviation; SpO2, pulse oxygen saturation; Tsat90%, percent night time with oxygen saturation less than 90%; WBC, white blood cell counts.
Nomogram Model Evaluation and Validation
As shown in Figure 1A, the nomogram model containing the above 8 variables can be used to predict the severity of disease in patients with OSA. Generally, C-index [the same as area under the receiver operating characteristics curve (AUC)] is used to evaluate a nomogram model, and calibration curve is used to evaluate the calibration effect between the predicted value and the actual value.
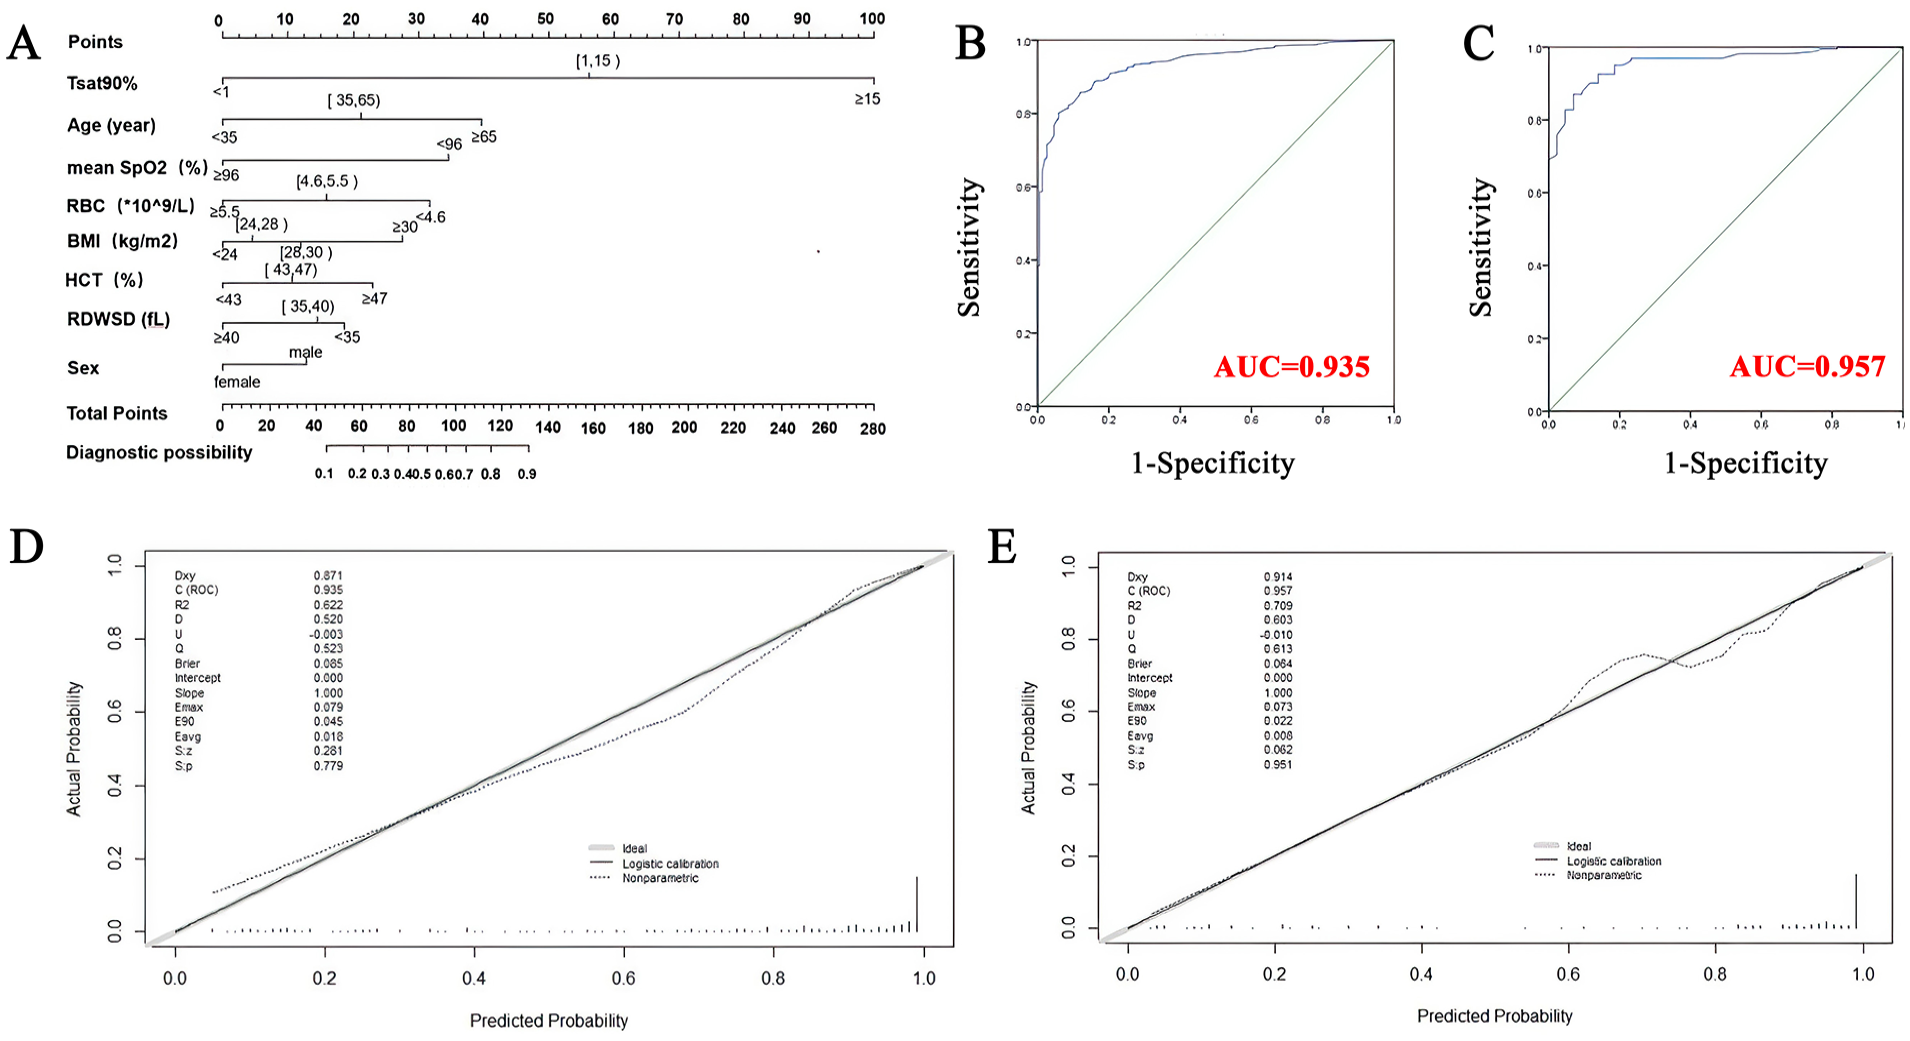
The nomogram for predicting obstructive sleep apnea. (A) The nomogram was developed in the training group by incorporating the following 8 parameters: age, sex, BMI, SpO2, Tsat90%, RBC, HCT, and RDWSD. (B) The ROC curve and AUC of the nomogram in the training group. (C) The ROC curve and AUC of the nomogram in the validation group. (D) Calibration curves of the nomogram in the training group. (E) Calibration curves of the nomogram in the validation group. BMI, body mass index; SpO2, pulse oxygen saturation; Tsat90%, percent night time with oxygen saturation less than 90%; RBC, red blood cell counts; HCT, hematocrit; RDWSD, RBC distribution width standard deviation; ROC, receiver operating characteristics; AUC, area under the ROC curve.
The C-index (AUC) was 0.935 [95% confidence interval (CI), 0.917-0.954] in the training group (Figure 1B) and 0.957 (95% CI, 0.930-0.984) in the validation group (Figure 1C). This indicates that the model is suitable for patients with moderate to severe sleep-related breathing disorder and has good accuracy.
Next, we internally validated the nomogram model using data to evaluate its accuracy with regard to the C-index. The calibration diagrams of both the training group (Figure 1D) and the validation group (Figure 1E) showed that the calibration curves of the estimated accuracy of the 1000 times self-service resampling method were highly consistent with the diagonal line, indicating that there was a good correlation between the predicted value and the actual probability.
Risk Stratification in Patients With Sleep-Related Disordered Breathing
Each variable in the nomogram model established in this study has a corresponding risk point. This nomogram risk score was used to calculate the total risk score of the patients based on their recorded clinical information. According to the score distribution, we determined the score critical value of the 3 groups, and then verified by statistical method that the score critical value can well distinguish the risk of the 3 groups.
Based on the distribution characteristics of the total risk score, 2 cutoff values were determined to divide patients into 3 subgroups:
Low-risk group (risk score <80, n = 137),
Relatively high-risk group (risk score 80-125, n = 158),
High-risk group (risk score ≥125, n = 390).
As shown in Table 4, in the training group, there were 79 individuals (78.2%) in the low-AHI group (AHI <15 times/hour), while only 2 individuals (0.8%) were in the high-risk group. In the high-AHI group (AHI ≥15 cycles/hour), 260 patients (99.2%) were in the high-risk group, and there were 22 patients in the low-risk group (21.8%; chi-squared test, P < .001). In the validation group, there were 30 patients (83.3%) in the low-AHI group (AHI <15 times/hour), while there was only 1 person (0.8%) in the high-risk group. In the high-AHI group (AHI ≥15 times/hour), 127 patients (99.2%) were in the high-risk group, while there were 6 patients in the low-risk group (16.7%; chi-squared test, P < .001).
Risk Stratification of OSA Patients.
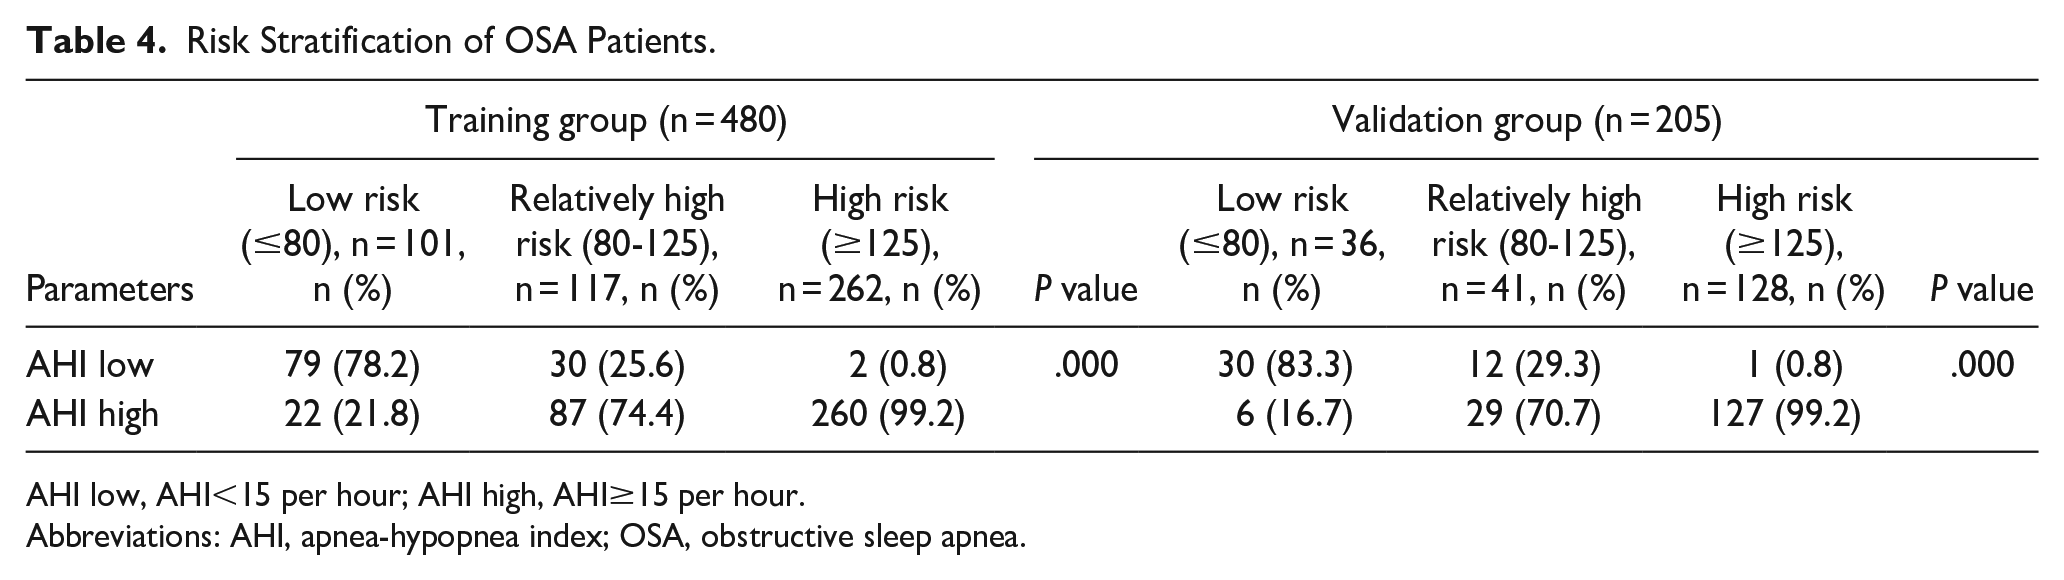
AHI low, AHI<15 per hour; AHI high, AHI≥15 per hour.
Abbreviations: AHI, apnea-hypopnea index; OSA, obstructive sleep apnea.
Discussion
The pathological process of OSA is mainly related to intermittent hypoxia at night. At present, all national and international guidelines highlight AHI as the main indicator for OSA diagnosis. However, obtaining AHI requires PSG or portable PSG examination, which requires a large amount of human and material resources. Considering the significant burden of OSA, OSA is still underdiagnosed and undertreated in clinical settings. Different clinical scores, such as the STOP-Bang Self-rating Scale, NoSAS scores, 11 or nomogram model, have been suggested as screening tools.
Luo et al 12 found that C-indexes of the nomogram model for non-OSA, moderate-severe OSA, and severe OSA in the training group were 0.838, 0.799, and 0.805, respectively. Meanwhile, Xu et al 13 found that age, gender, BMI, neck circumference, waist circumference, blood glucose level, insulin, and apolipoprotein B were important predictors of OSA and C-index was 0.839. To establish a nomogram model, we used 8 variables including age, sex, BMI, mean SpO2, Tsat 90%, RBC, HCT and RDWSD, with the classification variable AHI ≥15 per hour versus AHI <15 per hour. Here in our research, the newly established nomogram model showed good discrimination and calibration in terms of predicting OSA, with a C-index of 0.935 (95% CI, 0.917-0.954) for internal validation, and a C-index of 0.957 (95% CI, 0.930-0.984) for validation group, both higher than those of the aforementioned 2 studies. Also, clinical data that can be obtained through a general physical examination such as BMI, SpO2, and RBC, were used for the construction of our model; this indicates that our newly developed nomogram may effectively help physicians make better clinical decisions, which may save a lot of time and costs.
Patients with sleep-related disordered breathing, clinically suspected of OSA, provide information on their gender, age, height, and weight. Suspected patients can be monitored at home with a reliable overnight blood oxygen monitoring device, and the average oxygen saturation and the percentage of oxygen less than 90% in total sleep time can be effectively calculated. At the same time, blood routine tests can be performed, and 8 independent variables can be imported into the nomogram model to calculate the corresponding score. According to the corresponding score, different clinical strategies can be adopted (Figure 2), as follows:
In the low-risk group (risk score <80), “wait and see” strategy is recommended, and lifestyle-related interventions (such as smoking and alcohol cessation, side lying position, or weight loss), and regular follow-up are sufficient. Oral appliance treatment can also be conducted when necessary.
In the medium-risk group (risk score 80-125), PSG monitoring is recommended.
The high-risk group (risk score ≥125), treatment should be started for moderate to severe OSA.
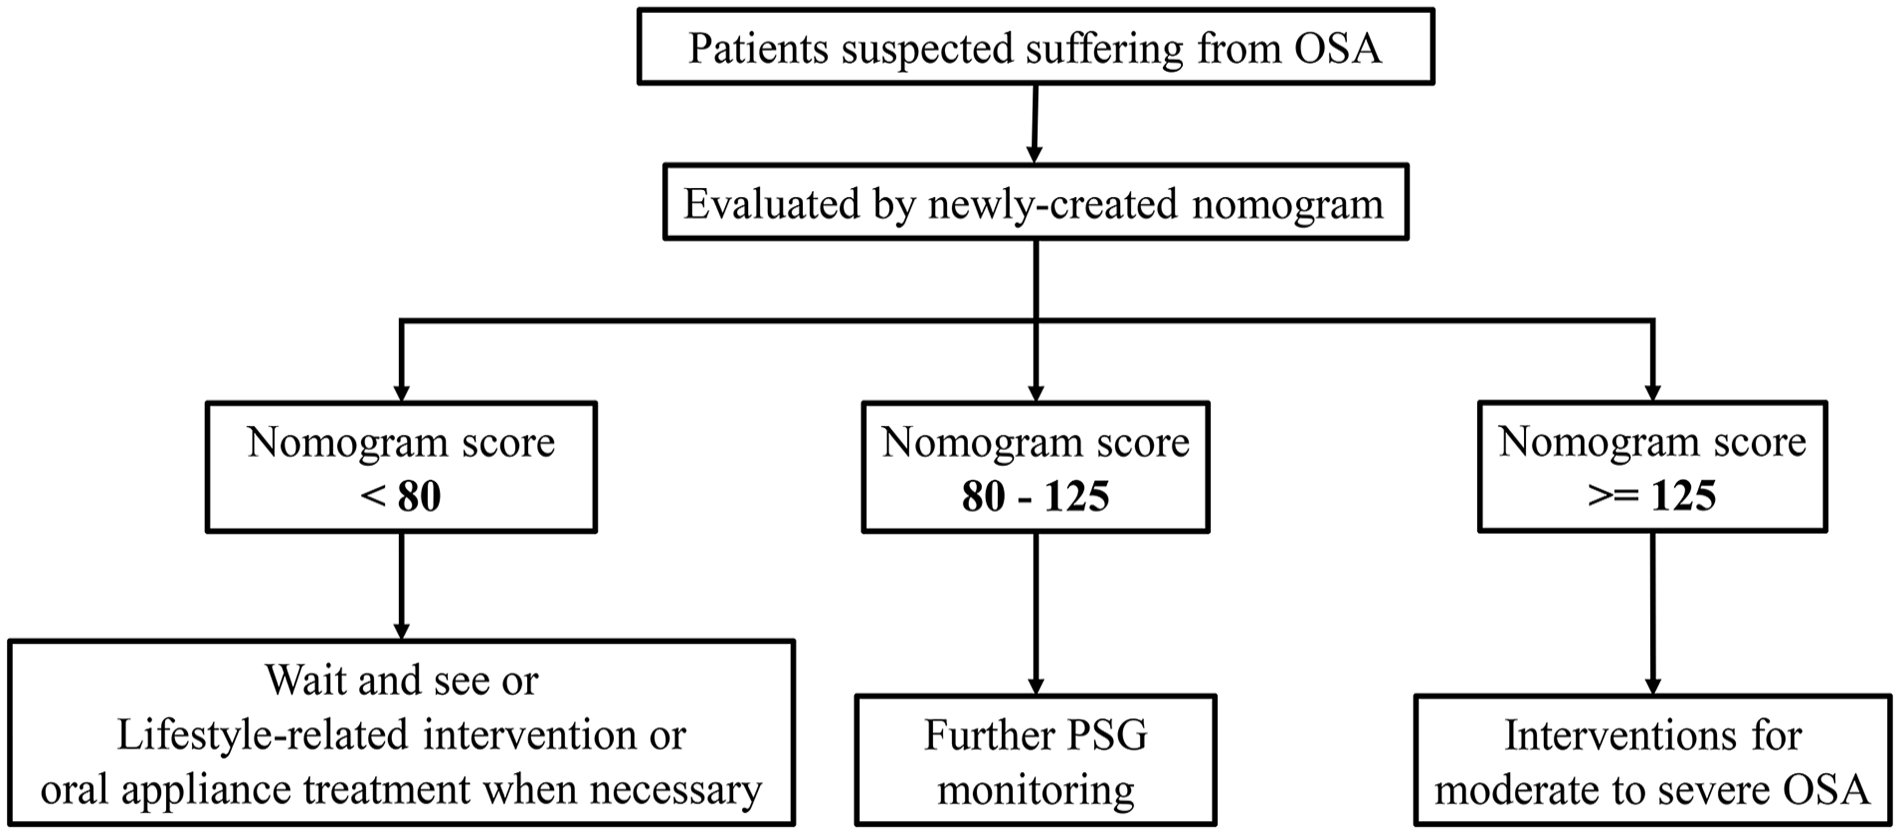
Clinical strategies of suspected obstructive sleep apnea.
In this study, all predictors were routine clinical examination data, meaning that there were no additional costs and no complicated calculations. The nomogram calculations are transparent and potentially educational, and patients can clearly see the impact of disease risk factors, leading to lifestyle changes such as quitting smoking and weight control. The nomogram can improve the clinical decision-making ability of clinicians. Meanwhile, performing overnight blood oxygen monitoring and blood routine tests costs about $20 per time (about 3 times per year), while PSG almost 6 times of it. So, our method may save healthcare costs and time.
At present, an increasing number of studies focus on all-cause mortality in patients with moderate to severe OSA. Marshall et al 14 confirmed that tumor prevalence and mortality were significantly increased in moderate and severe OSA patients. This suggests that moderate to severe OSA is independently associated with increased all-cause mortality, cancer incidence, mortality, and stroke incidence in a community population. The Nieto 15 teams reported that the degree of hypoxia was more closely associated with tumor mortality than AHI. Recently, our study also found that Tsat90% and average SpO2 played an important role in the prediction model. At present, overnight oxygen can be measured by night oximetry alone, which has long been considered a simple and fairly reliable diagnostic technique for OSA, especially in severe cases.16,17
Although hemorheological factors are rarely mentioned, it has been hypothesized that hemorheological factors are associated with an increased cardiovascular risk in OSA. A retrospective study 18 showed that there were significant differences in erythrocyte count and hematocrit between groups, and hematocrit independently correlated with AHI. RDW is associated with acute and chronic diseases that impair oxygenation. Although RDW has been calculated as a proportion of the root mean square error, or RDWCV, since the 1980s, instrument manufacturers have recently added another calculation called “RDW-SD,” which is not really a standard deviation of the RBC distribution width but rather a nonparametric measure of 20% modal height of the histogram width. 19 In this study, RDWSD was entered to the nomogram model, and the score may be lower if RDWSD is higher, possibly due to the small sample size or the RDWSD’s own definition. It is feasible to further study the relationship between RDWSD and RDWCV in OSA patients, so as to make better use of this biomarker.
In addition, the incidence and severity of OSA are closely related to gender and BMI, and OSA is more severe in males with a higher BMI. Rogers et al 20 found that in developed countries, African Americans had a higher risk of OSA. Obesity was the strongest independent predictor of OSA (odds ratio = 1.59; P < .001). Miller et al 21 found that BMI, systolic blood pressure, and absence of lung disease were predictors of AHI ≥15 per hour in PSG monitoring.
These are all effective and useful methods, but they also have their own disadvantages. By simplifying the prediction model to make it easy for calculation, some bias scoring systems, classification, and regression trees may be introduced, often requiring big data to generate reliable, governable models with lower accuracy than other methods.
We should account into some drawbacks that limit the generalization of our result. The population under study could be larger that we can distinguish all degrees of OSA. Another limitation should also be pointed out. Our population is from the single hospital with the similar propensity. Multicenter studied might be used to circumvent it.
Conclusions
Our study established a meticulous evaluation system that quantifies AHI risk for patients with suspected OSA. The newly developed nomogram can effectively help physicians make better clinical decisions, which may save a lot of time and costs.
Footnotes
Acknowledgements
We are grateful to Yu Heng.
Author Contributions
Jingjing Huang, Zhujian Wang, and Haitao Wu contributed to the study conception and design. Material preparation, data collection, and analysis were performed by Jingjing Huang, Zhujian Wang, and Fang Shi. The first draft of the manuscript was written by Jingjing Huang. Zhujian Wang and Fang Shi reviewed and edited the manuscript. Haitao Wu corrected the manuscript. All authors read and approved the final manuscript.
Data Availability
Data will be made available on reasonable request.
Declaration of Conflicting Interests
The author(s) declared no potential conflicts of interest with respect to the research, authorship, and/or publication of this article.
Funding
The author(s) disclosed receipt of the following financial support for the research, authorship, and/or publication of this article: This study was supported by Foundation of National Natural Science Foundation of China (Grant NO.2211020092), Shanghai Municipal Key Clinical Specialty of China (No. shslczdzk00801) and Minhang District Natural Science Foundation, Shanghai (No. 2022M11Z086). The sponsor had no role in the design or conduct of this study.
Ethical Approval
Our study was performed in accordance with Declaration of Helsinki and its amendments. The Ethics Committee of Shanghai Fudan University Affiliated Eye & ENT Hospital has confirmed that no ethical approval is required. All the procedures being performed were part of the routine care.