



Abstract
Introduction
Auditory processing disorder (APD) is a perceptual dysfunction with deficits in the neural processing of auditory stimuli such as auditory discrimination, temporal processing, and binaural processing.1,2 The perceptual deficit is considered modality-specific which differentiates it from language-based, cognitive, or attentional problems.2,3 However, it still faces diagnostic challenges owing to a lack of consensus on definite diagnostic modalities and also due to the overlapping of its symptoms and occasional association with other cognitive and behavioral disorders, like attention deficit hyperactivity disorder. 4
Evaluation of auditory processing encompasses 2 basic measures which are behavioral and electrophysiological. Behavioral auditory test measures proposed by the American Speech-Language-Hearing Association (ASHA) Task Force on central APD are temporal processes (ordering, discrimination, resolution, and integration), localization and lateralization, dichotic stimuli including nonsense syllables, digits, words, and sentences, low redundancy monaural speech, and binaural interaction procedures. 5 The behavioral test measures are entirely subjective and are often affected by factors like a child’s intellectual development, cognitive skills, language, and so on. Electrophysiological tests, on the other hand, offer objective assessment. 6
Otitis media with effusion (OME) is one of the most common causes of pediatric conductive hearing loss having an incidence of more than 50% of the pediatric population in first year and more than 60% in the second year, 7 a high recurrence rate, that is, in 40% of cases 8 and high persistence, that is, in 10% cases. 9 Earlier the onset of OME (<2 years) where critical neuronal development is still under process, the greater its impact on Autonomic Nervous System is thought to be. 10 OME disrupts sound conduction, reducing sound transmission, acoustic distortion, and interference with both temporal and binaural auditory cues.11,12 Despite several prior studies13-21 investigating the effects of OME on auditory processing function, none have provided a comprehensive assessment across various test batteries within a single population. This study aims to evaluate the influence of early-onset OME on children’s auditory processing abilities through a systematic review and meta-analysis, consolidating findings from diverse literature that have employed different test batteries to assess auditory function.
Methods
The PRISMA (Preferred Reporting Items for Systematic Reviews and Meta-Analyses) guideline has been strictly followed for reporting this review. 22
Study Inclusion and Exclusion Criteria
Study type(s)
Published prospective or retrospective human case series involving children with a definite history of OME, with a control arm of children without having OME, assessed for APDs using either behavioral or electrophysiological tests, published in the English language between 1990 and 2022.
Study participant(s)
Children with age greater than 7 years for behavioral tests and greater than 2 years for electrophysiological tests irrespective of gender having a hearing threshold of less than 25 dB HL, normal tympanogram (except for those who had ventilation tube in situ at the time of examination), and normal speech and language development.
Study exposure(s)
Documented history of previous OME that has been resolved with medical or surgical treatment.
Study comparator(s)
Age-matched control group without previous history of any form of middle ear disorders with normal otoscopic findings, normal hearing, normal tympanogram, and normal speech and language development.
Objective outcome(s)
The study should at least compare the below tests between cases and controls:
Behavioral tests of auditory processing or electrophysiological tests.
Study result(s)
Studies providing enough data for calculations of standardized mean difference of APD outcomes between cases and control were included.
Exclusion criteria
Studies involving individuals with active conductive hearing loss and any form of sensorineural hearing loss and known cases of developmental delay
Case reports, review articles, editorials
Animal studies
Articles in languages other than English
Information Source and Search Strategy
Two authors BRG and AG did an initial literature search using MeSH terms in electronic databases (PubMed, Embase, and Google Scholar) to find the relevant articles from January 1, 1990, to August 1, 2022. Our comprehensive search strategy included the terms “auditory processing disorder,” “otitis media with effusion,” “language development disorders,” “auditory perception,” and “auditory processing system.” Search strategies of PubMed and EMBASE can be accessed in Supplemental Online Resource 1. Secondary searches were also carried out using references from primary studies.
Study Selection and Data Extraction
The duplicate literature was identified and removed using COVIDENCE software by SEFA. Title and abstract screening were independently carried out by SG and SK for potential studies that needed a full appraisal. In case of any discrepancies, a third author was consulted (BRG) to resolve them. A detailed full-text screening of the articles was done by BRG and AG independently and was forwarded for data extraction. Any discrepancies that arose were solved by mutual discussion. Authors (BRG and AG) extracted the following data from the included studies in an electronic data sheet using Microsoft Excel (Microsoft Corp.): author, publication year, study design, total population (OME and control), mean age (OME and control), sex (OME and control), and APD outcomes used (behavioral tests and electrophysiological tests).
We calculated the mean and standard deviation from the available data if the data were reported in the median and interquartile range.
Risk of Bias Assessment
The study quality and the risk of bias were assessed with the Newcastle-Ottawa-Scale (NOS) which can be accessed in Supplemental Online Resource 1. Studies with a mean score greater than 5 were included in the analysis. The interrater reliability between the author’s agreement was assessed using Cohen’s Kappa.
Statistical Analysis
We used RevMan software version 5.3, Cochrane for the statistical analysis. The pooled mean differences in APD outcomes between OME patients and controls were calculated using the standard mean difference (SMD) with a 95% confidence interval (CI). A random effect model was used when heterogeneity determined by I2 was greater than 50%. Otherwise, we used a fixed effect model for meta-analysis. P value <.05 was considered statistically significant.
Results
Search Results and Search Characteristics
A total of 373 (PubMed = 246, Embase = 35, Others = 92) articles were screened and only 10 of them met the inclusion criteria. Figure 1 depicts the entire process of the article screening.
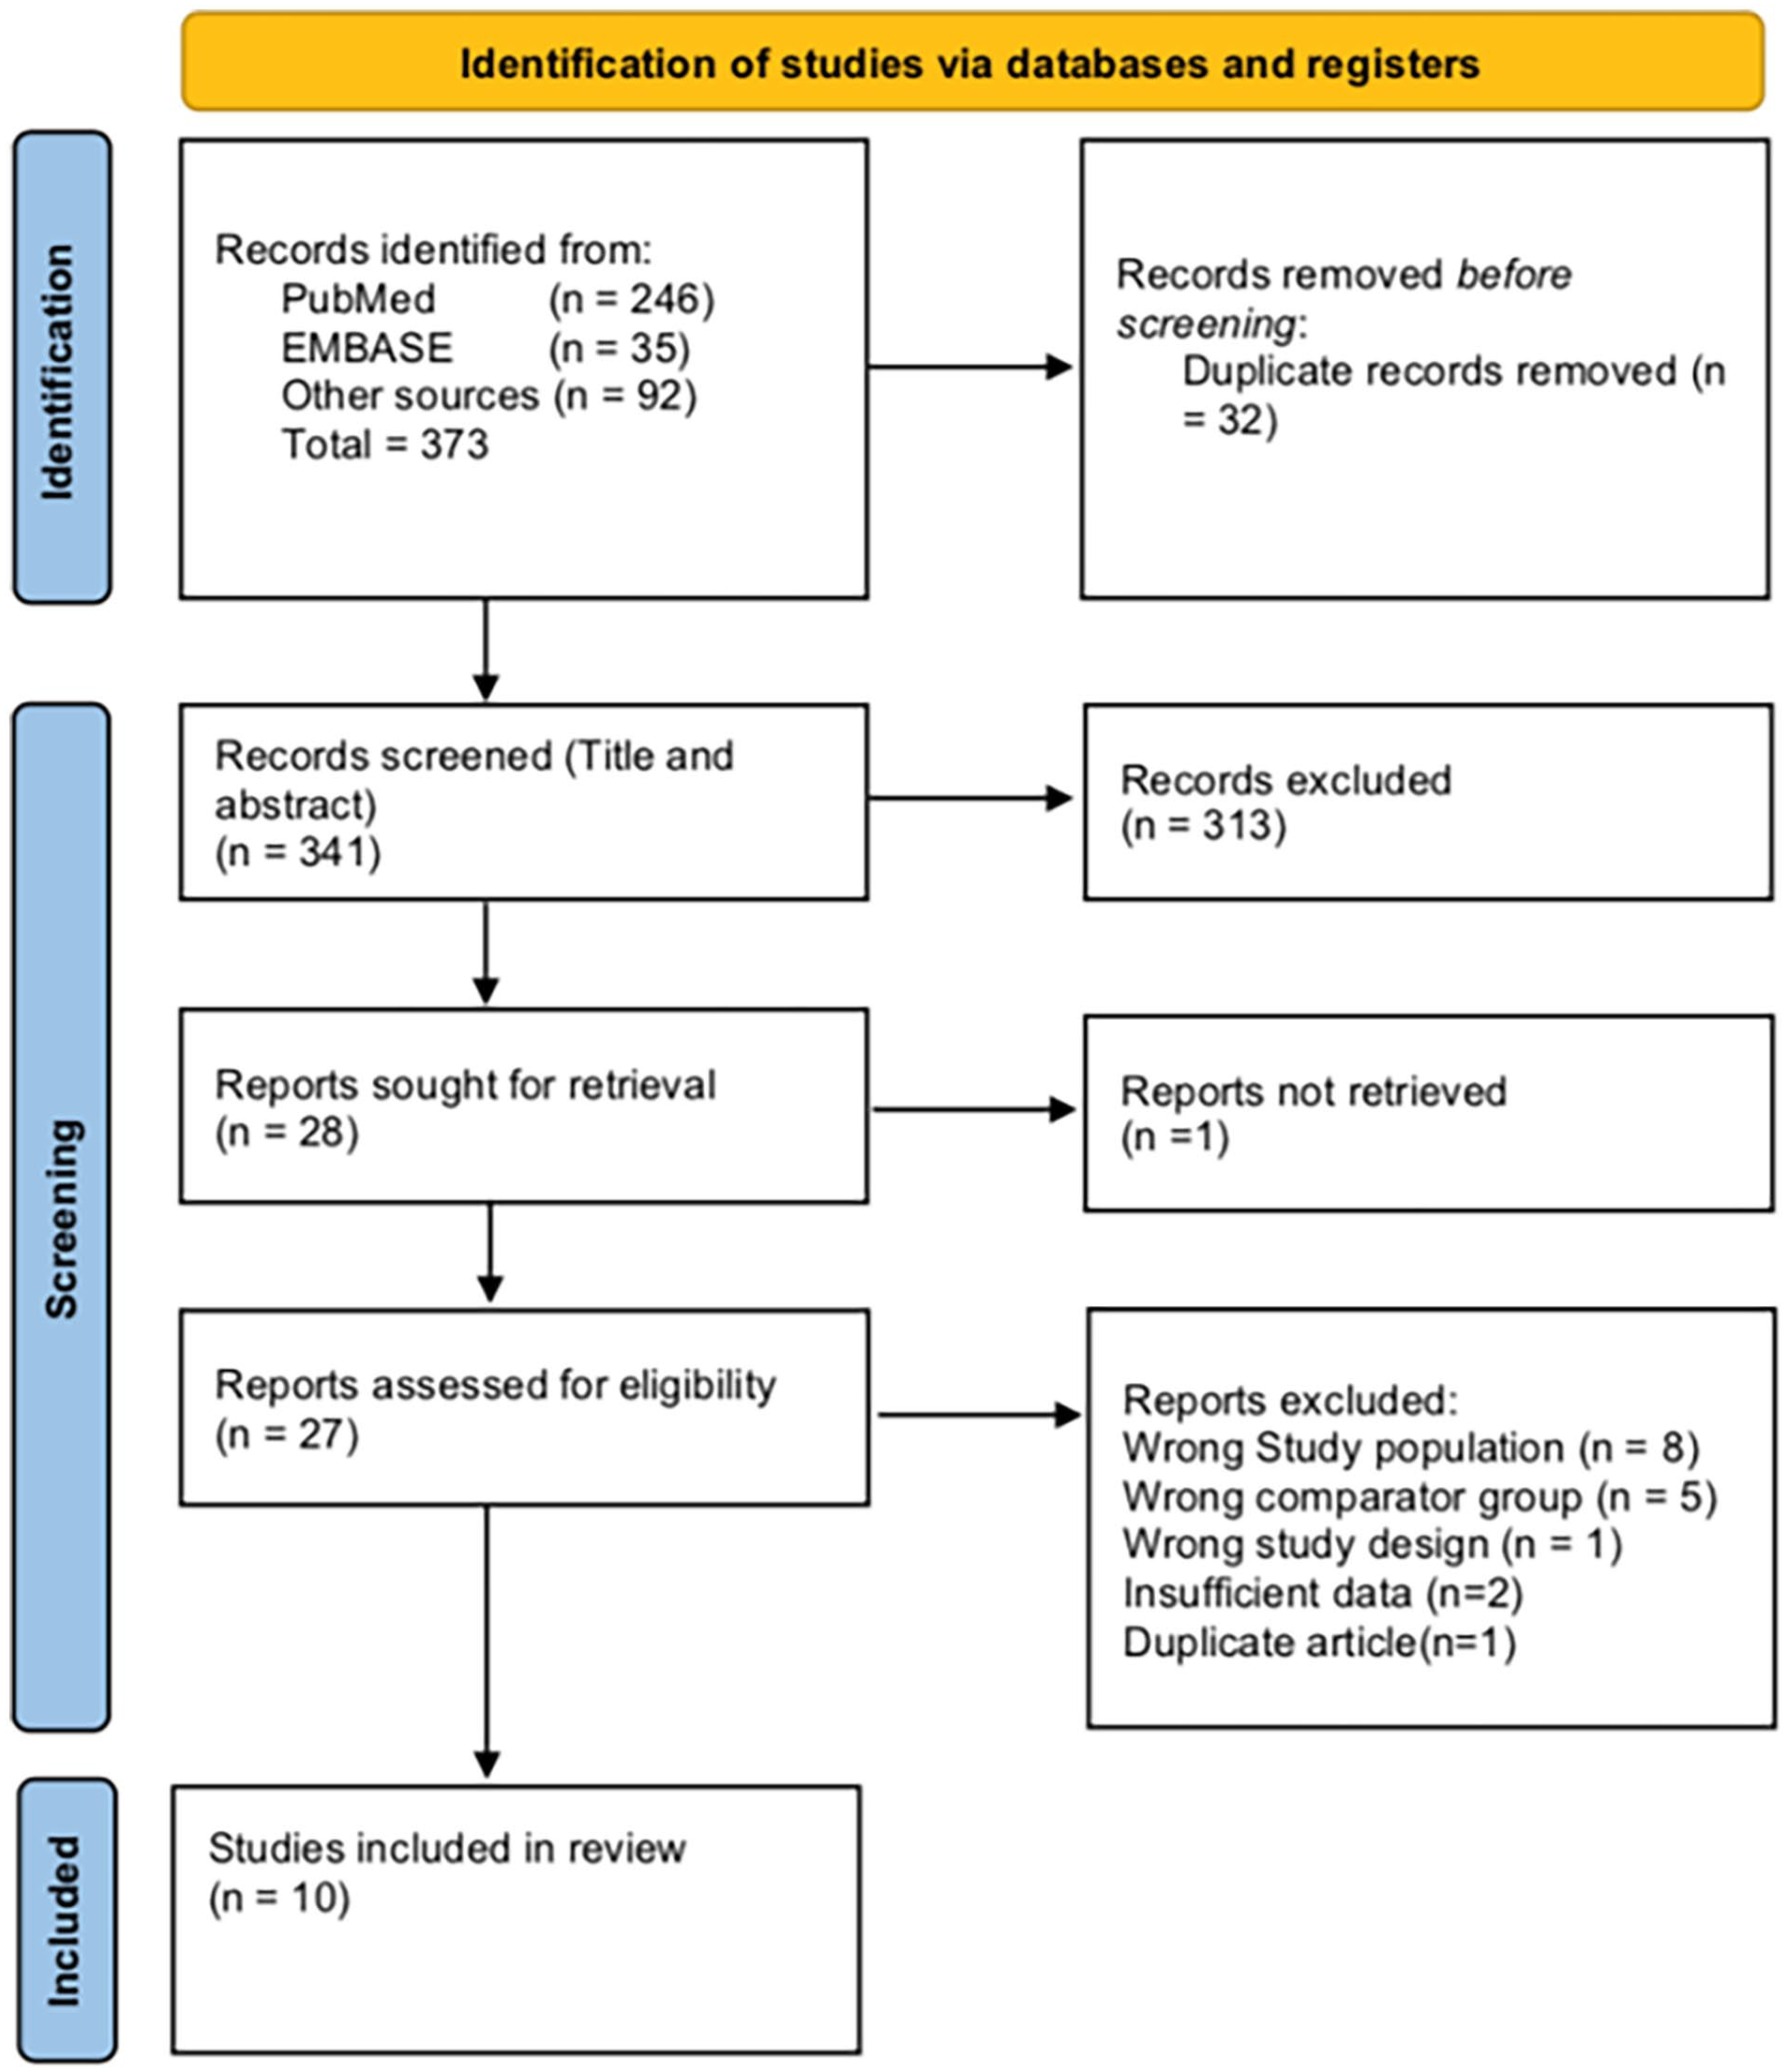
Process of study selection for the review.
Study Population Characteristics
The included studies were published from 1991 to 2020. The sample size ranged from 26 to 109 in the studies. Overall, the total number of patients with OME was 354 while there were 299 healthy controls. The age of patients ranged from 2 to 14 years. Borges et al compared the outcomes between public and private school OME patients to healthy controls. 13 Similarly, in their other study, they compared outcomes between Australian OME patients and Brazilian OME patients along with their control. 14 Maruthy and Mannarukrishnaiah described findings among children of 3 years, 4 years, and 5 years, 15 while Schilder et al included 2 groups with persistent and very persistent OME. 16 Villa and Zanchetta also included 2 subgroups of 7 to 8 years and 9 to 10 years. 17 The detailed characteristics of patients included in our study are given in Table 1.
Study Population Characteristics and Various Tests Used in Included Studies.

Abbreviations: ABR, auditory brainstem response; CAPD, central auditory processing disorder; DDT, dichotic digit test; DST, dichotic speech test; FFR, frequency following response; FPT, frequency pattern test; GIN, gap in noise; GINP, gap in noise percent; LE, left ear; RE, right ear; LLR, late latency response; MLD, masking level difference; OME, otitis media with effusion; PPS, pitch pattern sequence; PTA, pure-tone audiometry; PSI, pediatric speech intelligibility; SIN, speech in noise; SSI, synthetic sentence identification.
Risk of Bias
The NOS score ranged from 6 to 8. The total score was obtained by adding scores given to 3 domains, that is, selection, comparability, and outcomes according to study types. So, all the studies were included in our review. The NOS scoring can be accessed in Supplemental Online Resource 1.
APD Assessment Outcomes
The 10 included studies used various assessment outcomes. The various behavioral tests done were gap in noise (GIN) test, dichotic digit test (DDT), dichotic speech test (DST), frequency pattern test (FPT), pediatric speech intelligibility, synthetic sentence identification, pitch pattern sequence test, and masking level difference (MLD). Similarly, the electrophysiological tests done were auditory brainstem response (ABR), P300, late latency response (LLR), and frequency following response (FFR; Table 1)
The GIN Test
Four articles compared GIN among OME patients(n = 150) and controls(n = 152) for the measurement of APD.11,12,15,18 The analysis showed a significant standardized mean difference [SMD = 0.63 (0.25-1.01), P = .001)] for the GIN test of APD between OME patients and controls (Figure 2).

Forest plot analysis of the GIN test. GIN, gap in noise.
Frequency Pattern Test
FPT naming
Two articles compared FPT (naming) among OME patients (n = 69) and controls (n = 58) for the measurement of APD.12,15 There was a significant standardized mean difference [SMD = −1.48 (−2.18 to −0.78), P < .001)] for the FPT (naming) test of APD between OME patients and controls (Figure 3).

Forest plot analysis of FPT (naming). FPT, frequency pattern test.
FPT nonverbal
Villa and Zanchetta compared FPT (nonverbal) among OME patients (n = 29) and controls (n = 30) for the measurement of APD in 5 subgroups. 15 The analysis also showed a significant standardized mean difference [SMD = −2.20 (−3.22 to −1.78), P < .001)] for the FPT (nonverbal) test of APD between OME patients and controls (Figure 4).

Forest plot analysis of FPT (nonverbal). FPT, frequency pattern test.
Auditory Brainstem Response
Three studies compared different ABR absolute peak and interpeak latencies (I, III, V, I-III, III-V, I-V) and peak amplitudes among OME patients (n = 74) and controls (n = 63) for measurement of APD.13,17,20 The analysis was done separately for each peak latency.
Auditory brainstem response-I
The analysis showed a significant standardized mean difference [SMD = 0.46 (0.11-0.81), P = .01)] for the ABR-I latency test of APD between OME patients and controls with heterogeneity (I2 = 3%, P = .36; Figure 5).

Forest plot analysis of absolute peak latency for ABR-I, ABR-III, and ABR-V. ABR, auditory brainstem response.
Auditory brainstem response-III
The analysis showed a nonsignificant standardized mean difference [SMD = 0.47 (−0.16 to 1.10), P = .14)] for ABR-III latency test of APD between OME patients and controls with heterogeneity (I2 = 61%, P = .08; Figure 5).
Auditory brainstem response-V
The analysis showed a significant standardized mean difference [SMD = 0.44 (−0.15 to 1.04), P = .14)] for the ABR-V latency test of APD between OME patients and controls with heterogeneity (I2 = 56%, P = .11; Figure 5).
Auditory brainstem response I to III
The analysis showed a significant standardized mean difference [SMD = 0.51 (0.17-0.85), P = .004)] for the ABR I to III latency test of APD between OME patients and controls with heterogeneity (I2 = 0%, P = .45; Figure 6).
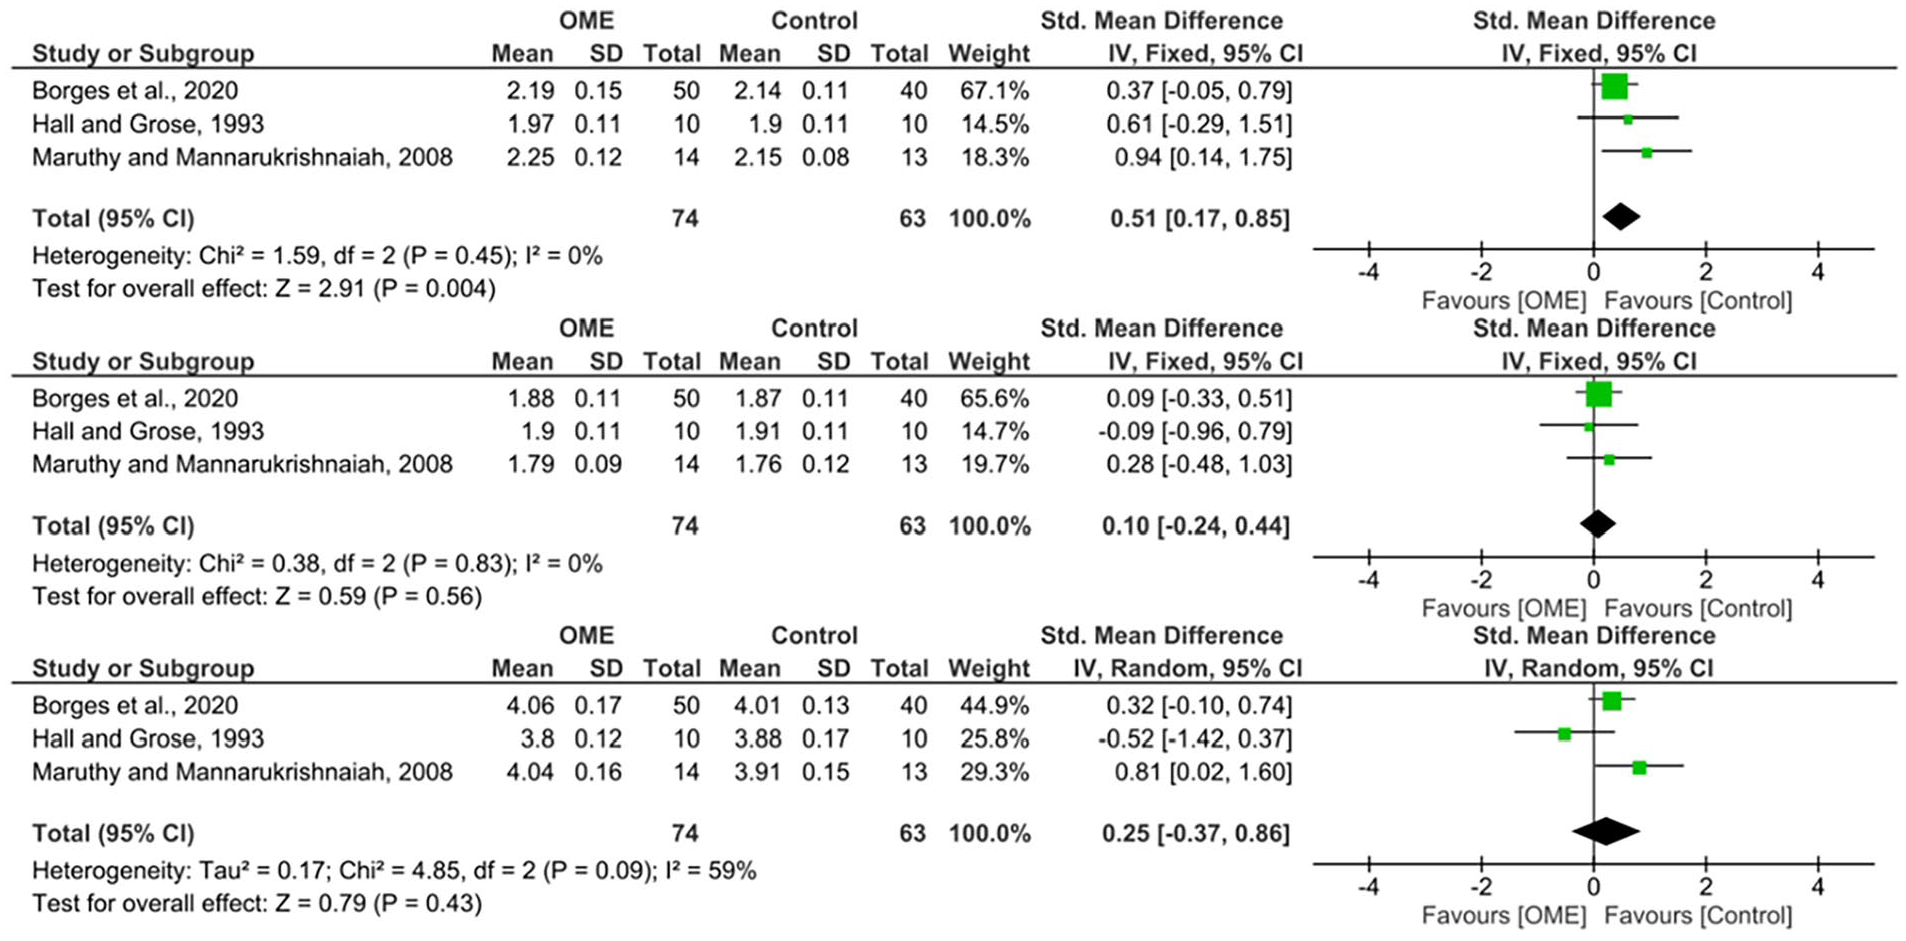
Forest plot analysis of interpeak latency of ABR I to III, ABR III to V, and ABR I to V. ABR, auditory brainstem response.
Auditory brainstem response III to V
The analysis showed a nonsignificant standardized mean difference [SMD = 0.10 (−0.24 to 0.44), P = .56)] for the ABR III to V latency test of APD between OME patients and controls with heterogeneity (I2 = 0%, P = .83; Figure 6).
Auditory brainstem response I to V
The analysis showed a nonsignificant standardized mean difference [SMD = 0.25 (−0.37 to 0.86), P = .43)] for ABR I to III latency test of APD between OME patients and controls with heterogeneity (I2 = 59%, P = .09; Figure 6).
We did not conduct the Funnel plot for publication bias owing to the few number of studies in the analysis (<5 studies). Studies also compared other APD assessment outcomes between OME and controls which were not analyzed because of the scarcity of data. These outcomes are described below.
Dichotic Digit Test
Khavarghazalani et al used the DDT test to assess APD outcomes. 20 Twelve children with OME had a mean DDT score of 78.3 while 14 normal students had a mean DDT score of 81.6. There was a statistically significant mean difference between the 2 groups (P = .002).
DST, speech in noise test, binaural fusion, filtered speech, and auditory memory sentences
Schilder et al discussed all these tests among OME preschool children and compared them with no OME. 16 OME patients were divided into persistent OME and very persistent OME. The scores although lower in the OME group did not yield statistical significance except for the speech in noise (SIN) test which was significantly lower in the “very persistent OME” group when compared with the “no OME” group (80.5% vs 76%, P = .03).
Masking level difference
Pillsbury et al compared MLD between healthy children and those with OME, before and 1 and 3 months following the placement of ventilation tubes. 18 Average MLD was relatively small in the OME group (8.5 dB) compared to their healthy controls (14.2 dB). Although the mean MLD improved following surgery (10.6 dB at 1 month and 11.6 dB at 3 months), it was lower in comparison to the controls (P < .01). Similarly, Hall and Grose showed that the group of children having a history of OME when compared to the healthy children had a reduced MLD and an increased threshold which was statistically significant (P < .05). 19
ABR wave amplitude
Maruthy and Mannarukrishnaiah showed a statistically significant reduced amplitude of wave I (P < .01) and III (P < .05) in children with a history of OME compared to their controls at the age group of 3 years. 15 Similarly, Borges et al had reduced amplitude scores of waves III (P = .002) and V (P = .008). 24
P300
Borges et al performed an Long Latency Evoked Auditory Potential (LLEAP) evaluation using P300. 14 The study used 2 cohorts (Australian and Brazilian) and their controls. The P300 responses for Brazilian OME patients showed significantly longer mean latencies compared to their controls (22.2 ms, P = .02). For amplitude, no statistically significant difference was seen in these 2 groups. Likewise, the average latency delay was significantly greater in the Australian OME group when compared to their controls (22 ms, P = .04), and no statistical difference in amplitude. Similar were the results in their other study where there was a statistically significant increase in latency in the OME group (330.6 ms vs 317.19 ms, P = .008); however, a no difference in the amplitude when compared to healthy controls (0.794). 23
Late latency response
In the study by Maruthy and Mannarukrishnaiah, there was a shorter latency and an earlier occurrence of LLR peaks in children with a history of OME, and the finding was statistically significant for those with the age of 3 years in all 4 waves [P1 (95.4 ms vs 81.3 ms, P < .01), N1 (168.4 ms vs 134.6 ms, P < .01), P2 (235.9 ms vs 183.55 ms, P < .01), and N2 (296.80 ms vs 256.85 ms, P < .01)]. However, the mean amplitude of the waves was not significantly different between the 2 groups. 15
Frequency following response
Sanfins et al found a statistically significant difference in the latencies of waves V, A, C, D, E, F, and O between the children with a history of OME and the healthy controls. 21 While the average latencies were seen to be higher in the OME group, the FFR amplitude values were statistically indifferent between the 2 groups.
Discussion
Studies on humans, as well as animals, have revealed that OME produces sound-evoked activity that is reduced and temporally degraded, altering the neural representations of acoustic stimuli and perceptual capacity both during and after the resolution of the middle ear illness. According to a general theory, decreased perception skills are caused by different sound encoding in the central auditory system, such as loss of synaptic inhibition. This may affect the development of the central auditory system in children.24,25
The auditory temporal processing is one of the key functions of central auditory processing and has 4 subcategorical functions; masking, ordering, integration, and resolution. 26 The GIN test measures temporal processing, specifically temporal resolution, and the utility of this test in APD was shown in an earlier study by Musiek et al. 26 Four studies reported the GIN test outcomes in children with OME. Cases with OME had an increased GIN threshold compared to the controls in each study. Also, the forest plot analysis of the pooled data showed a statistically significant standardized mean difference in cases with OME when compared to the controls. Temporal resolution skills usually develop at 6 to 7 years. 13 Preclusion of the auditory input during this period can affect the sensory coding of temporal information thus affecting the temporal resolution skills. 13 The low GIN scores with increased thresholds could be attributed to it. FPT is another test that is frequency-based but can also assess certain aspects of temporal processing, particularly temporal ordering. 27 The temporal ordering skills development occurs at the bilateral cortical hemispheres with the corpus callosum acting as a conduit to transfer information between the hemispheres. 17 FPT comprises both verbal as well as nonverbal responses. Borges et al used nonverbal FPT in Brazilian and Australian groups. 14 Both groups showed statistically significant improved scores in the control group compared with the children with a history of OME. Similar were the results in the study of Villa and Zanchetta, where they compared FPT (both nonverbal and verbal stimuli) between children having a history of OME with healthy controls in 2 age groups (7-8 years and 9-10 years). 17 The forest plot analysis of the pooled data also showed a statistically significant standardized mean difference in FPT scores (naming and nonverbal; Figure 3) favoring the control group. Even though children with OME had poorer temporal ordering function compared to the comparators, Villa and Zanchetta showed improved FPT scores at higher age within the study group suggesting the progressive maturation process of the temporal ordering function. 17 Another interesting finding was the poorer performance of the Brazilian study group compared to the Australian study group in both FPT and GIN tests in the study by Borges et al. 14 While the authors put forth the reason for the observed differences as the variation in the management protocols with the socioeconomy of the country playing a role, it is imperative to conduct additional research in the field to comprehensively evaluate the impact of socioeconomic variables.
Binaural processing of acoustic stimuli is another vital central auditory processing function that helps in both sound localization as well as sound segregation, that is, being able to listen in a noisy environment.28,29 The processing of interaural level difference (ILD) and interaural time difference (ITD) of sound arriving in both ears occurs at the superior olivary complex. 28 Early-onset hearing loss due to OME usually results in asymmetric and abnormal auditory cues thus affecting the interaural timing and intensity which in turn affects the binaural processing function. Various tests such as DDT, DST, SIN, and MLD can assess this auditory processing function.30,31 Khavarghazalani et al showed statistically significant reduced mean DDT scores in the children in the OME group when compared to their controls. 20 Schilder et al compared a range of tests such as SIN, DST, filtered speech, binaural fusion, and auditory memory sentences between OME and normal control group. Although not statistically significant, the scores were comparatively lower in the OME group. Children in the “very persistent OME” group, however, had a statistically significant poorer performance in the SIN test compared to those with no history of OME. 16 MLD assesses the function of the auditory system to detect the slightest ITD and ILD and relates to sound discrimination abilities in a noisy environment by the listener. Hall and Grose 19 and Pillsbury et al 18 showed a statistically significant MLD reduction among children with a history of OME when compared to the control group. The results of these studies collectively depict the effect of early-onset OME in the binaural processing of the auditory signals. However, with time the binaural processing function is thought to recover as shown by the improvement in MLD in children with OME when followed up to 4 years after surgery in the study by Hall et al. 29
While behavioral tests are entirely subjective, electrophysiological tests on the other hand provide an objective assessment. Auditory input from the brain stem affects the auditory processing at the cortical level; thus, abnormal input from the brain stem can also result in abnormal cortical responses which can be assessed by these tests. 15 Click-evoked ABR, FFR, binaural interaction component of ABR, middle latency response, cortical auditory-evoked potential, P-300, and mismatched negativity are some of the electrophysiological tests done in APD. 6 Findings, such as the progressive decrease in absolute peak and interpeak latencies from the intranatal period to the initial 2 years of the postnatal period and the increase in pontine auditory conduction velocity which reaches a value similar to adults in the first 2 to 4 years of life, suggests that the critical period for the ANS development is within first 2 years of life and its proper stimulation in this period plays a key role in role in its normal development.32,33 Several studies have shown increased absolute peak and interpeak latencies although the peaks are inconsistent among the studies in children with early-onset OME.34-36 Of the 3 studies that reported absolute peak and interpeak latencies, the forest plot analysis showed a statistically significant difference in absolute peak I, peak V, and interpeak I to III latencies, which is prolonged in children with a history of OME when compared to their controls. The amplitude of waves I, III, and V also were significantly reduced in the OME group. The prolonged interpeak latencies and reduced amplitude of the waves suggest that early-onset OME has an impact at the lower brainstem level. With auditory deprivation, the LLR/P300 is also thought to be affected. P300 had statistically significant longer mean latencies in the OME group compared to controls with no difference in mean amplitude in the study by Borges et al, 14 while Maruthy and Mannarukrishnaiah showed a reverse picture. The LLR wave appeared earlier in their study in the OME group than the controls and the LLR wave latencies had an inverse relation with the ABR wave latencies. The argument the authors put forth is the concept of central gain, that is, the findings were a result of compensatory changes at the cortical level owing to disturbed signaling at the brainstem level. 15 FFR responses in the study by Sanfins et al 21 were also similar to ABR responses with an increase in wave latencies in the OME group compared to the controls and no difference in the amplitude of waves between the 2 groups.
The studies included in this review also had a few limitations. While the cases in the study had a documented history of OME (based on medical records), it is important to note that the comparators included in the study, despite exhibiting normal audiometric and tympanometric findings and no reported history of OME, may still have had undiagnosed OME. Relying solely on parental history for the absence of OME in this group cannot entirely rule out the possibility of undetected cases. Inhomogeneity in the definition of onset on OME for inclusion is another limitation. As the critical period for the development of ANS is within the first 2 years of life, the effect of early-onset OME could have a significant impact on auditory processing compared to those with late-onset OME. Moreover, it is the conductive hearing loss imposed by OME that affects the quality of afferent auditory stimulus rather than OME alone. 24 The majority of the included studies have failed to quantify the level of hearing threshold during the episodes of OME which, if could have been subcategorized into different levels of hearing loss, the results would have been different. The valid reason for this could be the age of the children where conventional hearing tests such as pure-tone audiometry cannot be performed owing to various reasons like poor comprehension, the unwillingness of the child, and so on, and other tests like ABR, Otoacoustic Emissions (OAE), behavioral observational audiometry, visual reinforcement audiometry cannot provide specific quantification of hearing threshold. Also, one of our inclusion criteria was the hearing threshold of cases and controls to be less than 25 dB; however, ASHA classifies a hearing threshold between 16 and 25 dB as slight hearing loss. Not all studies have followed this classification system. A relatively small case series with a unique population precludes the results from being generalized especially while considering socioeconomic factors. While there is plenty of evidence to show that OME in early childhood affects auditory processing, not all the studies have followed the cases for a considerable period to assess the reversibility of APD and this should direct future research. Last, a lack of consensus on a standard diagnostic approach to cases with APD has resulted in studies targeting only a certain portion of auditory function rather than using a battery of tests for more comprehensive evaluation.
It is yet not clear what degree of hearing loss at what period of ANS development affects which level of auditory processing. Animal studies in this aspect can provide robust measures and should direct future research. Also, the effect of slight hearing loss (16-25 dB) in ANS development should be explored to have a minimum threshold for early intervention in OME. While Hall et al 37 and Villa and Zanchetta 17 have shown the auditory processing function usually reverses and improves with time, more studies are required with a long duration of follow-up to assess the reversibility of APD in children after the intervention. Incorporation of functional magnetic resonance imaging in the future in children with APD could help understand the pathological process much better with an anatomical perspective and to direct a targeted test for auditory processing function. Also, the role of electroencephalogram (EEG) in diagnosing APD is emerging. A preliminary pilot study conducted by Milner et al showed that various EEG wave (beta, theta, delta) changes could be assessed to differentiate children with APD. 38
Last, it is prudent to refer the cases with APD to auditory training and language therapy targeting 1 or more auditory processing functions discussed earlier which can have a positive impact on this group of children. 39
Conclusion
Children with early-onset OME exhibit poor auditory processing function when assessed through behavioral and electrophysiological test measures, compared to their normal counterparts. Given its high incidence, it is imperative to prioritize its early detection and intervention to prevent the long-term consequences resulting from auditory deprivation.
Supplemental Material
sj-docx-1-ear-10.1177_01455613241241868 – Supplemental material for Impact of Otitis Media With Effusion in Early Age on Auditory Processing Abilities in Children: A Systematic Review and Meta-Analysis
Supplemental material, sj-docx-1-ear-10.1177_01455613241241868 for Impact of Otitis Media With Effusion in Early Age on Auditory Processing Abilities in Children: A Systematic Review and Meta-Analysis by Bigyan Raj Gyawali, Sanjeev Kharel, Subarna Giri, Anup Ghimire and Prashanth Prabhu in Ear, Nose & Throat Journal
Footnotes
Acknowledgements
We would like to thank Mr Bebek Bhattarai for providing his valuable support during the article design and preparation.
Authors’ Note
BRG and AG have been involved in conceptualization and data curation. SK and SG wrote the methodology and did the formal analysis. BRG, AG, and PP were involved in supervision. Writing—original draft: BRG and SK wrote the original draft. Writing—review and editing: BRG, AG, SG, and PP wrote and edited the manuscript. All authors reviewed the manuscript.
Declaration of Conflicting Interests
The author(s) declared no potential conflicts of interest with respect to the research, authorship, and/or publication of this article.
Funding
The author(s) received no financial support for the research, authorship, and/or publication of this article.

Supplemental Material
Supplemental material for this article is available online.
References
Supplementary Material
Please find the following supplemental material available below.
For Open Access articles published under a Creative Commons License, all supplemental material carries the same license as the article it is associated with.
For non-Open Access articles published, all supplemental material carries a non-exclusive license, and permission requests for re-use of supplemental material or any part of supplemental material shall be sent directly to the copyright owner as specified in the copyright notice associated with the article.
