
Abstract
Introduction
Hearing is a crucial way for humans to connect with the world by enabling the reception of important information. Hearing loss can create significant challenges in daily life and work. It is important to note that individuals sharing identical hearing thresholds can experience distinct levels of hearing-related impediments. 1 This not only affects how rehabilitation is approached but also highlights the need to understand subjective perceptions of hearing loss. Given that hearing is influenced by various factors including auditory environments, interpersonal relationships, communication patterns, personal dispositions, occupations, and cognitive processes, relying solely on outcomes from pure-tone audiometry (PTA) falls short in terms of adequately evaluating the need for hearing rehabilitation. 2 In the past, it was believed that unilateral hearing loss (UHL) presented limited ramifications on people’s lives and interpersonal exchanges, as their unaffected ear maintained normal auditory function. However, advancements in fields like post-auditory deprivation reorganization, auditory spatial localization, auditory psychology, and auditory compensation have brought to light the considerable challenges encountered by individuals with UHL.3,4 An investigation revealed that the prevalence of UHL among adults in the United States stands at 8.1%. Further studies based on demographic factors have reported varying prevalence rates ranging from 5.6% to 13.3%. 5
The hearing handicap inventory (HHI) is a patient-centric questionnaire designed to gauge the scope of hearing and communication difficulties perceived by patients across diverse scenarios, as well as the emotional responses elicited by their auditory struggles. 6 Earlier studies involving individuals with bilateral hearing loss have demonstrated positive connections between HHI scores and higher ear pure-tone thresholds and poorer speech recognition capacities. In addition, the HHI has proven to mirror the psychosocial obstacles encountered by individuals with hearing loss in real-world contexts. 7 Nonetheless, existing research showed that individuals boasting similar pure-tone thresholds may experience varying degrees of hearing-related impediments in their daily lives and professional undertakings. 8 This variability presents a challenge when endeavoring to assess the efficacy of rehabilitation initiatives. The purpose of this study was to explore the consistency of HHI and PTA in assessing hearing status and to provide valuable insights into their clinical application.
Materials and Methods
Research Participants
The current research retrospectively reviewed the data of patients examined at Lanzhou University Second Hospital, China, for self-perceived hearing loss between April 2020 and July 2022. The inclusion criteria of the study participants were as follows: (1) aged ≥18 years; (2) demonstrable cognitive competence and the capacity to clearly articulate personal experiences; (3) patients with UHL and perceived hearing loss of more than 1 month (patients with average hearing thresholds of 20 dB HL at 0.5, 1, 2, and 4 kHz air conduction in the healthy ear and ≥35 dB HL in the affected ear); (4) participants who provided informed consent and voluntarily participated in the study. The exclusion criteria were as follows: (1) use of hearing aids; (2) self-reported substantial fluctuations in hearing levels within the preceding month; (3) manifestation of pronounced symptoms like dizziness, tinnitus, ear discomfort, ear fullness, ear discharge, or the presence of notable systemic or psychiatric conditions, alongside simultaneous substantial impairments in vision, limb mobility, and other faculties; (4) difficulty completing the questionnaire (eg, understanding the survey or an inability to complete it), as well as suboptimal cooperation during PTA, thereby possibly introducing biased outcomes. Finally, 6540 participants met the inclusion criteria. This study was approved by the ethics committee of our hospital.
Research Methods
All volunteers participated in detailed medical history inquiries, specialized ear examinations, completion of the HHI, and a general information survey, as well as the PTA test.
The HHI and general information survey
Patients completed the HHI based on their real-life experiences of hearing loss. Subsequently, all data were reviewed and entered by trained professionals. The HHI includes 25 questions, each with 3 response options: “yes” (4 points), “sometimes” (2 points), and “no” (0 points). The total score (out of 100) is calculated by totaling the points from all questions. The 25 questions are divided into 2 subdomains based on different testing focuses: the situational/social (S) subdomain with 12 questions assesses the perceived degree of hearing loss in various scenarios, while the emotional (E) subdomain with 13 questions evaluates the emotional reactions of patients when confronted with hearing loss. Higher scores on the questionnaire indicate more severe hearing loss. According to the American Speech-Language-Hearing Association’s classification, HHI scores from 0 to 16 indicate no significant hearing loss, scores from 17 to 42 indicate mild-to-moderate hearing impairment, and scores above 43 indicate severe hearing loss. 7
The participants were also provided with a general information questionnaire (including name, gender, age, occupation, and history of ear-related conditions) and were given guidance on how to complete the questionnaire. The participants were instructed to complete the questionnaire within 5 minutes. In cases where participants had difficulty visualizing the questionnaire questions, the researchers duly verbalized the questionnaire content and meticulously recorded the participants’ responses.
Pure-tone audiometry
Within a meticulously soundproof enclosure, the Astera 1066 audiometer (GN Otometrics A/S, Denmark) was used, supplemented by TDH 39 air-conduction headphones and B71 bone-conduction headphones. Proficiently trained audiologists administered the PTA test for each participant. This battery of tests encompassed measurements of both air- and bone-conduction thresholds, spanning frequencies of 500, 1000, 2000, and 4000 Hz for both ears. In the frequency range of 500, 1000, 2000, and 4000 Hz, the average air-conduction threshold of the patient’s self-reported hearing loss ear was calculated as the PTA. Following the World Health Organization’s 1997 recommendations, the hearing outcomes were classified as follows: PTA ≤25 dB HL: normal hearing; 26 to 40 dB HL: mild hearing loss; 41 to 60 dB HL: moderate hearing loss; 61 to 80 dB HL: severe hearing loss; and ≥81 dB HL: profound hearing loss. 9
Statistical Methods
The SPSS 22.0 software was used for data analysis. Measurement data were presented as mean ± standard deviation. Comparisons were examined by the t test for 2 sets of data and by analysis of variance for multiple data sets, which were subject to the t test for further comparisons, as well as the Bonferroni test for multiple comparison correction. Enumeration data were expressed as proportions. The consistency between the 2 hearing evaluation methods was assessed using the kappa test. A significance threshold of P < .05 was defined as an indicator of statistically significant differences.
Results
Comparison Between PTA and HHI Scores
Among the 6540 patients, there were 2895 men and 3645 women, with ages ranging from 22 to 77 years and a mean age of 48.53 ± 9.32 years. The mean hearing thresholds of 0.5 to 4 kHz in the healthy ear ranged from 3.65 to 18.45 dB HL, with a mean of 10.83 ± 5.29 dB HL; this ranged from 35 to 125 dB HL in the affected ear, with a mean of 69.63 ± 28.45 dB HL. In the cohort of 6540 participants, the PTA results revealed that 3895 individuals (59.56%) exhibited normal pure-tone thresholds, 1434 (21.93%) had mild hearing loss, 809 (12.37%) demonstrated moderate hearing loss, and 402 (6.15%) experienced severe hearing loss. There were 55 (2.07%) cases of uncertain deafness, 1240 (46.86%) cases of conductive deafness, 1208 (45.68%) cases of sensorineural deafness, and 142 (5.39%) cases of mixed deafness in patients with hearing impairment. The results showed that of the 3421 patients with normal pure-tone hearing, 87.83% had normal HHI scores and 12.17% had moderate hearing loss, with no serious loss reported. Of the 1434 participants whose PTA was classified as reflecting mild hearing loss, 1262 (88.01%) had normal HHI scores and 112 (7.81%) had mild-to-moderate hearing loss; 60 participants (4.18%) had severe hearing loss. Of the 809 participants whose PTA was defined as a moderate hearing loss score, 137 (16.93%) had a normal HHI score, 622 (76.89%) had a mild-to-moderate hearing loss score, and 50 (6.18%) had severe hearing loss score. Of the 402 participants with severely impaired PTA, 37 (9.20%) had mild-to-moderate HHI scores, while 365 (90.80%) remained classified as severely impaired (see Table 1).
Comparison of Pure-Tone Hearing Threshold and HHI Scoring Results.
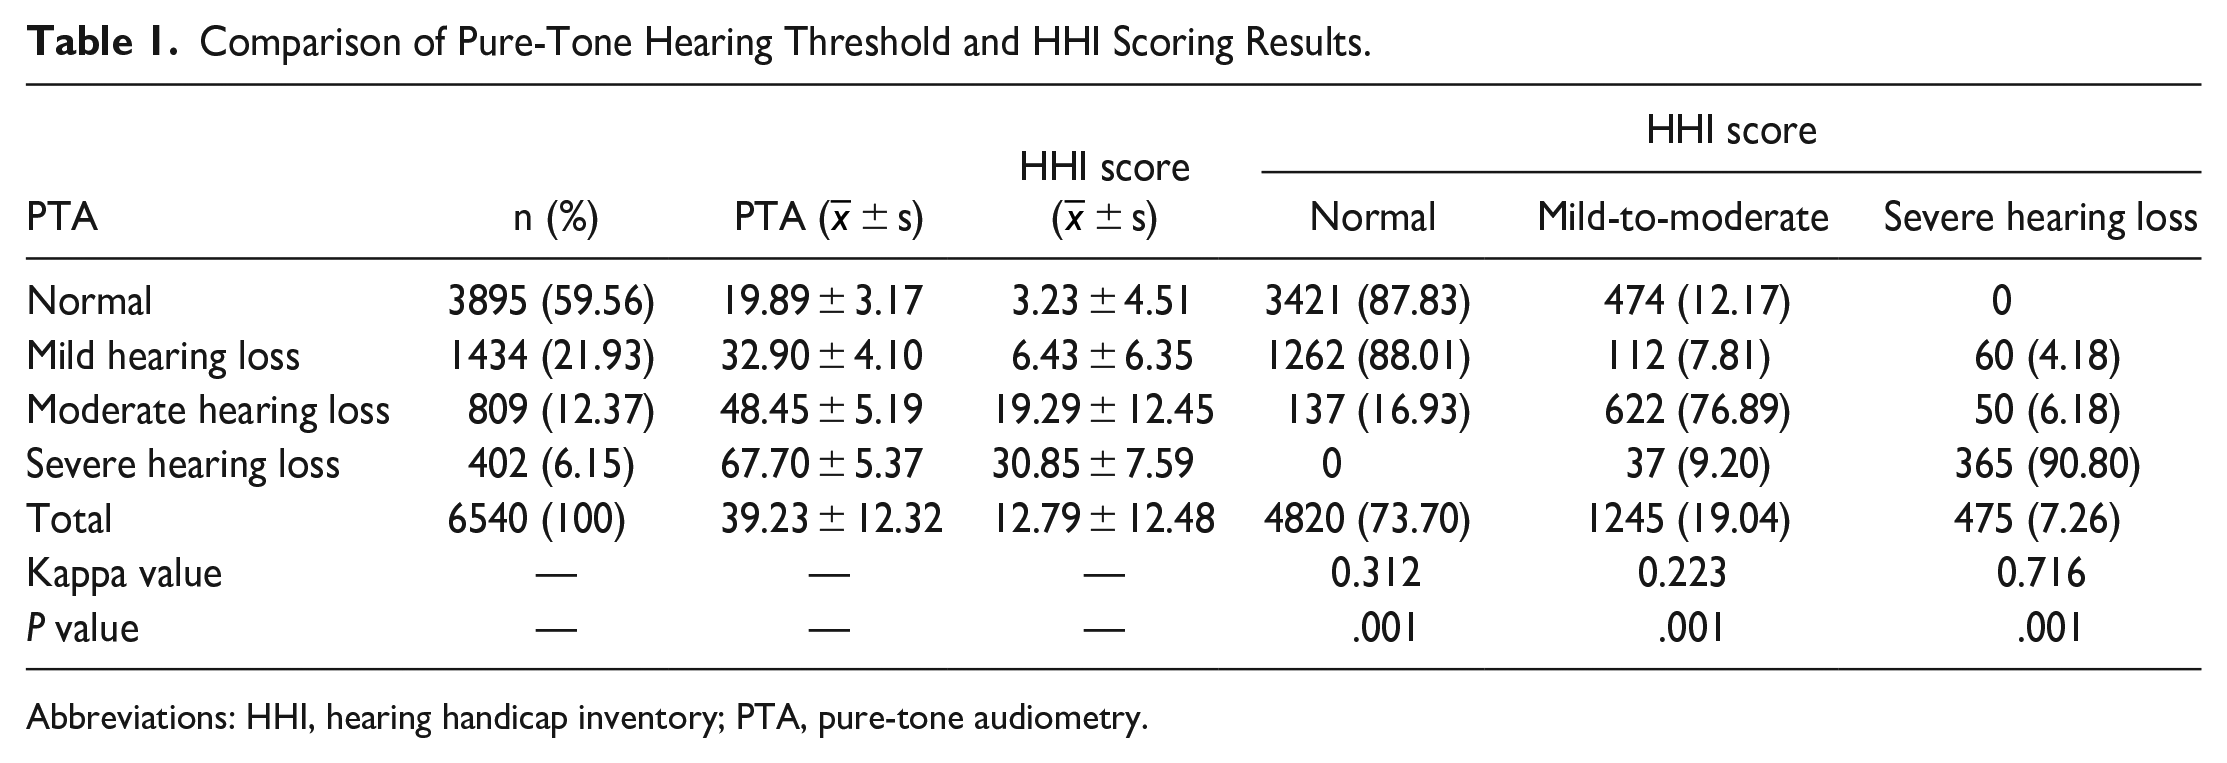
Abbreviations: HHI, hearing handicap inventory; PTA, pure-tone audiometry.
Consistency Analysis Between HHI and PTA
The 4 categories of PTA include normal pure-tone threshold, mild hearing loss, moderate hearing loss, and severe hearing loss. The 3 categories of HII are normal hearing, mild-to-moderate hearing loss, and severe hearing loss. Therefore, to render PTA and HII comparable, we combined mild hearing loss and moderate hearing loss in the 4 categories of PTA into mild-to-moderate hearing loss in HII for the direct comparative analysis. The kappa coefficient was used to test the consistency between the HHI and PTA scores using the data presented in Table 1. The kappa values of the results were 0.312, 0.223, and 0.716 (P = .001), which were normal, mild-to-moderate, and severe hearing loss, respectively. The results showed that the HHI score was consistent with the PTA score, particularly in the assessment of severe hearing loss (see Table 1).
Sensitivity and Specificity of the HHI and PTA
With a PTA ≤25 dB HL serving as an indicator of normal hearing and HHI scores ≤8 denoting the absence of hearing loss, the evaluation of sensitivity for the HHI yielded a value of 73.08%; specificity was 87.83%, positive predictive value was 95.60%, and the negative predictive value reached 70.98%.
Discussion
The HHI is a widely used instrument for gauging the extent of hearing loss. It has traversed linguistic barriers through translation and has been adapted with reduced question counts to assess rehabilitation outcomes across diverse populations. 10 Evidence has shown that scores on the HHI for the elderly (HHIE) are correlated with patients’ PTA thresholds. 11 Furthermore, the condensed iteration, namely, the HHIE-screening version (HHIE-S) has demonstrated utility as a preliminary screening tool to predict the presence of hearing loss. Notably, an HHIE-S score surpassing 8 denotes the existence of hearing loss, manifesting commendable sensitivity and specificity as a screening tool for hearing loss. Domestic researchers have compared the sensitivity and specificity of the HHI for adults-screening version (HHIA-S) against the digits-in-noise (DIN) test for hearing-screening purposes, yielding respective values of 0.684 and 0.967. 12 While the scale-based examination is user-friendly, its sensitivity and specificity fall short of those exhibited by the DIN test. Existing literature also presented the association between the pure-tone threshold of healthier and HHI scores in individuals with bilateral hearing loss. 7
This study is based on individuals with unilateral self-perceived hearing loss as a means to investigate the correlation between PTA and HHI scores. The strong correlation between HHI and PTA observed in this study has important clinical significance. This correlation reinforces the view that HHI can be used as a valuable adjunct to pure-tone listening tests to assess listening status. Their correlation illustrates the need for a combination of listening tests that can provide different information and perspectives to assess the impact of hearing loss. The PTA provides important quantitative data on hearing thresholds and objectively measures hearing thresholds, while the HHI provides a qualitative perspective to subjectively reflect the impact of hearing loss on quality of life and capture the real impact of hearing loss on personal daily life. The combination of the 2 can help clinicians understand the patient’s hearing status and needs more comprehensively, taking into account objective measurements and subjective experiences to provide more appropriate and effective treatment plans.
Initially, it was believed that UHL did not affect patient communication; however, recently, both subjective questionnaires and objective audiological studies have shown that UHL reduces signal-to-noise ratio speech perception, particularly in rapidly developing children and can cause difficulties in mastering several complex spoken language skills. 13 Furthermore, spatial hearing and speech discrimination in reverberation/noise may be the primary dimensions affected by UHL. 14 Although the brain can adapt to unbalanced input signals in cases of unilateral or asymmetric hearing loss, it is undeniable that UHL can cause difficulties in speech rehabilitation, especially since this change occurs during the developmental period. 15 A survey conducted by Choi et al 5 reported that 40% of patients with UHL reported hearing disturbances. The report of Augustine et al 16 showed that one-third of the HHIA scores of patients with more than moderate-to-severe UHL reflected mild-to-moderate psychosocial disturbances; in addition, the affective subscale E-scores of the HHIA scores among the patients with UHL were higher than the social subscale S-score.
There was consistency between the HHI and PTA scores, with moderate consistency in evaluating individuals without hearing loss and those with mild-to-moderate loss. This was mainly attributed to the different basic principles of these 2 evaluation methods. PTA focuses on assessing an individual’s responsiveness to pure-tone signals at varying frequencies within a standard soundproof environment. 17 It eschews language involvement and refrains from capturing subjective perceptions exhibited by patients. Conversely, the HHI probes an individual’s auditory encounters within real-life contexts, thereby more effectively capturing the cascading repercussions of auditory deterioration on their physiological, psychological, and social equilibria. Reportedly, only 34% to 38% of auditory loss cases are identified through PTA. 18 Therefore, disparities between the HHI and PTA are not unexpected, given their distinct emphases and capacities in encapsulating hearing-related experiences.
In the present study, the concordance analysis highlighted a moderate degree of alignment between the HHI and PTA outcomes. In a study conducted by Diao et al, 19 where PTA ≤25 dB HL signified normal hearing and HHIE-S scores ≤8 denoted the absence of hearing loss, the derived kappa coefficient was 0.134, closely approximating the outcome yielded by the current study. Similarly, another investigation by Tomioka et al 20 unveiled a Pearson correlation coefficient of .69 between HHIE-S scores and PTA values, marking a moderate-to-robust correlation between these 2 instruments. In this study, the HHI exhibited a sensitivity of 73.08%, a specificity of 87.83%, a positive predictive value of 95.60%, and a negative predictive value of 70.98%. These values are in line with the reported ranges documented in pertinent research, 21 which commonly display sensitivities ranging from 53% to 85% and specificities spanning 64% to 97%. Concerning the comparison analysis between HHI scores and PTA values across distinct disease course cohorts, the results suggest a coherent pattern wherein alterations in HHI scores and PTA values occur during the disease course; that is, the initial stages of hearing loss experience a swifter progression compared to later stages, highlighting the paramount significance of early detection and intervention to curtail the rate of hearing loss progression and safeguard communication capabilities to the utmost extent possible.
In the normal PTA group, a notable 87.83% of individuals were classified as having no hearing loss according to their HHI scores. In contrast, a considerable 90.80% of the participants in the severe hearing loss PTA group were identified as having severe hearing loss, based on their HHI scores. These findings reveal a lower level of concordance between HHI scores and pure-tone thresholds in both the normal hearing and severe hearing loss cohorts, while a comparatively higher level of concordance was observed within the moderate hearing loss group, which aligns with the outcomes delineated in the work of Servidoni and Conterno. 22 Notably, as many as 474 participants in the normal PTA group yielded HHI scores indicative of hearing loss. This observation underscores the significance of accounting for ailments that might evade detection through PTA, such as issues concerning the auditory peripheral system, central auditory processing disorders, and even early manifestations of cognitive loss. For these individuals, presenting normal pure-tone thresholds but atypical HHI scores could potentially signify an early indication of certain conditions. Thus, the combined use of PTA and the HHI emerges as pivotal for enabling a more holistic appraisal of participants’ auditory status.
If someone is determined as having moderate or severe hearing loss according to the HHI, but actually has normal hearing thresholds, this may indicate the presence of other factors affecting their hearing, such as noise exposure, age, cognitive abilities, attention, and speech abilities. 23 In particular, aspects related to cognitive processing, auditory integration, and emotional well-being may not be fully captured by PTA. In this case, the clinician should consider performing additional hearing evaluations and exploring potential underlying causes, such as speech-in-noise threshold testing, cochlear emission testing, testing for central auditory processing disorders, cognitive decline, and other nonperipheral auditory system problems to determine the type and extent of hearing loss and provide appropriate intervention measures. 24 Accordingly, clinicians should consider a patient’s individual experience and fully understand their subjective feelings. Even when the pure-tone threshold is normal, people may encounter difficulties understanding speech in a noisy environment, which can affect their daily communication and quality of life. Conducting other assessments should be considered, such as speech-in-noise tests, cognitive assessments, and central auditory processing loss tests, as these can help identify specific areas of difficulty that are not evident in PTA. 25 In addition, the implementation of the diagnosis of patients should be patient-focused, and patients should actively participate in the care plan. The specific challenges and goals they face must be clearly understood and interventions tailored accordingly. This may include communication strategies, assistive hearing devices, and referrals to specialists in fields such as audiology, psychology, and neurology.
Despite these findings, it must be acknowledged that this study has inherent limitations. Due to time constraints, the sample size of this study was limited. In addition, a level of subjectivity may have been present in participants’ HHI responses, which could result in a degree of deviation. Second, due to the limitation of retrospective data, this study could not judge the type of hearing loss involved. In addition, the consistency of the HHI and PTA scores among different populations was not explored in this study. In the future, we aim to expand our study, adopt a multicenter research approach, and stratify the population to further explore the consistency of the HHI and PTA in assessing hearing status.
Conclusion
In conclusion, HHI and PTA have consistency in terms of evaluating hearing status, especially for assessing severe hearing loss, with a high level of consistency between the 2 methods. Therefore, the combination of HHI and PTA can be analyzed to comprehensively evaluate hearing conditions from both subjective and objective perspectives and serve as a comprehensive evaluation method that is expected to provide guidance for clinical tracking and intervention in the field of hearing health.
Footnotes
Acknowledgements
Not applicable.
Author Contributions
Study conception and design: XLB and YFG
Data collection: YLD and YW
Data analysis and interpretation: XWL and BCX
Drafting of the article: All
Critical revision of the article: All
Data Availability
All data generated or analyzed during this study are included in this published article.
Declaration of Conflicting Interests
The author(s) declared no potential conflicts of interest with research, and/or publication of this article.
Funding
The author(s) disclosed receipt of the following financial support for the research, authorship, and/or publication of this article: The National Natural Science Fund (82160214, 31960132, 32160149); The Key R&D Projects of Gansu Science and Technology Department (21JR11RA093); The CuiYing Technology Innovation Program of the Second Hospital of LanZhou University (CY2023-MS-B08).
Ethics Approval
This study was conducted in accordance with the Declaration of Helsinki and approved by the ethics committee of Lanzhou University Second Hospital.