
Abstract
Introduction
Adenoids are a collection of lymphoid tissues found on the outside of the occipital slope, at the base of the sphenoid body, and at the top of the nasopharyngeal cavity. The pseudo-multilayer ciliated columnar epithelium is covered by 4 to 5 longitudinally deep grooves. Adenoids gradually enlarge with age, reach their maximum size by age 6,1,2 and significantly impact children’s growth and development. Most children with adenoid hypertrophy also have secretory otitis media, allergic rhinitis, and chronic sinusitis.3,4 In general, there are diagnostic criteria that necessitate aggressive surgical treatment, but caution is also required in selecting surgical treatment, as minimally invasive surgery will also cause some trauma in the child 2 ; consequently, it is essential for clinicians to choose the optimal surgical timing. The goal of this study is to determine how to more properly assess the situation to determine the ideal timing for surgery when the child has clinical symptoms for a prolonged period. Yet, the A/N is close to, or slightly less than 70%. Consequently, through the cone beam computed tomography (CBCT) examination of 85 children and the use of CBCT to identify objective indicators for confirming adenoid hypertrophy, this study was able to identify a new diagnostic criterion based on the original diagnosis, the criteria are simple to obtain, and as a supplementary diagnosis of A/N, the evaluation of adenoid hypertrophy and the evaluation of its impact on the child will be more meaningful.
Materials and Methods
Clinical Data
From January 2022 to April 2023, children aged 5 to 6 years were admitted to Dalian Central Hospital with adenoid hypertrophy diagnosed and admitted by the Department of Otorhinolaryngology.
The requirements for inclusion are:
Conservative treatment is unsuccessful for mouth breathing or snoring that has persisted for over 6 months.
Have not had any surgeries.
A dental professional may advise adenoidectomy for dental malocclusion or an issue with oral surface development.
The criteria for exclusion are:
Confirm the diagnosis of patients suffering from various syndromes or neurological illnesses.
Subjects who have ever undergone airway obstruction therapy.
Children whose craniofacial development is not progressing as it should be.
Children have considerable artifacts due to their inability to actively cooperate during imaging examinations.
Children who have a previous medical history of an acute respiratory illness or adenoidectomy.
Finally, CBCT examinations were performed on all 85 of our 5 to 6-year-olds who qualified. Forty-eight patients were male, 37 patients were female, 32 patients were diagnosed with allergic rhinitis, 5 with secretory otitis media, 16 with nasal septum deviation, 31 with lower turbinate hypertrophy, and 35 with chronic sinusitis. The average patient height was 117.48 ± 7.46 cm, the average adenoid thickness was 17.13 ± 2.3 mm, and the average nasopharyngeal cavity width was 21.30 ± 1.62 mm. The median nasopharyngeal cavity area and A/N ratio in children with adenoid hypertrophy were 88.00 mm2 and 81.42%, respectively (Table 1).
Clinical Data of 85 Patients.
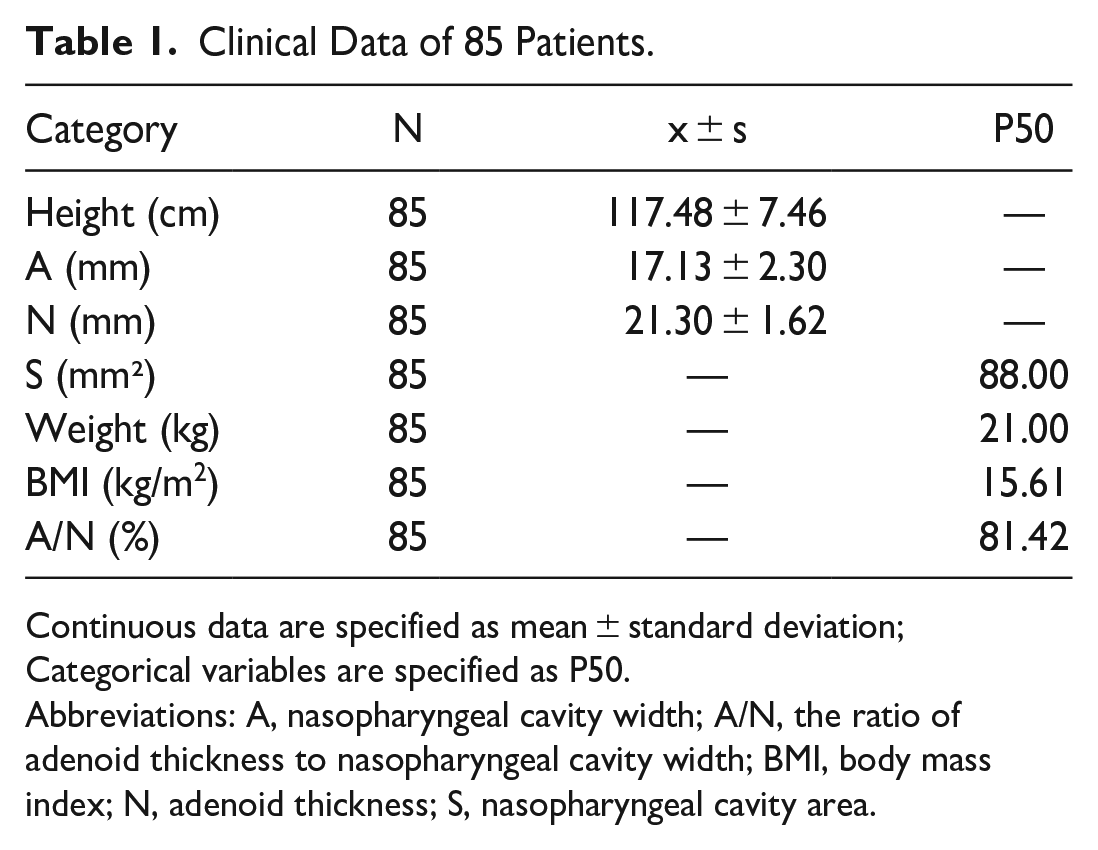
Continuous data are specified as mean ± standard deviation; Categorical variables are specified as P50.
Abbreviations: A, nasopharyngeal cavity width; A/N, the ratio of adenoid thickness to nasopharyngeal cavity width; BMI, body mass index; N, adenoid thickness; S, nasopharyngeal cavity area.
CBCT Scan
Using the Scanora3Dx CBCT scanner, a 360° scan with cone beam imaging was performed. The child was seated while awake, the head was secured to the seat belt bracket, and the Scanora software controlled the CBCT device. Technical parameters: continuous cross-sectional scanning, scanning marker positioning: the center line of the frontal lobe is in the middle sagittal plane of the body, extending from the frontal sinus to the lower border of the earlobe, anterior to the tip of the nose. Parameters: tube voltage of 90 kV, tube current of 8 mA, scanning duration of 16.4 seconds, 140 mm × 165 mm FOV, 0.35 mm layer spacing, and 0.35 mm layer thickness. Axial, sagittal, and coronal data can all be acquired simultaneously via CBCT scans. The OnDemand 3D server reconstructs scan data in the coronal and sagittal planes (Figure 1). CBCT typically emits a radiation dosage of 1229 mGycm2 depending on the conditions. CBCT requires only a minimum exposure time of 2.4 seconds to acquire standard-resolution images, is extremely fast, and is also equipped with a seated gaze system, so the images are virtually devoid of motion artifacts and respiratory rhythms.
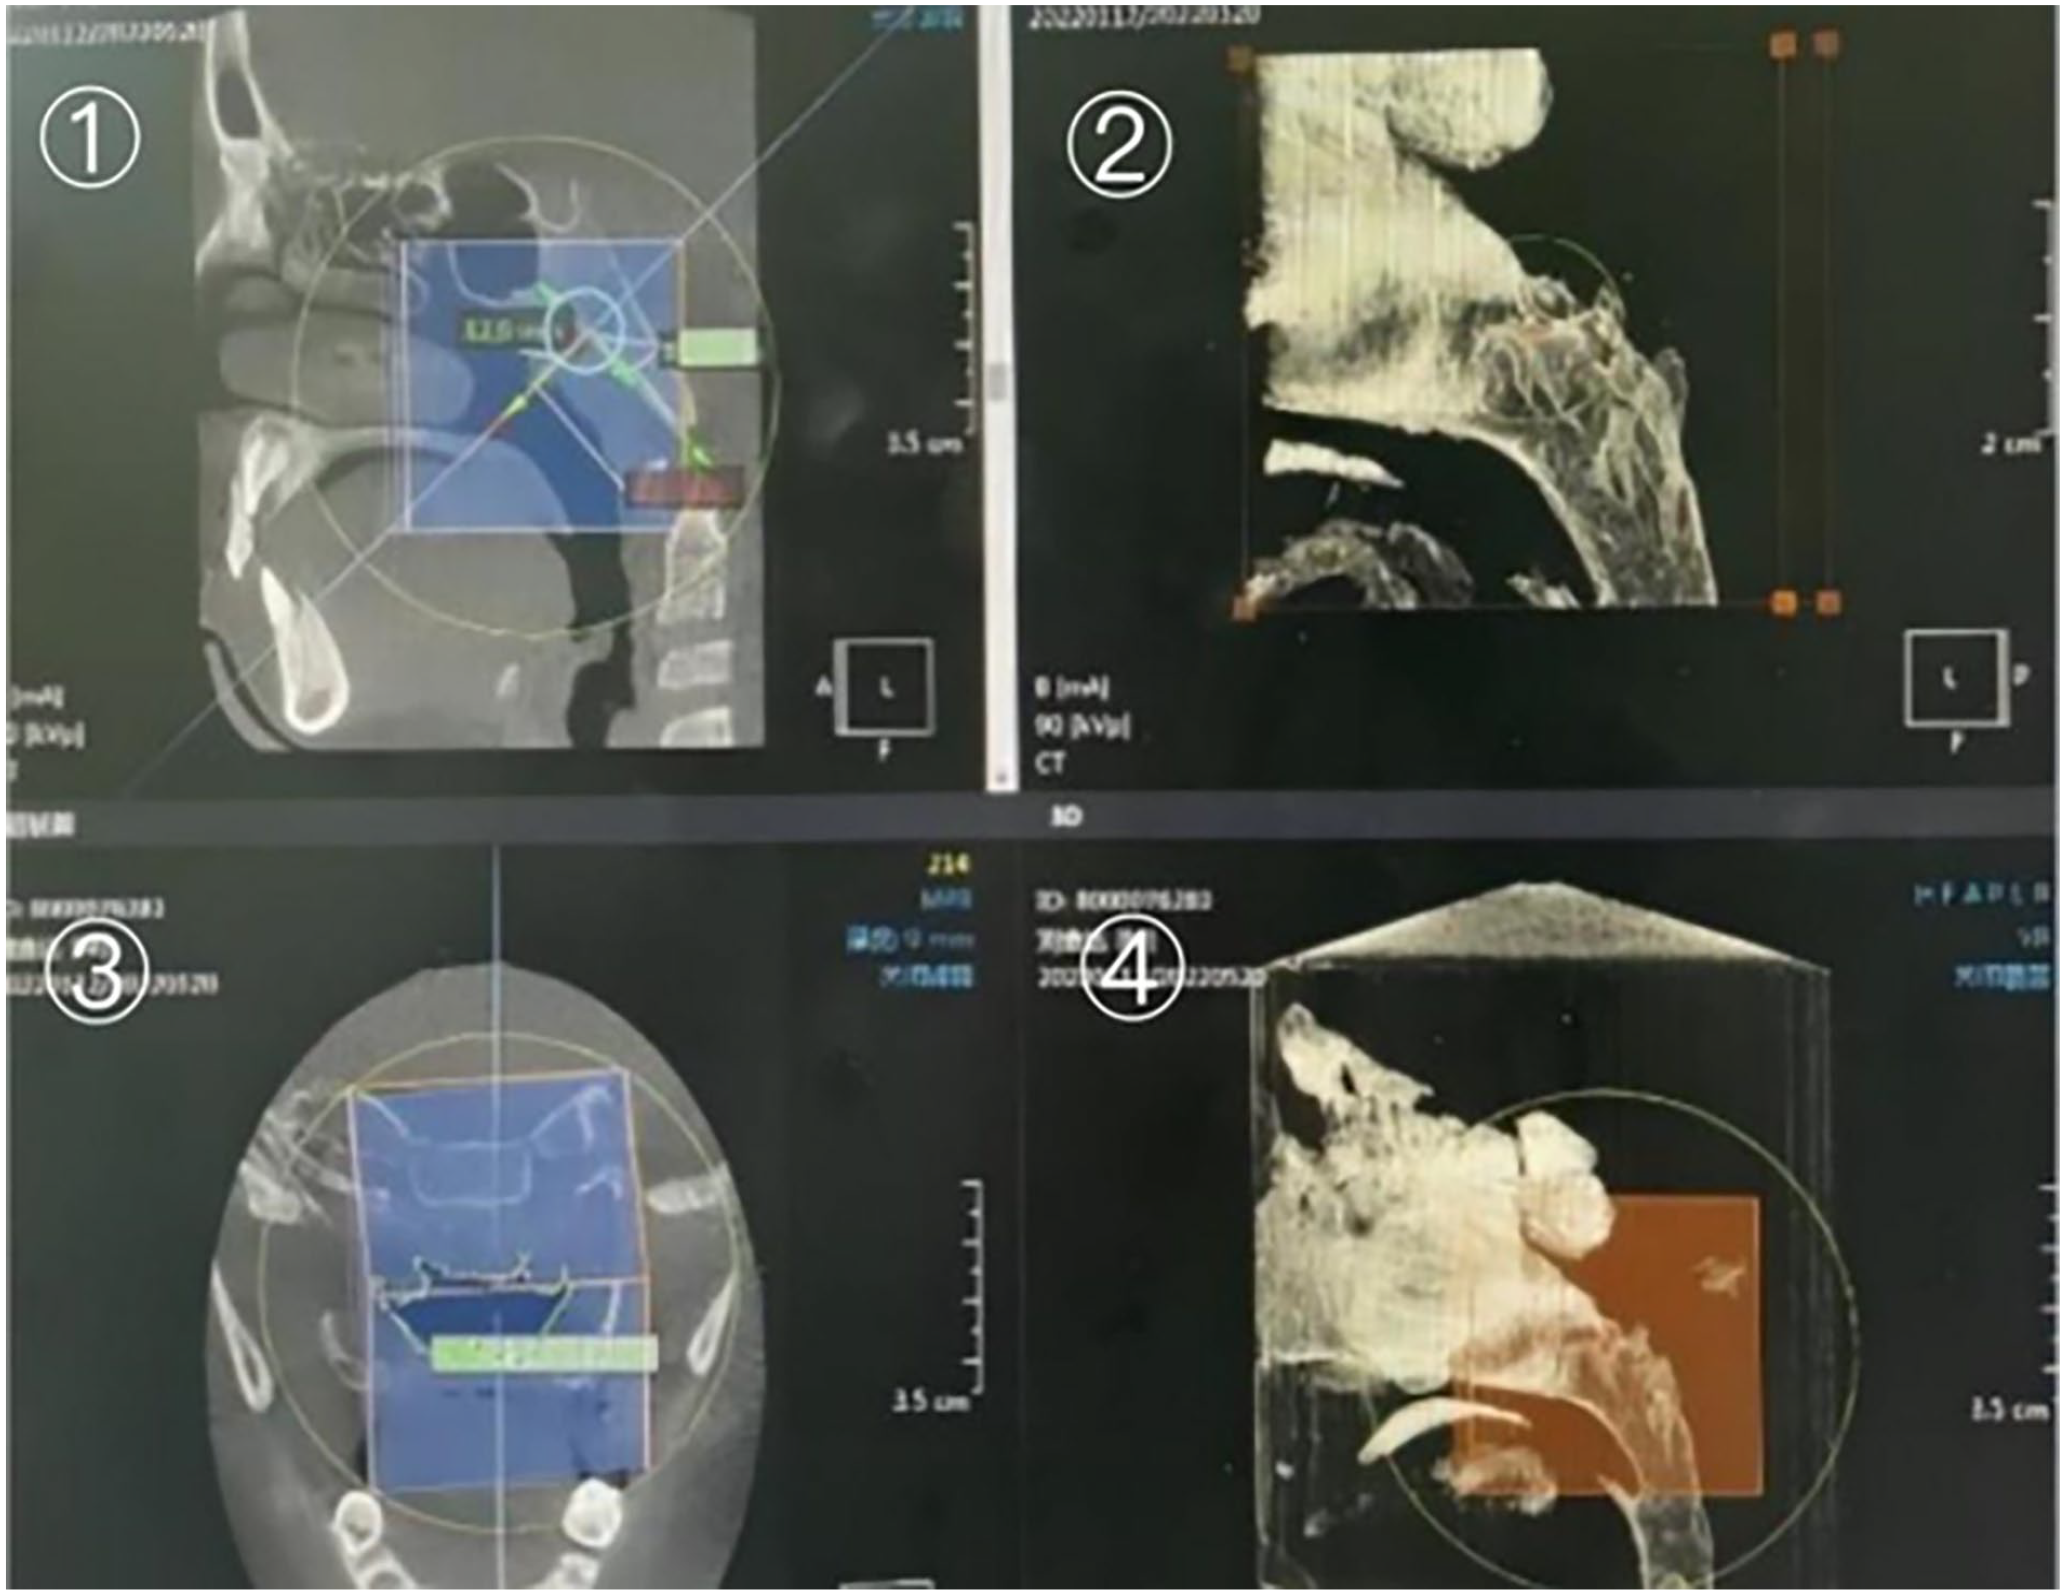
A/N and corresponding nasopharyngeal cavity areas ①, ③; Airway reconstruction②; Enlarged image of airway reconstruction ④.
Methods of Image Processing for CBCT
To acquire a clear image during a CBCT scan, the patient’s mouth must be closed, and their head must remain still. Controlling the radiation dose during scanning is necessary to prevent unnecessary radiation injury. All children’s A/N and corresponding nasopharyngeal cavity areas were measured simultaneously. The patient data can be imported into the software, the morphological characteristics of the adenoids can be visually displayed in the sagittal, coronal, and axial positions simultaneously, the tracheal soft tissue shadow can be reconstructed in 3D, and the airway compression of the hypertrophic adenoids can be intuitively observed on the 3D model, which indirectly reflects the size of the adenoids. Use the software’s magnifying glass to magnify the constricted area of the airway and identify it in the most concave portion of the airway. The marker symbol will then appear automatically in the most convex position of the adenoids in the sagittal and coronal views. In the sagittal position, different levels of the adenoids are observed, the marker symbol is used as a reference, and the marker position is corrected to ensure that the marker symbol is in the most prominent position of the adenoid. A is the vertical distance from the most protrusion of the adenoids to the extracranial tangent of the occipital slope. N is the intersection of the reverse extension of the perpendicular line with the posterior end of the hard palate or the upper edge of the anterior, the middle part of the soft palate and the perpendicular distance of the extracranial tangent line. Rotate the center line to be tangentially perpendicular to the outside of the occipital slope to display the corresponding nasopharyngeal cavity area in the coronal position. The area is enlarged using the magnification tool, and the nasopharyngeal cavity area value of children with adenoid hypertrophy is measured using software tools (Figure 1).
Statistical Analysis
SPSS 25.0 software was used for statistical analysis; data were reported as mean, standard deviation, and median, and the obtained data were filtered for variables. To determine which factors are associated with the size of the nasopharyngeal cavity, a linear regression analysis was performed to evaluate the amplitude and significance of the correlation using R2, and P < .05 was deemed statistically significant. The regression equation was then derived.
Result
Analyze the linear regression results.
To examine the effects of continuous variables such as gender, age, height, weight, BMI, adenoid thickness (N), nasopharyngeal cavity width (A), and the ratio of adenoid thickness to nasopharyngeal cavity width (A/N) on nasopharyngeal cavity area (S). According to the findings, chronic sinusitis and A/N could account for 94.8% of the change in the nasopharyngeal cavity area (R2 = 0.948, P < .05), and the impact of other factors was not statistically significant (P > .05) (Tables 2 and 3).
Clinical Data of 85 Patient and Linear Regression Results of S.
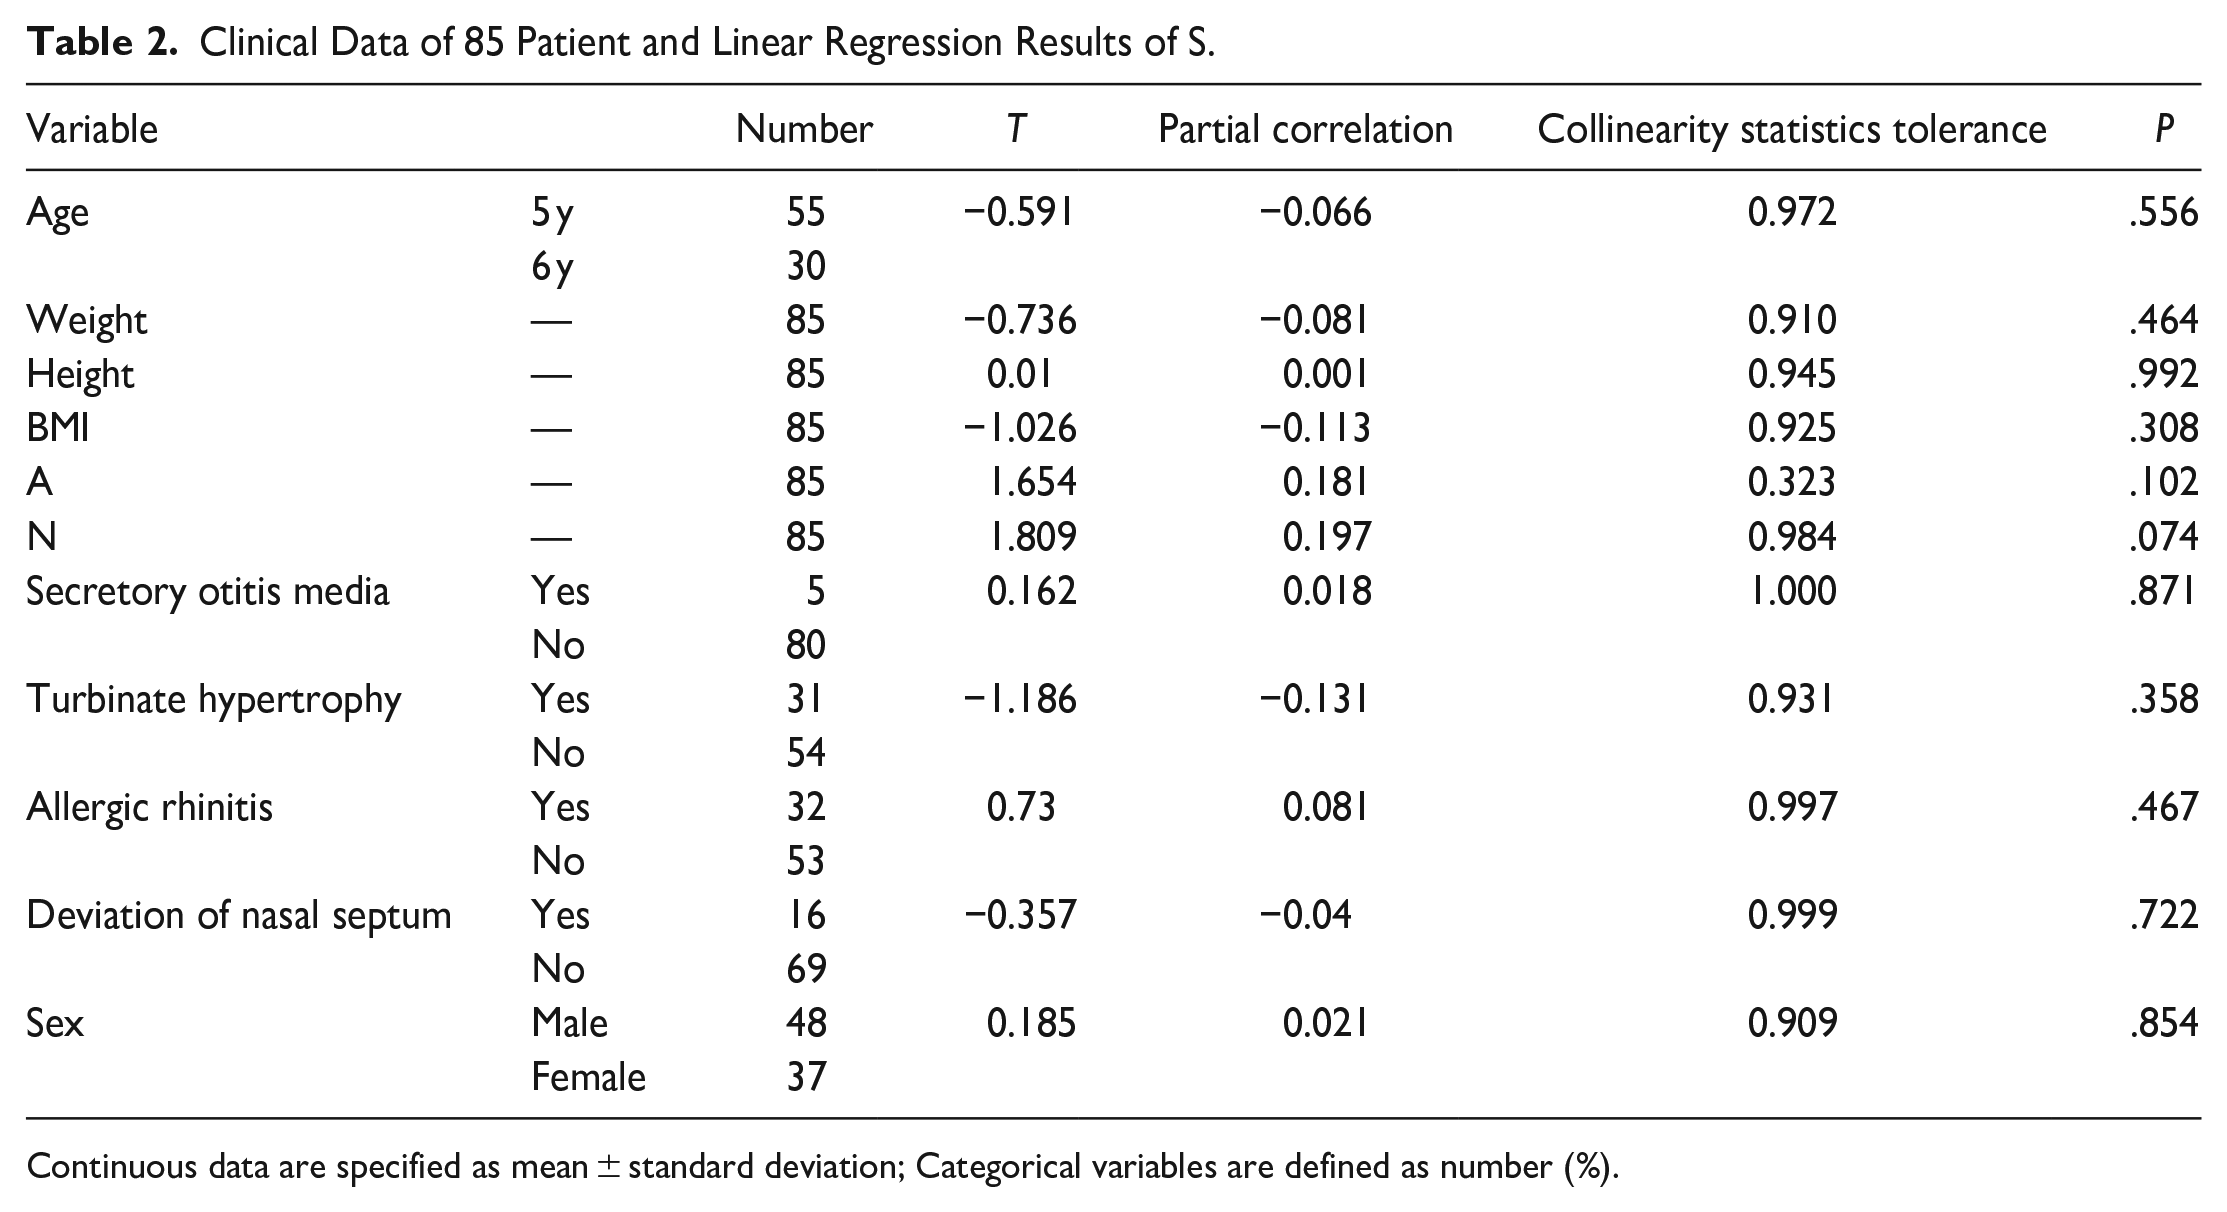
Continuous data are specified as mean ± standard deviation; Categorical variables are defined as number (%).
Linear Regression Results of S.
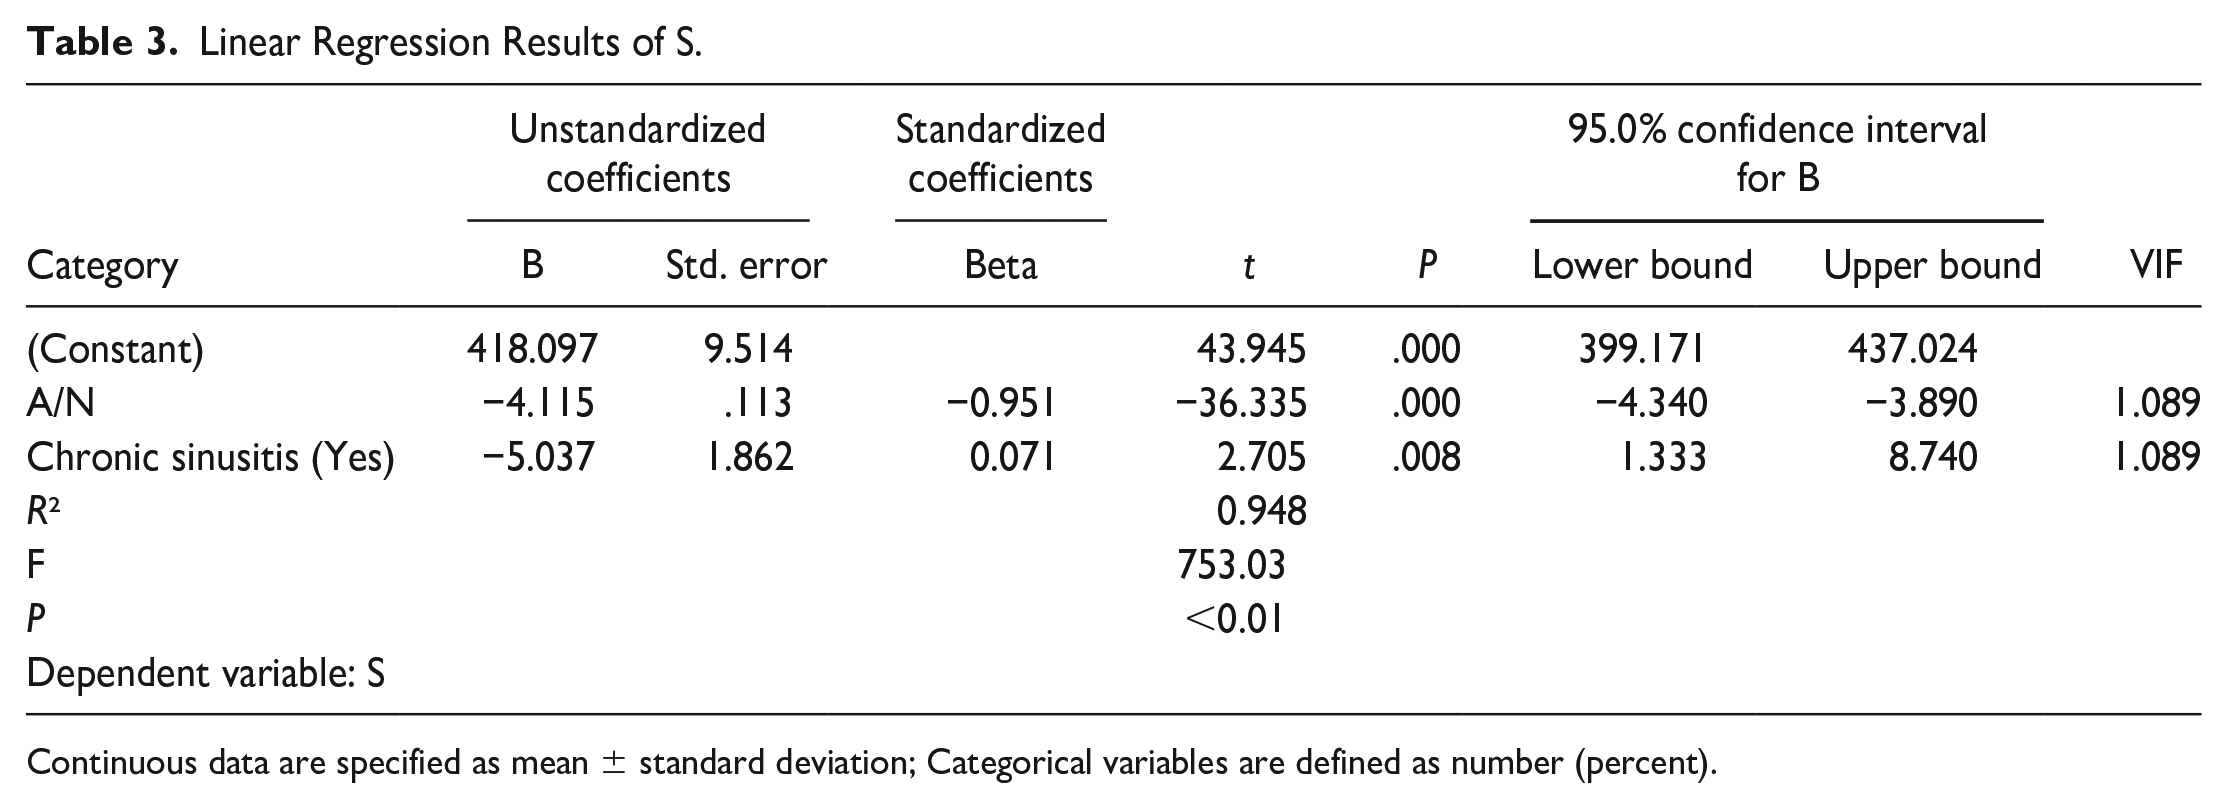
Continuous data are specified as mean ± standard deviation; Categorical variables are defined as number (percent).
The linear regression model was statistically significant, F = 753,030, P < .01. A/N has a negative impact on S, with an impact coefficient of −4.115 and a significance level of P < .01. Patients with chronic sinusitis can also have a detrimental influence on the nasopharyngeal cavity, with an impact factor of −5.037 and a P < .01 (Table 2).
The regression equation between the 2 and nasopharyngeal cavity area is as follows: nasopharyngeal cavity area (S) = −4.115 × A/N × 100-5.037 × 1/0 (with chronic sinusitis/not with chronic sinusitis) + 418.097. The residuals of the above linear regression model have a normal distribution, and the model operation results are accurate and reliable (Figure 2). When the patient on CBCT is manifested as simple adenoid hypertrophy, the regression equation can demonstrate that the corresponding nasopharyngeal cavity area is 130 mm2 when A/N is 70%. In contrast, the corresponding nasopharyngeal cavity area is smaller when the patient has chronic sinusitis imaging findings (Table 2).
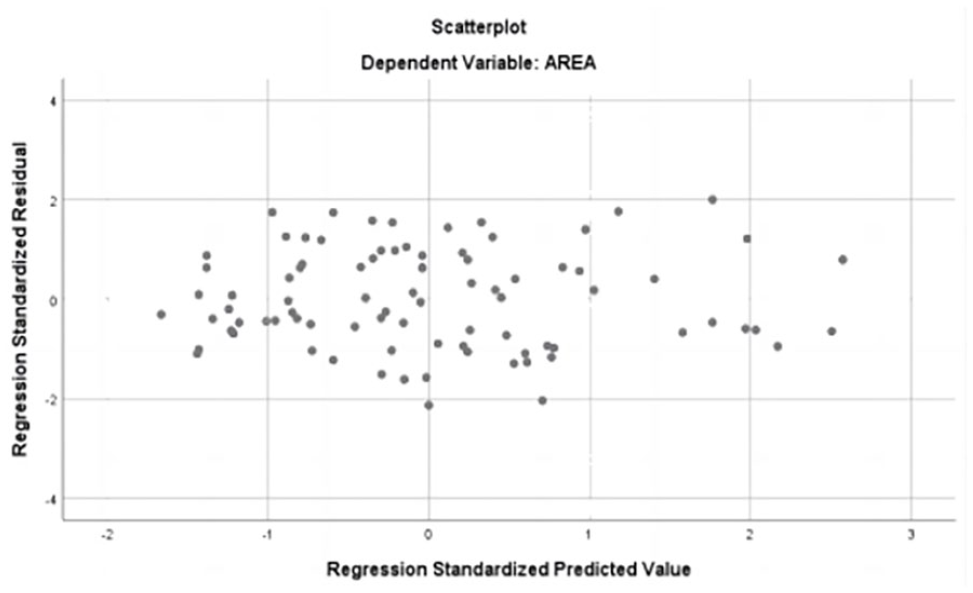
The residuals of linear regression model have a normal distribution.
Discussion
Adenoids are lymphoid tissue in the human body that is part of the immune system. In early childhood, adenoids develop further and perform immune functions, which can recognize and attack viruses, bacteria, and other pathogens. Adenoids are essential to the child’s immune system (5). The volume of adenoids exhibits regular growth as the child ages. Notably, the period between 3 and 8 years of age represents the pinnacle of adenoid growth. Symptoms associated with adenoid enlargement are most pronounced within this demographic. The mean thickness measurements observed of 6-year-old children exhibited a statistically significant elevation compared to the measures obtained from other age cohorts,1,2 and then disappeared at 16 years of age. 5 Airway obstruction caused by enlarged adenoids can result in wheezing, sleep apnea, and adenoid appearance. 6 Cardiovascular and neurological complications may also occur in extreme cases. 7 Therefore, early detection and treatment are crucial. In recent years, as concern for children’s health has gradually increased, the incidence of adenoid hypertrophy diagnoses has also increased year by year. 8 The electronic nasopharyngeal scope is presently the gold standard for adenoid hypertrophy that has been clinically confirmed,1,9 which can observe the degree of nostril obstruction after adenoid hypertrophy.1,10 The pediatric population’s fear of NE limits its usage in diagnosing adenoid hypertrophy, ultimately impeding their capacity to actively participate in the examination process, 11 and has demonstrated poor reliability among scorers and poor clinical operability. 12
Consequently, X-rays and CT examinations are basic, readily obtained, and reproducible methods for diagnosing adenoid hypertrophy, highlighting the diagnostic advantages of imaging.5,11,13 However, X-rays have a high level of radiation, the overlap of anatomical structures, and the patient’s position and respiration can affect flexible anatomical tissues,2,14 and the information provided is relatively limited and cannot provide imaging characteristics of diseases such as chronic sinusitis. Helical CT radiation is large and expensive, and it cannot be repeated briefly; otherwise, it will cause double harm to the patient. CBCT can effectively overcome the shortcomings of both examination techniques. 11
CBCT (cone beam CT) is a 3-dimensional imaging technology that captures data from objects via a rotating cone beam; the image presented is clear and can be reconstructed in 3 dimensions, and the full-angle reading facilitates the physician’s diagnosis of the disease. 15 The radiation dosage for CBCT is incredibly minimal, just a quarter of that for a spiral CT scan, which is the equivalent of flying for 4 hours. Compared to a standard X-ray examination, it boasts a greater resolution and a more accurate diagnosis. CBCT is being utilized extensively in several fields. 16 In otolaryngology, it is primarily employed in diagnosing and managing sinus, nasal cavity, nasopharynx, larynx, and other diseases.11,17 With the development of CBCT technology, it is now extensively used in the diagnosis of adenoid hypertrophy, which not only allows for the classification of individuals with adenoid hypertrophy but also simplifies clinical diagnosis and treatment.5,18 -20 It is a trustworthy and precise instrument for identifying adenoid hypertrophy.21 -23 It can also indicate whether adolescents with adenoid hypertrophy have sinusitis and middle ear infection,17,24,25 which can provide more clinical information. CBCT can depict the morphology and structure of the adenoid, measure A and N in children with adenoid hypertrophy, and calculate A/N.11,17 Because it can consider both adenoid thickness and nasopharyngeal cavity width, the A/N ratio is the first diagnostic method for diagnosing adenoid hypertrophy. In general, the A/N ratio of 0.5 to 0.6 adenoids is normal, 0.61 to 0.70 indicates moderate adenoid hypertrophy, 0.71 to 0.80 indicates pathological hypertrophy and more than 0.80 indicates significant hypertrophy. 1 It is utilized as a diagnostic way for the clinical diagnosis of adenoid hypertrophy because it considers both the thickness of the adenoid body and the width of the nasopharyngeal cavity. 26 However, A and N cannot accurately reflect the size of the patient’s airway during normal breathing. The area of the nasopharyngeal cavity can be displayed in its entirety, so it can be used as a supplementary diagnosis to help clinicians fully understand the relationship between the child’s adenoids and the na-sopharyngeal cavity to provide patients with more accurate clinical diagnosis and treatment. CBCT imaging enables the visualization of cross-sectional area, and certain software is highly dependable for nasopharyngeal cross-sectional measurements. 27 CBCT can also be used to investigate 3D technology for computed tomography and to create effective 3D-printed models as visualization tools. 28 It has great clinical accuracy and can accurately estimate the size of the nasopharyngeal cavity in children who have adenoid hypertrophy. In this study, OnDemand 3D software is used to measure the nasopharyngeal cavity area, and the characteristics of CBCT full-angle imaging are perfectly combined, which significantly improves the accuracy of the nasopharyngeal cavity area and ensures the reliability of using the nasopharyngeal cavity area to aid in the diagnosis of adenoid hypertrophy. In addition, nasopharyngeal cavity area measurement can be used to assess changes in adenoid hypertrophy, as well as the growth or shrinkage of adenoids. For the diagnosis and treatment of adenoid hypertrophy, the combined nasopharyngeal cavity area is therefore crucial.
When a child exhibits clinical symptoms of adenoid hypertrophy and the A/N ratio is greater than 70%, it can typically be actively treated surgically.2,21 However, in actual clinical settings, most individuals have clinical symptoms, and although the illness may last longer, A/N ≤ 70%. Existing treatment guidelines regarding the necessity of aggressive surgical management for such individuals are somewhat ambiguous. To avoid a series of short- or long-term complications caused by adenoid hypertrophy, otolaryngologists must acquire more accurate information from the patient’s examination and conduct a comprehensive evaluation to prevent treatment delays. 28 To address this clinical problem, clinical data collection and linear regression analysis of 85 children revealed an unexpectedly high negative correlation between the nasopharyngeal cavity area (S) and A/N and chronic sinusitis (R2 = 0.948, P < .01). Nasopharyngeal cavity area (S) = −4.115 × A/N × 100-5.037 × 1/0 (with/without chronic sinusitis) + 418.097. When the patient has simple adenoid hypertrophy, A/N = 70%, the regression equation calculates the area of the nasopharyngeal cavity to be 130 mm2, which is used as the cutoff value. It is simple to compute that the patient’s nasopharyngeal cavity area is 130 mm2 at A/N = 70% and then compare it to the actual measured nasopharyngeal cavity area, which provides a new treatment basis for whether the child should be actively treated with surgery. Assist doctors in making more accurate diagnoses and developing individualized treatment regimens to reduce symptoms and increase quality of life. Revise: Assist doctors in generating more accurate diagnoses and tailored treatment plans to minimize symptoms and improve quality of life. In the future, it will be important to expand the amount of age data in clinical investigations and summarize and improve them.
Conclusion
This study used CBCT to determine the size of the nasopharyngeal cavity in children with adenoid hypertrophy. From this, the following equation was derived: S = −4.115 × A/N × 100-5.037 × 1/0 (regardless of whether the patient has chronic sinusitis) + 418.097. When a child presents to an otolaryngologist with symptoms associated with adenoid hypertrophy, a CBCT should be performed: (1) A/N > 70%, and the patient is advised to actively improve the surgical intervention; (2) A/N ≤ 70% and CBCT were used again to calculate the child’s nasopharyngeal cavity area, and (S) when the S < 130 mm2, active surgical intervention was performed; when the S ≥ 130 mm2, the patient can be handled cautiously and monitored on a regular basis.
Research Data
sj-xlsx-1-ear-10.1177_01455613231212837 – Supplemental material for Significance of Nasopharyngeal Cavity Area in Individuals with Adenoid Hypertrophy Assessed by Cone Beam Computed Tomography
Supplemental material, sj-xlsx-1-ear-10.1177_01455613231212837 for Significance of Nasopharyngeal Cavity Area in Individuals with Adenoid Hypertrophy Assessed by Cone Beam Computed Tomography by Yu Wang, Cuiping She, Xiuling Wu, Zhengying Wang, Bo Li, Jiaxin Peng, Yunshi Liang, Delong Liu, Yue Zhang, Yan Wu and Yifan Wang in Ear, Nose & Throat Journal
Footnotes
Acknowledgements
We appreciate the teachers at Dalian Central Hospital’s medical records department who offered retrieval services at the beginning of the work.
Author Note
A/N and chronic sinusitis are significant factors influencing the size of the nasopharyngeal cavity in children with adenoid hypertrophy: a linear regression analysis.
Authors Contributions
All authors contributed to the study concept and design. Material preparation, data collection, and analysis were performed by Yu Wang, Cuiping She, Delong Liu, Xiuling Wu, Zhengying Wang, Bo Li, Jiaxin Peng, Yunshi Liang, YueZhang, Yan Wu, and Yifan Wang. The first draft of the article was written by Yu Wang, and all authors commented on previous versions of the article. Final article was read and endorsed by all authors.
Availability of Data and Materials
The datasets used and/or analyzed during the current study are available from the corresponding author on reasonable request.
Declaration of Conflicting Interests
The author(s) declared no potential conflicts of interest with respect to the research, authorship, and/or publication of this article.
Funding
The author(s) received no financial support for the research, authorship, and/or publication of this article.
Ethical Approval
This is an observational study. The Research Ethics Committee of Dalian Municipal Central Hospital has confirmed that ethical approval is unnecessary.
Statement of Human and Animal Rights
Not applicable.
Statement of Informed Consent
This article has no human subjects, and informed consent is not applicable.
Informed Consent and Patient Details
Not applicable.