
Abstract
This study aimed to identify the association between different cochlear metrics, including the basal turn diameter (A-value), the basal turn width (B-value), and the height of the cochlea (H-value). We also reported an association between H-value and hearing outcomes with cochlear implants (CI). This is a retrospective study that included all patients who underwent CI procedures between 2012 and 2018 at a tertiary center and have; preoperative high-resolution computed tomography (CT)
Keywords
Introduction
Cochlear implantation is a commonly performed treatment modality for patients with severe to profound sensorineural hearing loss. The intracochlear electrode array is responsible for transmitting electrical excitation to the auditory nerve via ganglion cells present in the cochlea. 1 It is noteworthy that the cochlear compartment dimensions, such as cochlear duct length (CDL) and the basal turn diameter, can vary from 30 to 40% between the smallest and largest cochlea.2,3 This, in turn, makes the cochlea either less or more suited for specific electrode array insertion. Therefore, surgeons must realize the delicate anatomical dimensions and variations of the cochlear compartment to prevent potential traumatic electrode array insertion. 4
A temporal bone computed tomography (CT) is commonly performed before cochlear implantation to evaluate the anatomical aspects of the cochlea. 5 Careful selection of the most suitable type of electrode array can help prevent cochlear structural damage and auditory nerve degeneration. Furthermore, an appropriate electrode array has been reported to influence speech comprehension and postoperative residual hearing.6,7
In a previous study by Kuthubutheen et al, 4 the Flex 31 electrode (31 mm) was compared to the Flex 28 electrode (28 mm); there was no marked difference in either electrode insertion angle or speech outcomes. However, a correlation was found among the CDL, cochlear diameter, and speech outcomes when the authors analyzed the results of the short electrode group. 4 This study recommended that further research is needed to evaluate whether CDL is the sole predictor of speech performance among cochlear implant (CI) users.
Basal turn diameter (A-value) was the most common predictor of CDL followed by the cochlear width (B-value). This method has been used in several studies. Another parameter, called the C value, was proposed by Khurayzi et al, 8 which is the gap between the inner wall at the beginning of the cochlea and the outer wall at the beginning of the second turn of the cochlea, to predict malformed anatomy. Previous studies have used different cochlear parameters to compute CDL. Some studies have used A values to compute it and others have used both A and B values for CDL computation. However, the impact of cochlear height (H value) on CDL has not yet been studied. Therefore, the primary objective of this study was to investigate the variation in cochlear height among CI recipients and assess the impact of this variation on CDL and speech outcomes. Furthermore, we aimed to study the relationship between the main cochlear metrics (A, B, and H values).
Materials and Methods
Setting
This was a retrospective study that included medical records of pediatric patients (younger than 18 years) who underwent cochlear implantation between 2012 and 2018 at a tertiary center. The study was conducted following all relevant ethical standards, and the protocol was approved by the ethics committee (reference number E-21-5864).
Participants
The study included all patients who underwent CI surgery between 2012 and 2018 who fulfilled the following inclusion criteria: prelingual deafness, normal bony cochlear anatomy (2 and half turns), implanted with the same device, and had a follow-up duration of at least 2 years after the CI. Normal bony cochlear anatomy was confirmed using both CT and 3D segmentation of the inner ear using (3D Slicer) software (https://www.slicer.org/).
Furthermore, we excluded patients who had central nervous system abnormalities or intellectual disability, patients who had no preoperative CT scan, those who missed the postoperative audiological and speech assessment, patients with incomplete cochlear electrode array insertion, and cochlear convergence by electrode array of less than 65%.
Outcome Measures
High-resolution preoperative CT scans were collected and uploaded to the OTOPLAN software (CAScination AG, Bern, Switzerland) to measure the main cochlear metrics, including A, B, and H values. Medical records of patients who had a follow-up duration of 2 years and more were reviewed to collect the scores of the auditory performance-II (CAP-II) 9 and the speech intelligibility rating (SIR) scales. 10
Imaging and Measurements
Images were obtained using a 512-slice multi-detector row CT scanner (General Electric Healthcare, Milwaukee, WI, USA). The following scanning parameters were used: axial plane, 0.625 mm slice thickness, 230 mAs, 140 kV, and rotation time 1 s with 0.3 mm reconstruction in axial and coronal views. The patient’s imaging scans were uploaded to General Electric Universal Viewer software 6.0 SP10.2 (GE Co, Barrington, IL, USA).
Two trained neuro-otologists blindly performed the measurements using the OTOPLAN software as follows (Figure 1): (i) the cochlear diameter (A-value) was determined by measuring the length of a straight line starting from the midpoint of the round window passing through the mid-modiolus axis and reaching the furthest point on the basal turn; (ii) the width of the cochlear base (B-value) was measured as a straight line perpendicular to the A-value line at the mid-modiolus; and (iii) the cochlear height (H-value) was measured as a straight line starting from the lowest point at the base and ending at the apex. Next, the software automatically calculated the CDL at the organ of Corti level based on the following formulas: A cochlear view from the OTOPLAN software indicating; A-value (green dots); B-value (blue dots); H-value (red dots).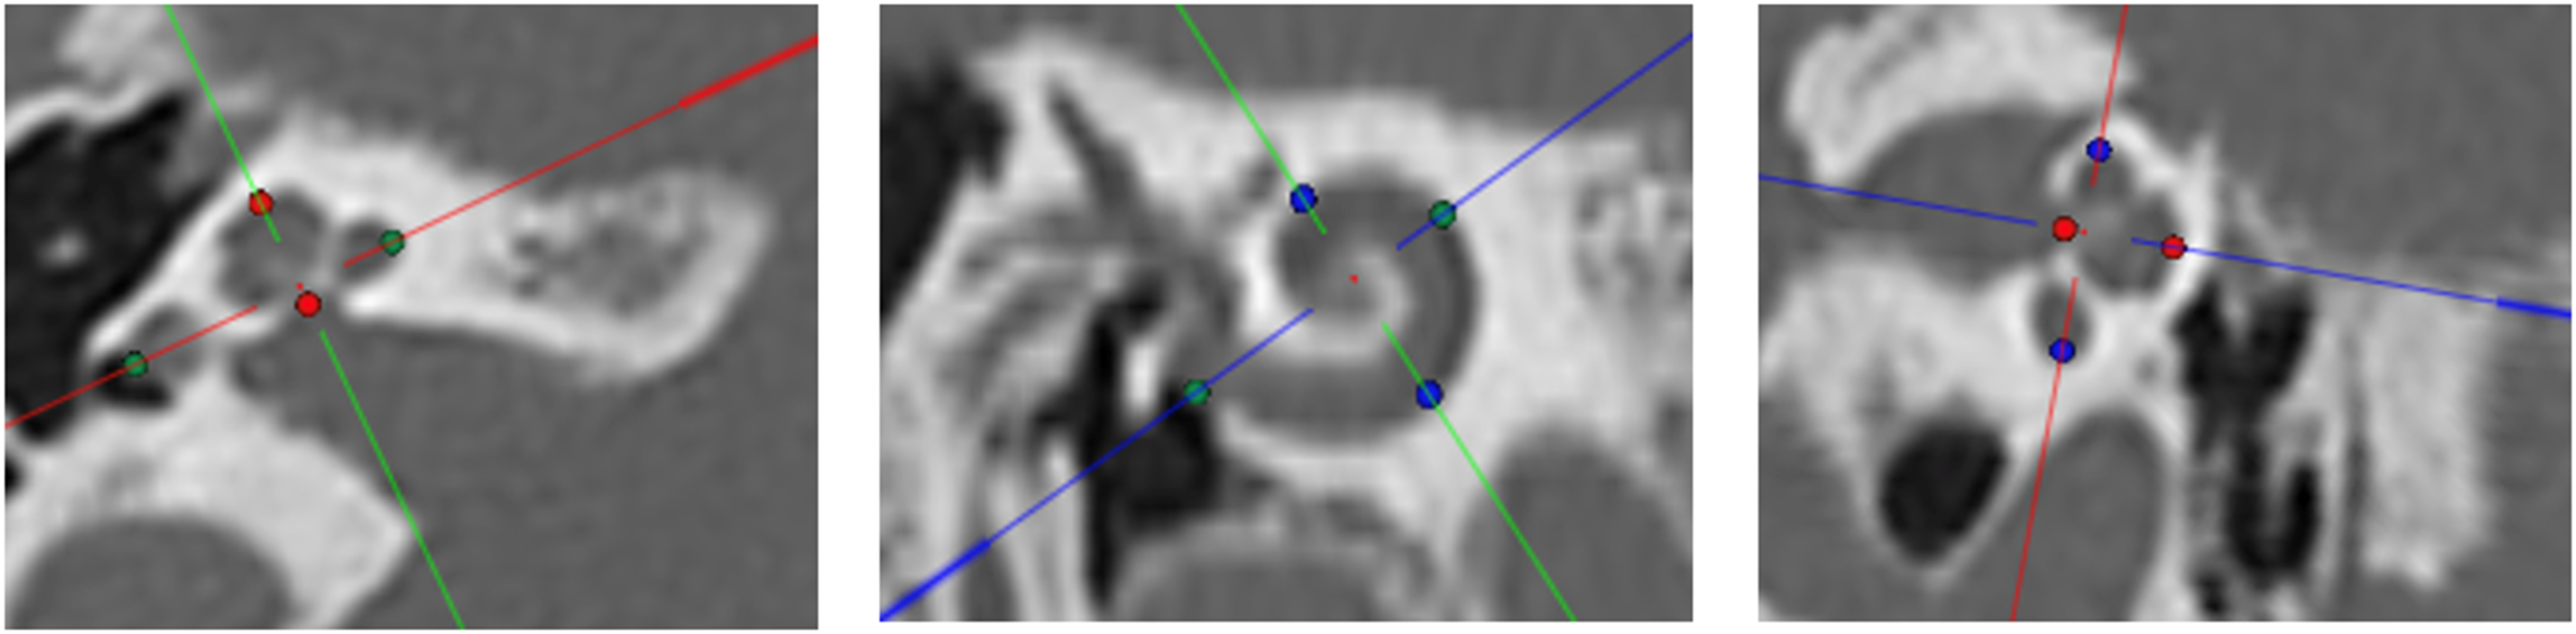
AOC = ALW−1mm
BOC = BLW−1mm
CDLOC = [1.71∗[1∗1.18∗(AOC) + 2.69∗(BOC)− √ (0.72∗AOC ∗BOC)] ∗0.18] + 2.5
where OC indicates the Organ of Corti and LW indicates the lateral wall.
Another research software that was developed by MED-EL as referenced 11 was used to calculate the percentage of cochlear coverage of each electrode array in each ear. First, the cochlear anatomy and number of turns are selected. Then, cochlear basal turn diameter (A-value) is entered in the software which uses the equations proposed by Alexiades et al to compute the CDL along the basilar membrane. The user can choose the suggested electrode array after that and hence the software calculates the cochlear coverage. Furthermore, the user can visualize the patient-specific insertion depths and frequency map based on Greenwood’s formula. Finally and after the complete insertion confirmation from the postoperative radiological findings, the software can determine the insertion depth of each electrode contact and at the tip of the electrode array. 11
Statistical Analysis
All statistical analyses were performed using GraphPad Prism version 8.4.0 (GraphPad Software, La Jolla, CA, USA). The mean, standard deviation, and range (i.e., minimum and maximum values) were used to describe the participants' characteristics. To compare preoperative and postoperative data, the normality of the data was checked first. A parametric paired t-test was performed to test the significance between the group data with a normal distribution and the Wilcoxon non-parametric test was used to test the others. Statistical significance was set at P < 0.05.
Results
Patients
A total of 65 ears implanted with CI in 46 patients (24 boys and 20 girls) fulfilled the inclusion criteria. The cochlear parameter readings (A, B, and H-values) of the two reviewers were homogenous, with high internal consistency (Cronbach’s alpha = 0.97). The mean cochlear coverage of the enrolled electrode arrays was 81.94% ± 6.7 (range: 66.74 to 96.54).
There was no significant variation in the insertion angles of the electrode contacts among all the included patients. The mean insertion angles along electrode contacts from 1 to 12 were 564 +84, 490 ± 67, 417 ± 54, 359 ± 45, 306 ± 32, 258 ± 28, 211 ± 22, 175 ± 14, 136 ± 11, 106 ± 8.1, 75 ± 7, and 46 ± 7.4, respectively (Figure 2). The insertion angle at the electrode tip showed a convergent value, with a mean of 620.3 ± 85.52. The mean insertion angles along the electrode contacts.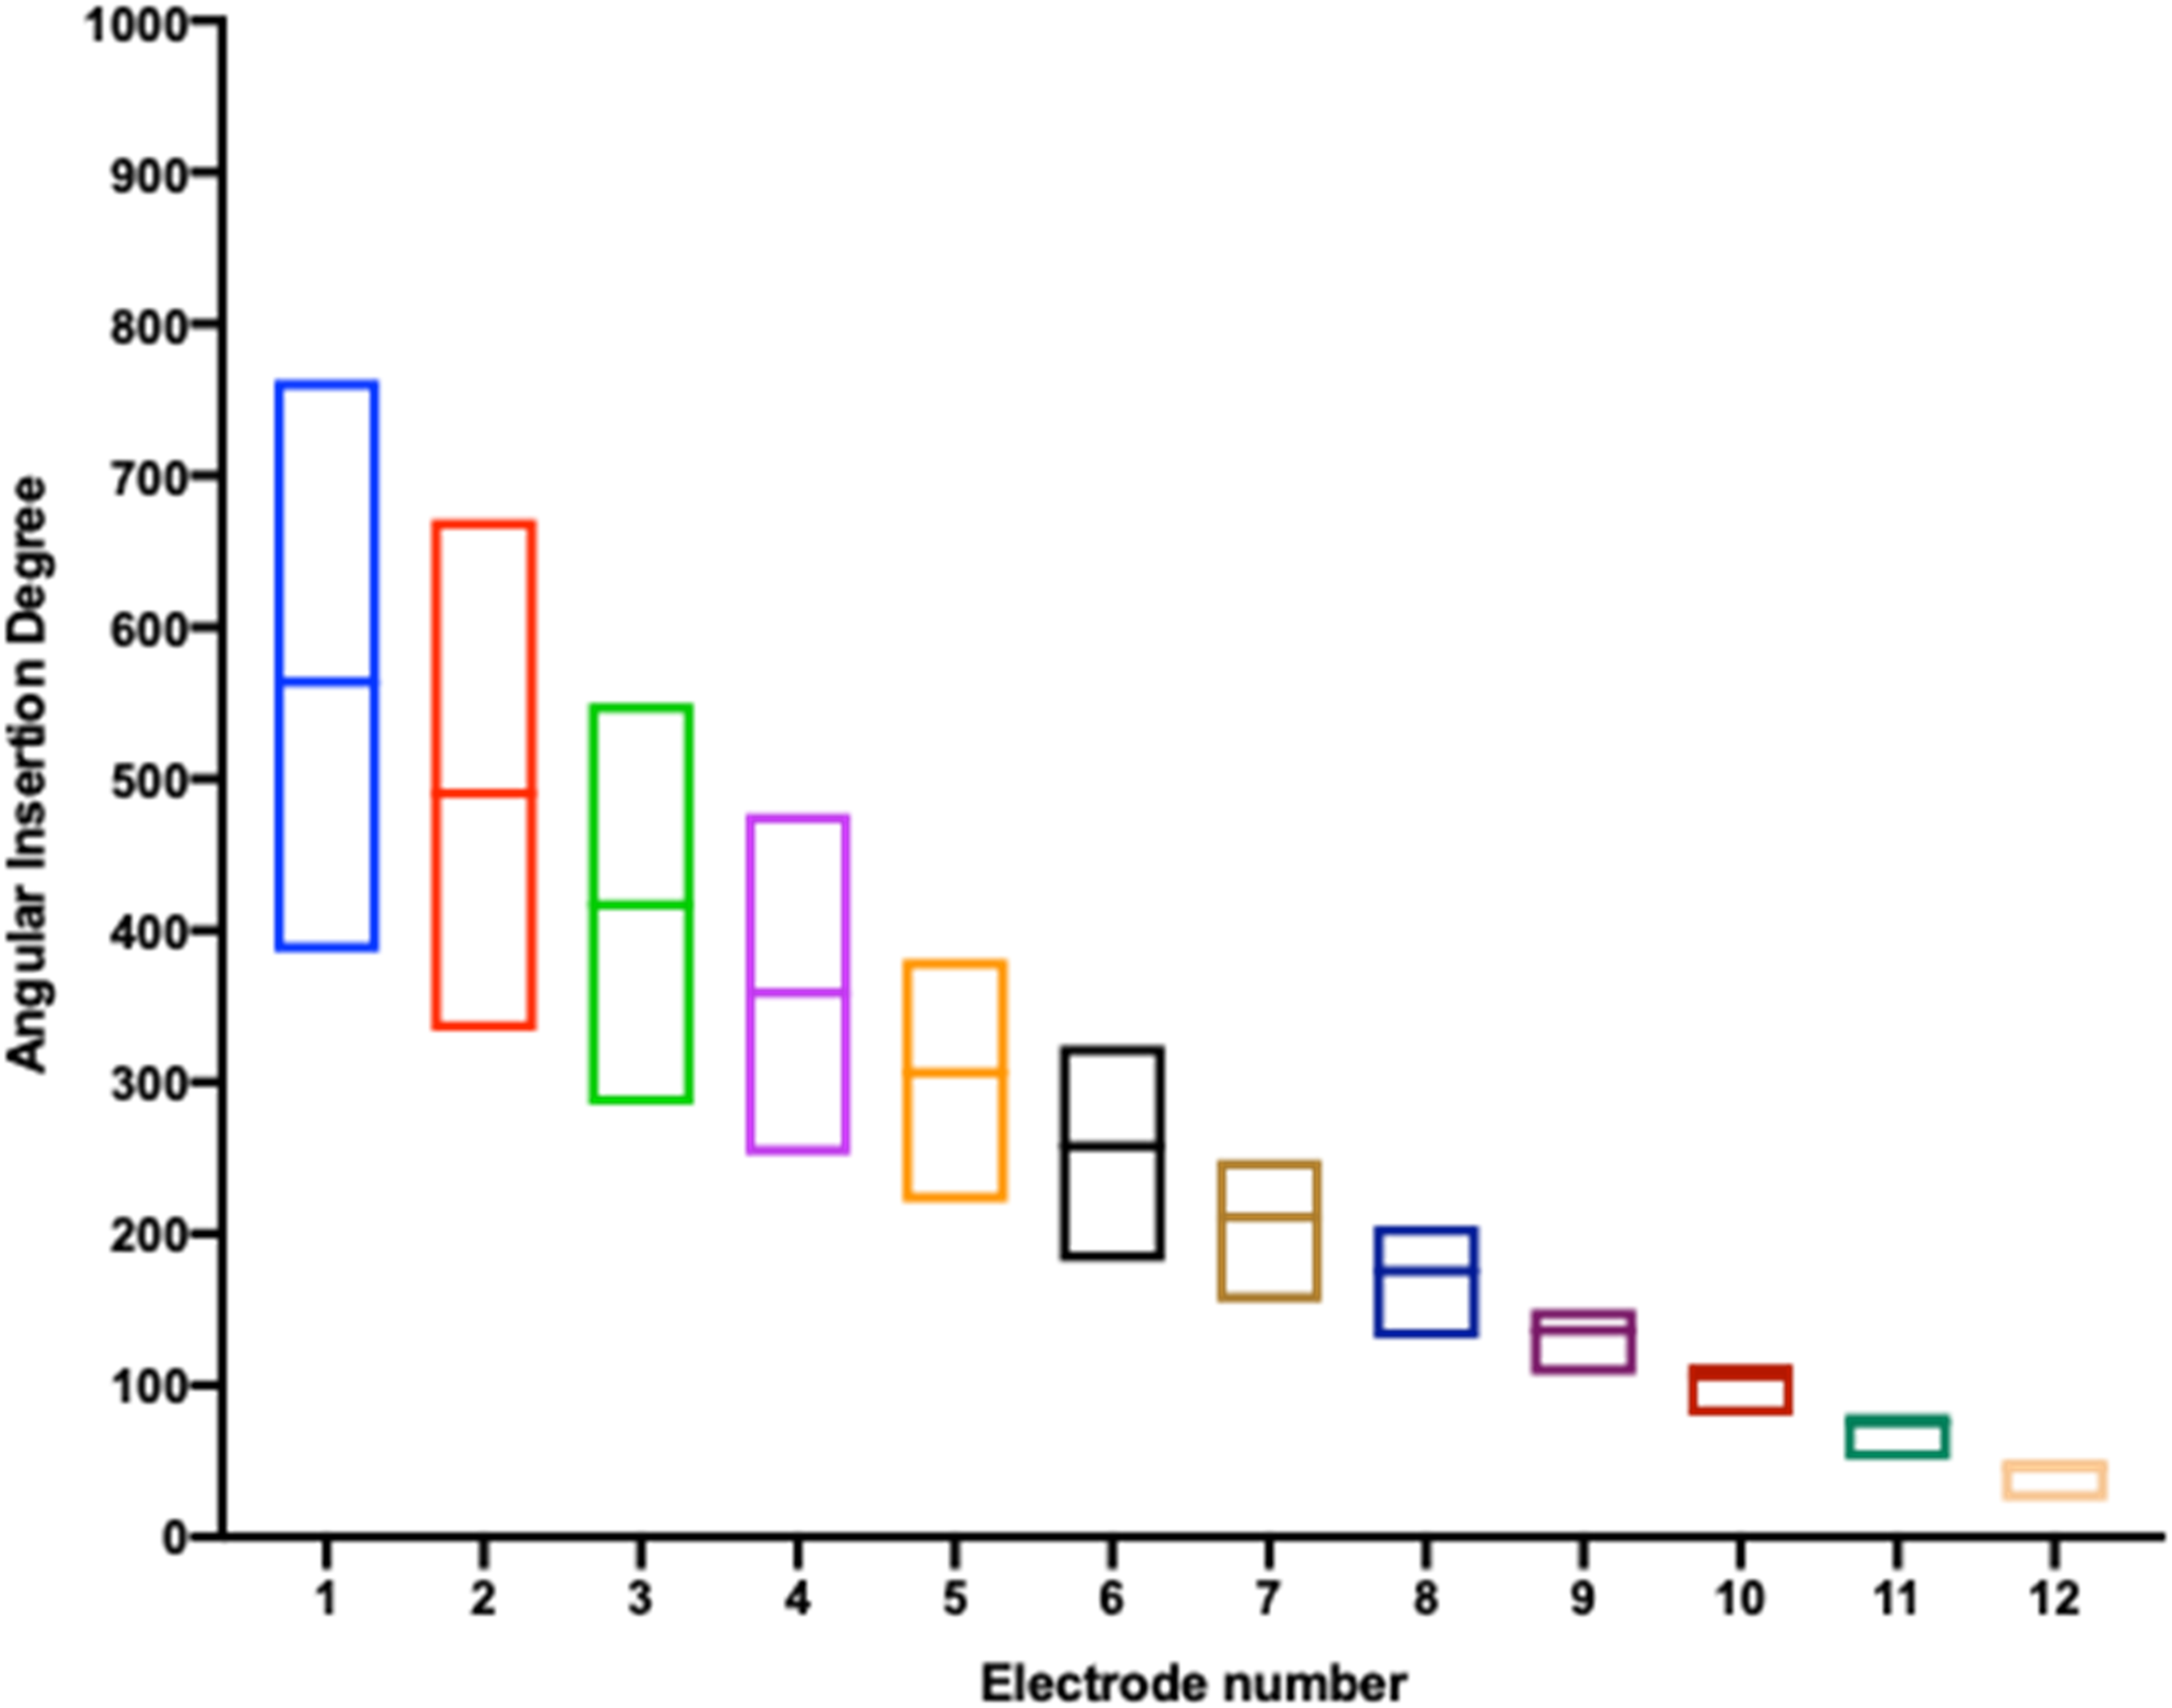
As shown in Figure 3, the correlation matrix among the main cochlear parameters (A, B, and H values) showed a significant positive correlation among: (i) A vs B (P = 0.008); (ii) A vs H (P = 0.018); and (iii) B vs H (P = 0.039). Correlation matrix among the main cochlear parameters (A, B, and H values).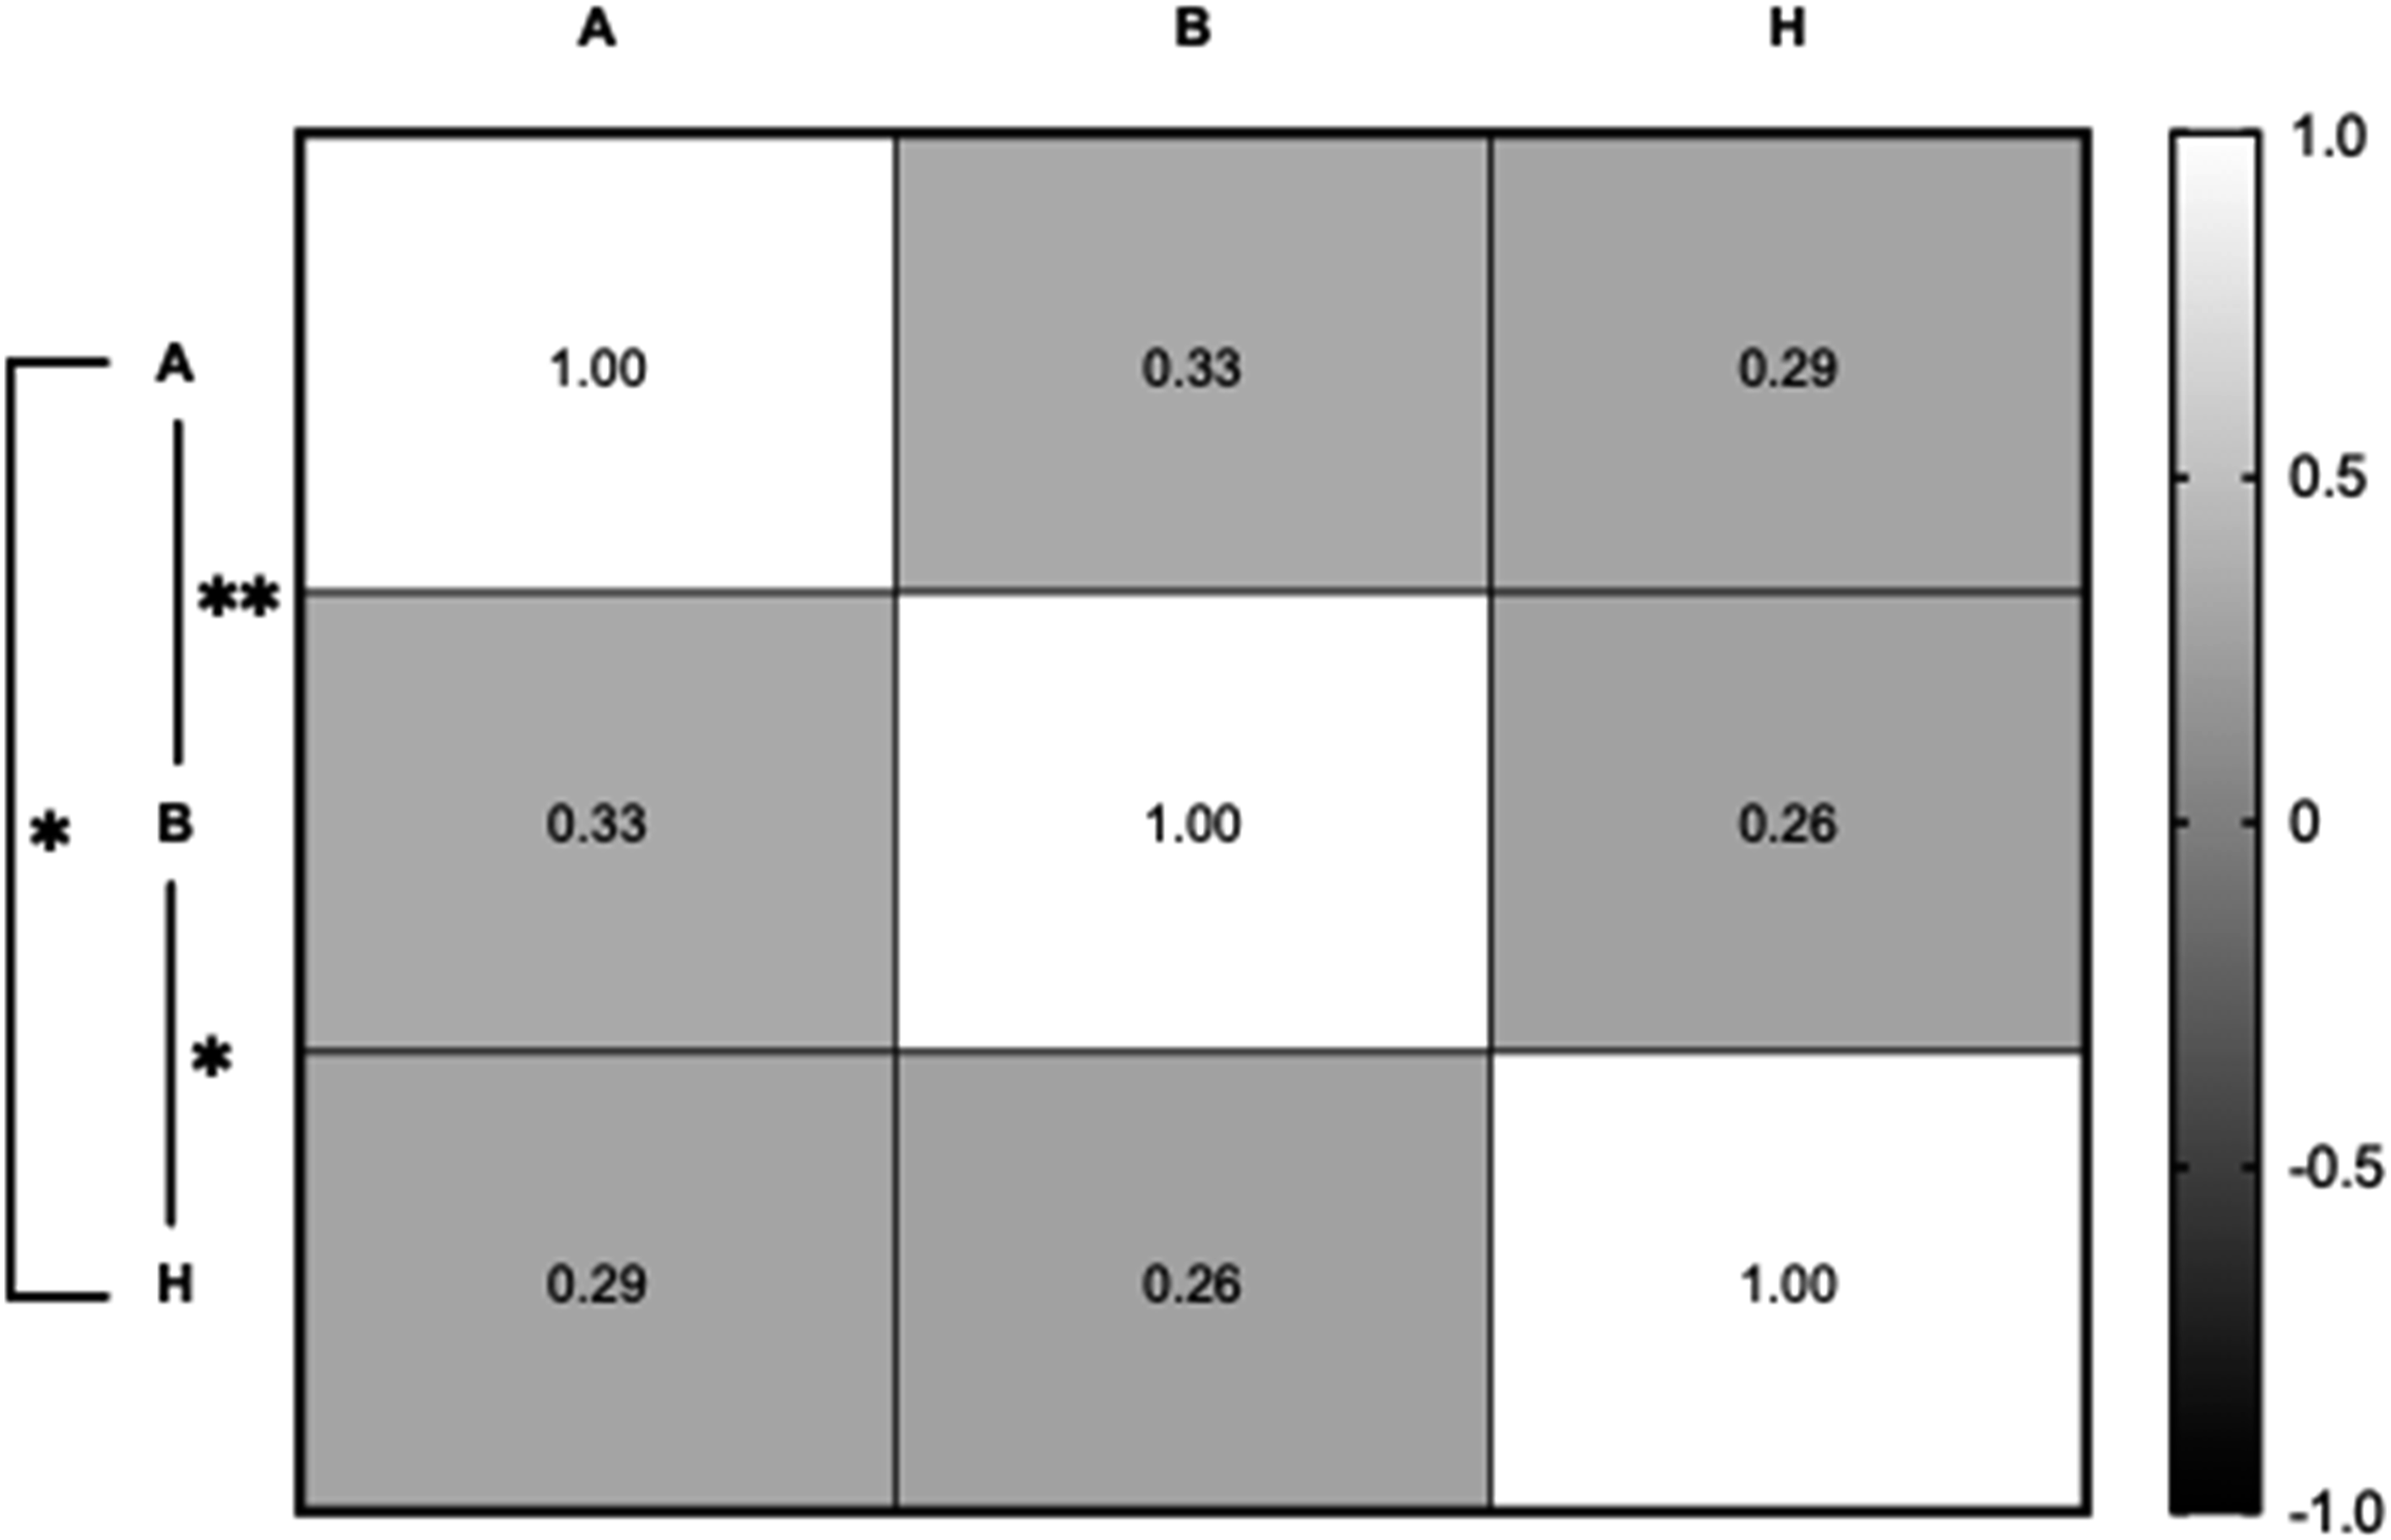
The correlation between cochlear parameters and CDL (Figure 4) showed a significant positive relationship between the A value and CDL (r = 1, P < 0.0001). A significant positive correlation was also found between CDL and B values (r = 0.33, P = 0.008), and similar findings were found while correlating between the CDL and H values with a correlation coefficient of 0.29 and a P-value of 0.018. The correlation between cochlear parameters and CDL.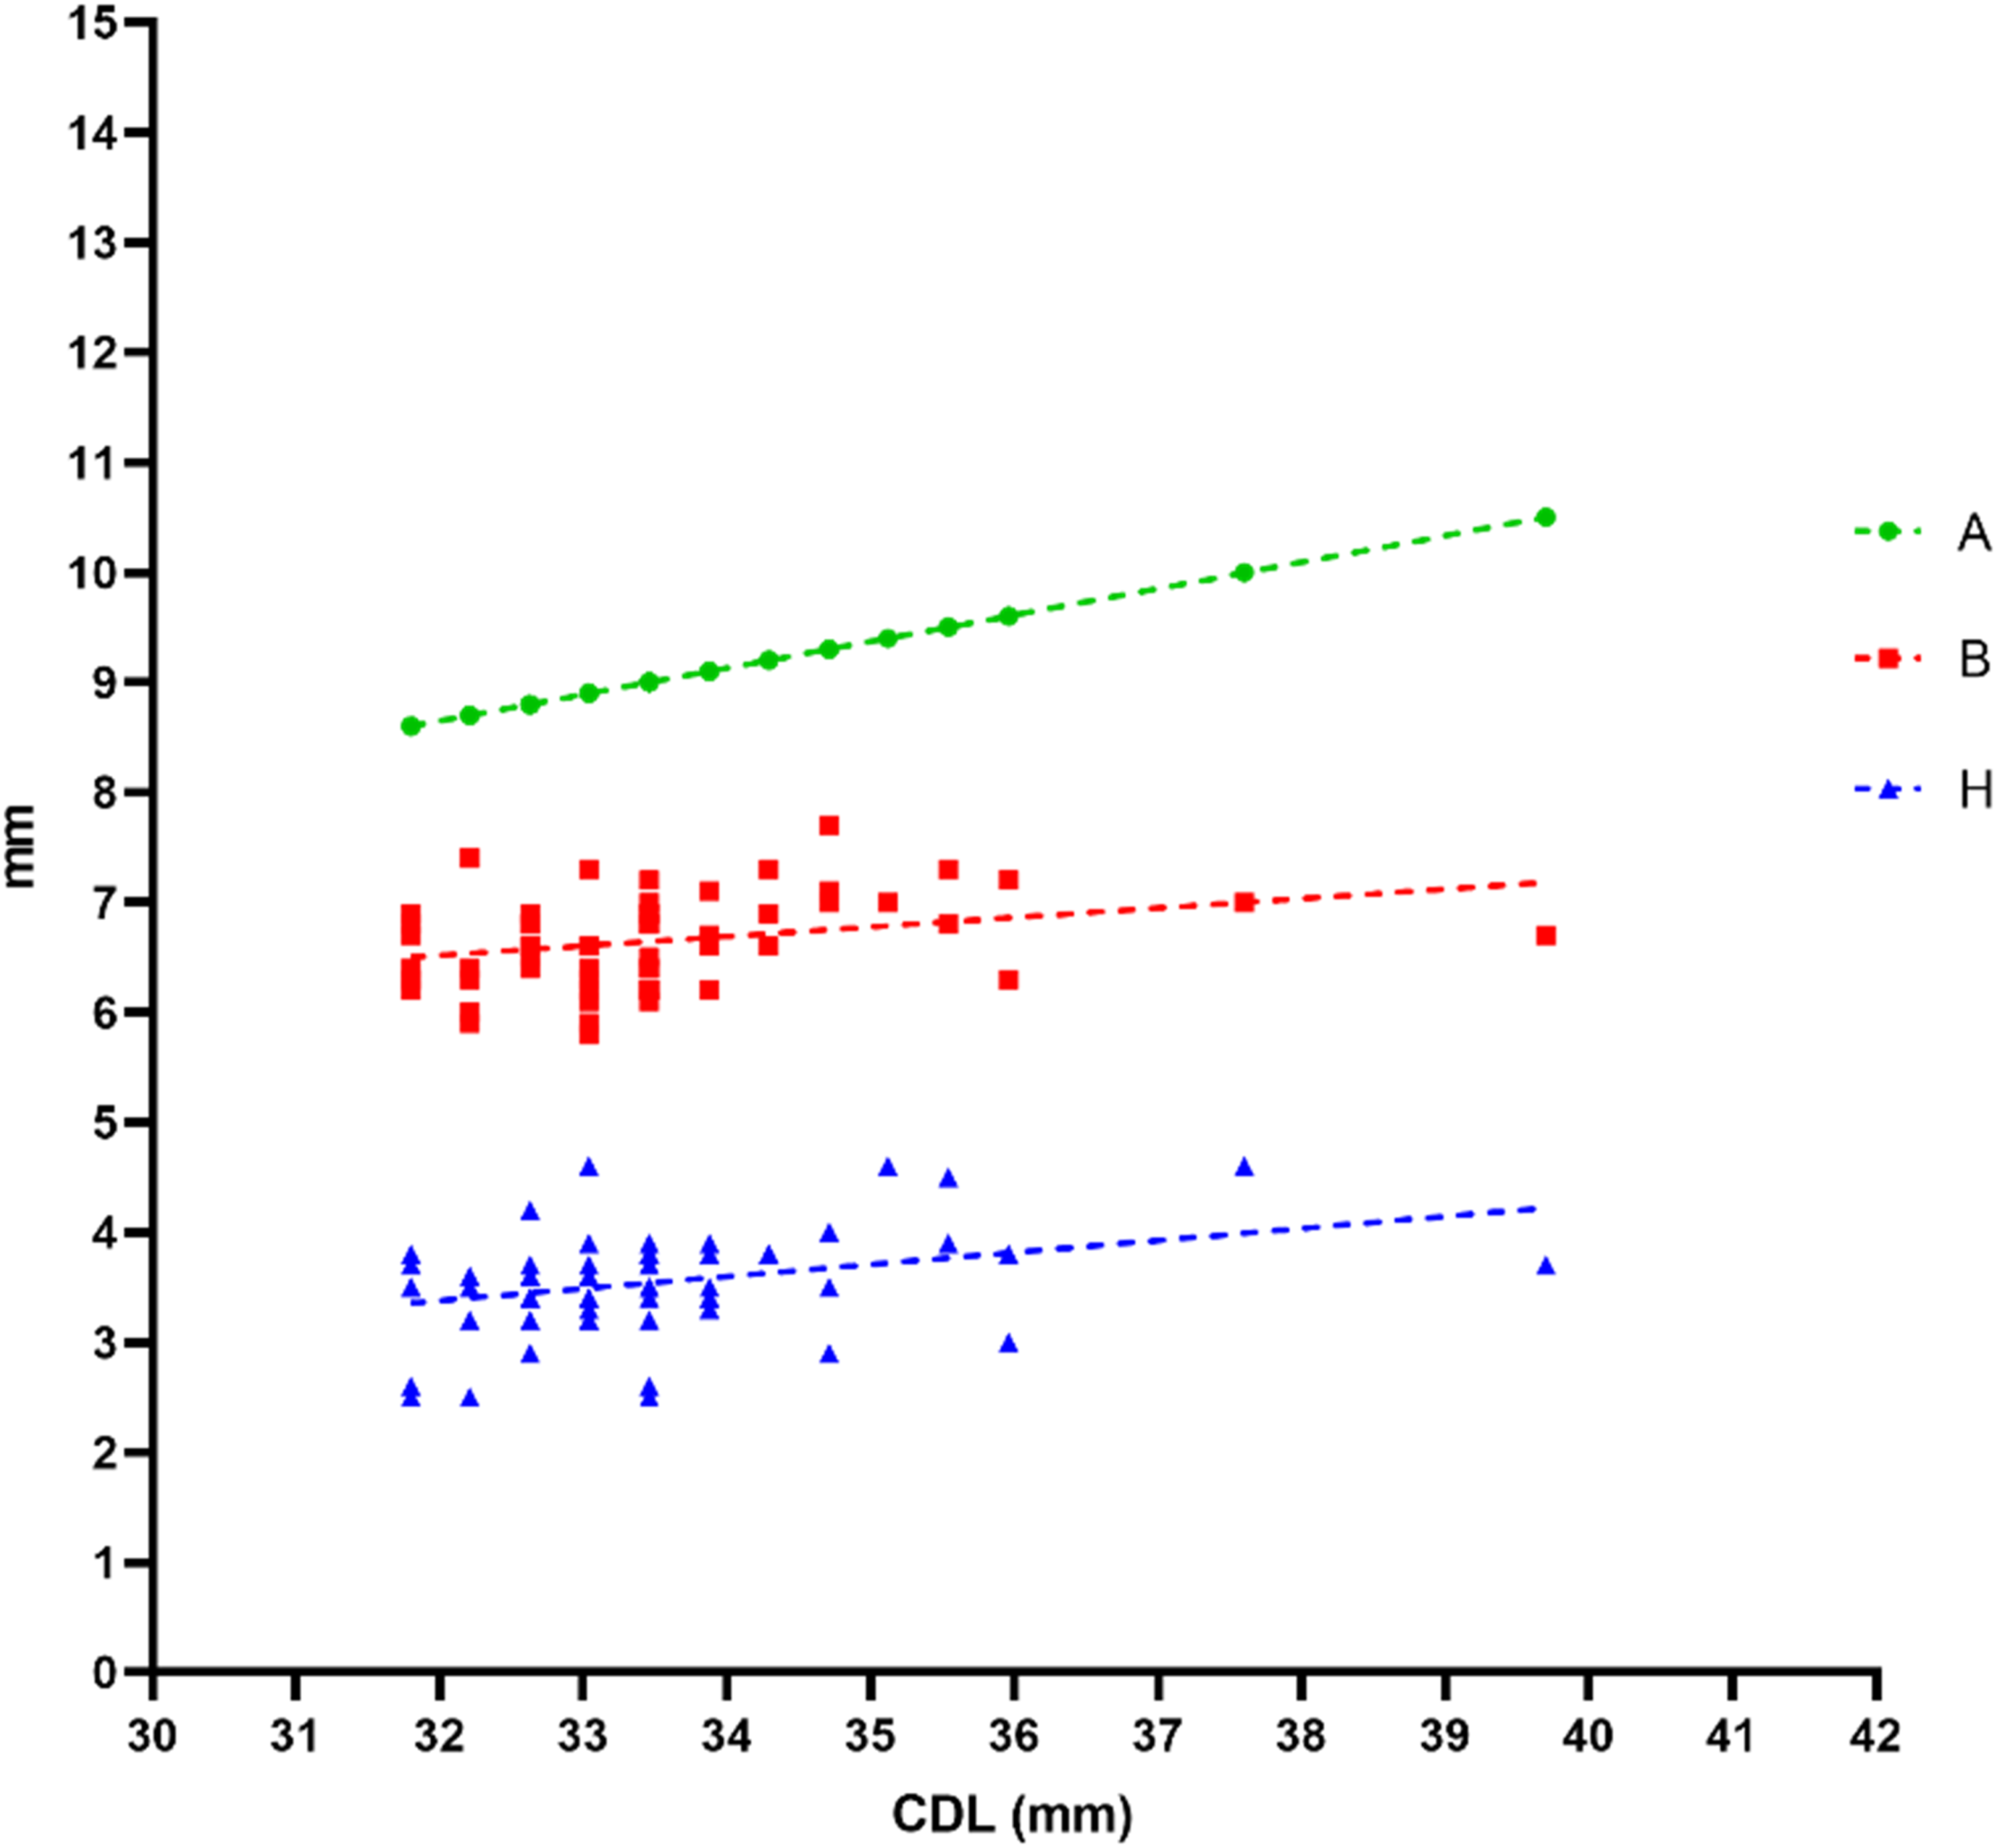
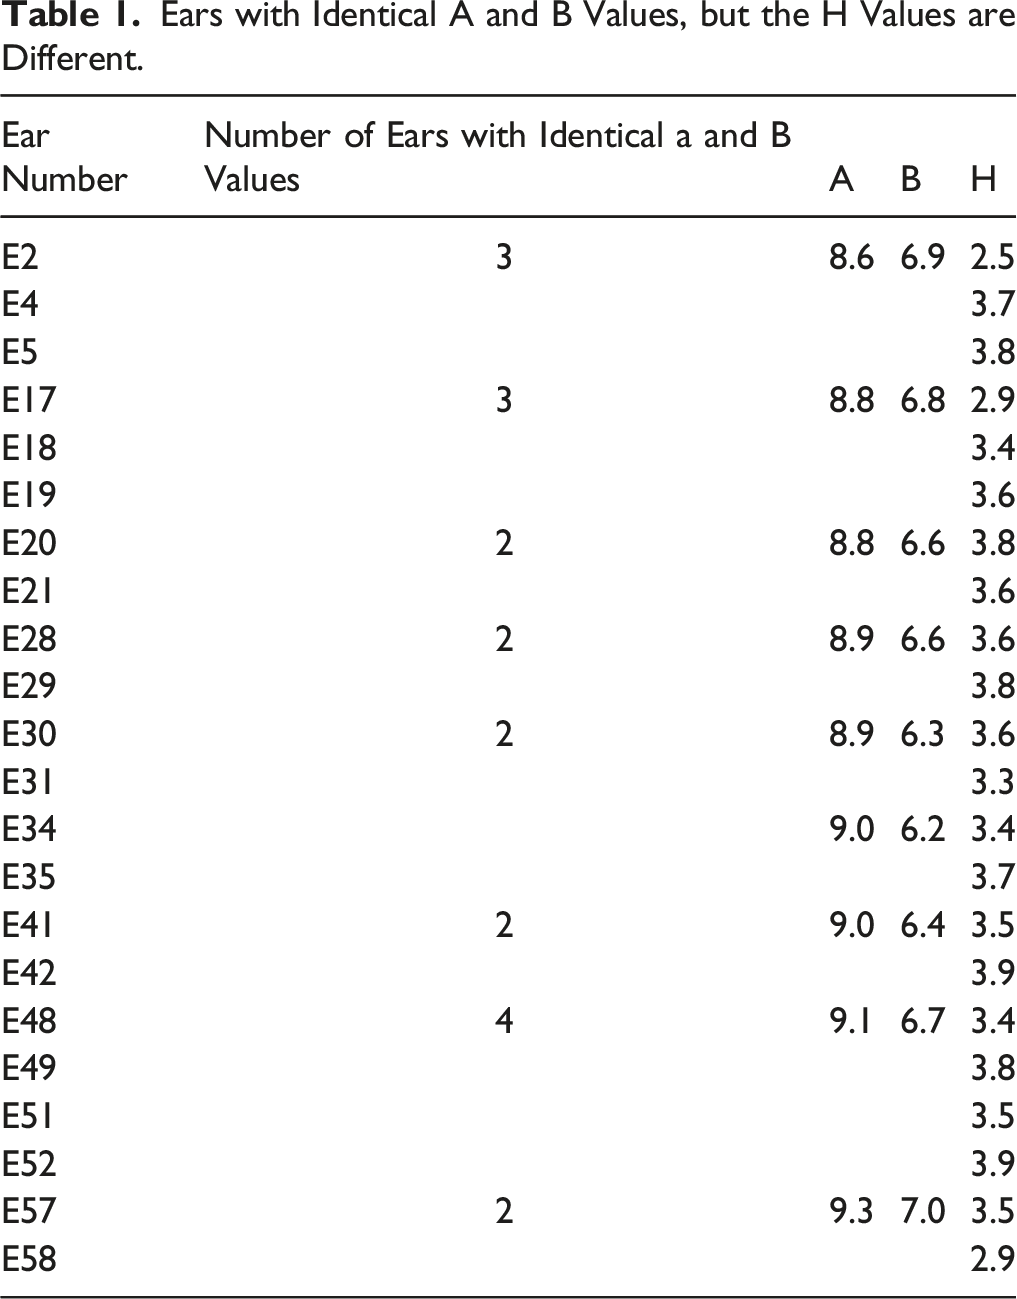
Ears with Identical A and B Values, but the H Values are Different.
The impact of H values on patients' speech outcomes was also evaluated (Figure 5). The results showed a significant positive correlation between H and SIR scores (r = 0.28, P = 0.027). However, there was no significant correlation with the CAP score (r = 0.06, P = 0.62). The impact of H values on patients’ speech outcomes (SIR and CAP).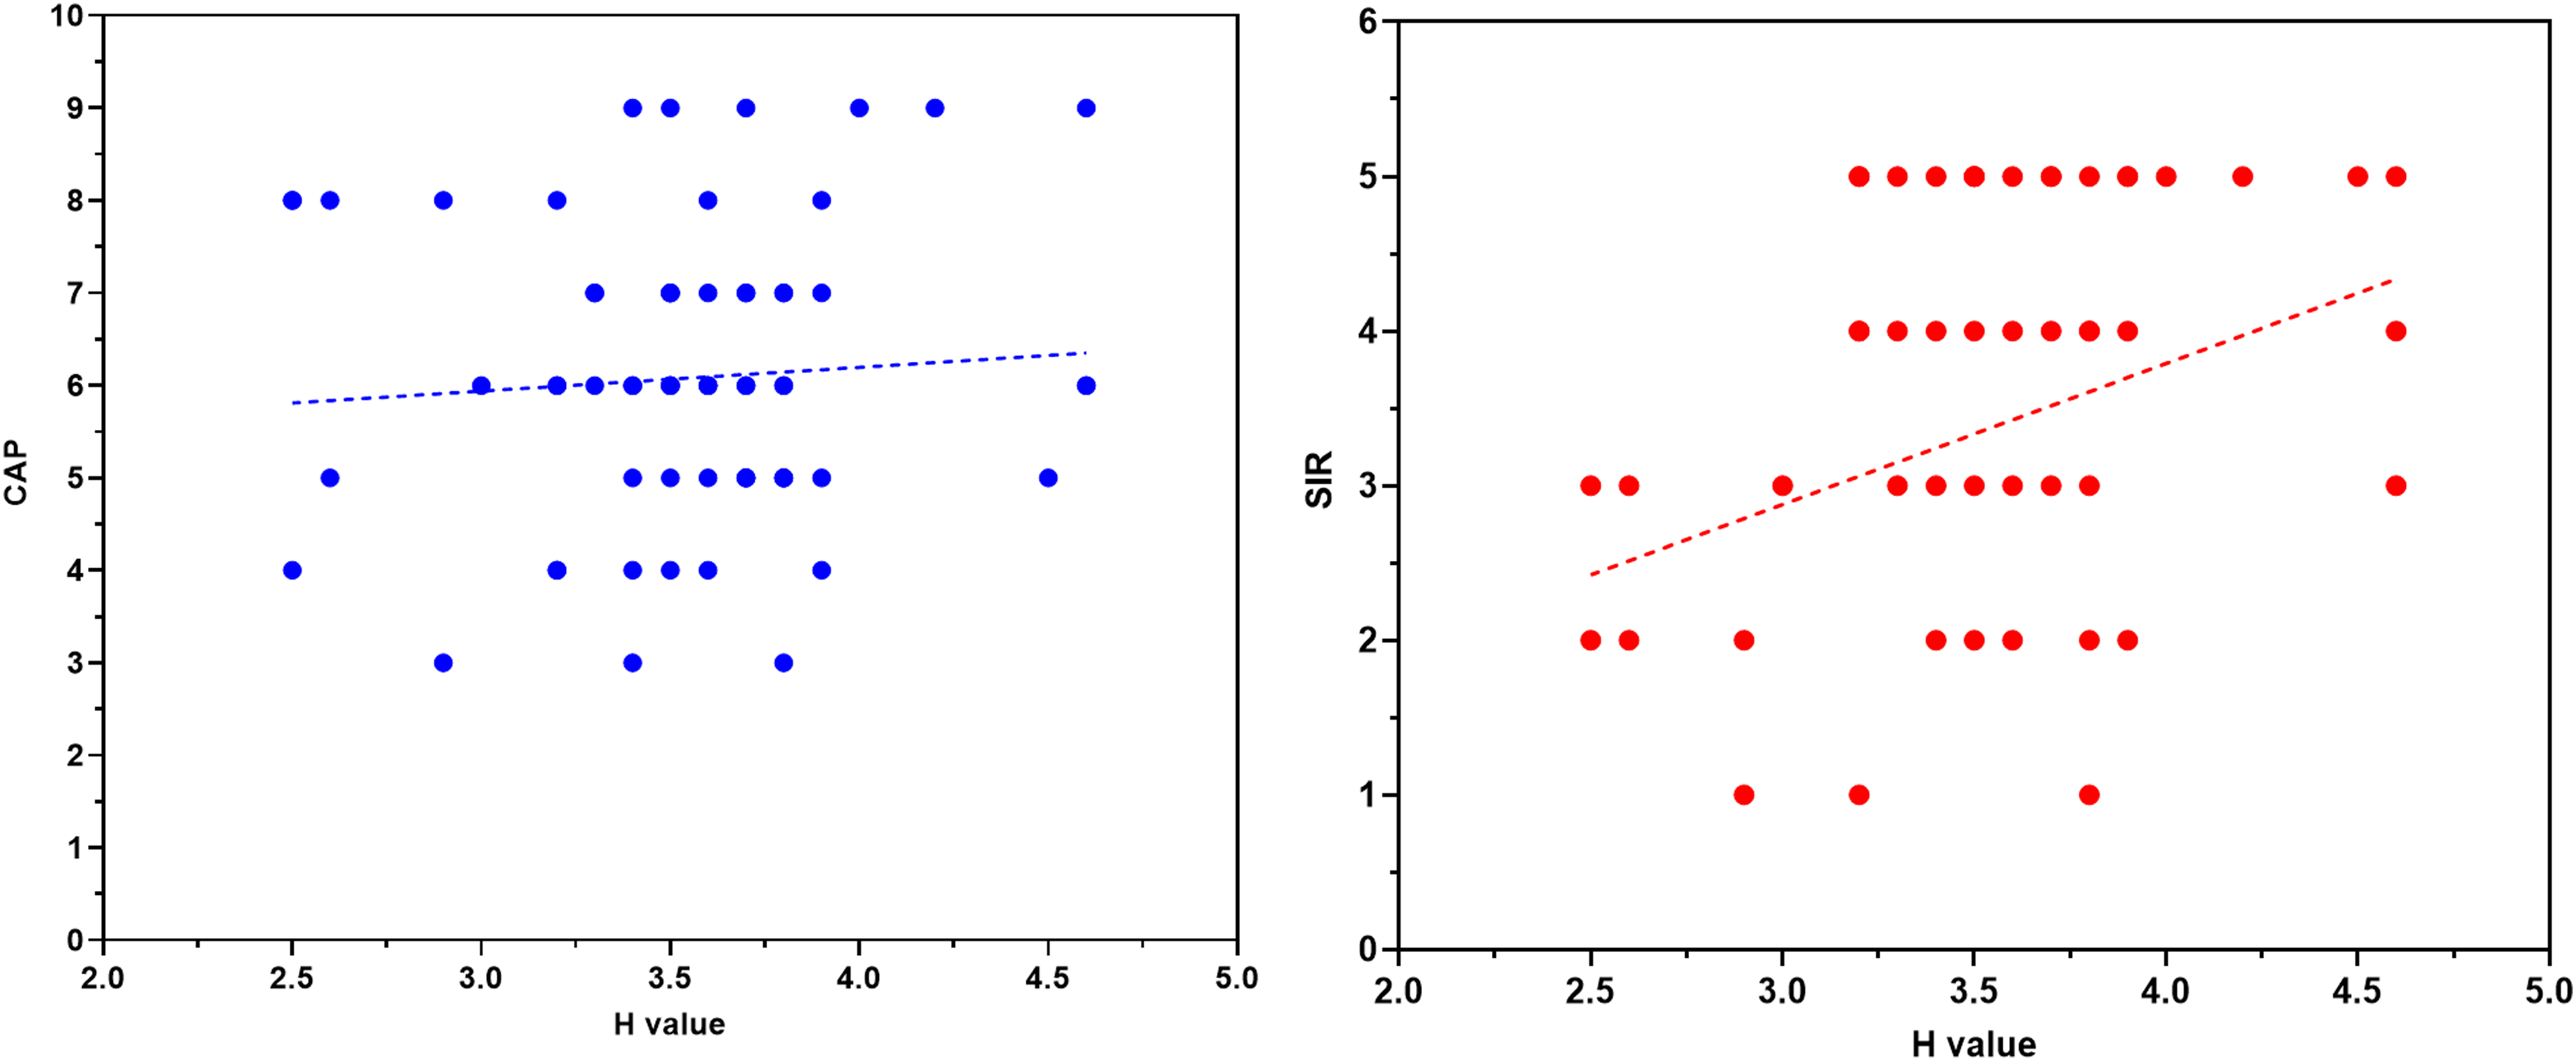
Discussion
This study primarily aimed to investigate the association between different cochlear metrics (A, B, and H values) based on preoperative imaging evaluations. The findings of the current study revealed variations in H values of 22 ears (out of 65 ears) although they have identical CDL, A, and B values; this had not been investigated in previous studies. Although this result could confirm the big anatomical variation in the length and width of the human cochlea which has been reported in many studies, it is worth mentioning that this variation might extend to the cochlear height of some ears even if they have the same length and width whether these ears are from same or different patients. Figure 6 shows the comparison of 3 inner ears with the same A- and B-values but are different in height. Showed the comparison of 3 inner ears with the same A and B values but different H values.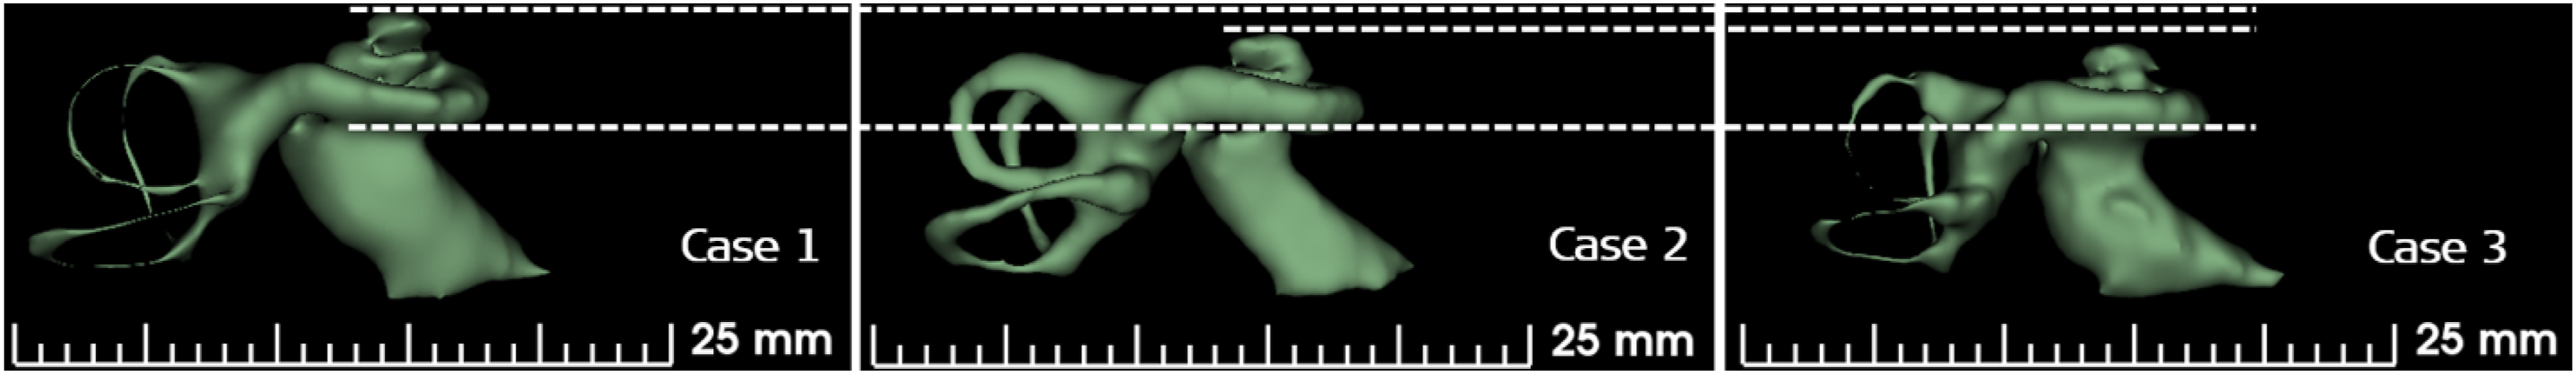
The current study found a significant positive association between A, B, and H values (Figure 2). Furthermore, these findings indicated a high dependency among these 3 factors and their contribution to the geometry of the CDL and hence human cochlea. This result was consistent with the findings of previous studies. For example, Khurayzi et al. 8 reported a significant correlation between A and B values, and then they reported a weak positive correlation between both metrics and H-value.
We used the estimated values from the OTOPLAN calculations, and our results were comparable with the findings of previous investigations.8,10 We also found that CDL was significantly associated with cochlear parameters including A, B, and H values. This was also consistent with the findings of Khurayzi et al, 8 which indicated that both A and B values were significantly associated with CDL. Furthermore, the CDL varies among different studies and populations. For instance, Sato et al. 12 reported that CDL ranged between 32.7 and 43.2 mm in their population. Another study by Meng et al. 13 showed that CDL was remarkably variable among 310 normal cochleae, ranging between 30.7 mm and 42.2 mm. Different factors can remarkably impact cochlear parameters and related measurements, including the ethnic background of patients. For instance, evidence indicates that Saudi Arabian patients have shorter CDL. In a previous comparative investigation, Alanazi et al. 14 showed that Saudi Arabian patients had significantly different CDL than those from other populations.
The analysis of results also revealed that the H-value was significantly correlated with the SIR score but not with the CAP score. We hypothesize that the electrical interaction between different turns of the cochlea at the level of the mid-modiolar trunk would be minimized if the cochlear turns are clearly separated/stacked when visualized in the axial view. This could lead to better hearing outcomes compared to cochleae that are shorter in height in which the electrical interactions between the different turns of the cochlea are believed to be high.
Moreover, clinicians should consider interpreting the H values of their patients regardless of their A and B values. For example, in this study, we found that cochlear height may vary in different patients even if they have identical A and B values. Unfortunately, few studies have reported the mean H values of their populations. For instance, Meng et al. 13 reported that their mean H-value was 3.59 (.12) mm, while Avci et al. 10 estimated a mean H-value of 4.4 mm for their population. Moreover, Khurayzi et al. 8 reported a mean H-value of 2.71 mm, which was remarkably shorter than the abovementioned values.
We also found no significant variation in the insertion angles of the electrode contacts among the included patients, as all of them were implanted with electrode arrays covering more than 70% of the cochlea. Previous reports have indicated a significant association between angular insertion depth and postoperative hearing outcomes. In this context, studies have shown that favorable hearing outcomes are associated with greater insertion depth. In contrast, Van der Marel et al. 15 showed that speech perception was not associated with depth of insertion. Moreover, a negative correlation was reported by Finely et al. 16 Such differences may be attributed to population demographics and baseline characteristics. For instance, previous reports have shown that improved postoperative outcomes are associated with younger ages.16,17 Therefore, further studies with better randomization of patients are needed to validate the current evidence.
One important point in this study was that variations in cochlear height may require further study and investigation. This could open a new era for the accurate calculation of the CDL and may call for a new notion in the design of electrode arrays. It is also important to determine whether the high cochlea may require more and different forms of stimulation to make sure to stimulate a large percentage of spiral ganglion cell bodies. Another finding was the variation in H values among patients with the same A and B values.
The use of a device from a single manufacturer is one of this study’s limitations; this was due to the compatibility between the utilized surgical planning software and the CI devices. The limited available language-adapted speech tests also limited the ability to study and generalize the impact of H value on patients' performance. Therefore, further studies with more tests are required to study this impact.
Conclusion
This study showed a variation in H-values among the CI recipients; it also showed different H-values among the patients who had similar CDL. Furthermore, there was a significant positive association between the three main cochlear parameters A, B, and H values. We also found a significant correlation between these parameters and the CDL. The H-value had a significant relationship with the speech outcomes of the included patients. Further studies are recommended on this parameter (H-value) to confirm its importance in computing the CDL and its influence on hearing outcomes.
Footnotes
Declaration of Conflicting Interests
The author(s) declared that they have no potential conflicts of interest with respect to the research, authorship, and/or publication of this article.
Funding
The author(s) received no financial support for the research, authorship, and/or publication of this article.