
Abstract
Objectives
To study the changes in the coiled configuration of electrode excess lead in the mastoid cavity in the cochlear implant recipients over time.
Methods
Post-operative CT scans at two different appointments of fourteen patients with cochlear implants (CI) were retrospectively analyzed using a DICOM viewer software (3D-slicer). Mastoid thickness (MT) was measured in the oblique coronal plane from the round window (RW) entrance to the mastoid edge and inter-cochlear distance (ICD) was measured in the axial plane at the fundus level between two ears. 3D segmentation of the entire inner ear of both sides and coiled electrode excess lead was performed to visually compare the changes in coiled configuration between the two CT scan time points.
Result
MT and ICD increased logarithmically with the patient’s age, as has been measured from both the 1st and the 2nd CT scans and a weak linear correlation between MT and ICD was observed. Growth in MT and ICT measured between the time of 1st and 2nd CT scans showed a strong linear correlation. In eight cases, changes in the electrode excess lead have been observed in the 2nd CT scan, either a change in the coiling configuration of electrode excess lead or shifted laterally toward the mastoid edge. The ICD growth between the 1st and the 2nd CT scans was >2 mm in only seven cases and all of them were children. All other six cases had no observed changes in the coiled electrode lead. In addition, the mastoid growth between the 1st and the 2nd CT scan was >2.5 mm in only 4 cases.
Conclusion
Coiled configuration of electrode excess lead could change when the MT and ICD increased over time.
Introduction
Cochlear Implant (CI) is now a matured technology after more than thirty years of continuous research and development efforts between the CI companies and the clinicians worldwide. 1 As early as 6 months of age, children with hard of hearing are now considered for CI surgery in restoring hearing and to assist them in their language development skills. 2 The CI electrode array is surgically placed inside the scala tympani (ST) and the electrode excess lead is coiled in the drilled mastoid cavity which is expected to relax accommodating to the natural growth in the mastoid over time. A study on mastoid growth over time reported exponential growth in the mastoid thickness (MT) and skull width up to 16–18 years of age. 3
In general, the electrode excess lead is coiled/looped in the mastoid drilled cavity, and it is expected to change its configuration to accommodate the growth in the MT. This change in configuration might lead to the electrode array migration out of the cochlea. The intra-cochlear electrode array migration is one of the well-reported complications in the cochlear implantation field. However, the reasons that lead to this complication still untapped well. 4
With this background information, the primary aim of the current study was to report the growth in both mastoid thickness and inter-cochlear distance over time. The secondary aim was to study the effect of this growth on the CI coiled electrode lead from a three-dimensional (3D) perspective from the post-operative computer tomography (CT) images. Studying and reporting these changes would provide the CI field with a good understanding of how the relaxation happens to the coiled electrode excess lead in the mastoid drilled cavity over time.
Methods
Participants
This retrospective study was approved by the institutional review board (No. E-20-5387). We collected data from medical reports of all the CI patients with the inclusion criteria of having post-operative CT images of the temporal bone at two different time points in our tertiary center due to different reasons, such as high electrode impedance, poor performance, and non-otological indications of head CT scan. We excluded all patients who underwent revision surgeries in the mastoid field for any reason and done after the first post-operative CT scan, patients whose CT scans with poor image resolution, patients with head trauma, and any cases with intra-cochlear fibrosis or ossification.
Imaging and Measurements
A three-dimensional (3D) slicer (https://www.slicer.org/) was used to review the CT scans. The complete inner ear along with the inserted CI electrode (array + excess lead) was 3D segmented following the steps previously described. 5 From the 3D images, the coiled configuration of the excess electrode lead was visually compared between the two post-operative time points in the axial view.
The inner ear was identified in the oblique coronal view/cochlear view as proposed by Xu et al.
6
from the CT scans. From the cochlear view in the oblique coronal plane, the mastoid thickness (MT) was measured as a straight line starting from the round window (RW) entrance to the edge of the mastoid edge as previously reported and as shown in Figure 1A.
3
The MT measurement is in-line with the cochlear basal turn diameter or also called as A-value clinically as shown by the white dashed line. In the axial plane and viewing the cochlea in its mid-modiolar section, the inter-cochlear distance (ICD) was measured at the level of fundus between the two side cochleae as previously described by Mori et al and as shown in Figure 1B.
7
Mastoid thickness (MT) is captured as a linear measurement (white line) in the coronal view from the cochlear entrance to the skull surface, which is in line with the cochlear basal turn diameter or also called as A-value as shown by a white dashed line (a). The inter-cochlear distance (ICD) is measured at the fundus level between the two ears in the axial view (b).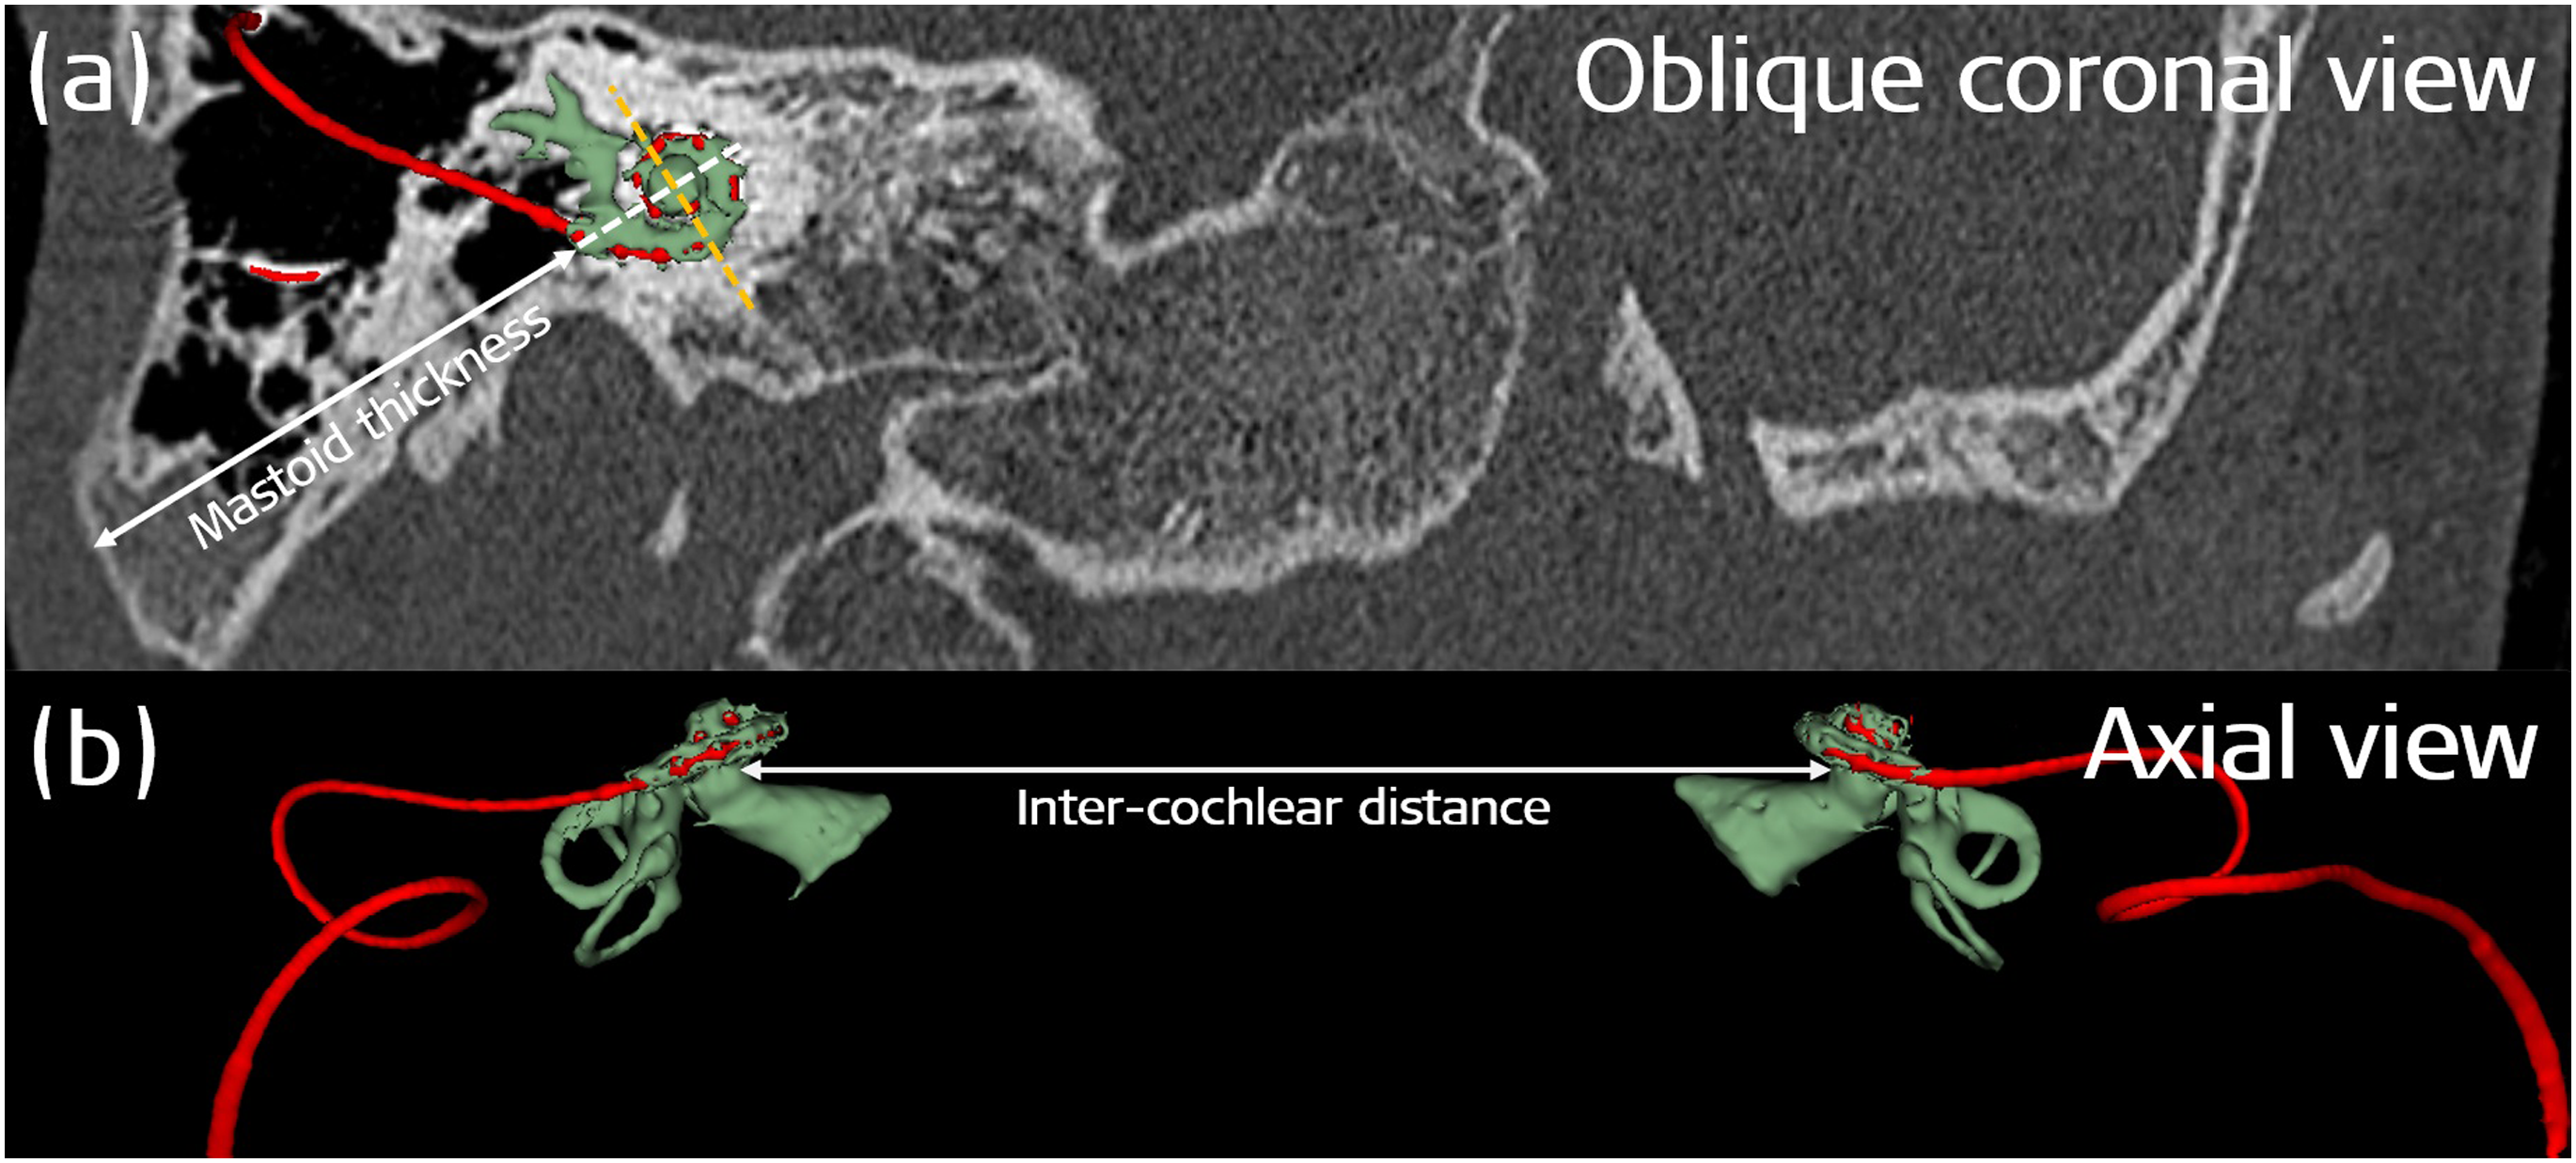
Data Collection and Analysis
Microsoft Excel (http://products.office.com/en-us/excel) was used for data collection, visualization, and plotting the graphs. The regression analysis (R2) was performed to find the goodness of fit of the data point on the regression line. Patients’ information was saved in an encrypted and anonymized form.
Results
Patients Demographics
General Information on the Age at 1st and 2nd CT Imaging and on the Visualization of the Excess Electrode Lead.
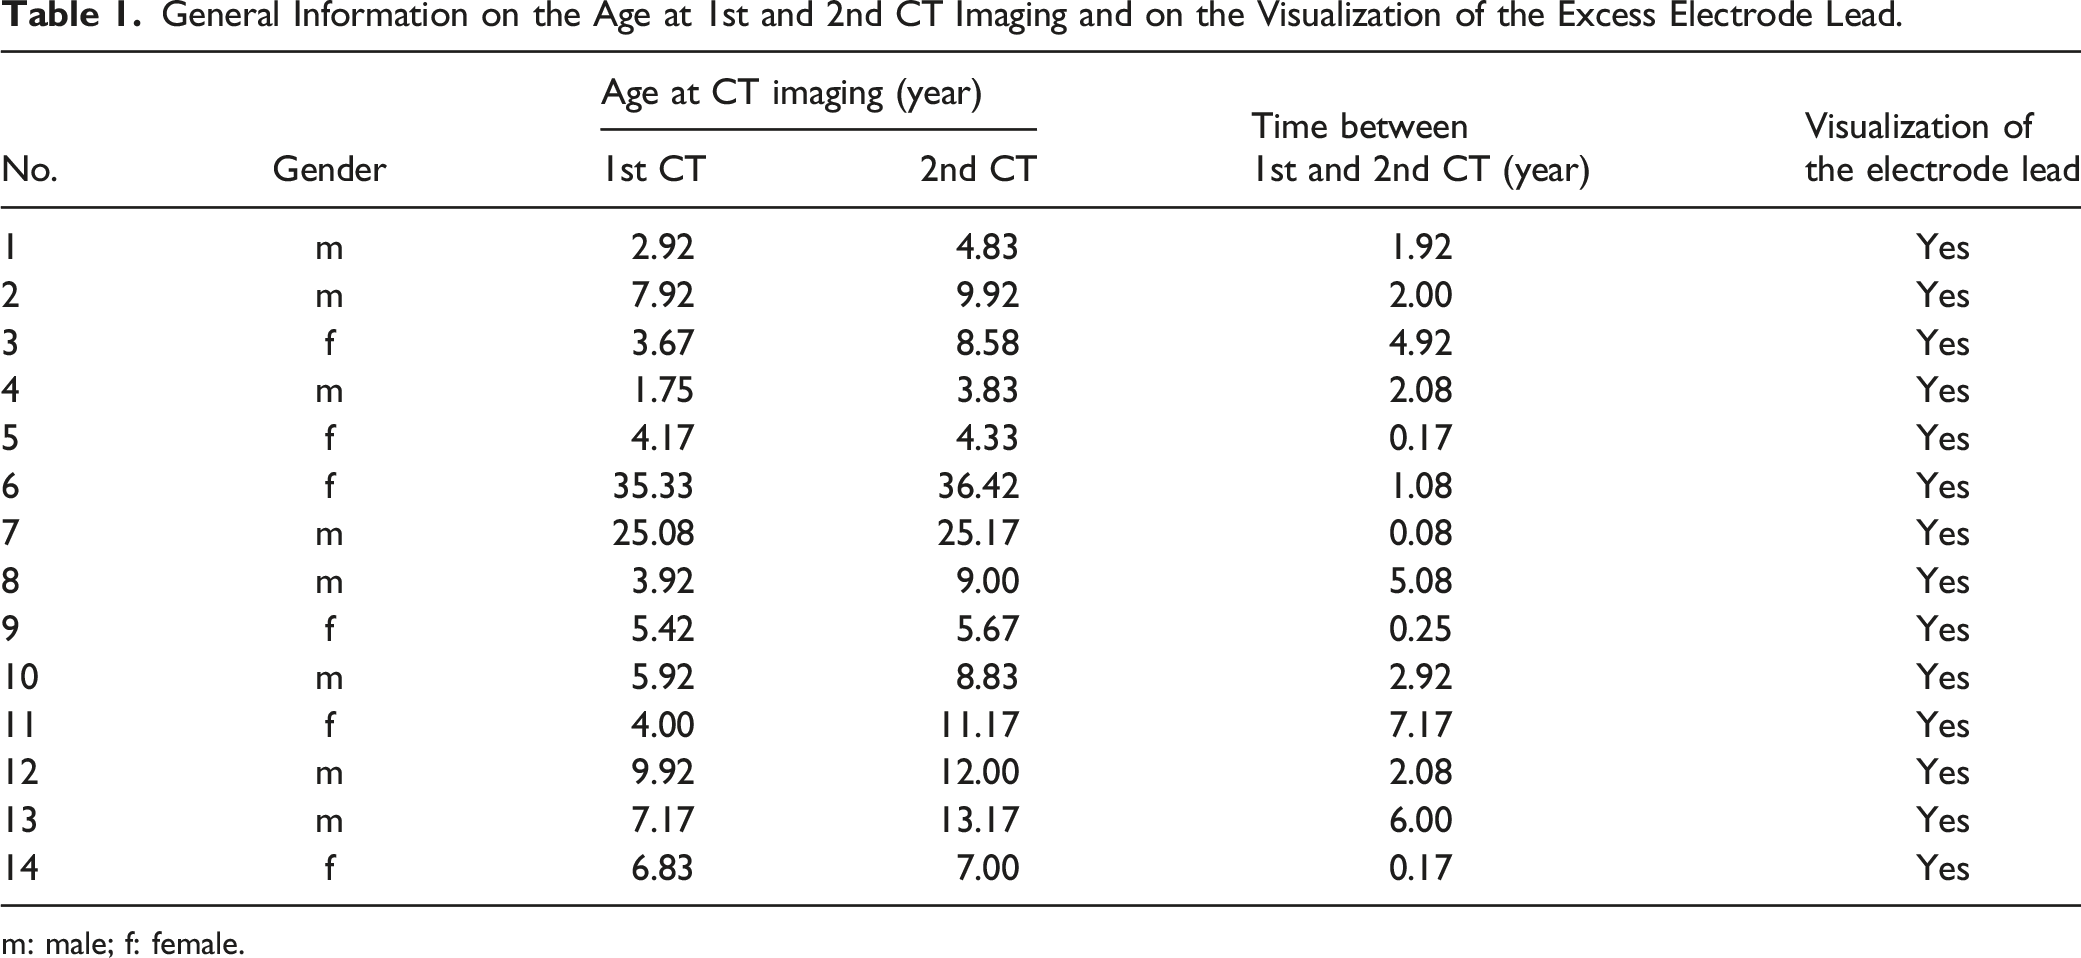
m: male; f: female.
Mastoid Thickness and Inter-Cochlear Distance
Mastoid Thickness and Inter-Cochlear Distance Were Measured From the Post-Operative CT Images Taken at two Different Time Points.
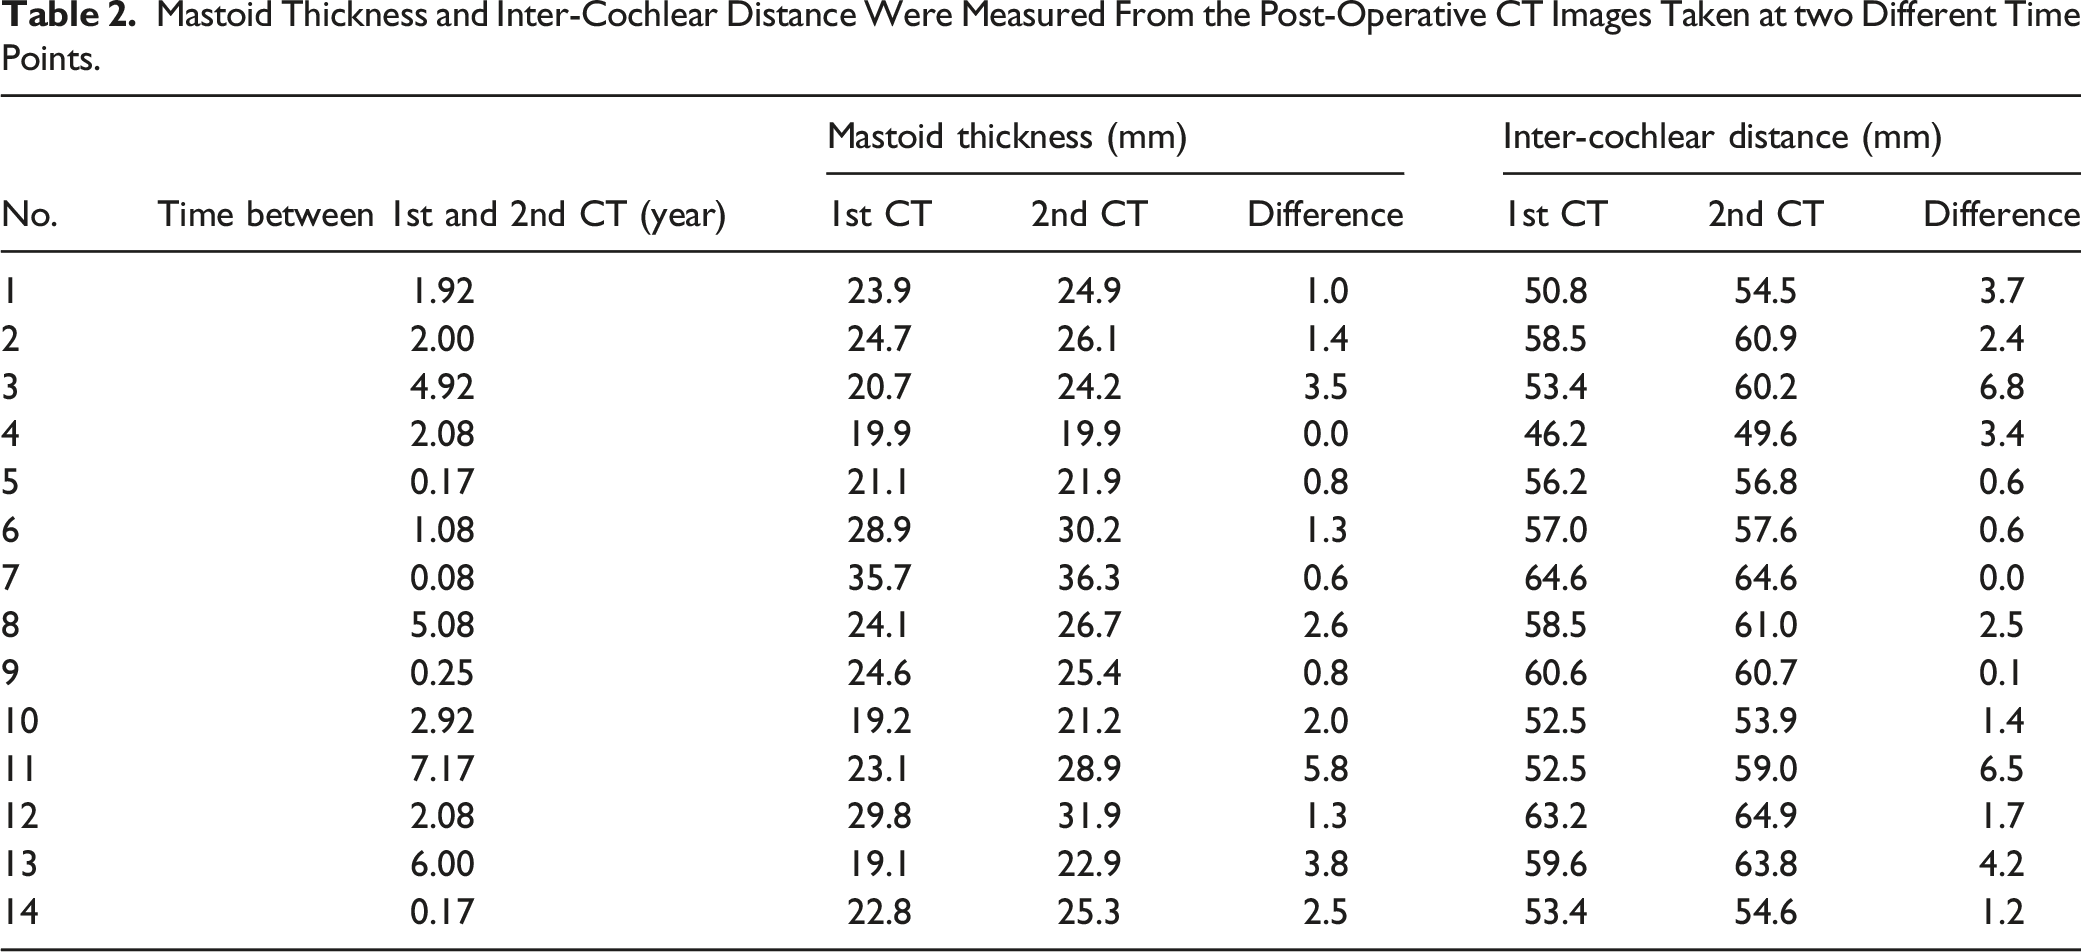
Both the MT (R2 = 0.5) and the ICD (R2 = 0.55) increased logarithmically with the age of the patient as measured from the first CT scan as shown in Figure 2A. Measured from both the 1st (R2 = 0.37; black data points) and the 2nd (R2 = 0.36; red data points) CT scans, a weak linear correlation between the MT and ICD was observed as shown in Figure 2B. The growth in MT and ICD measured between the time of 1st and the 2nd CT scans showed a strong linear correlation with R2 values of 0.74 and 0.66, respectively, as shown in Figure 2C. Figure 2D shows a weak positive linear correlation (R2 = 0.42) between an increase in MT and ICD as captured by the difference in measurements from the 2nd and the 1st CT scans. Growth in MT (black dots) and ICD (black circle) plotted against the age of the patient as measured from the first CT scan and (A). MT plotted against the ICD measured from both the first (triangle) and the second (filled diamond) CT scan (B). An increase in the growth of MT and ICD was measured between the time points of the first and the second CT scans (C). An increase in MT plotted against the increase in ICD (D). An increase in MT and ICD as calculated from the difference between the measurements taken at 1st and 2nd CT scans.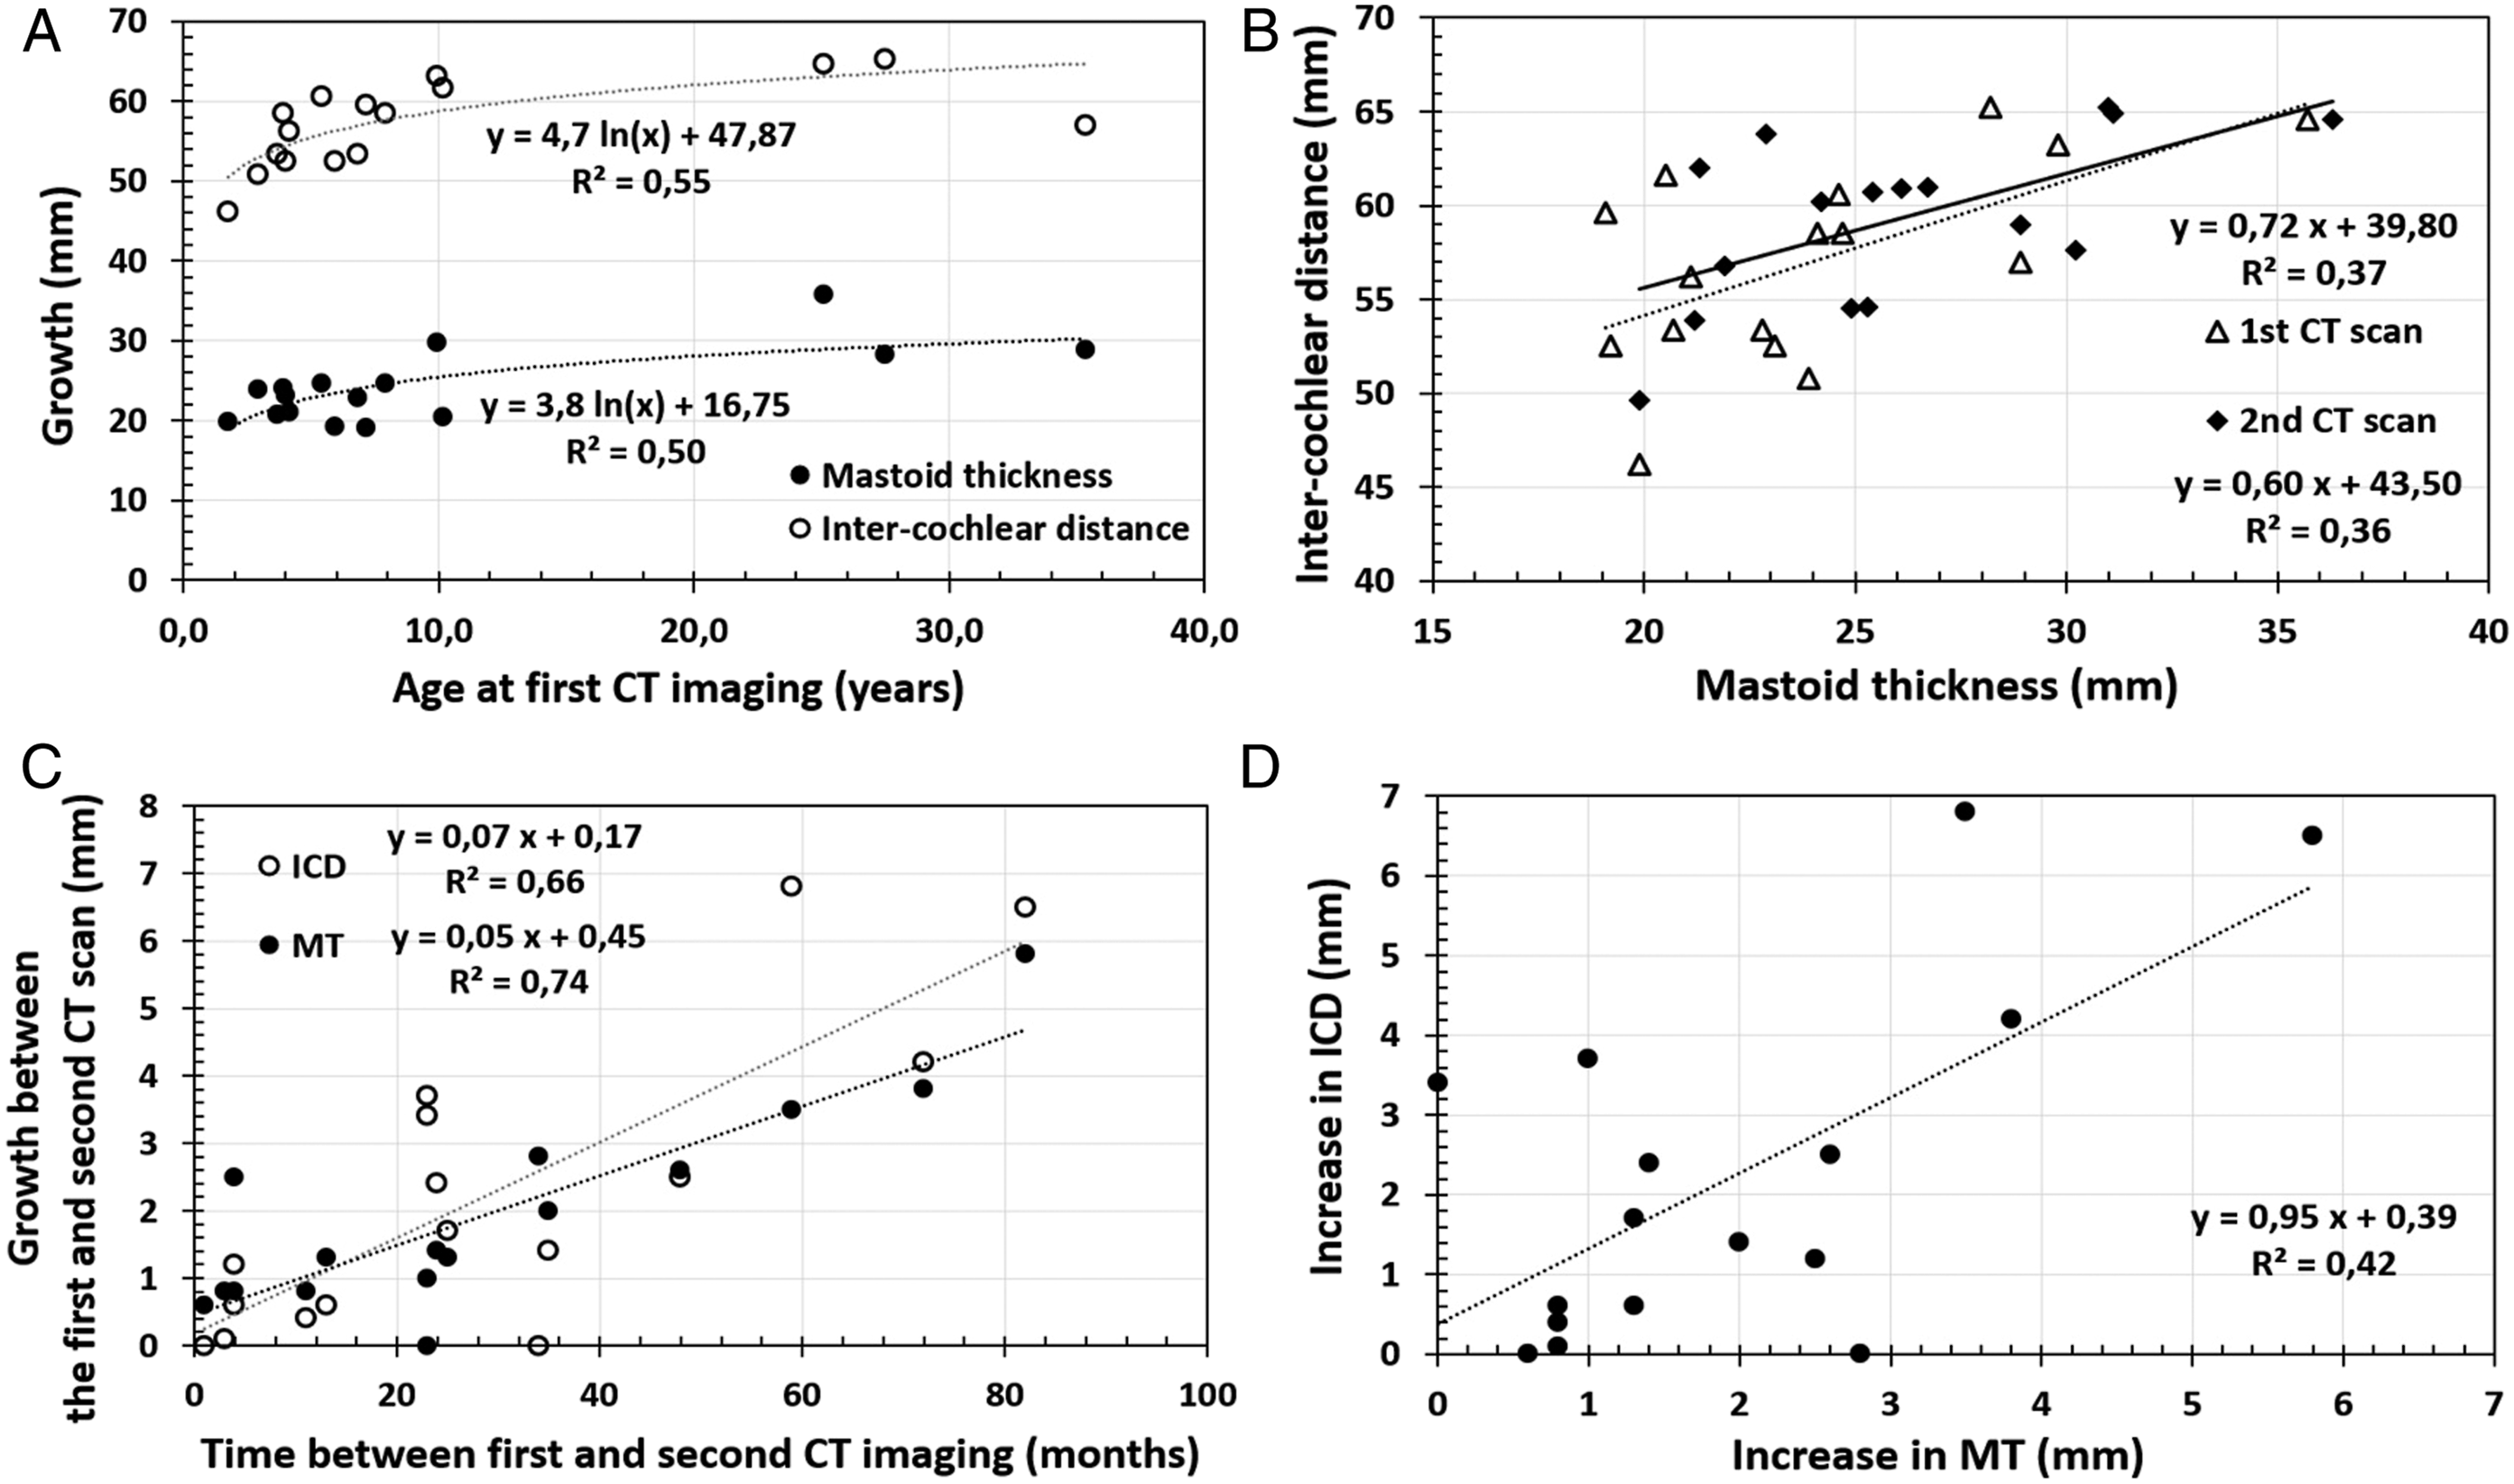
From all the 14 cases analyzed in the cochlear view, we did not find a single case with any degree of electrode array migration out of the cochlea.
Electrode Excess Lead Coiled Configuration in the Mastoid Cavity
Time Between the 1st and the 2nd CT Scans, MT, ICD Growth Between the 1st and 2nd CT Scan and Observation on the Electrode Excess Lead Coiled Configuration in the Mastoid Cavity.
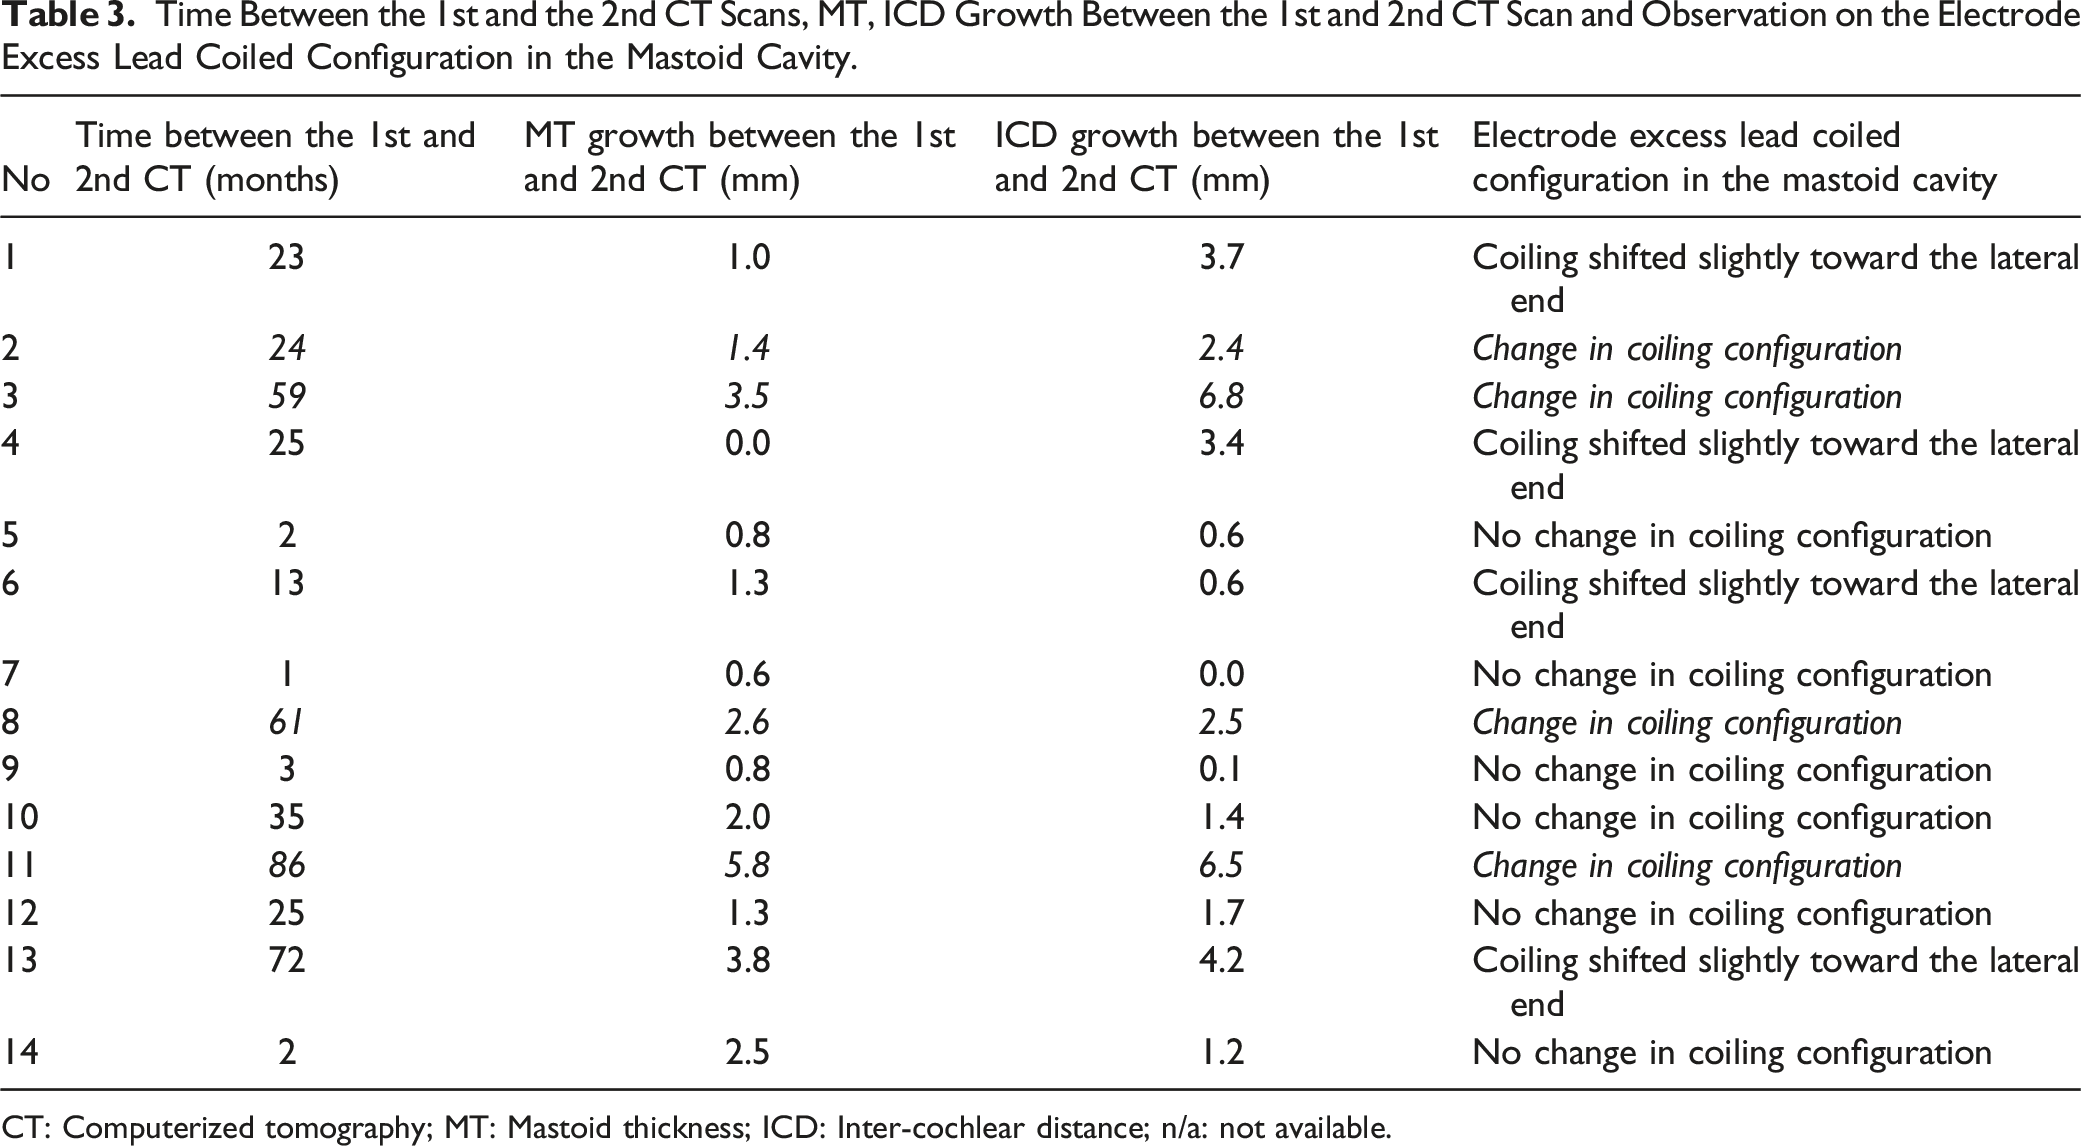
CT: Computerized tomography; MT: Mastoid thickness; ICD: Inter-cochlear distance; n/a: not available.
Cases 2, 3, 8, and 11 showed some changes in the coiled excess electrode lead configuration as visualized from the 2nd CT compared to the 1st CT, as shown in Figure 3. Careful observation shows the changes in the coiled electrode lead configuration between the 1st and the 2nd CT images as captured by the yellow dashed lines. Case 2 showed a compression in the coiled electrode lead configuration in the 2nd CT that was taken 24 months after the 1st CT. In case 3, the interval between the 1st and the 2nd CT scans was 59 months and there was a relaxation in the coiled electrode lead seen in the 2nd CT scan compared to the 1st CT scan. Case 8 had a time interval of 61 months between the 1st and the 2nd CT scans and there was a clear relaxation in the coiled electrode lead seen in the 2nd CT scan. In case 11, the time interval between the 1st and the 2nd CT scans was 86 months and the electrode lead coiling was seen compressed in the 2nd CT scan compared to the 1st CT scan. In three cases (3, 8, and 11) of the four cases with a change in coiling configuration, the MT growth between the 1st and the 2nd CT scan was >2.5 mm but it was only 1.4 mm in the fourth case (case 2). Changes in the coiled excess electrode lead configuration as observed by comparing the 1st and the 2nd CT scans of 4 cases. The white lines correspond to the inter-cochlear distance and the white dashed lines indicate the increase in the inter-cochlear distance over time. The yellow dashed lines indicate the changes that happened to the coiled electrode lead configuration comparing the 1st and the 2nd CT scans.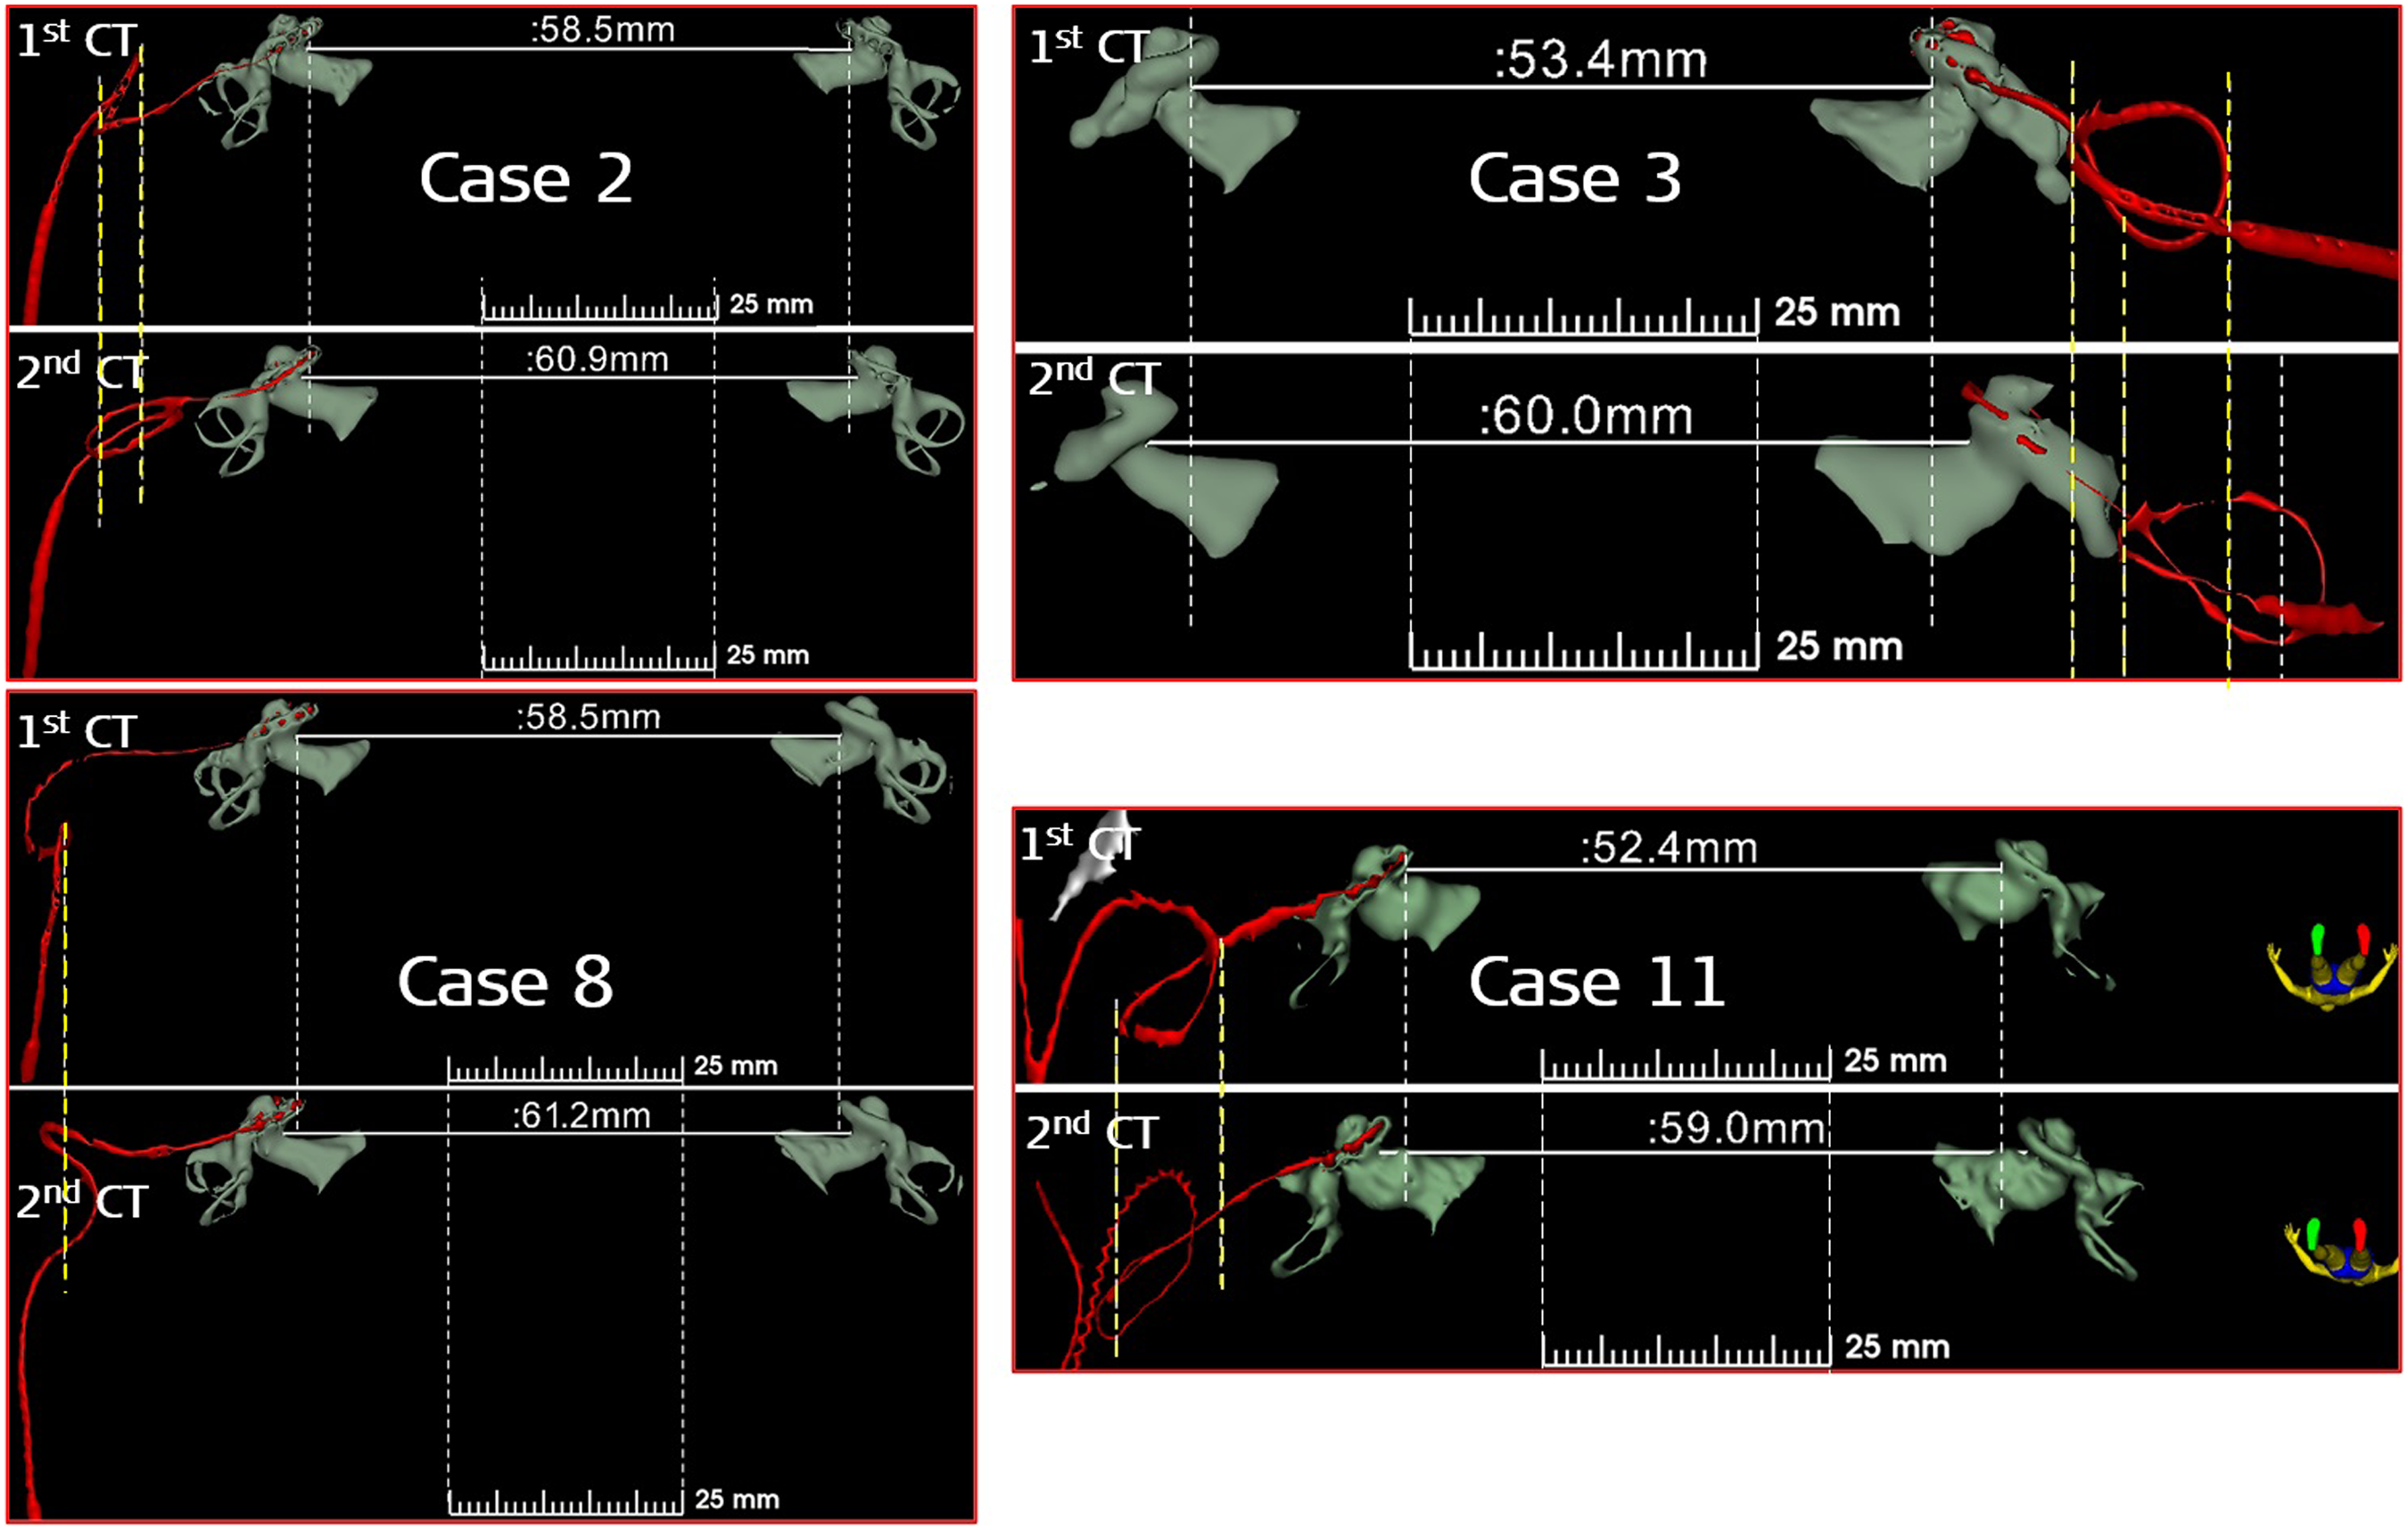
Cases 1, 4, 6, and 13 showed a shift in the coiled electrode lead configuration toward the lateral end of the mastoid as captured by the yellow dashed lines in Figure 4, without any drastic changes in the coiling pattern. In one (case 13) of those cases, the MT growth between the 1st and the 2nd CT scan was >2.5 mm. Shift in the coiled electrode lead configuration toward the lateral end comparing the 1st and the 2nd CT scans. The yellow dashed lines capture the shift in the coiled electrode lead configuration. The white continuous lines correspond to the inter-cochlear distance and the white dashed lines indicate the increase in the inter-cochlear distance over time.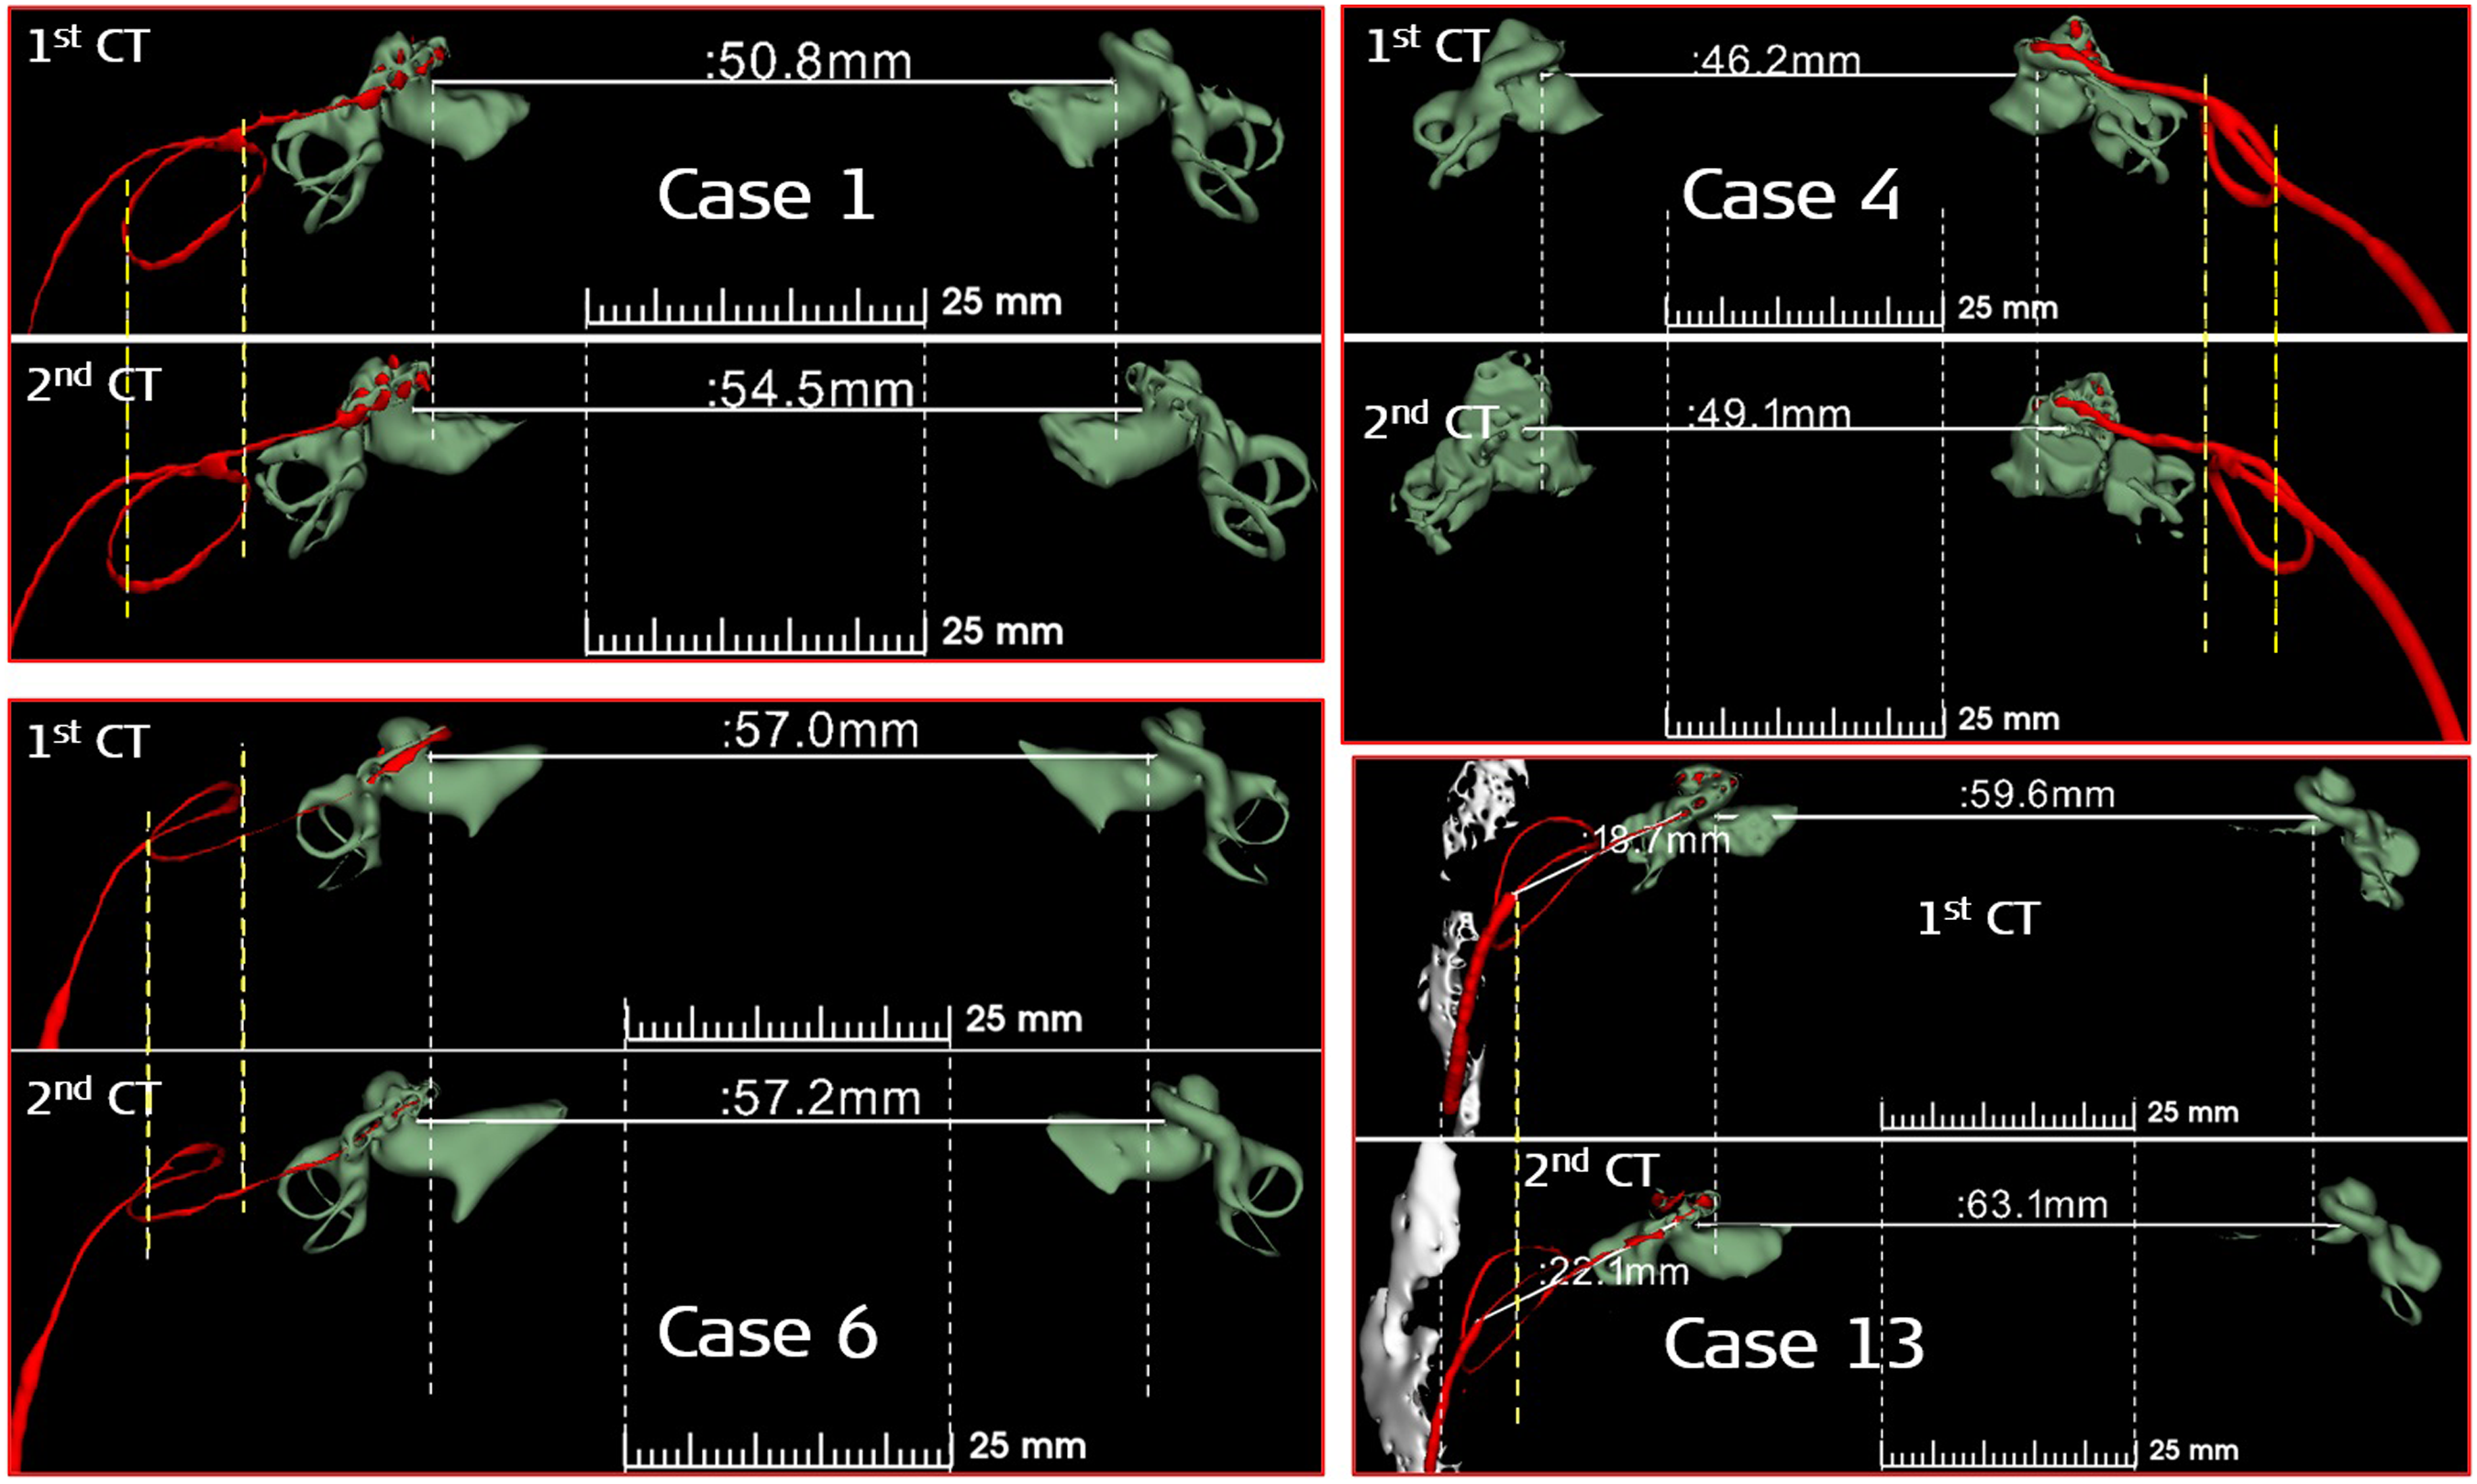
All the remaining cases did not show any changes either in the coiled electrode excess lead configuration or shift toward the lateral end of the mastoid even though there were growths in MT and ICD as shown in Table 3.
Discussion
This study reports the growth in MT and ICD with the age of the patient as well the difference in growth between the time at which the 1st and the 2nd CT scans were made. Also, this study captured the coiled configuration of the electrode excess lead in the mastoid drilled cavity in 3D view and compared it between the 1st and the 2nd CT scans. To the best of our knowledge, this is the first study to capture the changes in the configuration of electrode excess lead coiling in the mastoid drilled cavity and relates to both the growth in the MT and the ICD.
An earlier study, 3 has found a logarithmic relation between the growth in the MT and the age at the 1st CT scan. There, we had a patient group of ages ranging between <1 year and up to 79 years. In our current study with different patient groups, the age of the patient at which the 1st CT scan was performed ranged between 2 and 36 years and a similar logarithmic increasing trend was seen for MT and the age of the patients. The logarithmic growth in the ICD with age as seen in this current study validates the earlier findings of Mori et al. reported in 2012. 7
Another important finding in this current study is the positive linear correlation between MT and the ICD that demonstrates the overall growth in the skull size with time. An increase in ICD with time moves the mastoid more laterally and an increase in the MT with time would make the coiled electrode excess lead in the mastoid drilled cavity change its coiled configuration to accommodate the increase in the MT. But from the current findings, the pattern in the change in the coiled configuration of the excess electrode lead is unpredictable and it depends on how the surgeon coils it in the mastoid drilled cavity during the CI surgery. Vaid et al. 8 in 2011 for the first time raised the concern that an increase in MT over time could cause disturbance in the coiled electrode excess lead in the mastoid drilled cavity and this was observed in 8 cases in our study.
It is important to note that in all those 8 cases (1, 2, 3, 4, 6, 8, 11, and 13) with either change in the coiling configuration of electrode excess lead or lateral shift toward the mastoid as observed from the 2nd CT scan. Seven of these 8 cases showed an increase in the ICD >2 mm and only 4 cases (3, 8, 11, and 13) showed an increase in MT growth >2.5 mm between the 1st and the 2nd CT scans. In all other 6 cases with no observed changes in the coiled electrode lead and the ICD growth between the 1st and the 2nd CT scans, is <2 mm and the MT growth is ≤2.5 mm.
Regarding the change of electrode excess lead pattern, it has been found that four cases (2, 3, 8, and 11) had a change in the coiling configuration. The MT growth between the 1st and the 2nd CT scan was >2.5 mm in three of them whereas MT was only 1.4 mm in the fourth case (case 2). Due to the smaller number of cases presented in this study, a clear conclusion cannot be drawn if the change in the coiled electrode excess lead is associated with an increase in the MT as measured between the 2nd and the 1st CT scans >2.5 mm. In none of the cases presented in this study, migration of electrode array out of the cochlea was observed. This could be due to the constraint-free relaxation of the coiled electrode excess lead in the mastoid drilled cavity accommodating to the natural growth in the MT.
The operating surgeon should be aware of the growth in MT and ICD over time, especially in children and therefore, all precautions to secure the electrode array inside the cochlea by packing the cochlear entrance with fascia and/or suturing the implant on the skull surface should be practiced. The electrode excess lead should be gently coiled in the mastoid drilled cavity avoiding too much twisting for two main reasons. One to minimize the effect of electrode excess lead spring back and the second to enhance smooth relaxation accommodating to the growth in the MT, thereby avoiding electrode array extrusion/migration out of the cochlea.
Our findings could create awareness among the clinicians who are investigating the direct cochlear access (DCA) approach of mastoid drilling assisted by a robotic arm to reach the cochlea for the electrode array insertion in CI surgeries.9,10 So far, the robotic-assisted DCA approach was successfully performed in adults, 11 and extending the whole robotic approach to the pediatric population might need some considerations in securing the electrode excess lead in the straight tunnel drilled in the mastoid, accommodating to the natural growth in the MT. This study has limitations including the retrospective nature that the post-operative CT scan taken at the 2nd time point was for other clinical reasons. However, we evaluated the clinical reasons for CT scans taken at the 2nd time point to make sure it does not influence the study results. The small number of patients is another limitation of this study.
Conclusion
Mastoid thickness (MT) and inter-cochlear distance (ICD) increase logarithmically with the age of the patients as measured from the post-operative CT scans taken at two different time points. The difference in the MT and ICD measurements captured from two CT scans and the plot between these two measurements showed a linear positive trend. The excess electrode lead coiled in the mastoid drilled cavity changed its configuration or shifted laterally toward the mastoid edge in 57% of the cases studied (8 out of 14 cases). In conclusion, the cases with an increase in the MT bigger than 2.5 mm probably will have a change in the coiled configuration of the excess electrode lead. Proper fixation of the excess electrode lead is recommended especially in the pediatric population to minimize the risk of electrode array migration.
Footnotes
Acknowledgement
This was one of the research projects recommended by the Saudi Otorhinolaryngology Society.
Declaration of Conflicting Interests
The author(s) declared no potential conflicts of interest with respect to the research, authorship, and/or publication of this article.
Funding
The author(s) received no financial support for the research, authorship, and/or publication of this article.