
Abstract
Background
Health-related quality of life (QoL) is a measure that allows us to know the patient’s perception of well-being and how it is affected by their disease and treatments. In cancer patients, sarcopenia has been associated with low scores on various instruments used to assess the QoL; however, little information is available on the effects of sarcopenia and sarcopenic obesity on the QoL of patients with head and neck cancer (H&NC).
Methods
In this cross-sectional study with 71 H&NC patients aged between 40 and 80 years, we describe the scores on the instruments EORTC QLQ C-30 and EORTC QLQ-H&N35 according to the sarcopenia phenotype (NSG, nonsarcopenic group; SG, sarcopenic group; and SOG, sarcopenic obesity group), hand-grip strength, gait speed, total lymphocyte count, albumin, cholesterol and C-reactive protein, and the relationships between these variables.
Results
The prevalence of sarcopenia and sarcopenic obesity was 48% and 28%, respectively. The QoL analysis showed that NSG had higher scores on the physical functioning scale [NSG 93 (83–100); SG 73 (52–88); SOG 83 (53–93), P = .009] and lower scores on the fatigue scale [NSG 11 (0–22); S 39 (30–67); SOG 44 (14–56); P = .004]. The NSG had a higher hand-grip strength (31.1 kg) than SG (24.1 kg, P = .007) and SOG (26.3 kg, P = .001), and a lower C-reactive protein. The SG and SOG showed no differences between them.
Conclusions
Patients with sarcopenia or sarcopenic obesity have lower physical performance and a higher level of fatigue than nonsarcopenic patients. This loss of function can maintain or worsen sarcopenia due to the patient’s self-restraint in physical exertion that encourages an increase in muscle tissue.
Keywords
Introduction
The estimated prevalence of head and neck cancer (H&NC) in Mexico in the past 5 years is 10 480 cases, with 3882 new cases annually, and the annual mortality rate was 1800 cases, according to Globocan data. 1 These patients experience severe weight loss up to 57% before treatment and up to 85% during treatment. 2 -4 The etiology of weight loss is multifactorial and includes mechanical alterations caused by the tumor, inflammatory phenomena associated with cancer cachexia, and treatment effects. 5,6 Weight loss can induce or perpetuate sarcopenia, affecting overall and disease-free survival, locoregional recurrence, and worsening radiation therapy-related toxicity. 7 -13
Cancer patients with sarcopenic obesity have a disease-free survival rate lower than patients with sarcopenia without obesity. 11,14,15 Excess fat masks muscle mass loss and defies the possibility of an opportune diagnosis of sarcopenia. In addition, it promotes the production of inflammatory mediators—adipocytokines and acute phase reactants—which are involved in different immune and metabolic processes, limits muscle synthesis, and stimulates proteolysis.
Previous research suggests a relationship between sarcopenia and low scores on different instruments used to evaluate the quality of life (QoL) of cancer patients. 16 -18 However, few studies describe the association of sarcopenic obesity with the QoL of cancer patients, and to our knowledge, no study has reported this association in H&NC patients.
Quality of life is a multifactorial construct related to the functioning and perception of well-being, 16 and is influenced by its nutritional status. The objective of this study was to determine the impact of sarcopenia and sarcopenic obesity on QoL scales and several indicators of nutritional status in patients with H&NC.
Patients and Methods
The Institutional Review Board of the Instituto Mexicano del Seguro Social approved this research. It is a cross-sectional study with retrospectively collected laboratory data. All procedures were carried out according to the principles of the Helsinki Declaration; a written declaration of consent was obtained from all participants.
The study consisted of a nonprobability sample of 71 patients between the ages > 40 and < 80 years old confirmed with H&NC. All patients had started their H&NC treatment (surgery, radiation therapy, and/or chemotherapy) in a tertiary facility in Guadalajara, México. Patients with two or more cancers, autoimmune diseases, chronic lung diseases, cardiovascular diseases, renal failure, or contraindications to determining body composition by bioelectrical impedance analysis (pacemaker or metal prostheses, limb amputations, and severe edema) were excluded. The sociodemographic data of the patient, the clinical stage and anatomical location of the tumor, the treatment modality, and the laboratory results were extracted from the medical records.
An experienced dietitian performed the analysis of body composition and classified the patients according to their sarcopenia phenotype. Before the measurement, the patients fasted for 8 hours and wore no jewelry or socks. Height was measured with the Seca 213 height scale (Seca, Germany). The mBCA Seca 514 bioelectric impedance device (Seca, Germany) was used to obtain the patient’s weight, phase angle, total skeletal muscle mass, and percentage of total body fat.
Body mass index (BMI) was calculated as described by the World Health Organization. Skeletal muscle-mass index (SMI) was calculated by dividing the total skeletal muscle mass (kg) by the height squared (m2). Based on SMI and BMI, the patients were divided into 3 groups: (a) nonsarcopenic group (NSG): SMI women ≥ 6.42 kg/m2, men ≥ 8.86 kg/m2, and BMI < 25 kg/m2; (b) sarcopenic group (SG): SMI women < 6.42 kg/m2, men < 8.87 kg/m2, and a BMI < 25 kg/m2); and (c) sarcopenic obesity group (SOG): SMI women < 6.42 kg/m2, men < 8.87 kg/m2, and a BMI ≥ 25 kg/m2. 15,19
The ratio of SMI to patient weight was calculated to determine the proportion of total weight that corresponded to muscle mass, which was normalized by dividing by the square of height.
The hand-grip strength was measured using a Jamar Plus+ Digital hand dynamometer (Patterson Medical Supply, Cedarburg, USA). According to the American Association of Hand Therapists, the patient held the device and compressed it with maximum force to achieve maximum contraction. The test was repeated 3 times for each hand, with 1-minute rest intervals between each measurement. The highest result of all tests was recorded. 20
The EORTC QLQ-C30 v.3 (validated for the Mexican population) was used to evaluate the QoL. 21 It consists of 6 multi-item scales (health status/global QoL, physical functioning, role functioning, social functioning, emotional functioning, and cognitive functioning) and 9 single-item scales (fatigue, nausea or vomiting, pain, dyspnea, insomnia, appetite loss, diarrhea, constipation, and financial difficulties). The multi-item scales evaluate constructs related to the patient’s functioning, while the single-item scales describe the severity of cancer-related symptoms.
The EORTC QLQ-H&N35 complementary module for H&NC patients consists of 35 questions, comprises 7 multi-item symptom scales (pain, swallowing, sensory problems, speech problems, trouble with social eating, trouble with social contact, and reduced sexuality), and eleven single-item symptom scales (teeth, open mouth, dry mouth, sticky saliva, coughing, felt ill, painkillers, nutritional supplements, feeding tube, weight loss, and weight gain).
The analysis of both EORTC questionnaire items required the linear transformation of each item or multi-item scale to get a range of scores from 0 to 100. Higher scores on the functioning scales indicate that patients perceive that they have better QoL. On the contrary, higher scores on the symptoms scales indicate a higher frequency of severe symptoms and thus a poorer QoL. 22
Statistical analysis was performed using the IBM® SPSS® Statistics version 26 software package (Armonk, New York). Results are presented as mean ± standard deviation (SD) for variables with normal distributions. Nonparametric variables are represented as medians (interquartile intervals [IQIs]). Categorical variables are expressed as numbers and percentages of the total. We performed Pearson’s chi-square tests to assess differences between 2 groups (Fisher’s tests if the estimated values were < 5); one-way ANOVA and KruskalWallis tests with Bonferroni correction were used to assess differences between the 3 groups. To determine the relationship, we calculated Spearman’s rho. All analyses were two-sided, and a P-value < .05 was considered significant. We used Cronbach’s alpha value for reliability in the multi-item scales in both questionnaires.
Results
Comparison of clinical characteristics by sarcopenic phenotype.
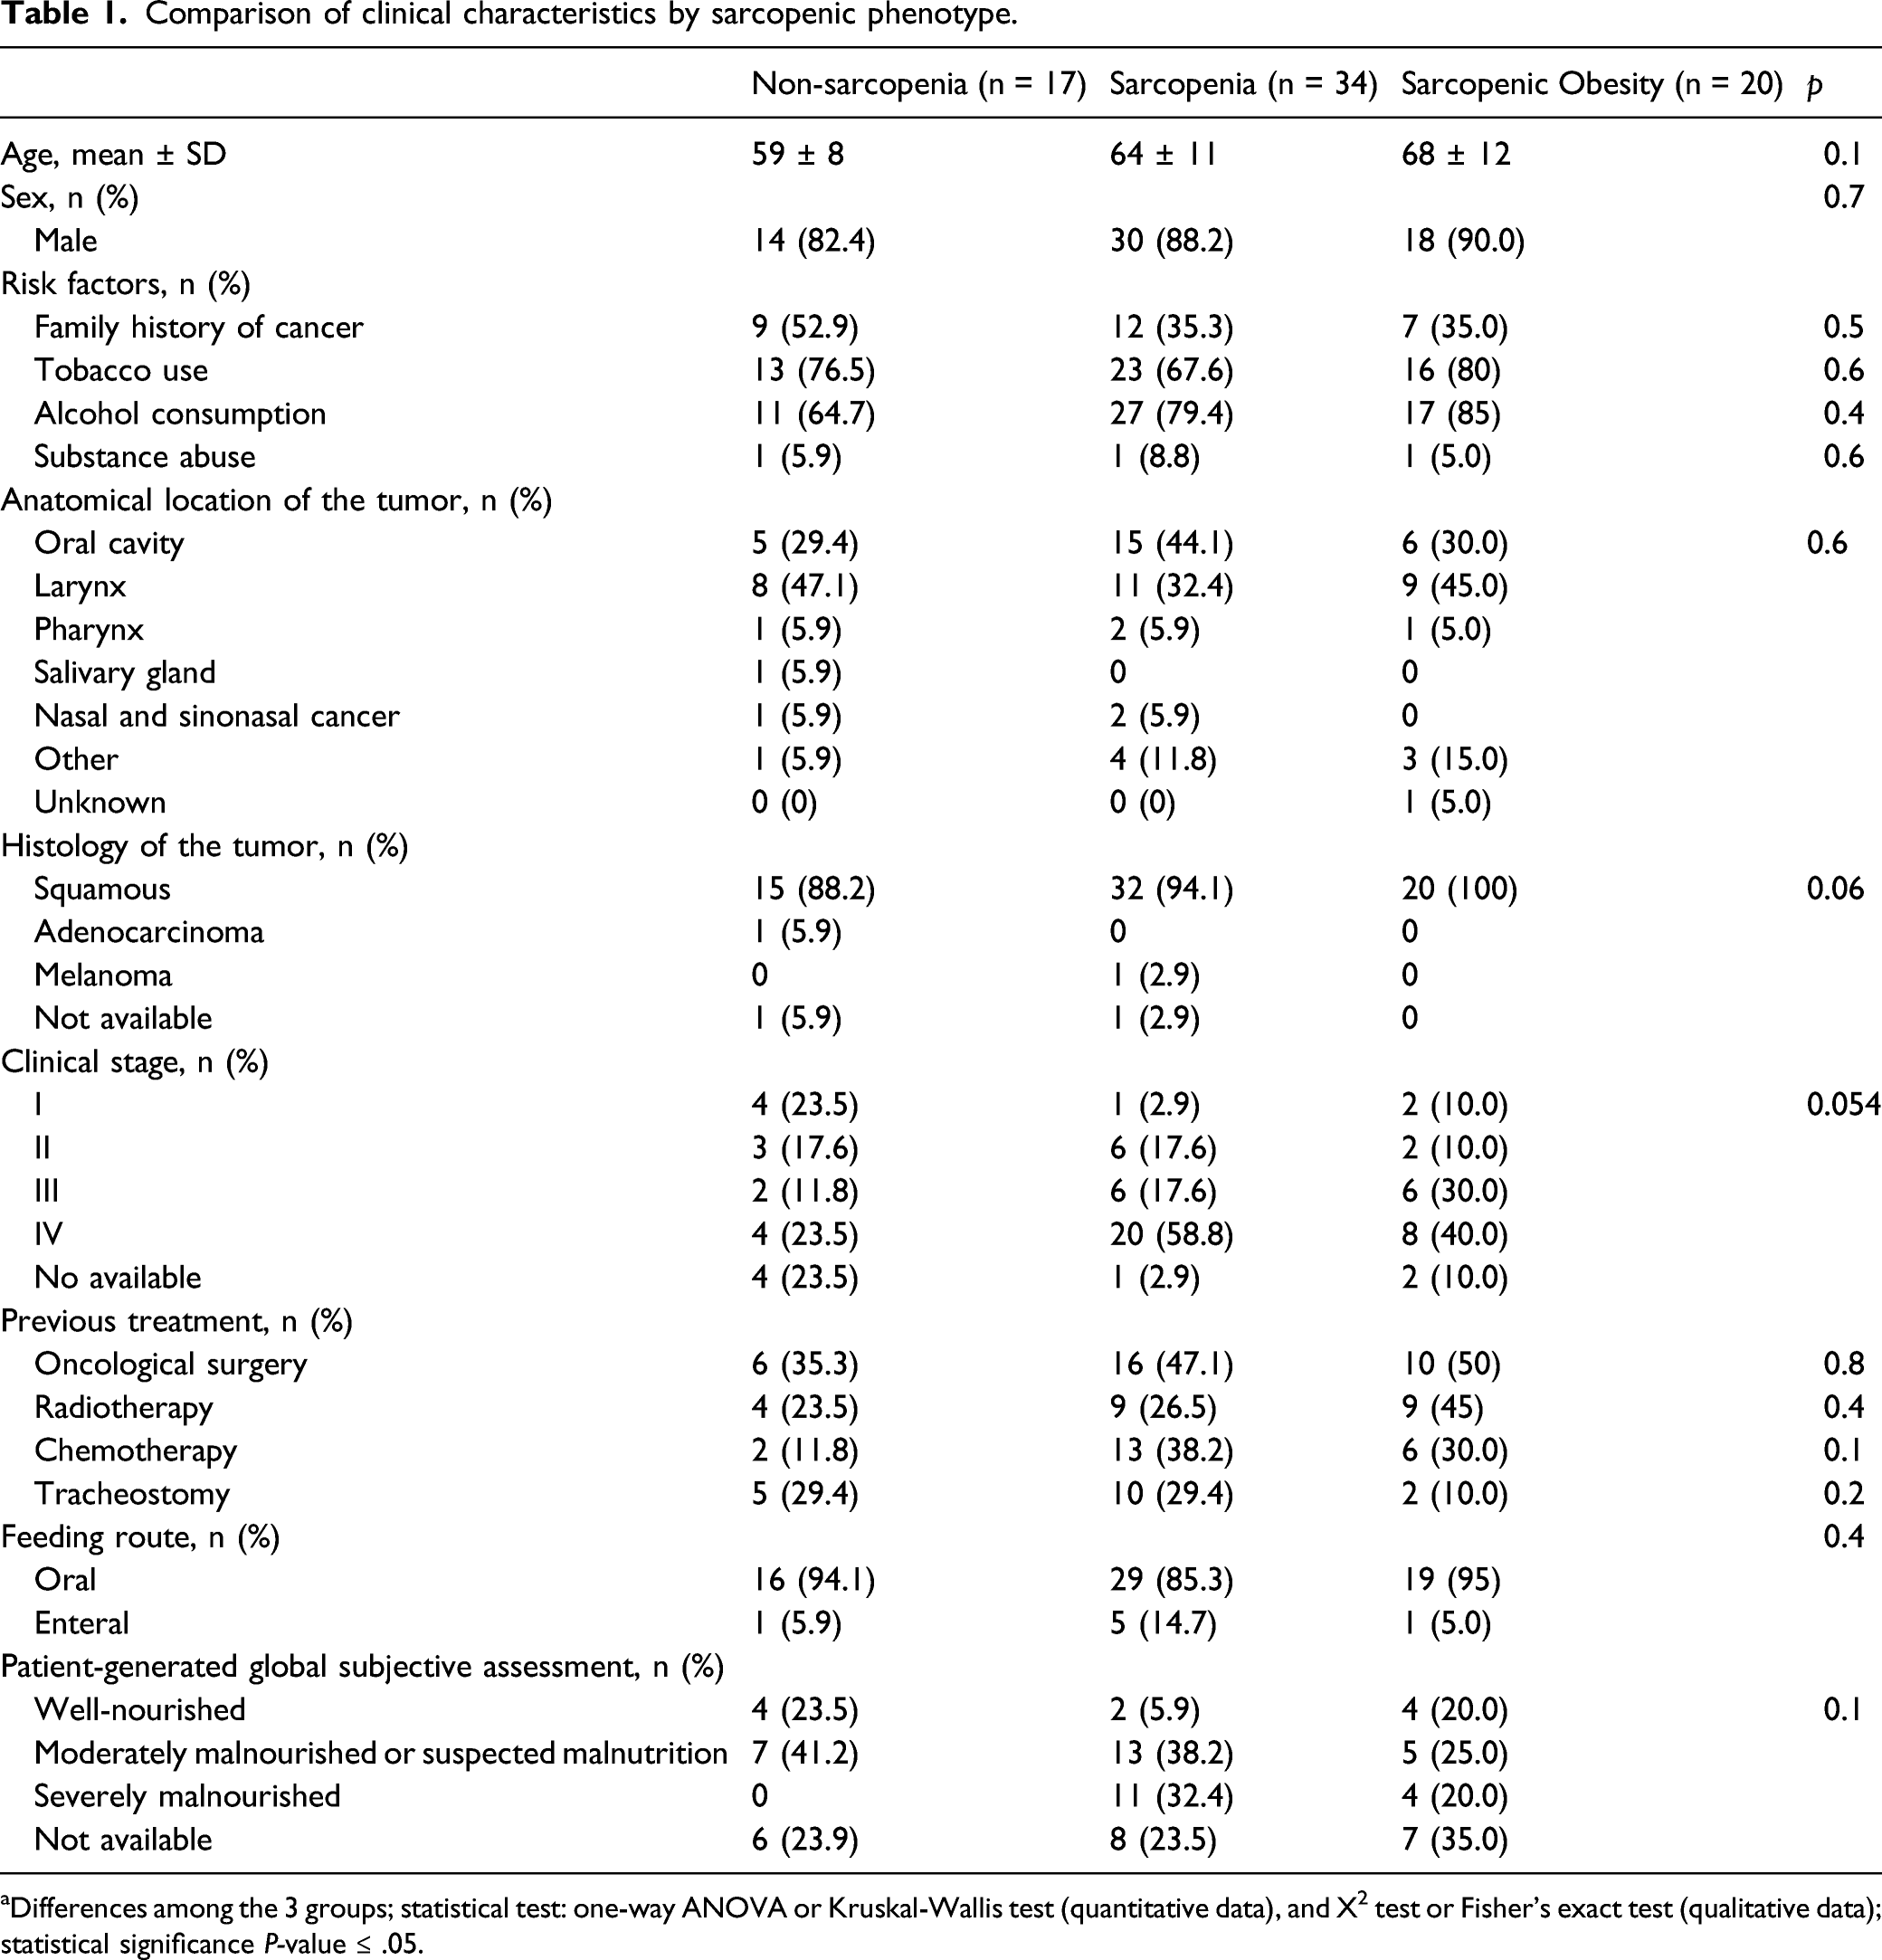
aDifferences among the 3 groups; statistical test: one-way ANOVA or Kruskal-Wallis test (quantitative data), and X2 test or Fisher’s exact test (qualitative data); statistical significance P-value ≤ .05.
Comparisons of the biochemical, anthropometric, and functional parameters by sarcopenic phenotype.
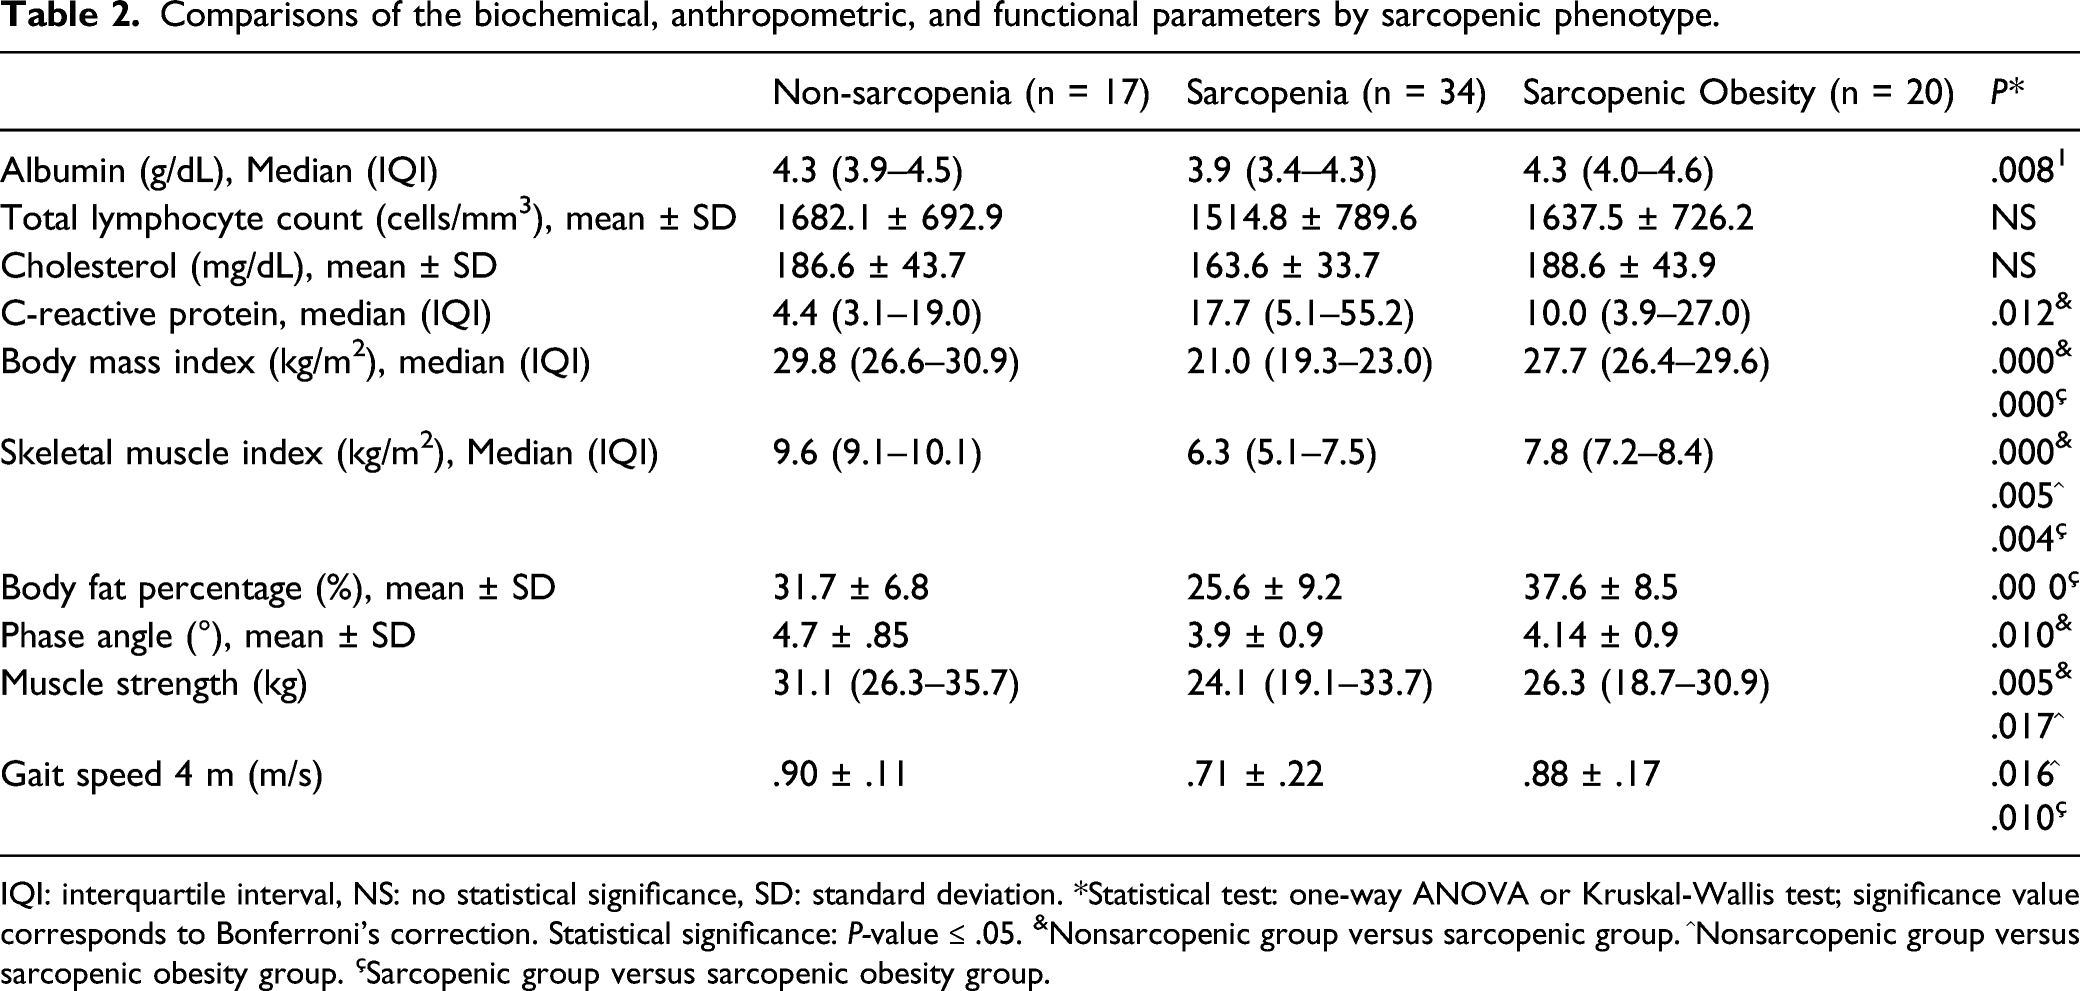
IQI: interquartile interval, NS: no statistical significance, SD: standard deviation. *Statistical test: one-way ANOVA or Kruskal-Wallis test; significance value corresponds to Bonferroni’s correction. Statistical significance: P-value ≤ .05. &Nonsarcopenic group versus sarcopenic group. ^Nonsarcopenic group versus sarcopenic obesity group. çSarcopenic group versus sarcopenic obesity group.
Lower BMI values, body fat percentage, and SMI were observed among anthropometric variables in the SG. The phase angle was higher in the NSG (4.7°) than in the SG (3.9°; P =.010), but no differences were found compared to the SOG. The SG had lower albumin values (3.9 g/dL) than SOG (4.3 g/dL) (P = .013) and higher C-reactive protein values than NSG (17.7 vs 4.4, P = .12). The phase angle was higher in the NSG (4.7°) than in the SG (3.9°; P = .010) (Table 2).
The NSG had a higher hand-grip strength (31.1 kg) than SG (24.1 kg, P = .007) and SOG (26.3 kg, P = .001). The NSG (.90 m/s) and SOG (.88 m/s) performed better than SG (.71 m/s) in the 4-m gait speed test (Table 2).
EORTC QLQ-C30
Comparison of the scores on the EORTC QLQ-C30 and EORTC QLQ-H&N35.
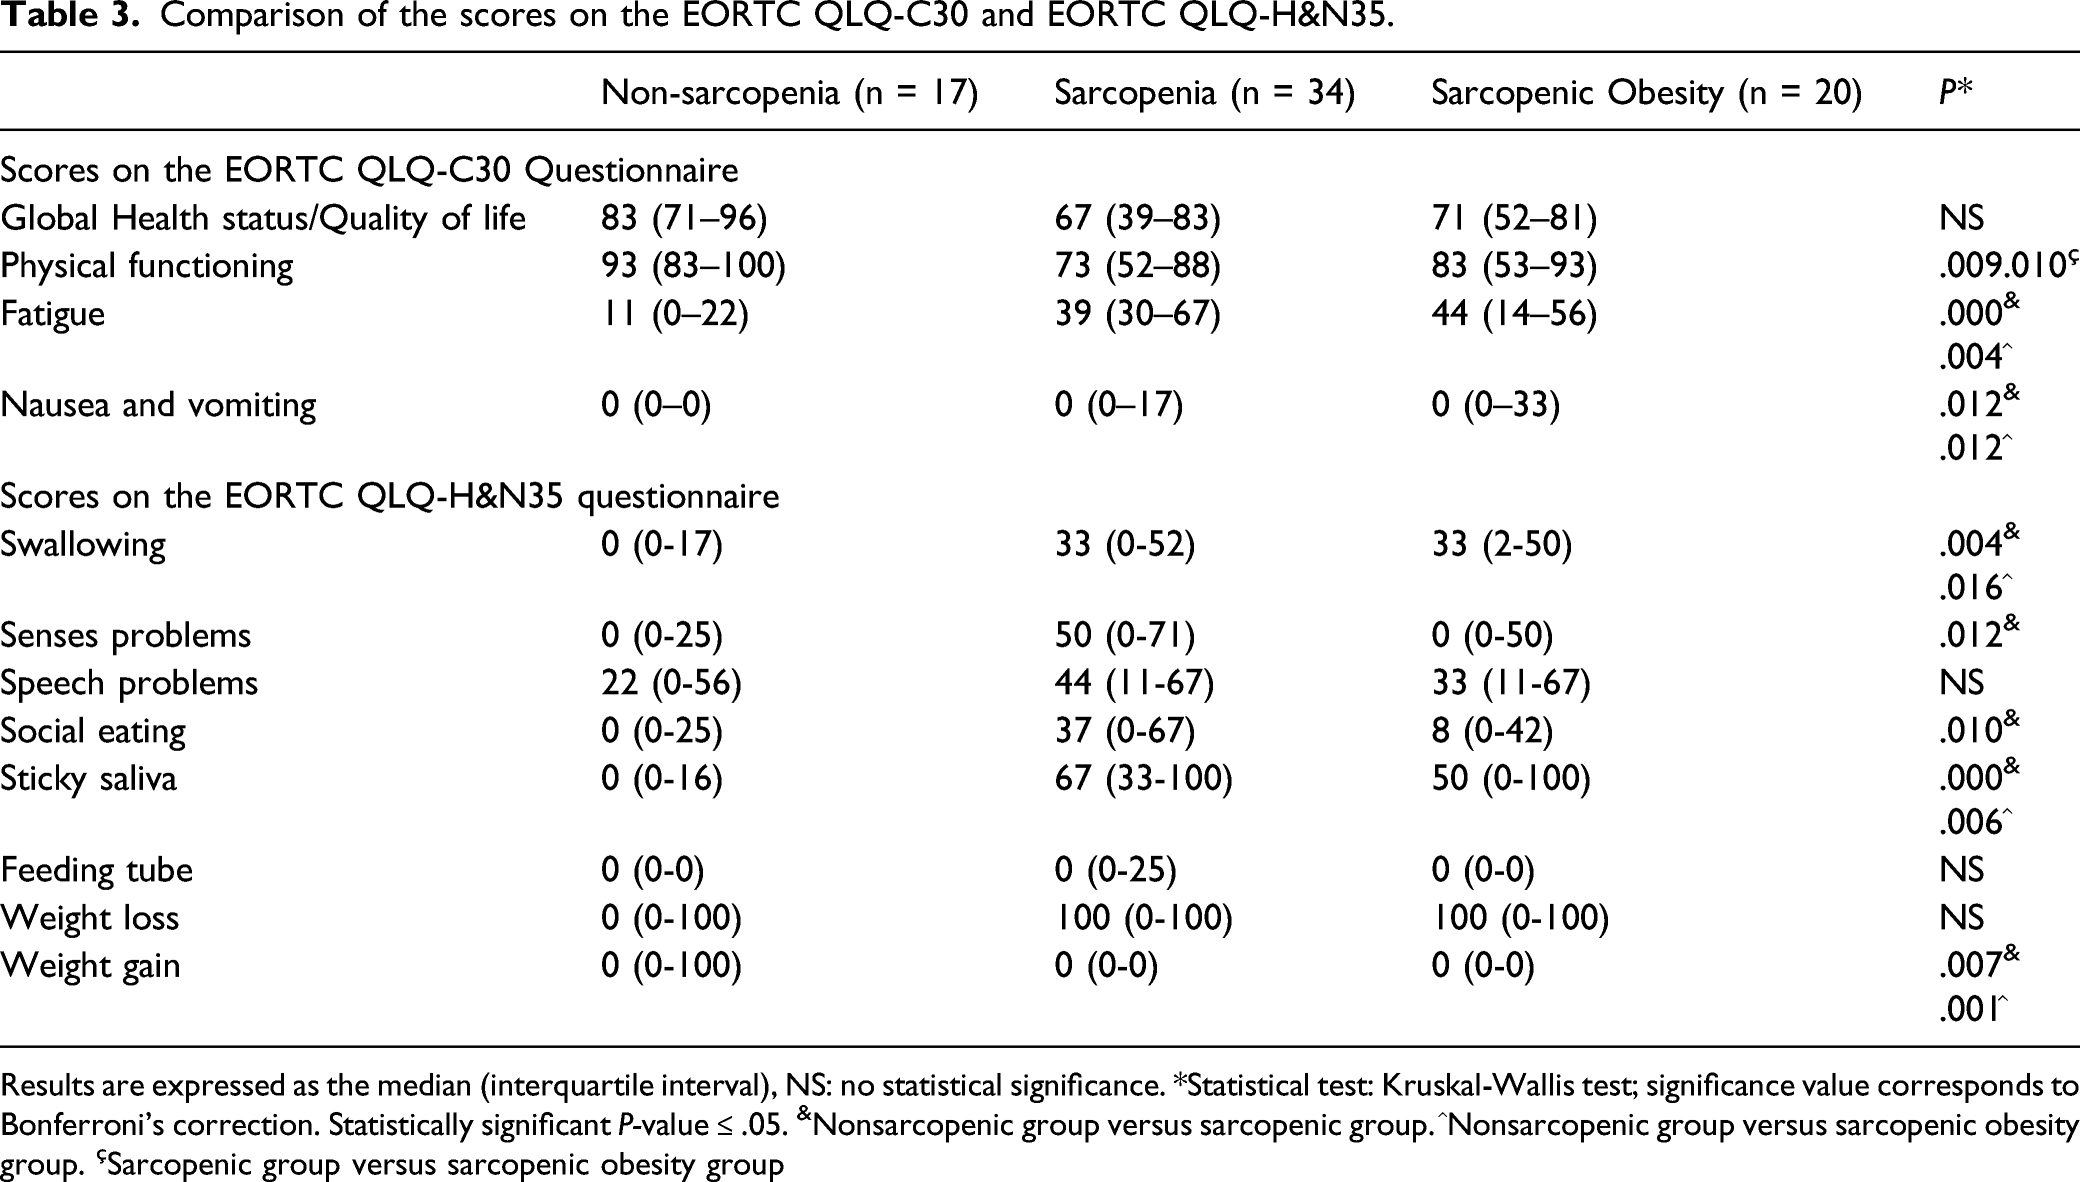
Results are expressed as the median (interquartile interval), NS: no statistical significance. *Statistical test: Kruskal-Wallis test; significance value corresponds to Bonferroni’s correction. Statistically significant P-value ≤ .05. &Nonsarcopenic group versus sarcopenic group. ^Nonsarcopenic group versus sarcopenic obesity group. çSarcopenic group versus sarcopenic obesity group
Relationships between the scores on EORTC QLQ-C30 and EORTC QLQ-H&N35 questionnaires and the sarcopenia-related parameters.
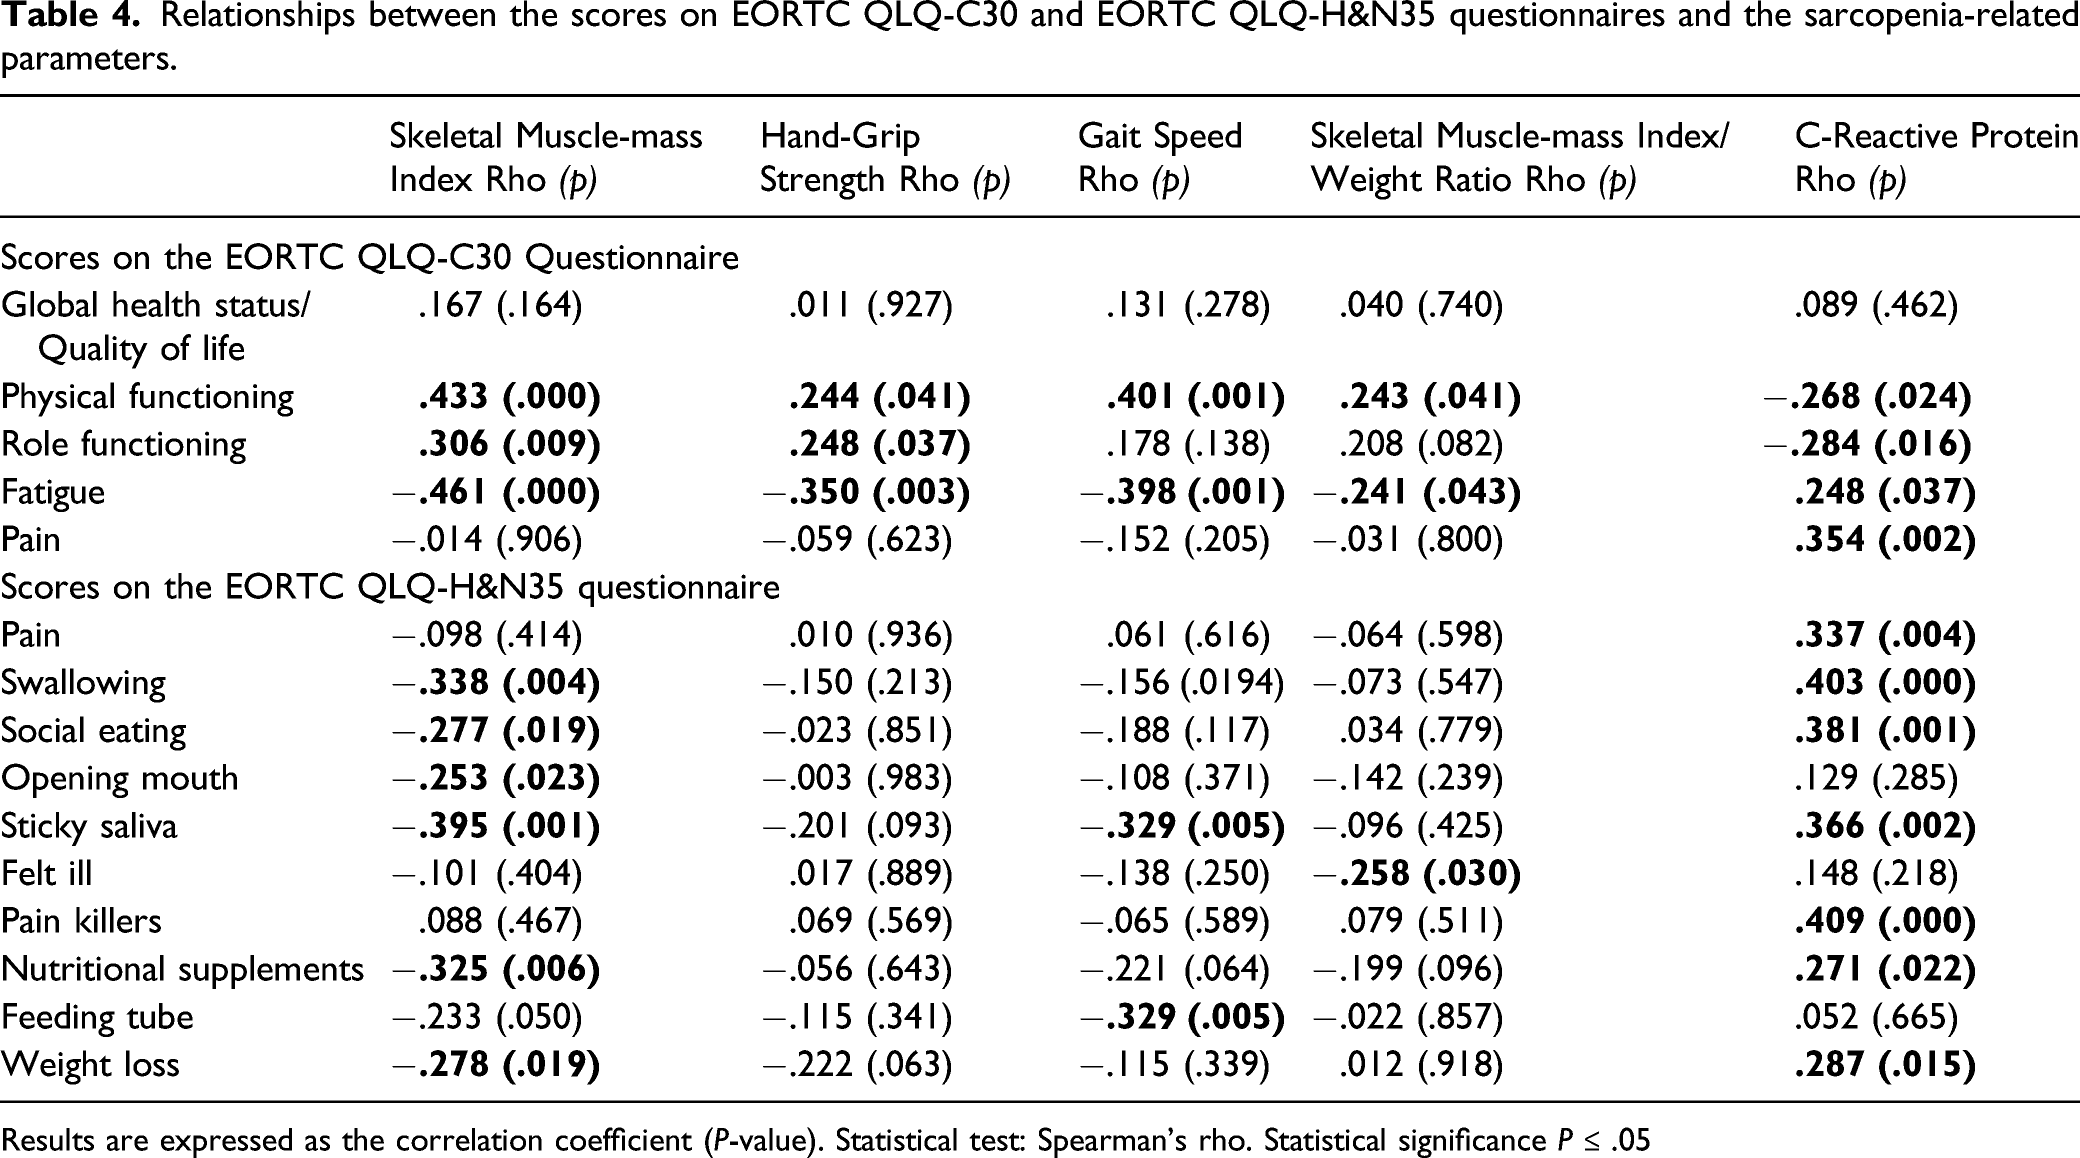
Results are expressed as the correlation coefficient (P-value). Statistical test: Spearman’s rho. Statistical significance P ≤ .05
EORTC QLQ-H&N35 Module
The EORTC QLQ-H&N35 module showed a high level of reliability (Cronbach’s alpha = .911). The NSG had better scores than SG and SOG on the symptom scales, swallowing, sticky saliva, and weight gain. As with the EORTC QLQ-C30, SG and SOG had similar scores (Table 3).
The scales of symptoms pain, swallowing, eating problems, sticky saliva, painkillers, nutritional supplements, and weight loss were positively related to the levels of C-reactive proteins (rho = .375, P = .002). The appetite loss scale was negatively associated with the gait speed test (rho = −.286, P = .016) (Table 4).
Relationships among the indicators of nutritional status, sarcopenia-related parameters, and the scores on EORTC QLQ-C30 and EORTC QLQ-H&N35 questionnaires.
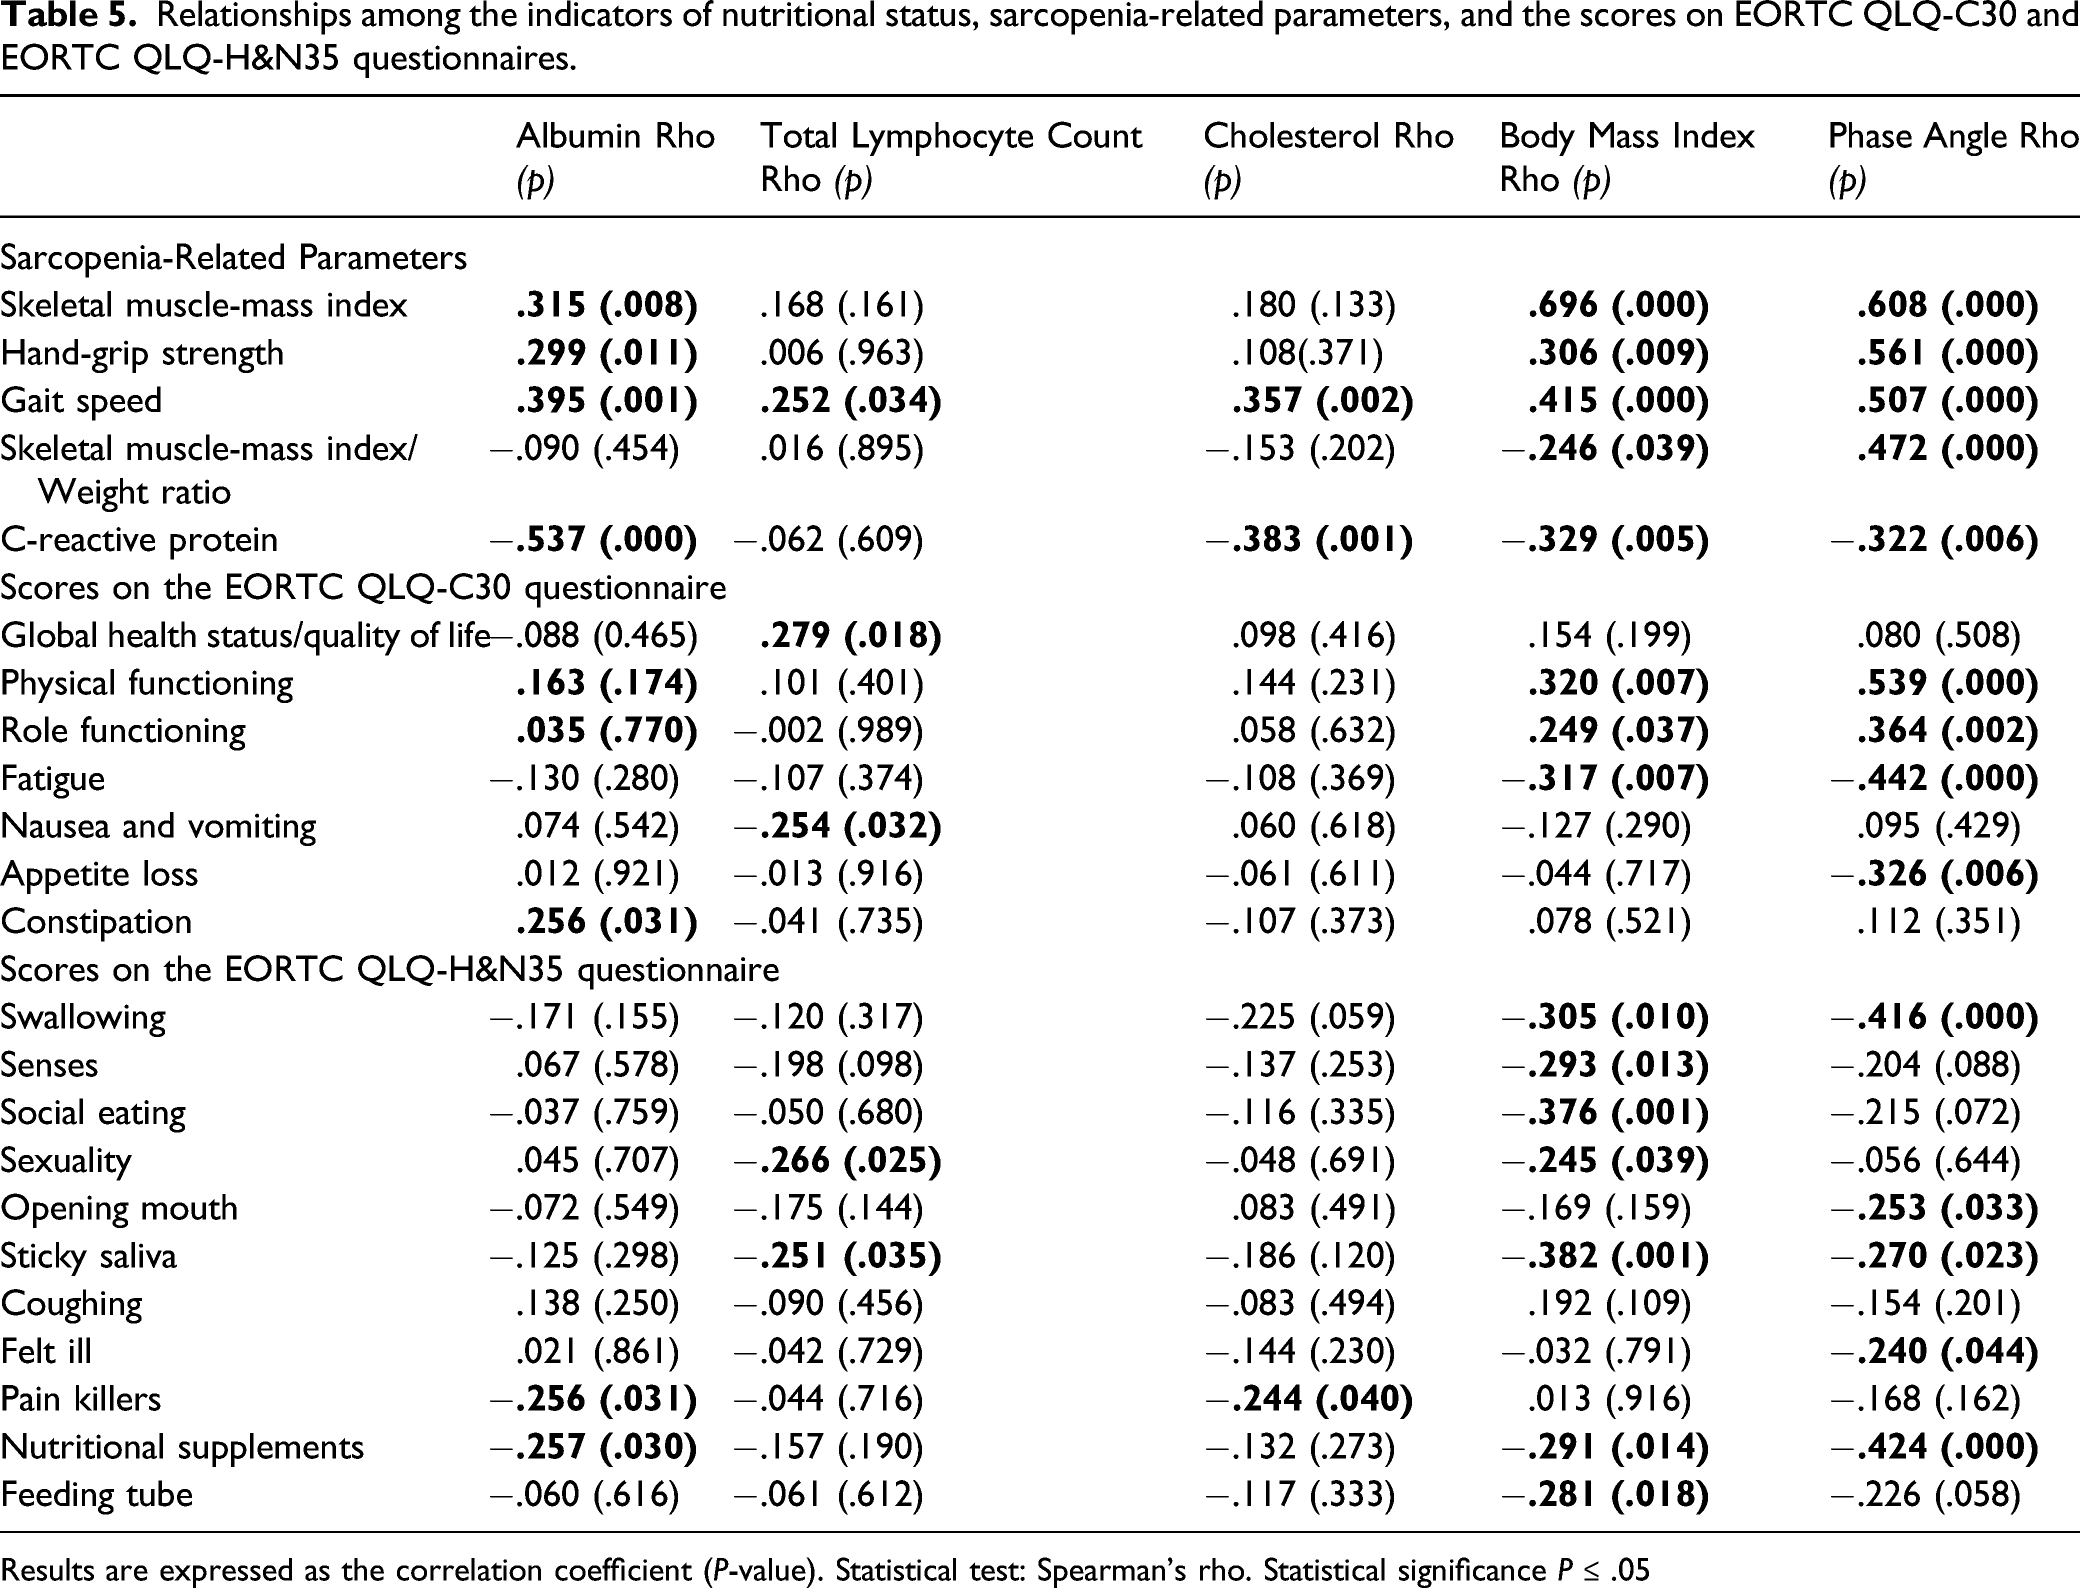
Results are expressed as the correlation coefficient (P-value). Statistical test: Spearman’s rho. Statistical significance P ≤ .05
Discussion
Sarcopenia and sarcopenic obesity are alterations in body composition that have been associated with a loss of QoL in cancer patients. Although there are many studies, research in H&NC patients remains limited. To fill this literature gap, this article identifies the impact of sarcopenia and sarcopenic obesity on QoL and indicators of nutritional status in patients with H&NC.
This study demonstrates that H&NC patients without sarcopenia have better physical functioning, greater muscle strength, and less fatigue than patients with sarcopenia and sarcopenic obesity. However, no differences were observed between the QoL of patients with sarcopenia and sarcopenic obesity.
Sarcopenia was identified in 50% of our H&NC population, consistent with the prevalence of sarcopenia reported by other authors in H&NC patients. 7,10,11,23,24 Certain groups of researchers reported lower (7% to 35%) 9,12,25 or higher (71% to 77%) percentages. 26,27 This wide range may be due to differences in how and when the body composition analysis was performed, the method used, and the cutoff points.
We found sarcopenia in 47.5% of overweight or obese patients—overall proportion 26%—consistent with Fattouh, despite his patients being in the pretreatment phase, present in only 30% of our population. 14
In our study, NSG QoL scores were higher than those of patients with sarcopenia, in agreement with Wright et al, 16 who found a positive correlation of skeletal muscle mass with high scores on global QoL (FACT-G questionnaire), physical functioning, and social/family functioning. These observations coincide with data reported by Galvao et al, Van Roekel et al, Caahlin and Cabbage, and Jeffrey et al, with other cancers using instruments such as SF-3617 or FACT-G. 18,28 -31
In contrast, in our current data, the association analysis of sarcopenic obesity in QoL in H&NC patients showed that the increased QoL values and functional performance were higher in NSG than in SG or SOG, with no differences between SG and SOG.
Although we did not perform survival analysis, other studies comparing overall survival of cancer patients with sarcopenia and sarcopenic obesity found that overall survival in patients with sarcopenic obesity was worse than in patients with sarcopenia only. 8,14
Others have shown that increased skeletal muscle mass in H&NC patients is associated with an increase in physical functioning reported by the patients, 16 consistent with our finding that gait speed is positively related to the physical performance scale. This association is supported by the fact that the gait speed test reflects a person’s level of functionality or ability to perform basic activities.
Similar to the results of the global QoL scale, the physical functioning scale score was higher in the NSG than in SG and SOG, but no differences were found between the last 2. Our correlation analysis showed that a higher ratio of skeletal muscle mass/total weight is associated with lower physical functioning scores. Additionally, anorexia and increased inflammation, as evidenced by elevated serum C-reactive protein values, were also negatively associated with this scale.
For the treatment of sarcopenia, there is strong evidence that resistance exercise increases muscle mass and strength, 32 -34 reduces fatigue degree, and improves patient functionality. Nutritional interventions are recognized as necessary to improve clinical outcomes; a high protein diet or protein supplement (1 to 1.5 g/day) is recommended for the treatment of sarcopenia, and higher protein doses (up to 2 g/day) may be indicated in patients with severe illness or injury, or where there is evidence of proinflammatory disease/catabolic state. 35 -39 Since 1995, Biolo et al 40 have associated nutritional support and exercise with muscle protein synthesis. Given these facts, the proper planning of interventions that combine exercise and nutritional support is imperative. 41
Serum albumin is a widely used indicator of nutritional status in the general population, but decreased albumin levels in severe pathological conditions such as cancer reflect aggravated inflammation, more so than the nutritional status of patients. 42 -44 Consequently, patients with sarcopenia had the lowest serum albumin levels and the highest C-reactive protein levels in our population. Low albumin production is related to the acute phase response caused by chronic stress caused by cancer and tumor cachexia. Similar values of total lymphocyte count and blood cholesterol between the 3 groups support this hypothesis, since anthropometric differences did not affect these 3 biochemical indicators of nutritional status. 42 -44
When PA values are low, it reflects a decrease in the integrity of the cell membrane. Our results showed lower PA values in SG than in NSG. PA values correlate positively with sarcopenia indicators (SMI, hand-grip strength, and gait speed), in contrast to the description by Garlini et al of healthy subjects. 45
Some of the limitations of our study need to be acknowledged. One of them is that the report is the result of a cross-sectional study; we cannot establish the causality between the sarcopenia phenotype and the scores on the different scales of the QoL instruments. The lack of homogeneity in clinical characteristics, mainly related to the clinical stage, the anatomical location of the tumor, the treatment phase, and the small sample size, makes it impossible to identify whether these QoL effects are modified by sarcopenic obesity.
The main strength of this study is its originality. As mentioned above, there have been few reports on the association of sarcopenia with QoL in H&NC patients; none of them have described this association in patients who are overweight or obese.
Conclusions
In summary, we demonstrated that patients without sarcopenia have higher physical functioning and less fatigue than patients with sarcopenia or sarcopenic obesity. It should be noted that the QoL of patients with sarcopenia is similar to that of patients with sarcopenic obesity. This information is relevant because being overweight or obese in an oncology patient can mask muscle loss in the absence of appropriate identification tools, thus delaying nutritional interventions. Future research should focus on identifying when H&NC patients begin to lose muscle mass, and suggesting optimal efforts to improve their QoL and functionality.
Footnotes
Acknowledgments
The authors would like to thank the following medical staff for their participation in patient recruitment: Castañeda-Ureña Alejandra, Jiménez-Beltrán Carlos, Jonguitud-Olguín Gregorio, López-Almaráz Luis-Manuel, De-la-Torre-Segura Martha-Karina, and Ramírez-Robles Jorge-Damián.
Authors’ Contributions
Conceptualization, LMABP, BEMH, and DSM; methodology, LMABP; software, BEMH; validation, LMABP, BEMH, BTH, FGB, and ECC; formal analysis, LMABP and BEMH; investigation, ASM, DAOZ, AZA, and JDFC; resources, LMABP, DSM, GAHC, LHBL, REMG, EGS, and CDC; data curation, BEMH; writing—original draft preparation, BEMH; writing—review and editing, LMABP, BEMH, BTH, DSM, FGB, ECC, GAHC, LHBL REMG, EGS, CDC, MSP, AHNZ, and EGS; visualization, LMABP; supervision, BEMH; project administration, LMABP and BEMH; funding acquisition, LMABP.
Declaration of Conflicting Interests
The author(s) declared no potential conflicts of interest with respect to the research, authorship, and/or publication of this article.
Funding
The authors disclosed receiving the following financial support for the research, authorship, and/or publication of this article: This work was supported by the Universidad de Guadalajara ['Convocatoria Apoyo a la Incorporación de Nuevos Profesores de Tiempo Completo PRODEP SEP 2018′, assigned to Professor number UDG PTC 1388 Luz Ma. Adriana Balderas Peña in document: 511-6/18-9169, date July 31, 2018]. All authors supported the APC.
Ethics Approval
This study was carried out according to the Declaration of Helsinki guidelines and was approved by the Institutional Review Board of the Comité Local de Investigación en Salud 1301, Instituto Mexicano del Seguro Social, México.
Informed Consent
Informed consent was obtained from all subjects involved in the study.
Data Availability
The data sets generated and/or analyzed during the current study are not publicly available because they are the property of the Instituto Mexicano del Seguro Social. Institutional and federal dispositions restrict unlimited access to personal data, but they are available from the corresponding author on reasonable request with prior authorization from the institution.