
Abstract
Objective:
To explore whether the different phases of the nasal cycle have a significant effect on nasal temperature, the nasal mucosal clearance rate, and levels of nasal nitric oxide (nNO) and to investigate the correlation between these nasal conditions.
Methods:
The study participants were divided into 2 groups: the control group and the rhinitis group. The participants’ nasal temperature, cilia clearance rate, and nNO levels were measured during different phases of the nasal cycle (the congestion phase and decongestion phase) in the control group and before and after undergoing inferior turbinate ablation in the rhinitis group.
Results:
The temperature of the nasal cavity in the control group was significantly higher in the congestion phase than in the decongestion phase (P = .0025), while in the rhinitis group, the temperature of the nasal cavity decreased significantly after inferior turbinate ablation (P = .001). In the control group, the nasal mucosa clearance time was significantly shorter in the congestion phase than in the decongestion phase (P = .001), and in the rhinitis group, the clearance time of the nasal mucosa was significantly shortened after the operation (P = .0025). In the control group, the levels of nNO were significantly higher in the congestion phase than in the decongestion phase (P = .025), while in the rhinitis group, nNO levels decreased significantly after the operation (P = .005).
Conclusion:
The function of the nasal cavity changes in different phases of the nasal cycle. Therefore, when evaluating the impact of various factors on nasal function, factors associated with the nasal cycle should also be considered. Inferior turbinate plasma ablation can improve the ciliary function of the nasal mucosa, reduce the temperature of the nasal cavity, and reduce nNO levels.
Keywords
Introduction
The physiological nasal cycle refers to the spontaneous alternate contraction and expansion of the blood vessels in the mucosa of the lower turbinate in normal functioning, which results in corresponding changes in the size of the 2 sides of the turbinate; when one side of the nasal cavity is in a state of contraction, the other side is in a state of relaxation, but the total airflow in both sides of the nasal cavity is essentially constant. 1 The turbinate regulates the intake airflow throughout the nasal cycle so that the total nasal resistance on both sides remains essentially the same, with no significant impact on normal respiratory function. 2 Most adults with normal nasal function have a nasal cycle that fluctuates between 0.5 and 7 hours. 2,3
Under normal circumstances, the nasal cavity has the function of regulating the temperature and humidity level of the inhaled air. 4,5 The indexes to evaluate the function of nasal mucosa include the frequency and velocity of the ciliary movement, the temperature of the nasal cavity, and the levels of nasal nitric oxide (nNO). 6 -8
Due to their physiological structure, nasal cilia are easily affected by external or physical factors, which may reduce the frequency of their swing and lead to an increase in nasal mucus concentration caused by rhinitis, haze, caused by the inhalation of particulate matter, and other factors. 9 The factors that affect the temperature of the nasal cavity include acute and chronic inflammation of the nasal cavity, allergic diseases of the nose and sinuses, and external temperature. When the external temperature is mainly constant, the normal nasal temperature is affected primarily by the state of relaxation and the contraction of the nasal mucosal vessels. 10 Inferior turbinate plasma ablation can improve nasal ventilation and has no impact on the clearing function of the cilia mucous and olfaction.
Nitric oxide (NO) is widely distributed through the various tissues of organisms and is a kind of biological messenger for molecules. 11 Its production mainly occurs in the epithelium and inflammatory cells of the inflammatory airway, and it is catalyzed by NO synthase. 12 -15 It is an important endogenous medium in the upper and lower respiratory tract. Gustafsson et al first showed the existence of fractional exhaled nitric oxide (FeNO) in 1991 and, in 1993, found that the content of FeNO in asthmatic patients was significantly increased. 16 The measurement of FeNO is also gradually being standardized, becoming a noninvasive method for the diagnosis and efficacy evaluation of respiratory diseases. 14,16,17 Nasal nitric oxide is mainly produced in the ciliated epithelial cells of the nasal sinuses and can increase ciliary activity. 18,19 Since Gustafsson et al’s study, there have been more reports on its use in clinical practice. 20 -23
However, there are few studies on the impact of congestion and decongestion on the function of the nasal mucosa, and some findings are inconsistent. 6 -8 The study of the nasal cycle takes a long time, and research methods vary greatly. Williams and Eccles 9 compared the application of nasal resistance and the visual analog scale (VAS) in the study of the nasal cycle and found that the correlation between these 2 variables was very high. Therefore, VAS can be used instead of the measurement of nasal resistance in the study of the nasal cycle.
The current study aimed to explore whether the different phases of the nasal cycle have any significant impact on nasal temperature, the nasal mucosal clearance rate, and nNO levels in healthy adults and patients with chronic hypertrophic rhinitis to explore the correlation between these factors and to determine whether the nasal cycle should be considered when evaluating the impact of various factors on nasal function.
Materials and Methods
Patients
This was a prospective study. Patients with rhinitis admitted to the Department of Otolaryngology, Head and Neck Surgery at our hospital between March 2019 and December 2019 were selected.
The rhinitis group consisted of 20 patients. Inclusion criteria: (1) adults older than 18 years; (2) patients who had chronic hypertrophic rhinitis and had been diagnosed. Exclusion criteria: (1) patients who smoked; (2) patients with incomplete clinical data. Of these patients, 9 were male and 3 were female. The average age of these patients was 35 years old (range: 18-47 years old). In the rhinitis group, the patients with chronic hypertrophic rhinitis were treated by bilateral inferior turbinate plasma radiofrequency ablation. The nasal temperature, nasal mucosal clearance time, and nNO levels were measured before surgery and 3 months after surgery.
The control group consisted of 12 participants with healthy nasal mucosa. Inclusion criteria: (1) adults older than 18 years; (2) without nose or pharyngeal diseases; and (3) without abnormal findings in the nasal endoscopy. Exclusion criteria: (1) participants who smoked; (2) participants who had had an upper respiratory tract infection in the previous 2 weeks. Of these participants, 8 were male and 4 were female. The average age of these participants was 24 years old (range: 20-27 years old). All the participants volunteered to participate in this study and provided informed consent. The ethics committee of our hospital approved the study.
Experimental Methods
Nasal cycle test
The 2 phases of the nasal cycle can be determined by the difference in nasal airway resistance between the 2 sides of the nose, which is at its largest when the air volume difference is 100 mL/s. Using the ATMOS-300 nose side pressure instrument (Germany), the active nose pressure was measured in all the patients every 30 minutes for 8 hours. During the test, the patients were allowed to perform minor activities such as talking, drinking, and eating. Based on the test results, the nasal temperature, cilia clearance rate, and nNO levels were measured in patients with a clear nasal cycle. All the patients in the control group and rhinitis group showed a significant presence of their current nasal cycle. However, after the operation, the nasal cycle was not detected in the rhinitis group.
Nasal temperature detection
The nasal cavity temperature was measured using the multiparameter life monitor uMEC6 (Mindray Medical International) with a probe diameter of 1 mm. During nasal cycle testing, if the difference in the nasal airflows between the 2 sides is more than 100 mL/s, the temperature of the nasal cavity can be measured. The temperature probe was inserted into the inferior nasal canal under a nasal endoscope. The participants continued to breathe calmly through the nose and the end-inspiratory and end-expiratory temperatures were measured 15 seconds after the insertion of the probe. The average of 6 measurements of 3 breaths was regarded as the result. The temperature of the other side of the nasal cavity was measured by the same method. The above measurements were repeated when the state of the nasal mucosa on both sides was reversed.
The detection of the cilium clearance rate of the nasal mucosa
A saccharin sodium block with a diameter of approximately 2 mm was used to measure the indexes of the left nasal cavity. The airflow in the nasal cavity was measured with a nasal manometer. If the difference in airflow between the 2 sides of the nasal cavity was more than 100 mL/s, the time of the nasal mucosa clearance was measured. The saccharin sodium block was placed at the bottom of the nasal cavity near the front of the inferior turbinate, the patients swallowed once every 30 seconds, and the interval from the time that the saccharin sodium was placed in the patient’s nose to the time that the patient tasted a sweet flavor was recorded. At the same time, the distance from the place where the saccharin sodium block was placed to the posterior nostril was measured. The clearance rate of the nasal mucosa was obtained by dividing the distance by the time. The test was repeated the following day. If the difference in airflow between the 2 sides of the nasal cavity was more than 100 mL/s, the nasal mucosa clearance rate was measured, but this test of the clearance rate of the nasal mucosa was carried out in a different mucosal state.
Detection of nNO
The airflow in the nasal cavity was measured with a nasal manometer. The nNO levels in both sides of the nasal cavity were measured when the difference in the nasal airflow between the 2 sides was more than 100 mL/s. The nNO measurements were performed using the NIOX MINO Airway Inflammation Monitor, a handheld electrochemical NO analyzer that measures NO by electroluminescence.
During the test, the laboratory temperature was controlled at 22 °C to 26 °C, and the humidity was 40% to 60%. The patient was placed in a sitting position. The temperature of the nasal cavity, the nNO levels, and the nasal mucosa clearance rate in one mucosal status were all measured on the same day.
Statistical Methods
All data were expressed as mean ± standard deviation (x ± SD). Data were statistically analyzed using SPSS1.9.0 software. Data were compared between the 2 groups using the t test and compared among multiple groups using univariate analysis of variance. P < .05 was considered statistically significant.
Results
The Temperature of the Nasal Cavity in the Different Phases
As shown in Table 1, in the control group, the temperature of the nasal cavity was 34.1 °C ± 0.95 °C in the congestion phase of the nasal mucosa and 32.66 °C ± 1.02 °C in the decongestion phase, and the difference between the congestion phase and decongestion phase was statistically significant (P = .0025). In the rhinitis group, the difference between the congestion phase and decongestion phase was also statistically significant (P = .001), with the temperature of the nasal cavity in the congestion phase (34.68 °C ± 1.06 °C) being higher than in the decongestion phase (32.52 °C ± 1.19 °C). The temperature after the operation was lower than that after the inferior turbinate ablation (P = .001).
The Temperature of the Nasal Cavity in the Different Phases.a
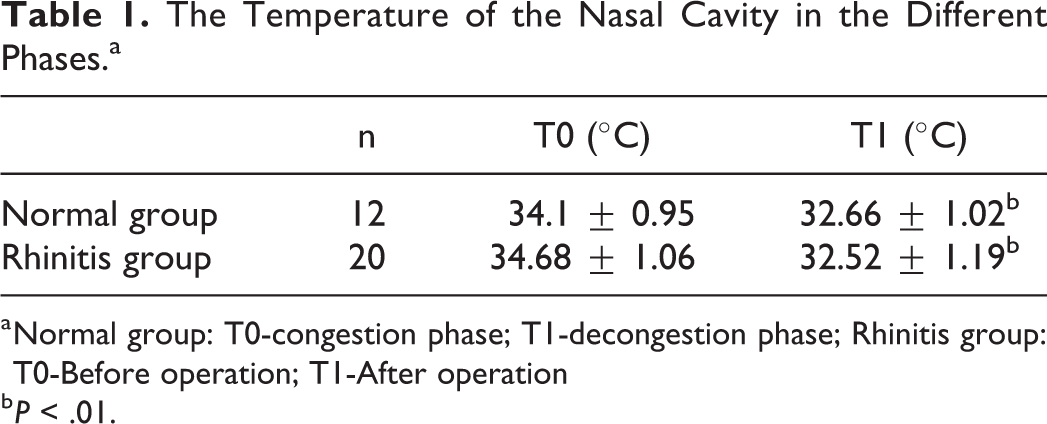
a Normal group: T0-congestion phase; T1-decongestion phase; Rhinitis group: T0-Before operation; T1-After operation
b P < .01.
The Clearance Time of the Nasal Mucosa in the Different Phases
In the control group, the clearance time of the nasal mucosa was 11.7 ± 1.9 minutes in the congestion phase and 14.7 ± 2.1 minutes in the decongestion phase, and the difference between the congestion phase and decongestion phase was statistically significant (P = .001). In the rhinitis group, the difference between before and after the operation was statistically significant (P = .0025, Table 2).
The Clearance Time of the Nasal Mucosa in the Different Phases.a
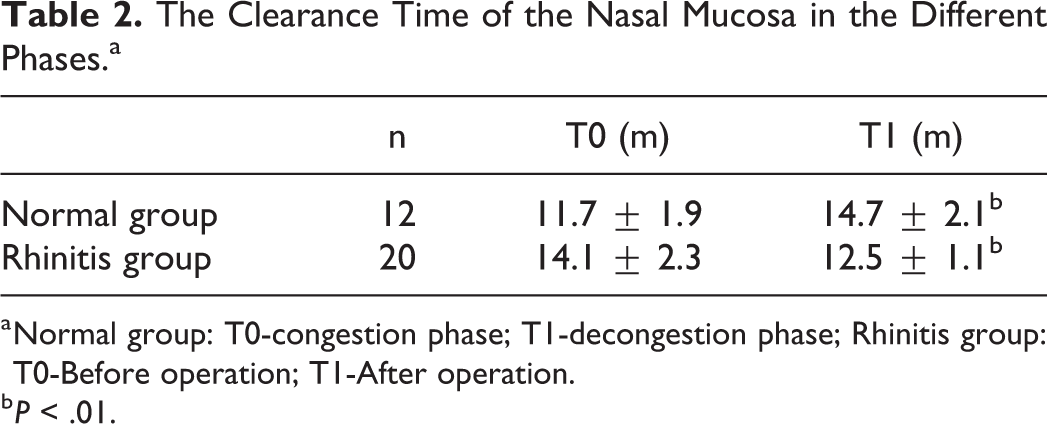
a Normal group: T0-congestion phase; T1-decongestion phase; Rhinitis group: T0-Before operation; T1-After operation.
b P < .01.
Nasal Nitric Oxide in the Different Phases
In the control group, the nNO level was 412 ± 132 ppb in the congestion phase and 358 ± 119 ppb in the decongestion phase, and the difference between the congestion phase and decongestion phase was statistically significant (P = .025). In the rhinitis group, the difference between the nNO levels before (442 ± 106 ppb) and after (362 ± 149 ppb) the operation was statistically significant (P = .005). Furthermore, before the operation, the difference in nNO levels between the rhinitis group and the control group in the congestion phase was statistically significant (P = .005), while after the operation, the difference between the rhinitis group and the control group in the decongestion phase was not statistically significant (P = .076, Table 3).
nNO in the Different Phases.a
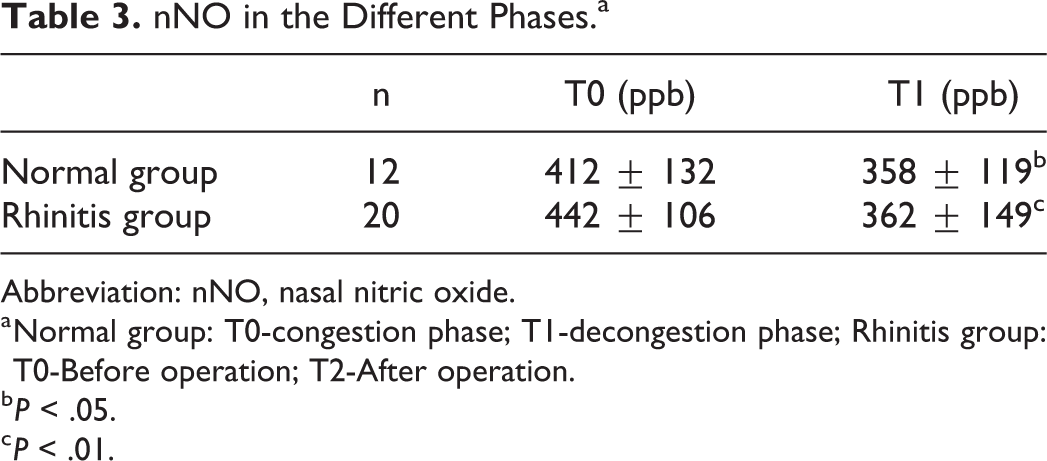
Abbreviation: nNO, nasal nitric oxide.
a Normal group: T0-congestion phase; T1-decongestion phase; Rhinitis group: T0-Before operation; T2-After operation.
b P < .05.
c P < .01.
Discussion
This study revealed that, in the control group, when the nasal mucosa was in the congestion phase, the nasal airway resistance and the temperature of the nasal cavity increased, while in the decongestion phase, the temperature of the nasal cavity decreased. When the airflow difference between the 2 sides of the nasal cavity was 100 mL/s, the difference between the 2 sides was statistically significant (P = .0025). The results reveal that turbinectomy leads to a decrease in the volume of the blood vessels, which implies that temperature is an indirect metric of blood vessel volume. This would be consistent with the findings of the tests on healthy patients. These results suggest that factors relating to the nasal cycle should be considered when measuring the temperature of the nasal cavity. This is consistent with the results of Li et al, who found that the nasal temperature during the nasal mucosa congestion period was 33.5 °C, while the nasal temperature during the decongestion period was 32.3 °C, and the comparison between the 2 was statistically significant (P = .001). 24
The results of the present study demonstrated that the difference in the temperature of the nasal cavity before and after inferior turbinate plasma ablation was statistically significant (P = .001), and the patients’ nasal cavity temperature after the operation was lower than before the operation. The results also revealed that the impact of the surgery on the volume vessels in the inferior turbinate resulted in a decrease in the temperature of the nasal cavity.
The first line of defense in the nasal cavity is the mucociliary clearance system. Therefore, the indexes for evaluating the function of the nasal mucosa include the frequency of cilia movement and the time of cilia clearance of the nasal mucosa. The saccharin technique is a reliable method for evaluating the ciliary function of the nasal mucosa, which reflects not only the outer layer of mucus but also the movement of the peripheral layer cilia, as there is a good correlation between the 2. 10 In the control group, when the nasal mucosa was in the congestion phase, the clearance time of the nasal mucociliary for saccharin was faster, when the nasal mucosa was in the decongestion phase, the clearance time of the nasal mucociliary for saccharin was slower, and when the airflow difference between the 2 sides of the nasal cavity was 100 mL/s, the difference between the 2 sides was statistically significant (P = .001). The results, therefore, revealed that factors relating to the nasal cycle should be fully considered in the measurement of the cilia clearance rate of the nasal mucosa. The difference in the clearance time of the nasal mucosa before and after inferior turbinate plasma ablation was statistically significant (P = .0025), and the clearance time of the nasal mucosa was significantly shortened after the operation. The results also reveal that inferior turbinate plasma ablation can improve the ciliary function of the nasal mucosa. Li et al found that the clearance time of nasal mucosa was 9.5 minutes when the nasal mucosa was in the congested stage and 14.5 minutes when the nasal mucosa was in the hypocongested stage, and the comparison between the 2 was statistically significant (P = .0025). 25 These research results are consistent with those of the present study.
Although sympathetic changes may account for the differences in transport rates, the reason for a mucociliary clearance difference during the nasal cycle is not yet completely understood. The bioactive substances in the nasal mucus blanket and the nasal pH play an important role in maintaining the normal cleaning function of the nasal cavity, and these factors may differently affect the nasal mucosa clearance at the same point of the nasal cycle.
Although nNO has been used in clinical tests before, most of the participants in these tests were only measured for nNO in one side of the nasal cavity, and before this study, there were no reports on the differences in the measured values of nNO between the 2 sides of the nasal cavity. This study revealed that, in the control group, when the nasal mucosa was in the congestion phase, the nNO levels decreased, when the nasal mucosa was in the decongestion phase, the nNO levels increased, and when the airflow difference between the 2 sides of the nasal cavity was 100 mL/s, the difference between the 2 sides was statistically significant (P = .025). The results suggest that the nNO levels change in the different phases of the nasal cycle and that the factors relating to the nasal cycle should be considered in the detection of nNO in the nasal cavity. In determining nNO, to reduce the impact of the nasal cycle, the levels in both sides of the nasal cavity should be measured at the same time. In the rhinitis group, the difference in the nNO levels of the nasal cavity before and after inferior turbinate plasma ablation was statistically significant (P = .025), nNO levels were lower after the operation, and the difference was not statistically significant when compared with the control group (P = .67). The results of this study suggest that the surgery improved nasal ventilation, reduced the inflammation of the nasal cavity, and consequently reduced the levels of nNO. It is worth noting that due to the limited experimental time, the sample size included in this study was small. We will expand the sample size in future experiments.
Conclusion
In the healthy population, the differences in the temperature of the nasal cavity, the clearance time of the nasal mucosa, and the levels of nNO between the congestion and decongestion phase are statistically significant. The results of the present study suggest that the function of the nasal cavity is different, to some extent, in the different phases of the nasal cycle. Therefore, when evaluating the impacts of the various factors on nasal function, the nasal cycle should be considered. In the rhinitis group, after the operation, the inferior turbinate shrank, the inflammation of the nasal cavity reduced, the temperature of the nasal cavity decreased, the clearance time of the nasal mucosa shortened, and the nNO levels decreased. These results suggest that surgery can improve nasal ventilation, reduce the inflammation of the nasal cavity, and reduce the levels of nNO.
Footnotes
Authors’ Note
This study was conducted with approval from the Ethics Committee of The No 1 Hospital of Huaian. This study was conducted in accordance with the declaration of Helsinki. Written informed consent was obtained from all participants.
Acknowledgments
The authors are particularly grateful to all the people who have given us help on our article.
Declaration of Conflicting Interests
The author(s) declared no potential conflicts of interest with respect to the research, authorship, and/or publication of this article.
Funding
The author(s) received no financial support for the research, authorship, and/or publication of this article.