
Abstract
Objectives:
This study was performed to test the clinical applicability of a new taste test—the waterless empirical taste test (WETT).
Methods:
Sixty healthy volunteers and 20 patients with oral cancer were enrolled. They all received the conventional solution-based whole-mouth suprathreshold taste test (WMTT), which contained sucrose, citric acid, sodium chloride, and caffeine solutions for tastants, along with the WETT. The WETT used plastic strips to deliver tastants. The strip was embedded with sucrose, citric acid, sodium chloride, caffeine, or monosodium glutamate taste enhancer in 4 different concentrations. Each strip was tested twice. Thirty of the healthy volunteers received the WETT again to measure a retest reliability. Case–control matching by age and gender was used to compare the scores of WMTT and WETT between 13 healthy volunteers and 13 patients with oral cancer.
Results:
The correlation was not high between the WMTT and WETT (r < 0.7) whether in the healthy volunteers or in patients with oral cancer. In terms of retest reliability of the WETT, the mean total score was 24.9 ± 7.3 for the first test and 25.8 ± 8.4 for the second test. The intraclass correlation coefficient was 0.85 (P < .001). When case–control matching was performed, the WMTT scores were not significantly different between 13 healthy volunteers and 13 patients with oral cancer (P = .266), but the WETT scores were significantly lower in patients with oral cancer (P = .017).
Conclusion:
This study showed that the results of the WETT were not highly correlated with those of the WMTT. However, its retest reliability was high, and its results were significantly different between the healthy volunteers and the patients with oral cancer.
Keywords
Introduction
The sense of taste is often overlooked by physicians. 1 The prevalence of patients with taste problems was estimated to be approximately 26.3 million among the US population aged 40 years and older in the National Health and Nutrition Examination Survey 2013 to 2014. 2 Patients with taste problems may have anxiety, depression, or nutritional deficiencies. 1 In order to make a correct diagnosis and provide adequate management for those with taste dysfunction, a comprehensive assessment of a person’s taste function is necessary. 3 Traditionally, taste function has been evaluated using solution-based taste tests.4,5 These tests have been reported as being reliable in measuring taste function. 6 However, there are some drawbacks with solution-based taste tests. For one, they are usually commercially unavailable. 7
Several taste tests centered on tablets, edible wafers and taste strips have been developed to overcome the shortcomings of solution-based taste tests. 7 Another new taste test called the waterless empirical taste test (WETT, Sensonics International) is now on the market. This test is comprised of a series of disposable plastic strips whose tastants include monosodium glutamate (umami taste), in addition to the traditional ones of sucrose, citric acid, sodium chloride, and caffeine. The aim of this study was to test WETT’s clinical applicability by comparing it with the conventional solution-based whole-mouth suprathreshold taste test (WMTT).
Materials and Methods
Participants
Sixty healthy volunteers with a normal self-rated taste function and 20 patients with oral cancer who had received surgery for treatment were enrolled in this study from April 2019 to January 2020. Any healthy volunteer who had a history of oral or middle ear surgery or had acquired an acute oral infection was excluded. All eligible participants took WMTT and WETT to assess their taste function. Thirty of the healthy volunteers received another WETT at least 1 day later for evaluation of retest reliability. This study was approved by the Ethics Committee of Taichung Veterans General Hospital (institutional review board number: CF19054B). Informed consents were collected from all enrolled participants.
Among the healthy volunteers were 30 males and 30 females, with their ages ranging from 26 to 69 years and having a mean of 46.9 (±11.6) years. Among the patients with oral cancer were 17 males and 3 females, with their ages ranging from 46 to 75 years and having a mean of 62.4 (±8.4) years. Case–control matching by age and gender was used to compare the scores of each taste and all tastes between the healthy volunteers and patients with oral cancer for the WMTT and WETT. The matching criteria were the same gender and age difference below 5 years. This resulted in 13 pairs of healthy volunteers and patients with oral cancer. There were 10 males and 3 females in either group. The ages ranged from 45 to 69 years, with a mean of 58.5 (±7.5) years in the healthy volunteers, and ranged from 46 to 74 years, with a mean of 58.8 (±7.8) years in the patients with oral cancer.
Taste Tests
In this study, the taste function was measured by both WMTT 8 and the new WETT. There was a minimum 10-minute break between taste tests. In healthy and oral cancer groups, participants received the WMTT and WETT in a random order.
The Waterless Empirical Taste Test used 5 different suprathreshold concentrations of 4 basic tastant solutions. These solutions were prepared following the methods of Doty et al. 9 Powders of sucrose, citric acid, sodium chloride (I Chan chemical Ltd), and caffeine (Uni-Onward Corp) were individually dissolved in distilled water to prepare the following tastant solutions: sweet solution (concentrations of sucrose: 0.08, 0.16, 0.32, 0.64, and 1.28 mol/L), sour solution (concentrations of citric acid: 0.0026, 0.0051, 0.0102, 0.0205, and 0.0410 mol/L), salty solution (concentrations of sodium chloride: 0.032, 0.064, 0.128, 0.256, and 0.512 mol/L), and bitter solution (concentrations of caffeine: 0.0026, 0.0051, 0.0102, 0.0205, and 0.0410 mol/L).
Prior to the start of the WMTT, all participants were asked not to smoke or eat for at least 1 hour. A small cup containing 10 mL of each tastant solution was presented in a counterbalanced order. The participants sipped, swished the solution around in the mouth for 10 seconds, and expectorated. A multiple forced-choice procedure was performed to produce a participant’s answer. They were asked to select 1 of the 4 tastes (sweet, sour, salty, or bitter) for each solution, or make a best guess if they were in doubt. One point was scored if a correct identification of the taste was made. Between successive cups, the participants were instructed to rinse their mouths with distilled water. Each of the 5 suprathreshold concentrations for the 4 tastant solutions was presented twice, with a total of 40 tests being performed for a 40 score maximum for completely correct quality identification. Usually, it took about 30 minutes to complete a WMTT.
The WETT (Sensonics International) is comprised of a series of disposable plastic strips. The tip of each strip has a small pad, which is made of monomer cellulose and is embedded with either sucrose, citric acid, sodium chloride, caffeine, or monosodium glutamate tastants (Figure 1). Each tastant contains 4 different concentrations (sucrose: 0.20, 0.10. 0.05, and 0.025 g/mL; citric acid: 0.20, 0.10. 0.05, and 0.025 g/mL; sodium chloride: 0.25, 0.125. 0.0625, and 0.0313 g/mL; caffeine: 0.088, 0.044. 0.022, and 0.011 g/mL; monosodium glutamate: 0.135, 0.068. 0.034, and 0.017 g/mL). In each test, strips with 4 different concentrations of all 5 tastants were presented twice in a counterbalanced order. A single WETT also incorporates 13 strips, whose pads are made only of monomer cellulose, without any tastant embedded to make a total of 53 tests. The 13 blank strips are interspersed throughout the whole test in a specific pattern to negate the need for rinsing with water between the ordinary tastant tests (Figure 2).
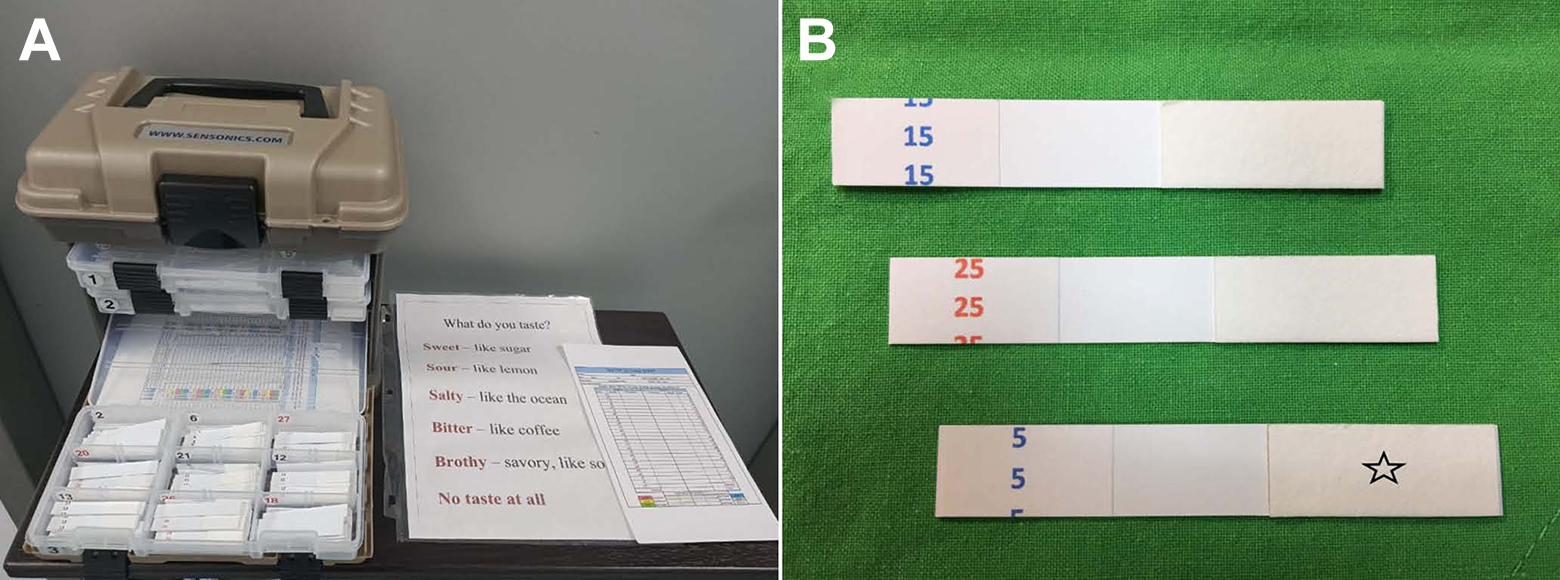
(A) Waterless empirical taste test. (B) A small pad (star) on the tip of the taste strip.
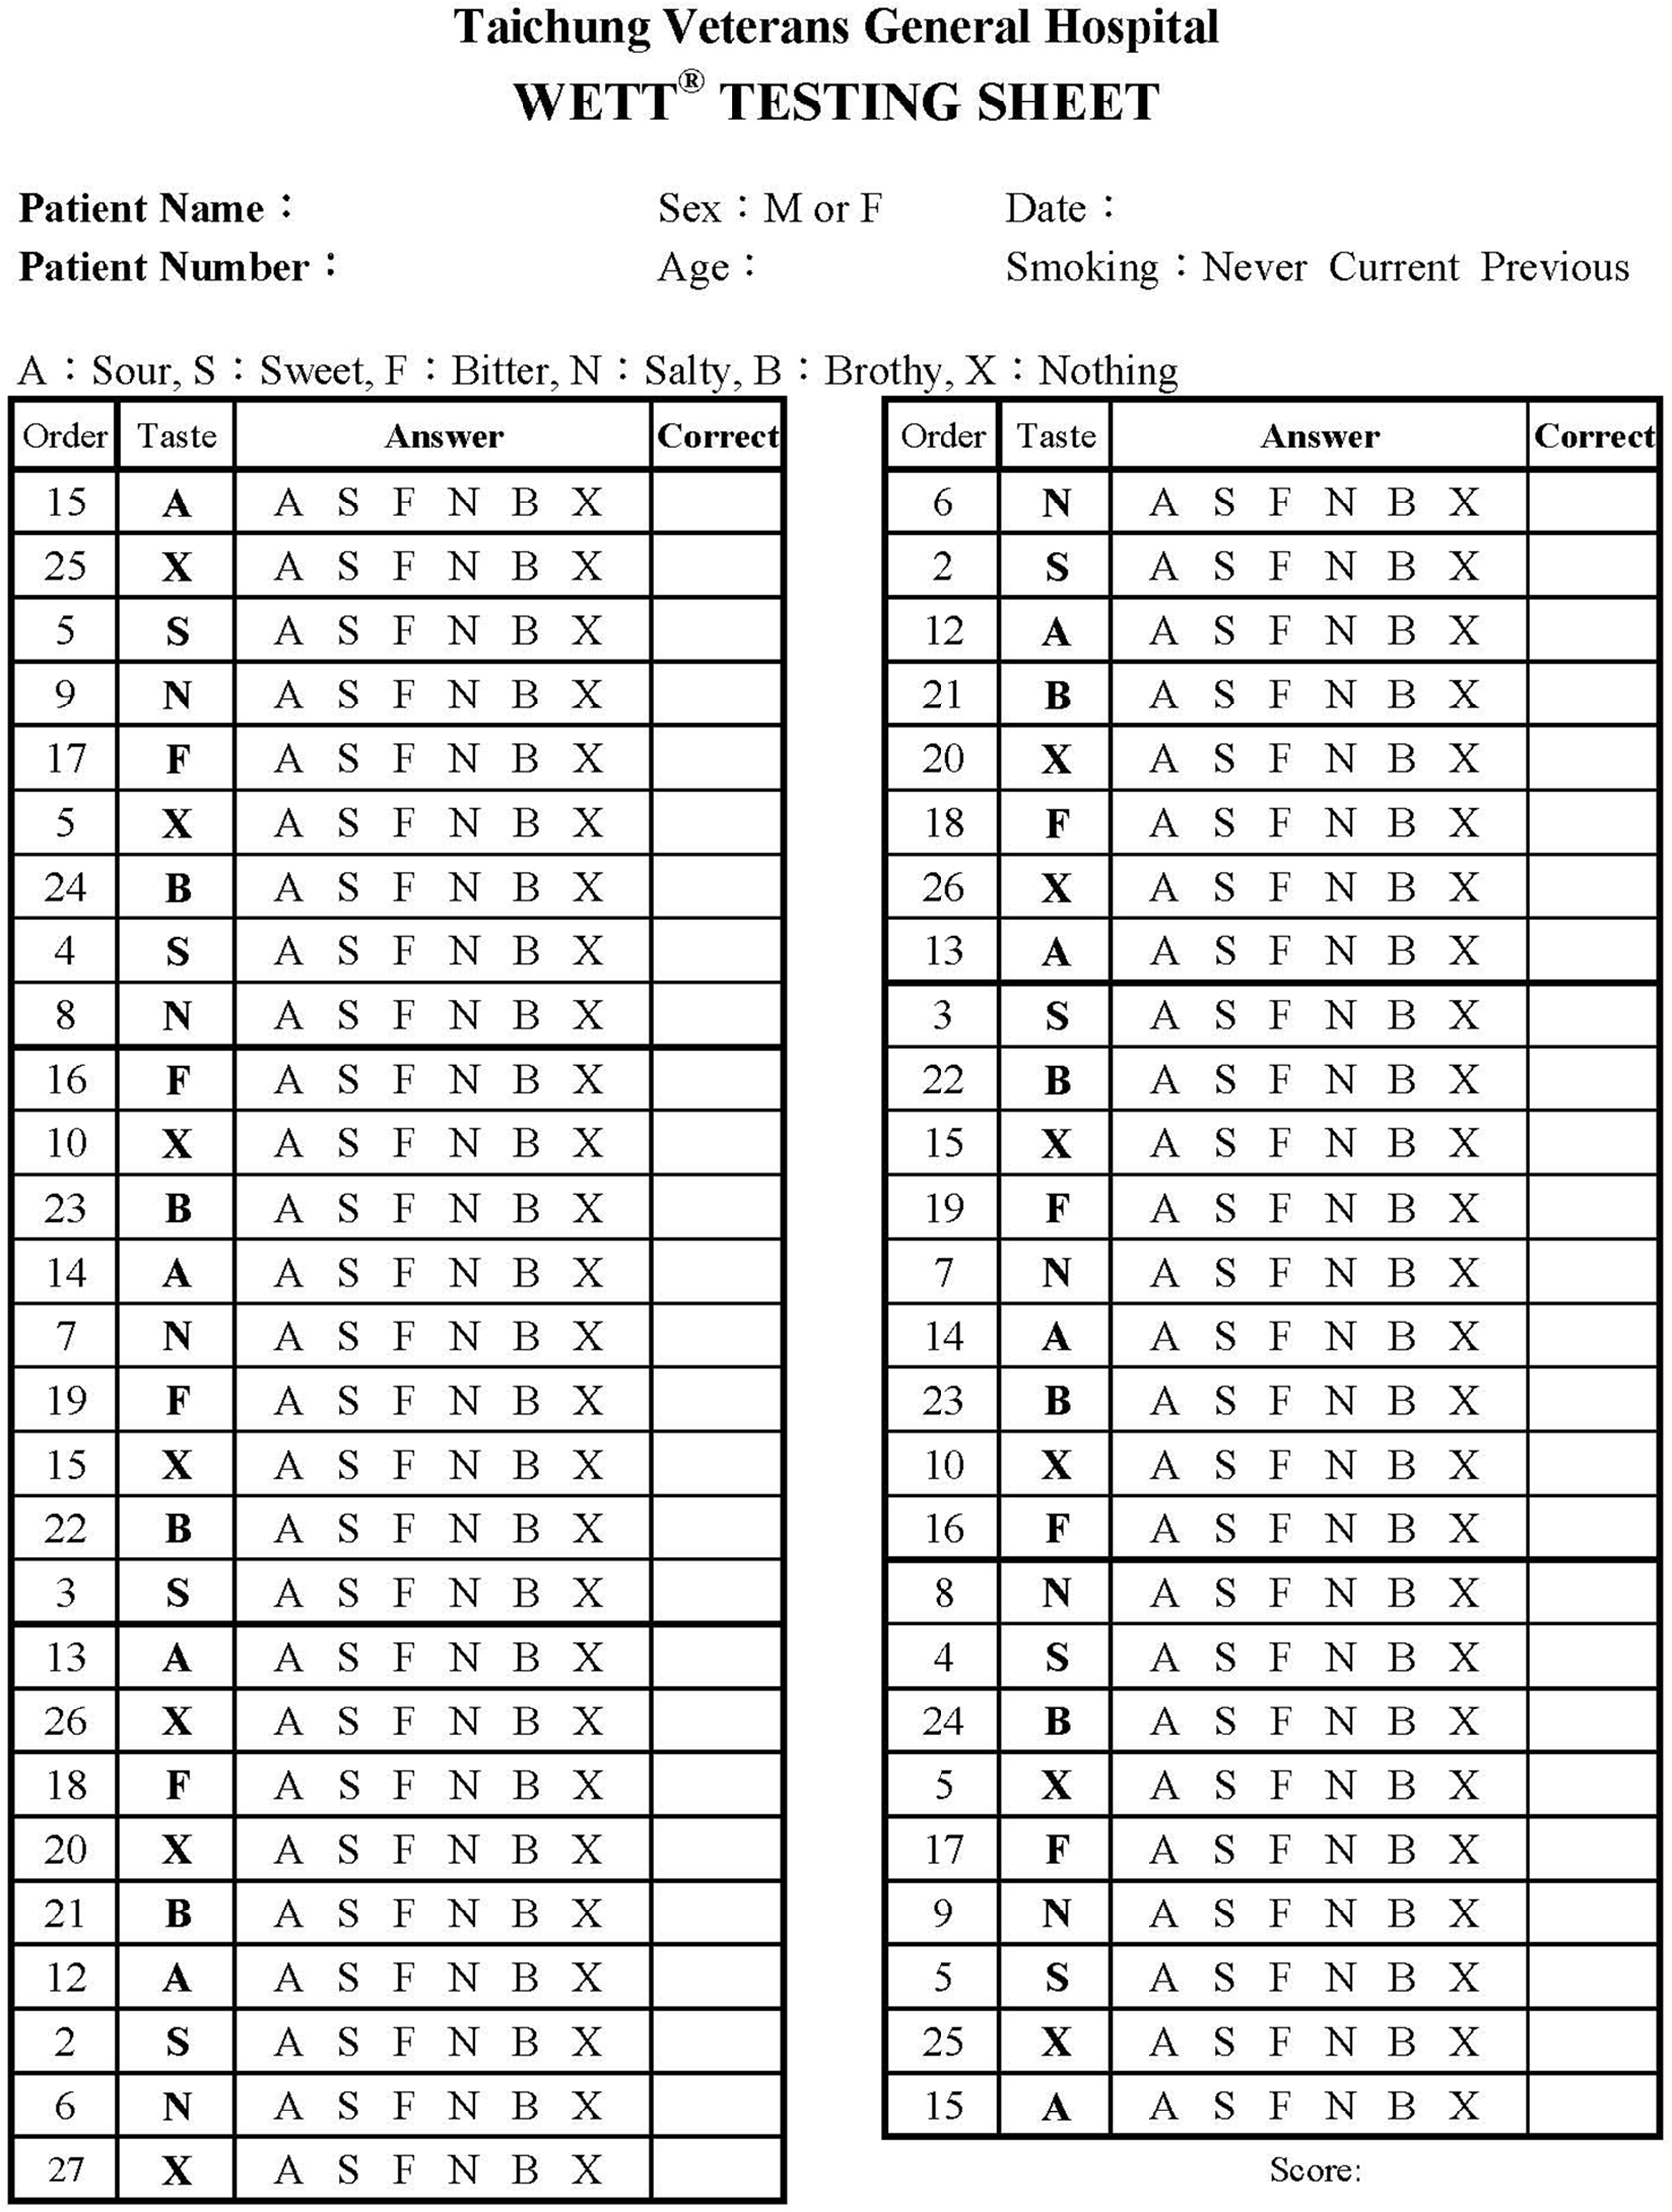
The testing sheet showing the presenting sequence of tastes. A means the small pad in the tip of the strip is embedded with citric acid, and X means blank strips.
At the beginning of the WETT, all participants were handed a strip. The participants put the pad on the tip of the strip, placed it in the middle of the tongue, closed the mouth, and moved the strip slightly around. 4 When the participants thought they had tasted the strip, they were asked to select 1 of the 6 answers (sweet, sour, salty, bitter, brothy, or no taste at all). One point was scored if a correct answer was made, the scores from the 13 blank strips were not used for analysis of the scoring of the test, thus generating a 40 score maximum for completely correct quality identification. Usually, it took about 10 to 15 minutes to complete a WETT.
Statistical Analyses
Descriptive data are presented as means ± standard deviations. The Wilcoxon signed-rank test was used to compare the ratios of correct quality identification between the WMTT and WETT, as well as the scores of correct quality identification between the first and second tests of WETT. The scores of each taste and all 4 tastes were correlated between the WMTT and WETT using Spearman ρ in both the healthy volunteers and patients with oral cancer. The composite scores of WMTT and WETT were compared between the healthy volunteers and patients with oral cancer using a receiver operating characteristic (ROC) curve. Retest reliability of WETT was tested by intraclass correlation coefficient (ICC) and Bland-Altman plot. Case–control matching by age and gender was used to compare the scores of each taste and all tastes between the healthy volunteers and patients with oral cancer for the WMTT and WETT. All computation was performed using SPSS version 17.0. Two-tailed P values <.05 were considered to be statistically significant.
Results
In the 60 healthy volunteers, the score of correct quality identification of WMTT ranged from 9 to 10 with a mean of 9.9 (±0.3) for the sweet solution, 0 to 10 with a mean of 8.7 (±2.0) for the sour solution, 5 to 10 with a mean of 9.3 (±1.1) for the salty solution, and 4 to 10 with a mean of 9.3 (±1.5) for the bitter solution. The total score of 4 solutions ranged from 25 to 40, with a mean of 37.3 (±3.6). In the 20 patients with oral cancer, the score of correct quality identification ranged from 7 to 10 with a mean of 9.5 (±1.0) for the sweet solution, 2 to 10 with a mean of 7.8 (±2.5) for the sour solution, 4 to 10 with a mean of 8.2 (±2.2) for the salty solution, and 0 to 10 with a mean of 7.4 (±3.1) for the bitter solution. The total score of 4 solutions ranged from 20 to 40, with a mean of 32.8 (±6.5). The ROC analysis of composite scores of 4 solutions between the healthy volunteers and patients with oral cancer showed the area under the curve was 0.63 (P = .259; Figure 3). Table 1 presents the comparison of the scores of correct quality identification of WMTT between the 13 pairs of healthy volunteers and patients with oral cancer. There were no significant differences for each taste score and the total score of 4 tastes.
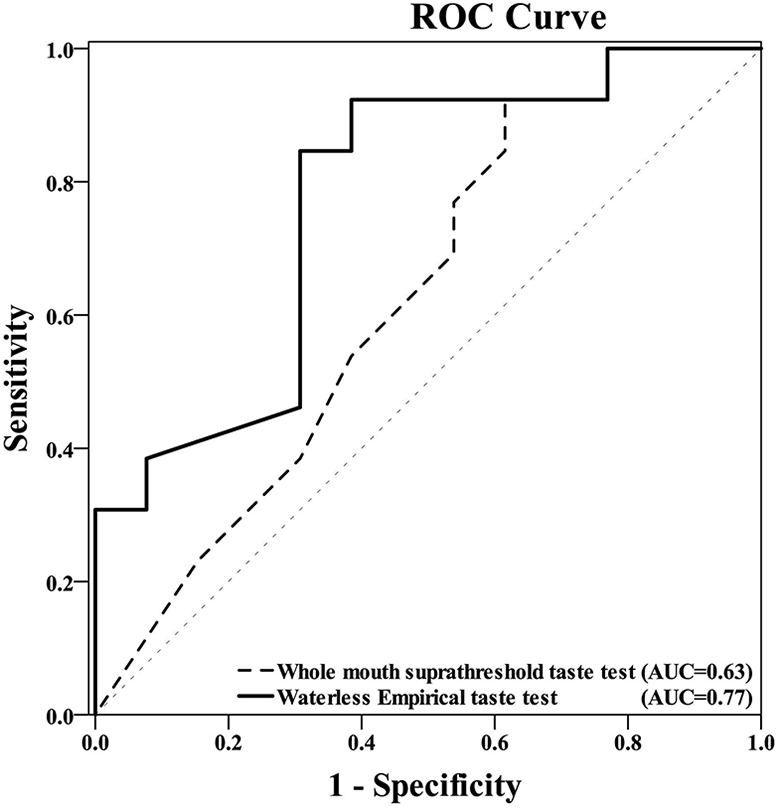
Receiver operating characteristic curves showing composite scores between the healthy volunteers and patients with oral cancer.
Comparison of the Scores of Correct Quality Identification Between 13 Pairs of Healthy Volunteers and Patients With Oral Cancer.
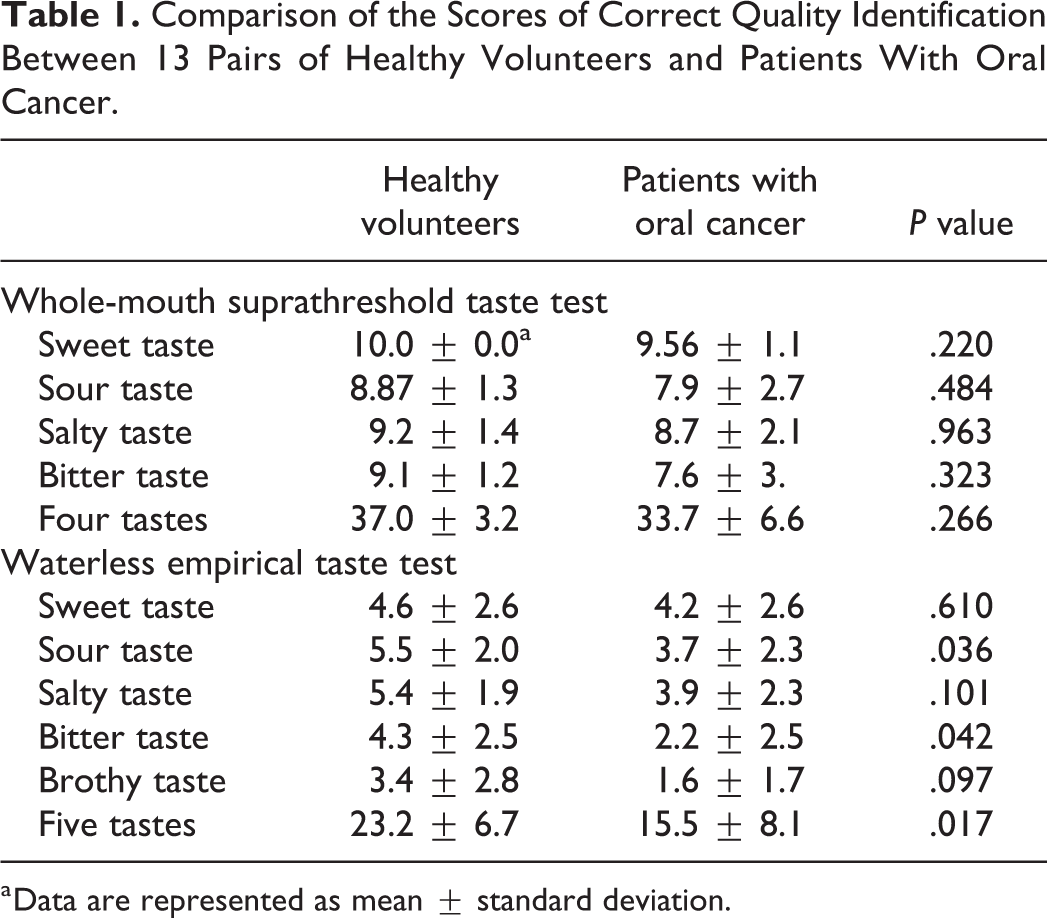
a Data are represented as mean ± standard deviation.
In the 60 healthy volunteers, the score of correct quality identification of WETT ranged from 0 to 8 with a mean of 5.3 (±2.3) for the sweet solution, 1 to 8 with a mean of 6.3 (±1.9) for the sour solution, 1 to 8 with a mean of 5.4 (±1.9) for the salty solution, 0 to 8 with a mean of 5.3 (±2.3) for the bitter solution, and 0 to 8 with a mean of 3.7 (±2.6) for the brothy solution. The total score of 5 solutions ranged from 9 to 39, with a mean of 26.0 (±6.6). In the 20 patients with oral cancer, the score of correct quality identification ranged from 0 to 8 with a mean of 3.6 (±2.6) for the sweet solution, 0 to 6 with a mean of 3.5 (±2.3) for the sour solution, 0 to 7 with a mean of 3.4 (±2.4) for the salty solution, 0 to 7 with a mean of 1.8 (±2.2) for the bitter solution, and 0 to 5 with a mean of 1.8 (±1.6) for the brothy solution. The total score of 5 solutions ranged from 0 to 27, with a mean of 14.0 (±7.6). The ROC analysis of composite scores of 5 solutions between the healthy volunteers and patients with oral cancer showed the area under the curve was 0.772 (P = .018; Figure 3). The comparison of the scores of correct quality identification of WETT between the 13 pairs of healthy volunteers and patients with oral cancer is presented in Table 1. Healthy volunteers acquired higher scores for the sour and bitter tastes and the all total score of 5 tastes compared to the patients with oral cancer.
Among the 60 healthy volunteers, there were 30 who received the second test of WETT to evaluate retest reliability. The comparison of the scores from the first and second tests is presented in Table 2. There were no significant differences between the scores of the first and the second tests for each taste and all 5 tastes. The ICC of the scores from the first and the second tests were 0.651 (P < .001) for the sweet taste, 0.86 (P < .001) for the sour taste, 0.536 (P = .001) for the salty taste, 0.681 (P < .001) for the bitter taste, 0.77 (P < .001) for the brothy taste, and 0.85 (P < .001) for all 5 tastes. Figure 4 showed the Bland-Altman plots of the first and the second tests.
Comparison of the Scores of Correct Quality Identification of Waterless Empirical Taste Test Between the First and Second Tests.
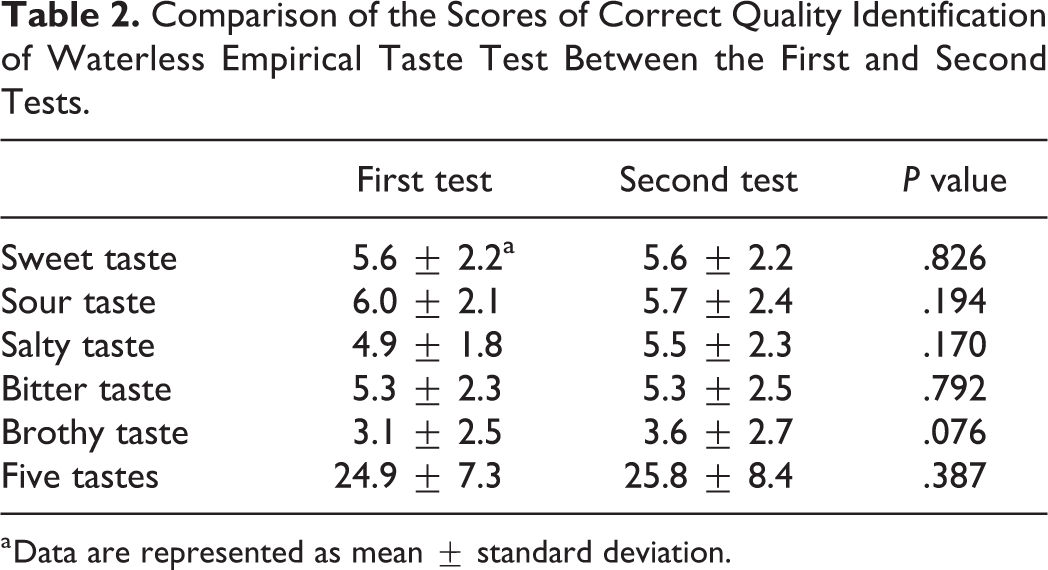
a Data are represented as mean ± standard deviation.
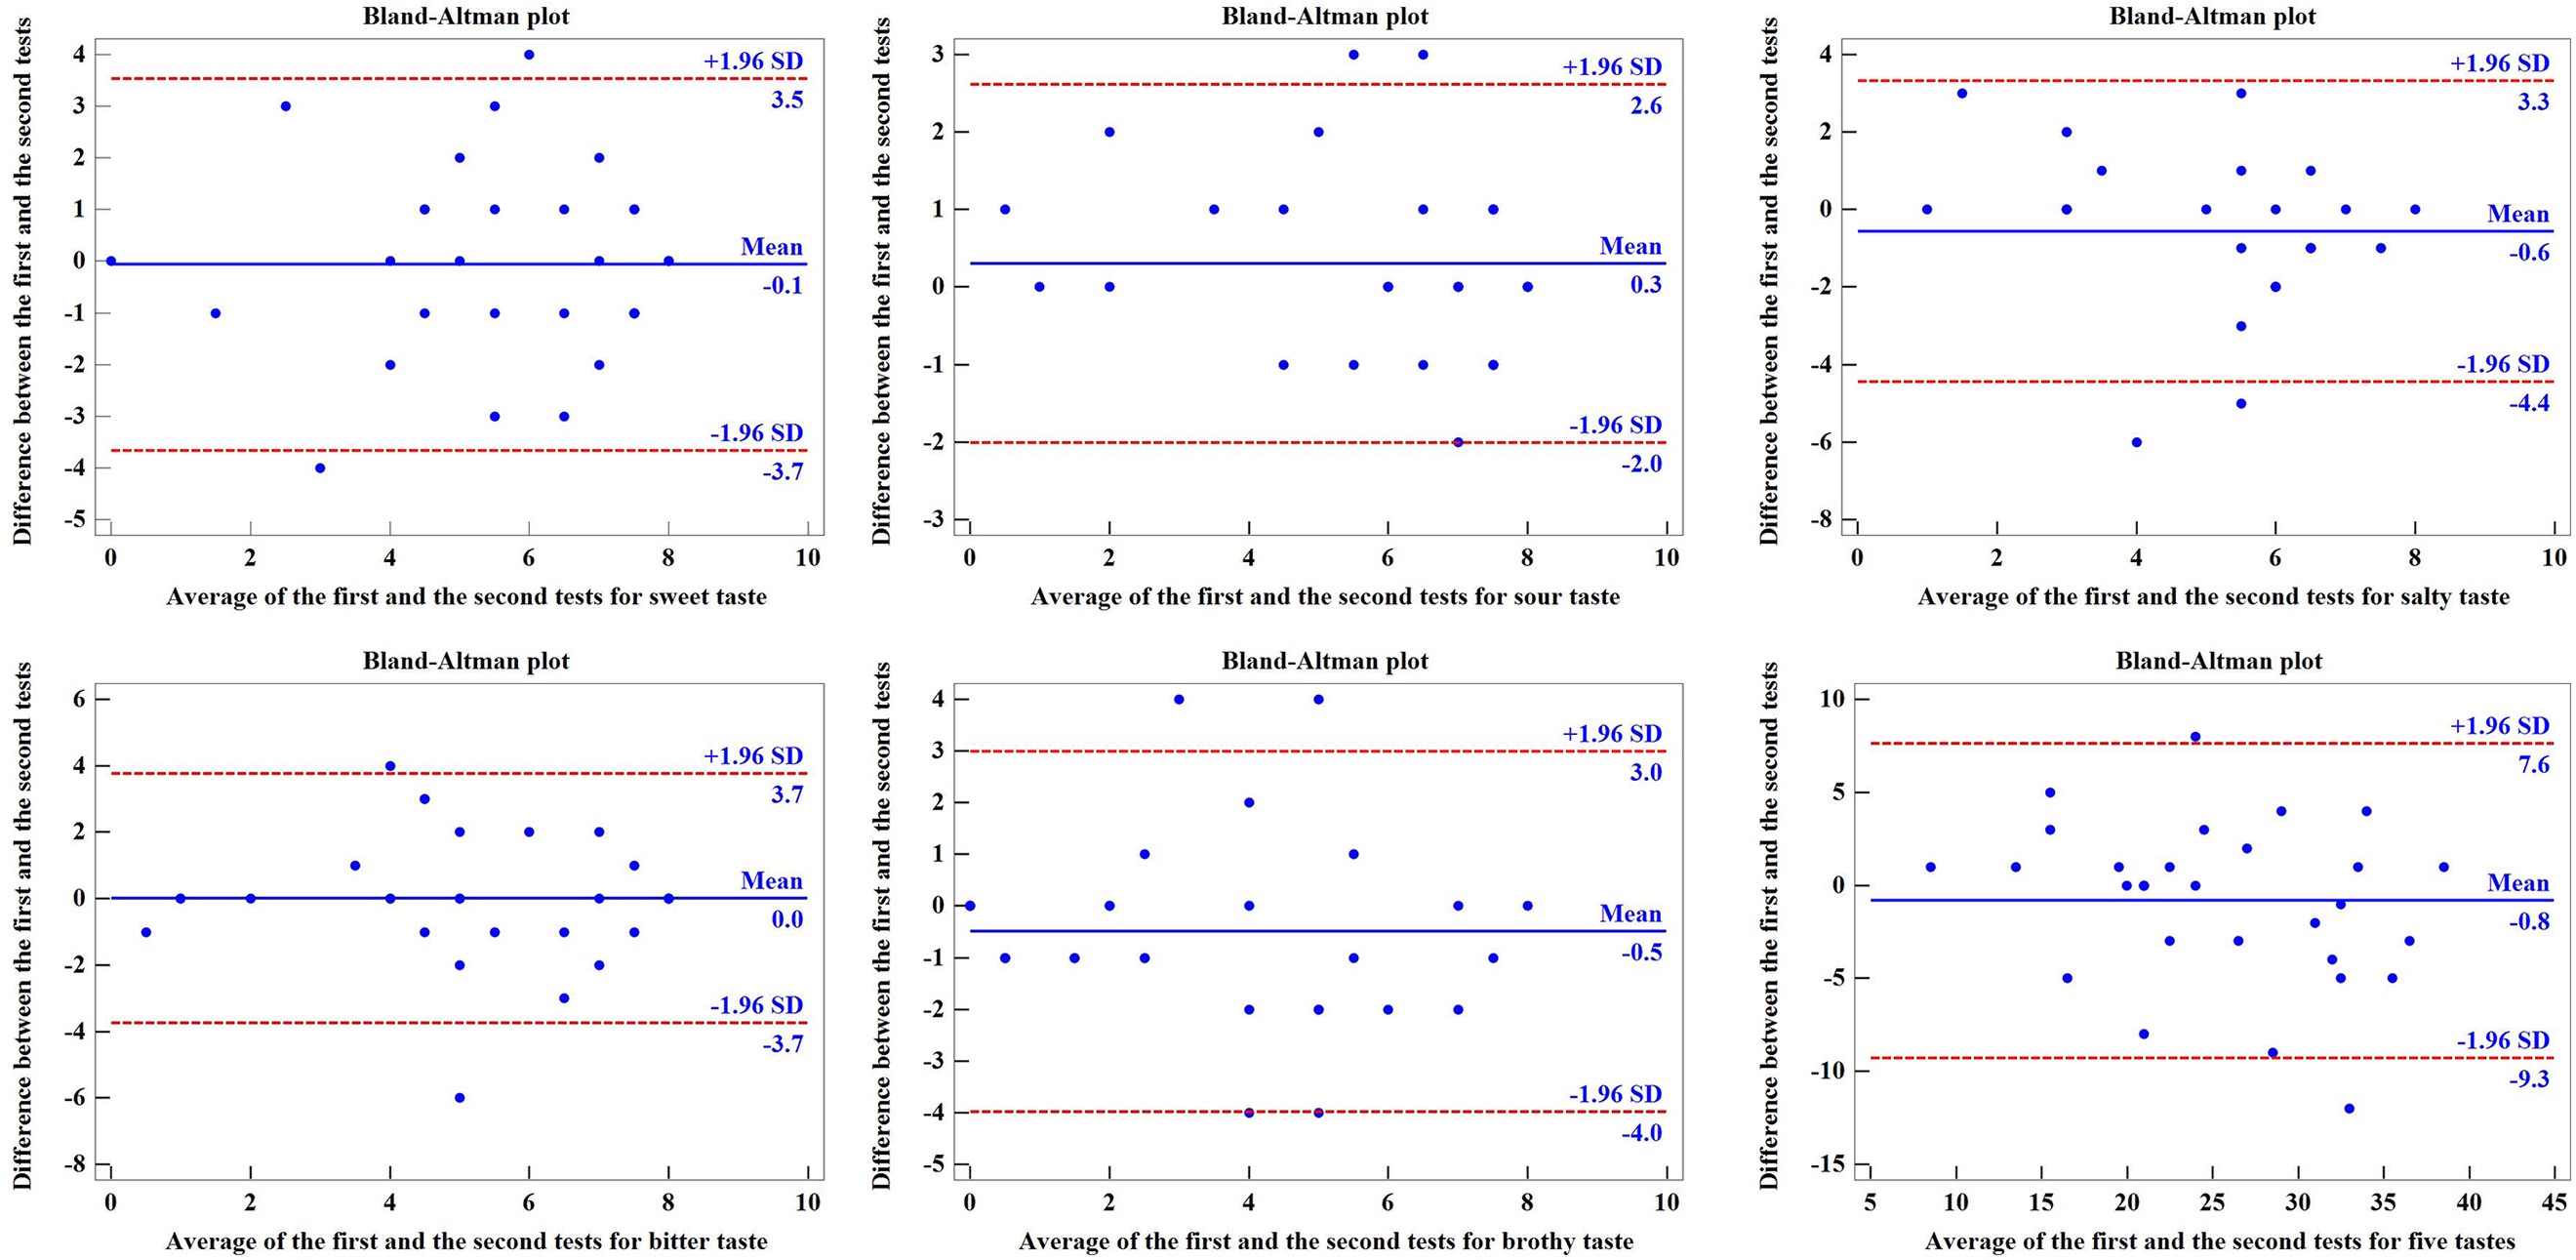
The Bland-Altman plots of scores of the first and second tests in 30 healthy volunteers.
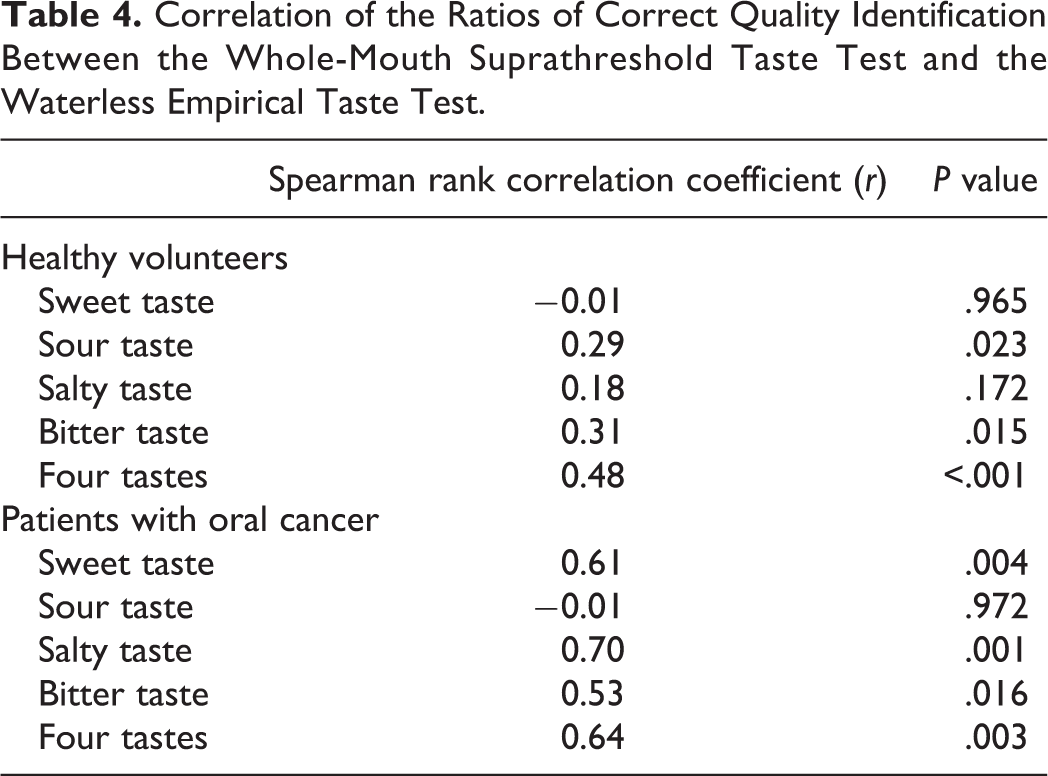
Table 3 presents the comparison of the ratios of correct quality identification between the WMTT and WETT in the 60 healthy volunteers and 20 patients with oral cancer. The ratio of correct quality identification was calculated using the score of correct quality identification divided by the sum of the scores of correct and incorrect quality identification. The ratio of correct quality identification from the WETT was significantly lower than that of the WMTT for each taste and all 4 tastes (sweet, sour, salty, and bitter), whether in the healthy volunteers or patients with oral cancer. Table 4 presents the correlation of the ratios of correct quality identification between the WMTT and WETT in the 60 healthy volunteers and 20 patients with oral cancer. The correlation was not high (r < 0.7) between the WMTT and WETT for each taste and all 4 tastes (sweet, sour, salty, and bitter) in the healthy volunteers, and for the sweet, sour, and bitter taste and all 4 tastes in the patients with oral cancer.
Comparison of the Ratios of Correct Quality Identification Between the Whole-Mouth Suprathreshold Taste Test and the Waterless Empirical Taste Test.
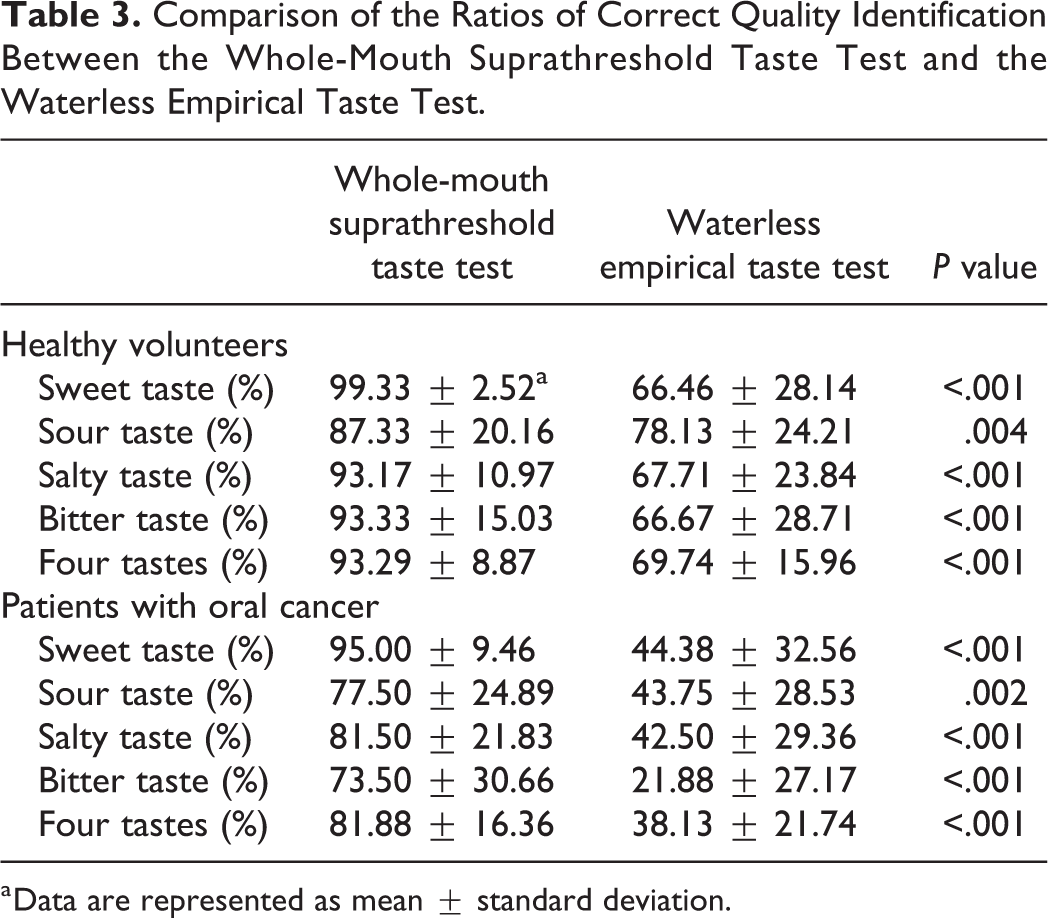
a Data are represented as mean ± standard deviation.
Correlation of the Ratios of Correct Quality Identification Between the Whole-Mouth Suprathreshold Taste Test and the Waterless Empirical Taste Test.
Discussion
The WETT is a newly acknowledged taste test. It is commercially available and easy to obtain. Because it uses strips, the testers do not need to prepare the tastant solutions. Moreover, it can be self-administered like other strip tests. 10 On the other hand, it includes umami and blank tastes to make the test more comprehensive as compared to traditional taste tests.11,12 As the WETT includes a blank taste, it does not use the multiple forced-choice method to produce a participant’s answer as most taste tests do. 7 Differences in the results between forced-choice and nonforced-choice procedures used in the taste tests had been detected. 13 This may partially explain why WETT scores were lower than the traditional WMTT scores. Another favorable feature of WETT is its applicability. Waterless empirical taste test can be used as a regional taste test, similarly to other strip tests. 7 The strip is placed on different regions of the tongue to test its taste function ability. It can also be applied for the purpose of whole-mouth testing, as was done in this study. 10
The WETT is similar to a validated taste test known as “taste strips.” The “taste strips” test was initially reported by Mueller et al. 14 It consists of 16 strips that are impregnated with 1 of 4 different concentrations of 4 basic tastes, as well as 2 tasteless strips, to form a maximum sensitivity score of 16 and a maximum score of 18. 15 As mentioned earlier, the WETT includes 5 tastes with 4 different concentrations each to set a maximum sensitivity score of 40, along with 13 tasteless strips that are interspersed throughout the test. However, until now, the WETT has not been well validated.
In this study, a whole-mouth testing procedure was performed using the WETT because healthy volunteers were tested, and whole-mouth testing reflects better general taste sensitivity. 4 The ratio of correct quality identification from the WETT was significantly lower than that of the WMTT, whether the tests were performed in normal volunteers or patients with oral cancer. The lower correct scores from the WETT may be due to the short time the participants took for tasting each strip. 10 The taste strips usually require a sufficient amount of liquid on the tongue in order to dissolve the tastant. 13 Instead, during the WMTT, tastant solutions were sipped and then swished around in the mouth for 10 seconds. This was done to better produce a participant’s general taste sensitivity in a short time. This method also seems to result in the low correlation in the ratios of correct quality identification between the WETT and the WMTT in healthy volunteers and patients with oral cancer. It has been reported that an edible taste strips test had lower recognition thresholds than a water-based taste test, and its rapid dissolving time was considered a major factor. 5
However, the WETT did present good retest reliability for the 5 individual tastes in our study. Furthermore, although patients with oral cancer may have taste disturbance after treatment, 16 our results show that the scores from the traditional whole-mouth test were not significantly different between healthy volunteers and patients with oral cancer. Alternatively, the WETT scores were lower in patients with oral cancer than in healthy volunteers for the sour, bitter, and all 5 tastes (Table 1). This indicates that the WETT may have a better ability to differentiate the taste function between healthy participants and patients with taste disturbance.
Conclusion
Our study has shown that although the results of a new taste test (WETT) did not have a solid correlation with those of the traditional WMTT, the WETT offered good retest reliability and therefore may have a better ability to differentiate the taste function between healthy participants and patients with taste disturbance. In the future, the WETT should be further compared with the validated taste test known as “taste strips” in order to confirm its validity, as it is tested in larger populations to help establish its normative data.
Footnotes
Authors’ Note
This study was approved by the Ethics Committee of Taichung Veterans General Hospital.
Acknowledgments
The authors are grateful to the Biostatistics Task Force, Taichung Veterans General Hospital, Taichung, Taiwan, for assistance with the statistical analysis.
Declaration of Conflicting Interests
The author(s) declared no potential conflicts of interest with respect to the research, authorship, and publication of this article.
Funding
The author(s) received no financial support for the research, authorship, and/or publication of this article.