
Abstract
Upper airway stenosis (UAS) is a common problem for anesthesiologists in laryngology as well as head and neck surgery, but it may lead to life-threatening situations if it is undetected. This retrospective case series was performed on patients who had UAS and presented with severe dyspnea or encountered difficulties in airway management. To assess the severity of UAS, the degree of stenosis was calculated using computed tomography scans and direct endoscopy. Lung function test was collected, and measured values were extracted as percentage of predicted reference values. Lower and higher grade stenoses were defined by Cotton-Myer classification and median degree of stenosis. Median of detected stenoses was 73% (64%-85%), with 7 of 10 patients classified as Cotton-Myer grade 3. Lung function tests showed typical parameter shifts as known from obstructive pulmonary diseases (OPDs). Furthermore, statistical analyses showed a significant higher value of residual volume (RV)/total lung capacity (TLC) in patients with higher grade stenosis (P < .05), whereas forced expiratory volume in 1 second /vital capacity (FEV1/VC) did not show a significant difference in same subgroups. In conclusion, the elevation of RV/TLC with concomitant normal FEV1/VC in symptomatic patients could be used to demarcate rare UAS from common OPD. Moreover, RV–TLC ratio might be used to distinguish between low- and high-grade UAS. But further epidemiological studies will be necessary to validate these findings.
Level of evidence: 4.
Introduction
Upper airway stenosis (UAS) is a common problem for anesthesiologists in laryngology as well as head and neck surgery. 1 -4 But UAS may lead to life-threatening situations if it is undetected. According to a multicenter study, the incidence of an unexpected “cannot intubate cannot ventilate” situation is 1 in 32 000 patients. 5 In these cases, tracheo(s)tomy or cricothyrotomy had to be performed. Especially in patients with other leading symptoms and various cardiopulmonary diseases, diagnosis of UAS might be overlooked. Moreover, dyspnea as a leading symptom of UAS may be present in various diseases, and differential diagnosis can be a difficult task. For example, Izquierdo Alonso could not identify alternating pattern in lung functions with and without UAS in patients with an underlying chronic obstructive pulmonary disease (COPD). 6
In contrast, patients with laryngeal head and neck cancer are likely to become symptomatic with dyspnea and striking stridor. 7,8 In these patients, diagnosis is quite evident, but the assessment of UAS due to the underlying disease is hardly standardized. Tracheo(s)tomy or cricothyrotomy as the emergency treatment of choice is performed after subjective assessment of the patients and evaluation by the medical team. 8 But there is mostly sole anamnestic questioning to assess the severity of patients with dyspnea in order to recognize a critical airway in advance. 9 Whereas stenoses on laryngeal level are easily recognized by laryngoscopy, stenoses of the cricoid cartilage or the trachea might be overlooked.
Currently, the Cotton-Myer classification is commonly used to assess the degree of UAS. 10 This classification is based on the diameter of the remaining airway in correlation with the diameter of tracheal tubes. Although the classification is easy to use in clinical settings, there are significant disadvantages: Depending on the overall constitution and the compensational capacities of the patient, there is less correlation between the degree of UAS and severity of patients’ symptoms. 11,12 In other words, patients with moderate (II°) or high-grade (III°) Cotton-Myer UAS may have similar symptoms and clinical behavior, although the remaining tracheal lumen differs significantly.
Therefore, the aim of this study was to explore lung function parameters and to identify potential parameters that correlate with the clinical severity and that may be used to classify the patients’ perioperative risk. In contrast to previous studies, we investigated a highly selected subgroup of patients with fully classified UAS but all with a different degree of severity.
Methods
This study is based on a retrospective case series of 10 patients who presented for treatment or follow-up due to acute or chronic dyspnea at the department of Oto-Rhino-Laryngology, Head and Neck Surgery, Ulm University Medical Center. The study was performed according to good clinical practice; the study was presented and endorsed to the local ethics committee of Ulm University under registration number 42/16. The population included 5 female and 5 male patients with a median age of 67 (±14) years.
Medical records were used to track down symptoms, clinical assessments, treatments, pulmonary function testing, and computed tomography (CT) images. Stenosis was assessed clinically using 70° endoscopy, flexible transnasal endoscopy, or rigid endoscopy tubes. Intraoperative images were acquired by an endoscopy-based video system (Karl Storz, Tuttlingen, Germany). Exemplary images of CT scans and endoscopy are shown in Figures 1 and 2. The degree of stenosis (Pclinically) in percentage was expressed based on endoscopic assessment by a senior physician (T.K.H. or J.A.V.). The clinical severity of UAS was divided into 3 categories (low, moderate, and severe) on the basis of symptoms and intraoperative emergencies. Severity of symptoms was defined as follows: mild describes a nonsymptomatic patient, moderate describes a symptomatic patient, and severe describes a symptomatic patient who encountered emergency situations like failed intubation. An additional classification according to the medical research council (MRC) breathlessness scale was not possible due to lack of clinical data. 9
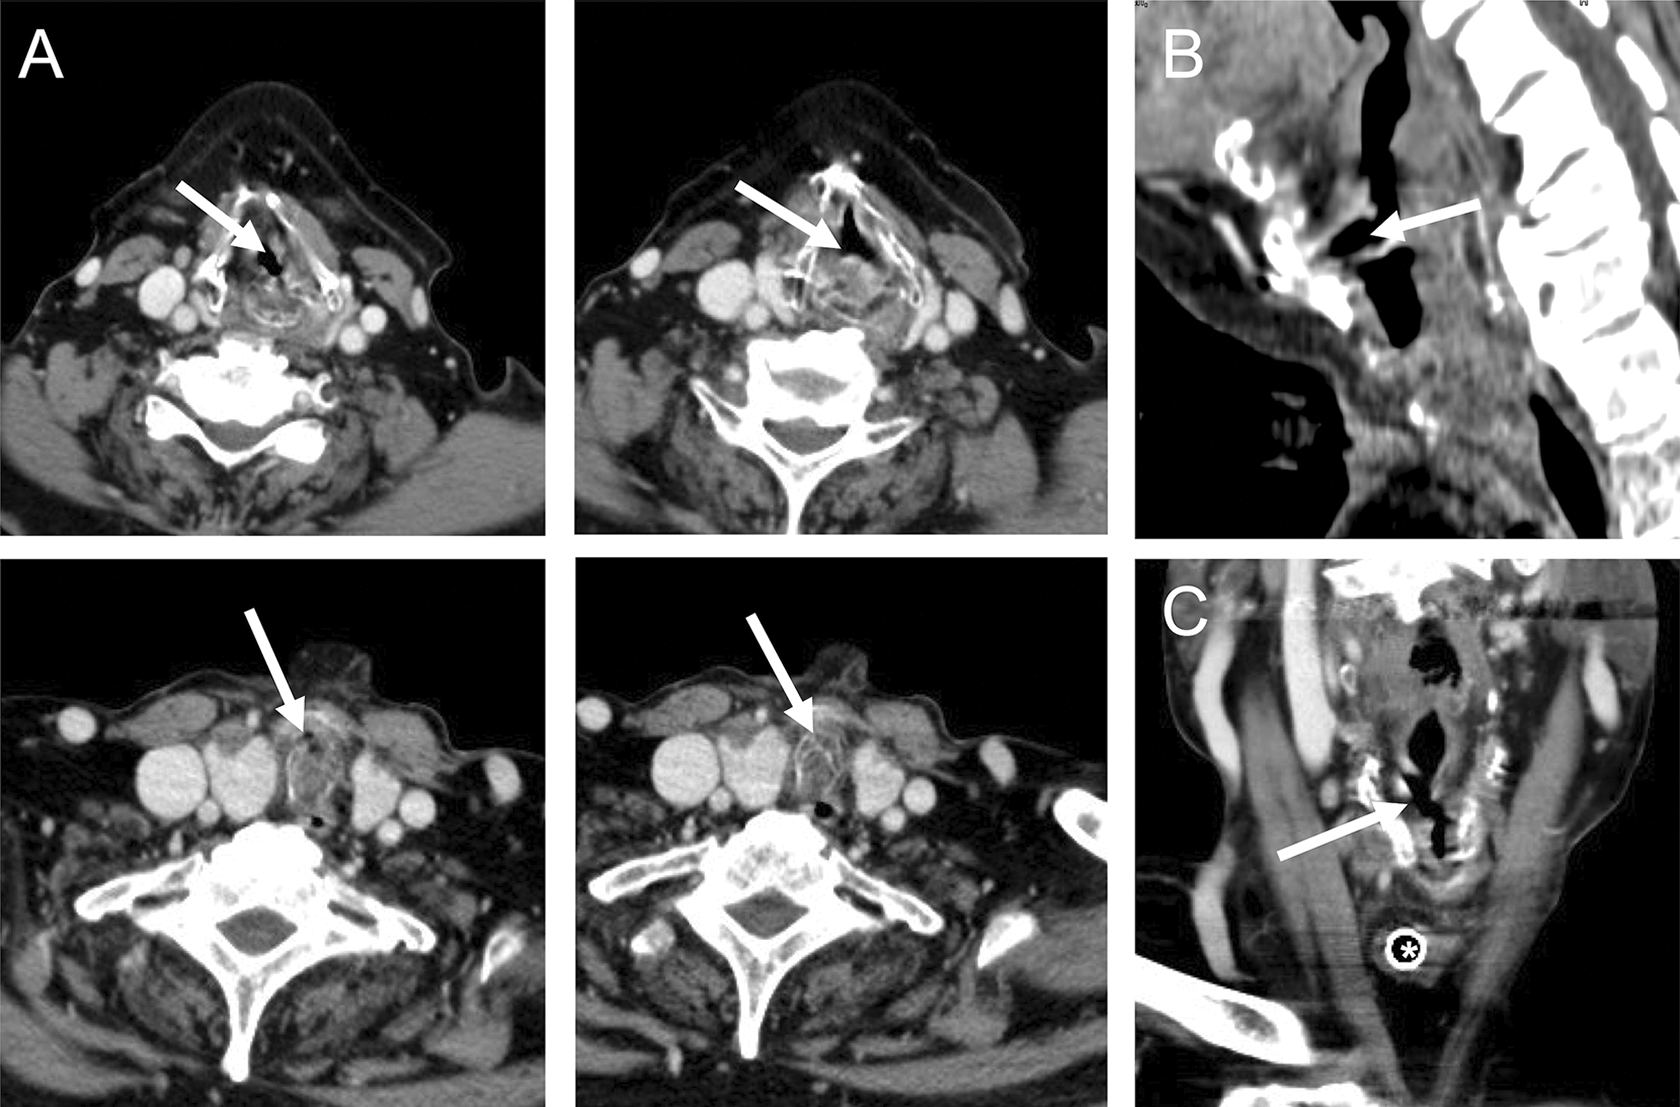
Computed tomography (CT) scans of a patient with acute dyspnea and intraoperative “cannot ventilate cannot intubate” situation. Patient was treated with nasal packing due to nasal bleeding and was scheduled for surgery. Mask ventilation was not effective due to insufficient bleeding control with nasal packing, and intubation failed due to high-grade subglottic stenosis as seen above. A, A series of axial slides with a high-grade airway narrowing. B and C, The helical structures of the airway stenosis in sagittal and frontal view, respectively.
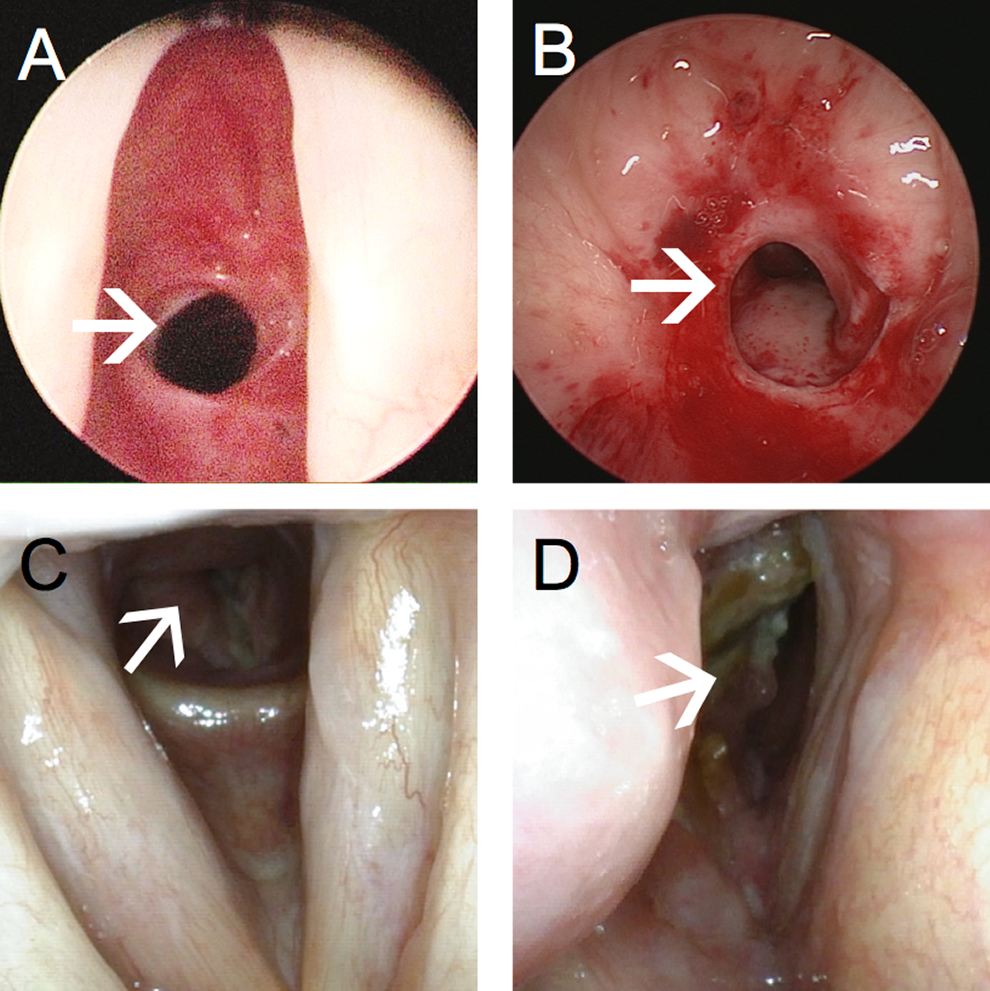
Different aspects of upper airway stenoses. A, Concentric stenosis. B, Destructive helical stenosis. C, Concentric tumorous lesion. D, Predominantly right-sided tumorous lesion crossing midline.
The CT scans were acquired during perioperative setup. Afterward laryngeal structures were assessed in an axial plane (z0) to identify the highest degree of stenosis. Consecutively, the selected image (z0 plane) was overlaid by a pixel-based grid pattern, and the remaining lumen was assessed as integral number of pixels (Lrem = remaining lumen) with a radiodensity of close to −1000 HU. Second, potential laryngeal lumen was estimated as an integral number of pixels (Lpot = potential lumen) by identifying pixels with a radiodensity from −100 up to + 700 HU with regard to the selected slide and the adjacent slides above and below (z0 ± 1 image within z-stack of axial images). Only tissue within the cartilaginous or bony structures of the larynx was considered. Finally, degree of stenosis was calculated as follows: Pct = (Lpot − Lrem)/Lpot (%). Then Pstenosis was calculated as average of both values: Pstenosis = (Pct + Pclinically)/2.
Records of pulmonary function tests were collected from different sources and screened for relevant data. Data were extracted to the highest possible degree with n = 10 on average, allowing a statistical description of vital capacity (VC), residual volume (RV), total lung capacity (TLC), forced expiratory volume (FEV1), forced expiratory volume after administration of bronchodilators (FEV1bd), and resistance. All values were expressed as percentage of predicted reference values as calculated by the particular measurement system depending on sex, age, height, and weight of the patient. Combined lung function parameters (RV/TLC and FEV1/VC) were calculated manually as the ratio of the given percentages of desired values of the respective parameters mentioned earlier.
This procedure allowed a statistical correlation of lung function parameters with the measured degree of stenosis. By this means, we were able to derive a subset of parameters that show a statistically significant correlation with the extent of the stenosis. Afterward, subgroups were built according to Cotton-Myer classification and also by sorting the cohort of patients into 2 groups below and above the median of Pstenosis. Moreover, the degree of UAS and lung function parameters were calculated as percentage of predicted reference values to reduce interindividual differences and improve correlation results. Statistical analysis was performed using unpaired Student t test.
IBM SPSS Statistics version 21 (IBM Corp, Armonk, New York) was used for statistical analysis. Graphs were depicted using Excel 2013 (Microsoft, Redmond, Washington).
Results
Clinical Assessment
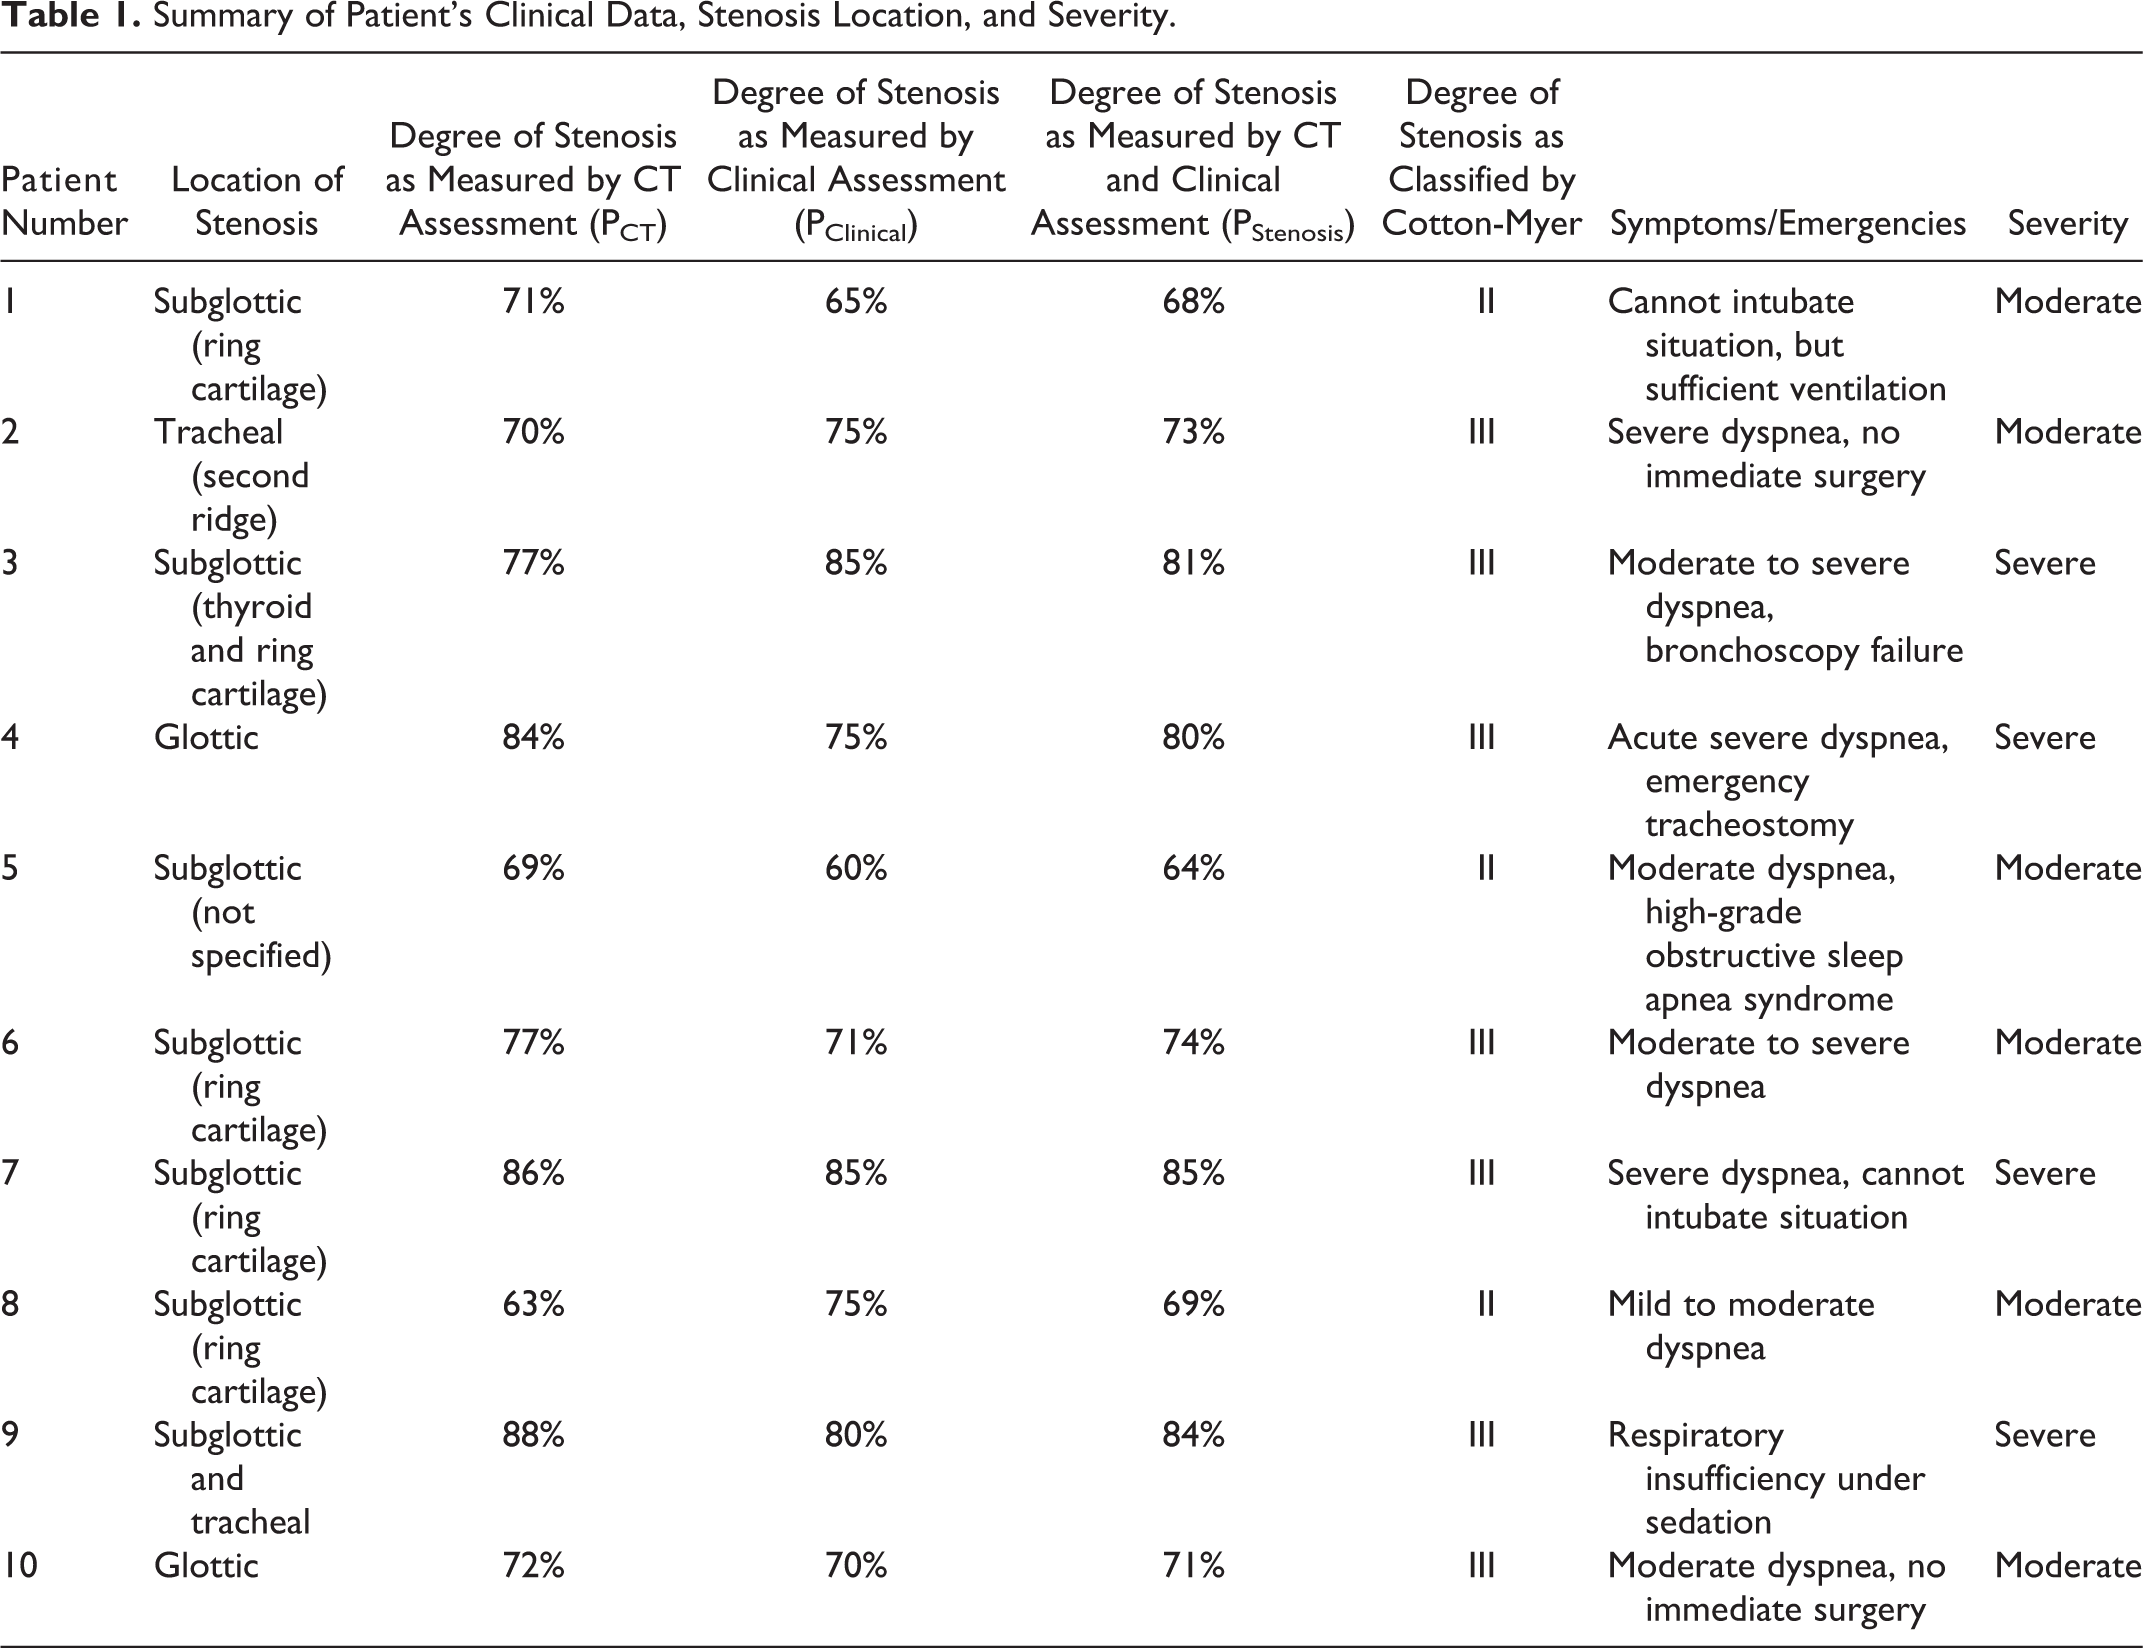
According to the inclusion criteria, a cohort of 10 patients were identified; clinical details are summarized in Tables 1 and 2. The degree of stenosis (Pstenosis), evaluated by endoscopy and CT scan, was median 73% (64%-85%). Degrees of stenosis in endoscopy and CT scan are depicted individually in Figure 3. The majority of cases (7/10) was classified as grade 3 according to Cotton-Myer. Most UASs were found at the level of ring cartilage (5/5). Clinical symptoms were moderate (n = 5) to severe (n = 5; see Tables 1 and 2) and did not correlate with Cotton-Myer grading. Correct diagnosis was found late in most cases, so emergency admittance to ENT department was necessary in 8 of 10 cases. One high-degree UAS was found in a patient with nasal bleeding and led to emergency tracheostomy after a “cannot intubate and ventilate” situation.
Summary of Patient’s Clinical Data, Stenosis Location, and Severity.
Patients Lung Function Parameters.
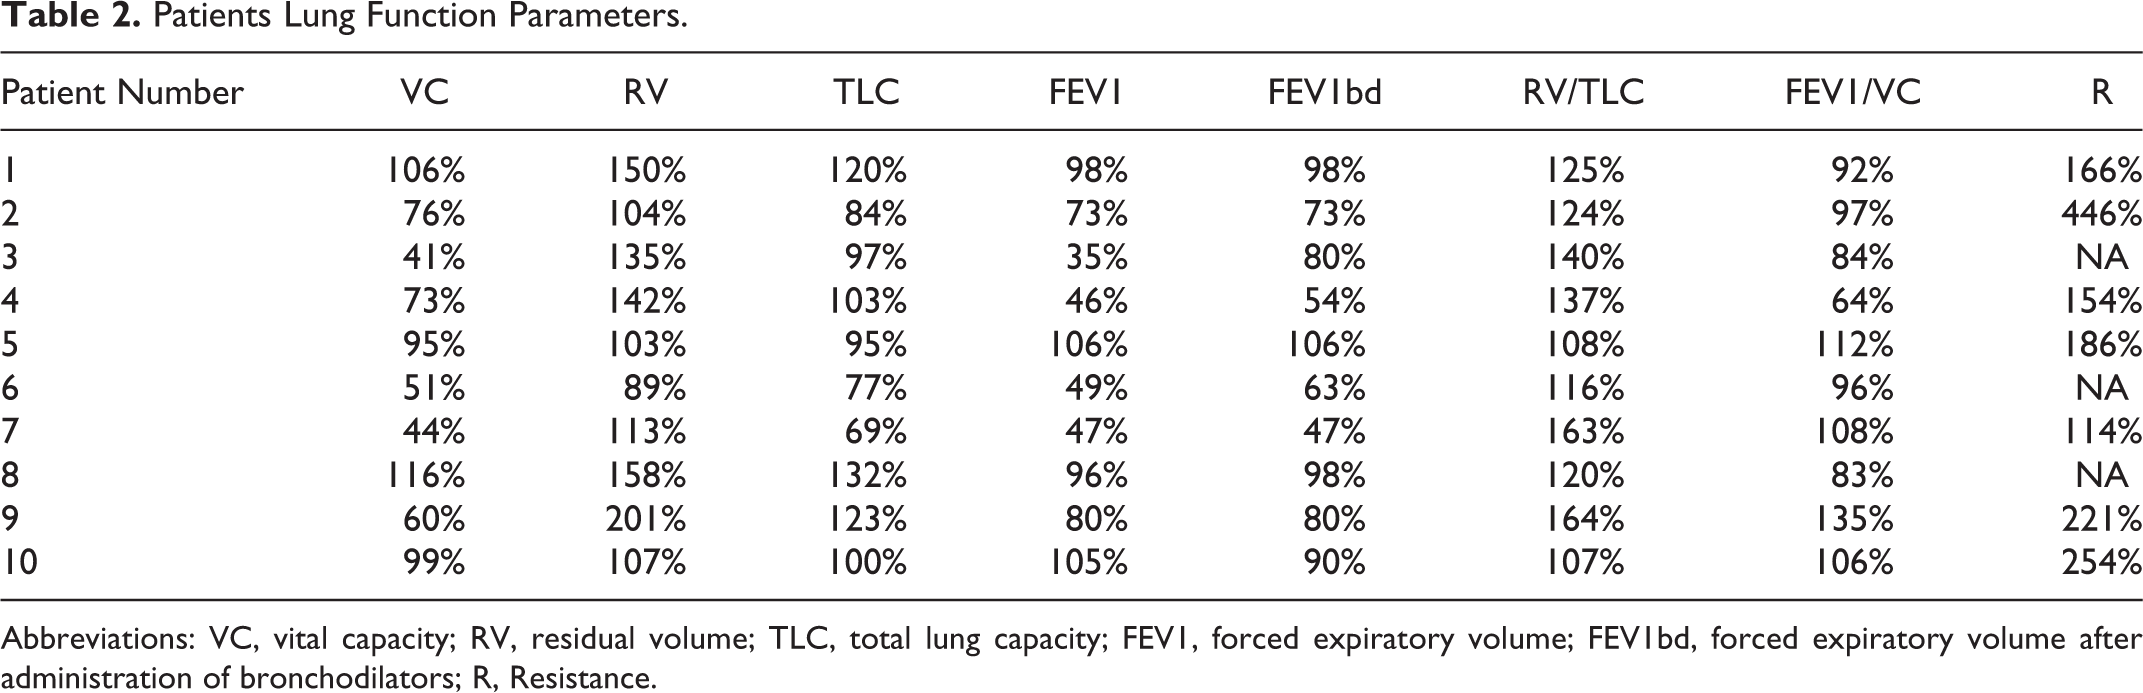
Abbreviations: VC, vital capacity; RV, residual volume; TLC, total lung capacity; FEV1, forced expiratory volume; FEV1bd, forced expiratory volume after administration of bronchodilators; R, Resistance.
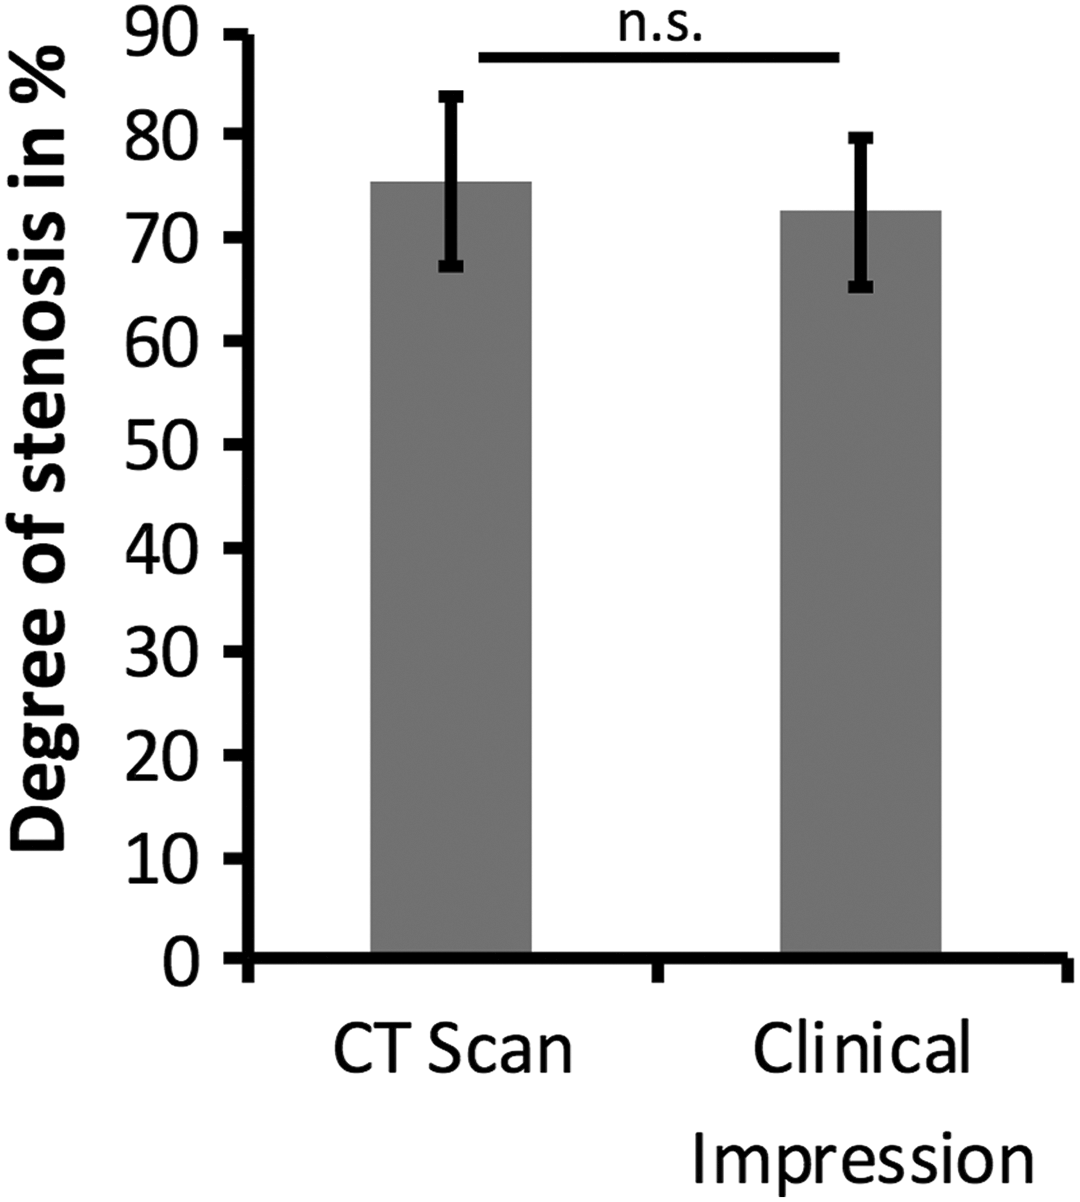
The mean degree of stenosis was 76% (±8.2%) measured by computed tomography (CT) scan analysis and 74% (±8%) as measured by clinical analysis. There was no significant (n.s.) difference between both groups in Student t test.
Assessment of Stenosis
There was a low correlation between Pclinically and Pct (R 2 = 0.3146). Correlated Student t test showed no significant differences between Pct and Pclinically. Mean Pstenosis was 75%. Figure 3 shows an example where intraoperative findings and CT scan analysis are significantly differing. Resolution problems and patient movements in CT scans probably cause this difference. To reduce biasing, Pstenosis as an average of clinical and CT-based measurements was used for further data analysis.
Pulmonary Function Tests
Clinical data showed a low percentage of correct diagnosis in reference to the interpretation of pulmonary function tests: stenosis (3×), obstructive (2×), restrictive (2×), and others/not specified (3×). All pulmonary function tests were evaluated, and mean values as well as standard deviations for all lung function parameters were calculated. Figure 4 shows the collected values: VC 75% (±27%), RV 130% (± 34%), TLC 100% (±20%), FEV1 73% (±27%), FEV1bd 79% (±20%), RV/TLC 130% (±21), FEV1/VC 98% (±19%), and resistance 220% (±110%). Here, UAS resembles parameter shifts as known from pulmonary function test in obstructive pulmonary disease (OPD). But, nevertheless, there are differences in respect to FEV1, RV/TLC, and FEV1/VC. Especially, FEV1/VC might be used to distinguish between OPD and UAS, whereas FEV1, FEV1bd, and RV/TLC might be influenced by the severity of upper airway obstruction.
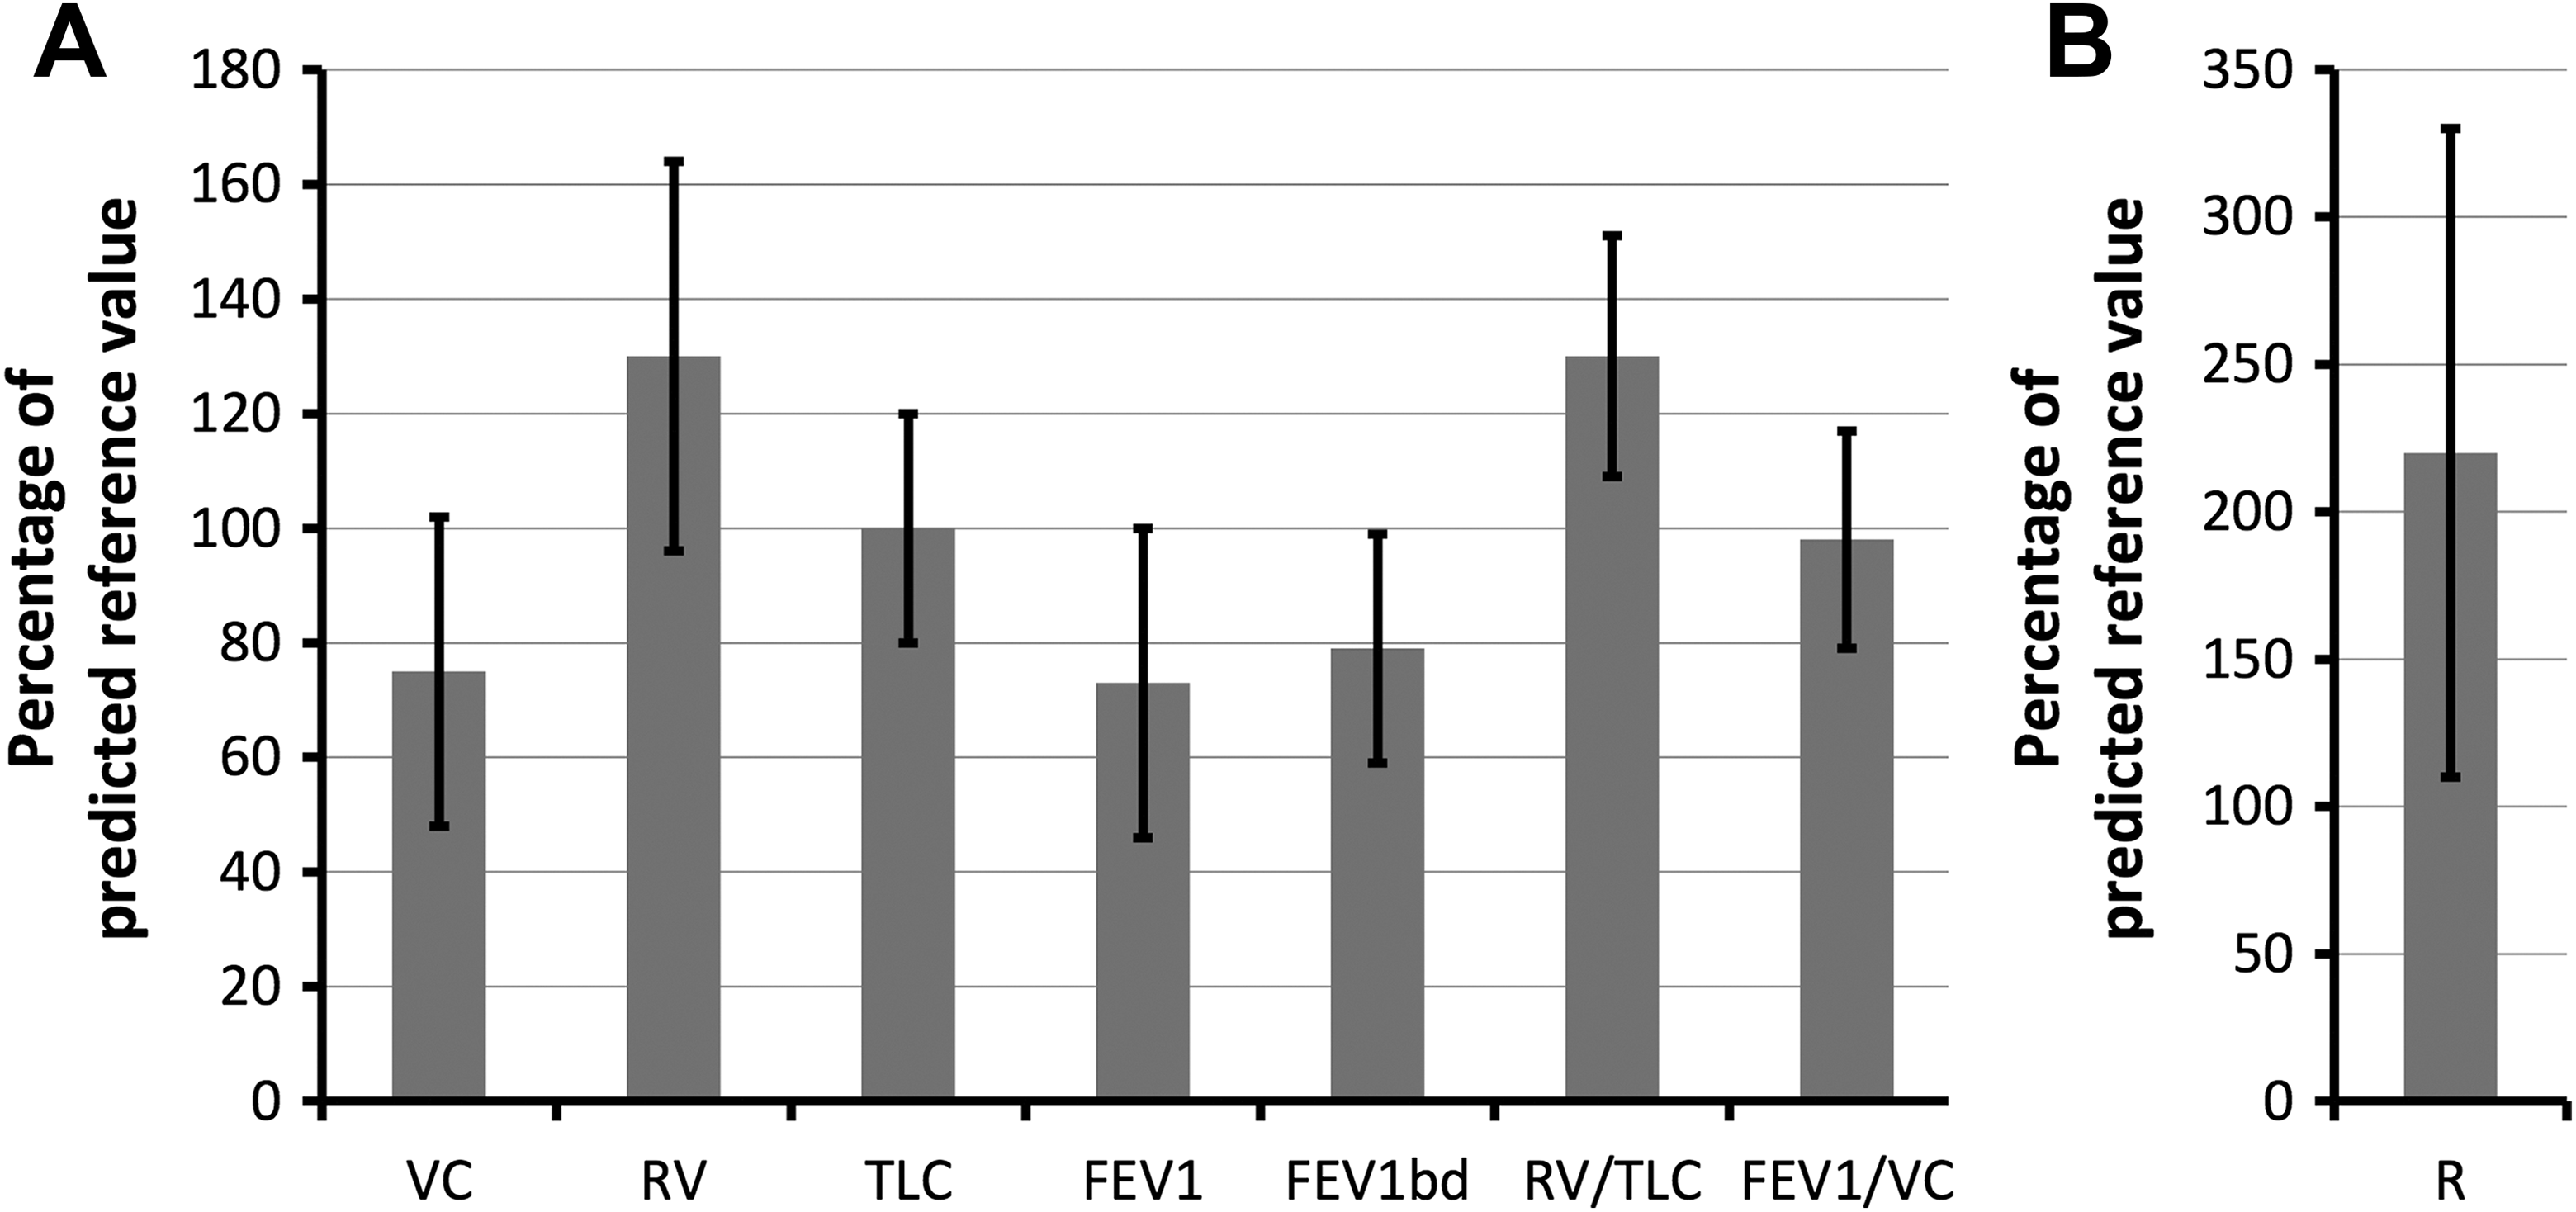
Mean values of lung function parameters as percentage of predicted reference value. A, Flow parameters. B, Resistance.
Statistical analysis (not depicted) of primary pulmonary function parameters and Pstenosis showed a negative correlation for VC and FEV1. We found that FEV1bd showed more stable results and resulted in a higher R 2 compared to FEV1 (R 2 = 0.6521 vs 0.3745). Other parameters such as RV or TLC did not correlate with the degree of UAS. Also, FEV1/VC failed to show any dependency on degree of stenosis. Contrarily, combined parameters (calculated as ratios of primary parameters) showed striking correlation with the degree of stenosis: R 2 = 0.81 for RV/TLC.
Moreover, there was a significant difference between lower and higher grade stenoses regarding RV/TLC when subgrouping patients by the degree of stenosis (each P < .05): 115% (±9%) versus 141% (±20%) in reference to Cotton-Myer classification and 117% (±9%) versus 144% (±20%) in reference to median of Pstenosis. Contrarily, there was no statistical difference of FEV/VC regarding the same subgroups as before: 98% (±13%) versus 97% (±24%) and 98% (±9%) versus 97% (±27%). Results are depicted in Figure 5.
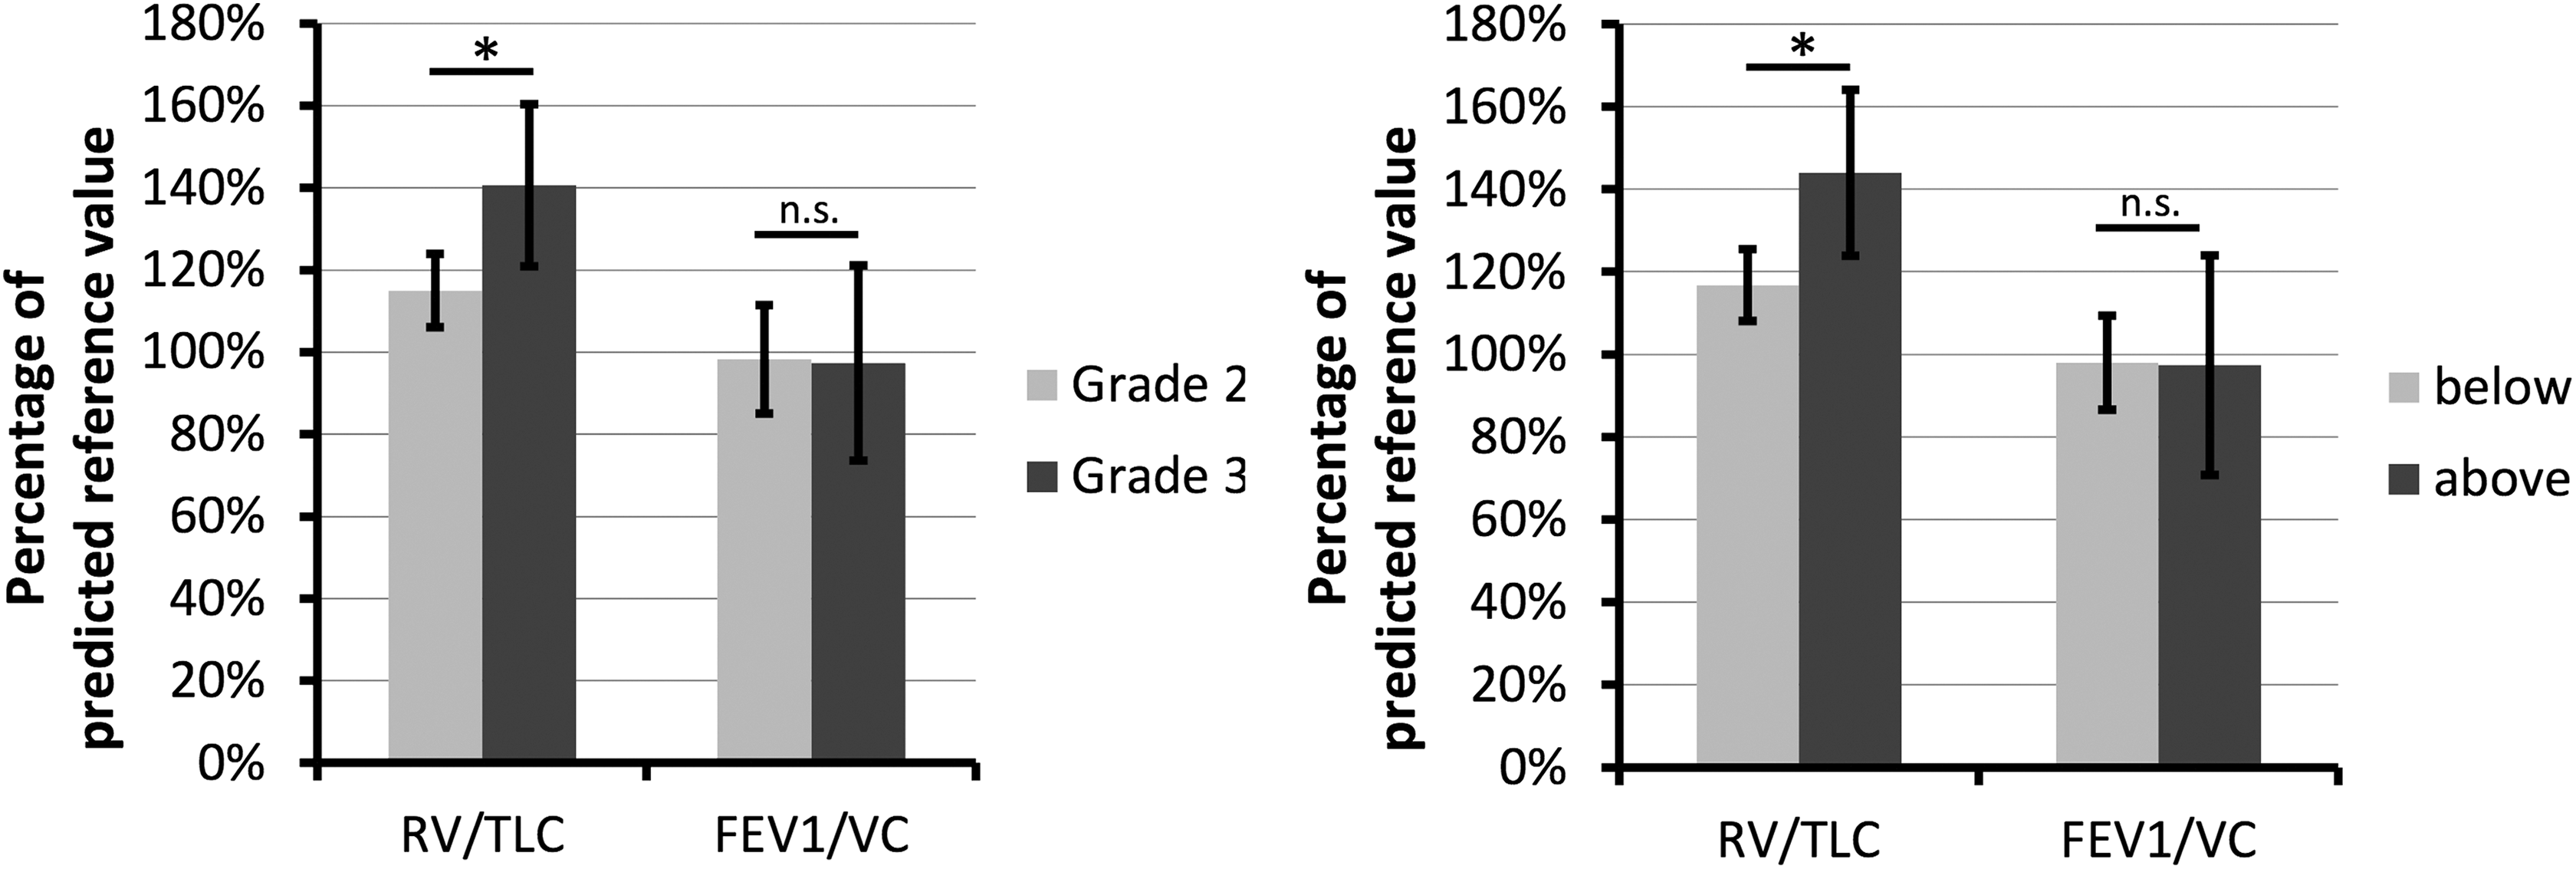
Bar plots of residual volume (RV)/total lung capacity (TLC) and forced expiratory volume (FE1)/vital capacity (VC), respectively, as percentage of predicted reference value. Patients were grouped by Cotton-Myer classification (A) and median of stenosis (B). Asterisk marks a significant difference (P < .05).
Discussion
The clinical identification of an UAS is impeded by the variability in clinical symptoms. For example, Gittoes et al were unable to correlate the extent of dyspnea with the degree of an UAS in a cohort of 153 patients with thyroid enlargements. 12 On the contrary, Melissant et al found an onset of symptoms in patients with a stenoses above 60% when they reviewed patients with enlarged thyroids that compressed the upper airway. 11 This study reviewed the files of 10 patients who had dyspnea to various degrees. All of them had a stenosis of more than 60%. Therefore, symptoms may regularly be assumed in patients with stenoses above 60%, but further aggravation may not correlate linearly with the increase of stenoses. Also, a patient without comorbidities may tolerate higher grade UAS compared to patients with cardiopulmonary sickness.
The difficulty in estimating the degree of an UAS by lung function parameters is based on the high variability of parameters and the possible confounders as obstructive or restrictive lung disease or concomitant cardiac disease. 13 There have been several studies investigating changes in lung function parameters with regard to UAS. 14 -19 For example, FEV1 has been considered as a possible marker of stenosis, because this parameter is directly derived from the resistance of the respiratory tract during expiration, and resistance is a function of the diameter of the airway. But FEV1 is also influenced by the lower respiratory tract as seen in asthma or COPD. 6,20,21 Thus, the attribution of changes in FEV1 to the underlying disease is very difficult. Our data show a high variability in FEV1 ranging from normal to highly pathological values as depicted in Figure 4. Therefore, FEV1 is not a sensitive parameter to assess the severity of an UAS. This corresponds to studies of van Noord et al and Gibbons et al that have shown a higher susceptibility of FEV1 than FVC to bronchodilators in patients with lower airway obstructions. 20,21 In reverse, FEV1 may indicate bronchial obstructions, whereas FVC corresponds to air trapping in COPD. On the contrary, we also examined FEV1 after the application of bronchodilators that reduce the influence of bronchial obstruction on the expiratory flow. Here, we found a rather strong inverse correlation with the degree of stenosis (R 2 = 0.6521). Therefore, we suggest using bronchodilators to reduce the influence of lower airway obstructions on FEV1 measurements in order to assess upper airway stenoses properly.
Additionally, the increase in pulmonary resistance was also suggested as an indicator of UAS. 15,22,23 For example, Brown et al have shown the impact of upper airway obstructions compared to lower airway obstructions on pulmonary mechanical function in dog and swine models. Here, VC did not change or decrease with upper airway obstructions, but resistance was doubled. 24 We also experienced a high variability in resistance ranging from 114% to 446%. Summing up, the high variability in dynamic parameters impaired the assessment of pulmonary stenosis, and the correlation with the severity of the upper airway obstruction was very poor (R 2 = 0.0676).
On the contrary, Nouraei et al examined not only expiratory but also inspiratory lung function parameters. 14 They found typically altered respiratory flow–volume loops with reduced peaks with flattened almost box-shaped patterns. Consequently, they found a strong correlation of TPF (total peak flow) with VC. The TPF was defined as peak expiratory flow volume plus absolute value of inspiratory flow volume. Unfortunately, we were not able to reproduce these findings, as our data were partially lacking flow–volume loops or inspiratory flow rates. Interestingly, sole FEV1/VC did not correlate with the degree of stenosis in our patients. We believe, dynamic lung function parameters such as peak flow rates are more likely to be biased as static volumes, especially as they are subjected to the collaboration of each patient.
Therefore, a correlation analysis of all available lung function parameters with the degree of stenosis was made: 2 parameters, namely, FEV1bd and RV/TLC, showed a high correlation, FEV1 and VC showed a weak correlation, and RV, TLC, and FEV1/VC did not any correlation with the degree of stenosis. As already stated earlier, FEV1 has already been proposed as a marker of UAS. 25 But we recommend the measurement after the administration of bronchodilators, as the correlations improve significantly (R 2 = 0.6521 vs R 2 = 0.3745). In contrast, the ratio of RV/TLC has not been applied so far to measure the degree of an UAS, although results of our cohort show a high degree of correlation (R 2 = 0.8058). This might be due to the fact that not only RV but also TLC are static volumes that are not directly involved in flow dynamics. But the elevation of it is based on the trapped air during expiration. Interestingly, RV does not correlate with the degree of stenosis. This result was confirmed by Wassermann et al. 22 We hypothesize that the concomitant inspiratory impairments lead also to changes in TLC. Only the ratio of RV–TLC represents the elevation in RV significantly, as the global impairment of lung function is considered by TLC.
In the next step, patients were divided into groups using Cotton-Myer classification and median of Pstenosis. Statistical analysis performed as a case–control analysis (low- vs high-grade stenosis) showed a strong statistical difference between groups with an increase in higher grade stenosis. On the contrary, there was no increase in FEV1/VC parameter. Therefore, we may again hypothesize that there is an increase in RV/TLC with degree of stenosis as seen in correlation analysis before.
Last but not least, this study is only a retrospective case series and is limited in its validity. During data analysis, we were able to include only 10 patients, as many patients did not have full clinical workup, in particular no lung function test. Moreover, this study was only retrospective and relied on lung function parameters of various sources. We indented to eliminate this bias by collecting only percentage values based on predicted reference values, which were calculated by the respective devices according to the patient’s biometric data during the lung function test. Ideally, all patients should be assessed by the same examiner using the same equipment or at least with an identical spirometer. Therefore, further studies with a bigger cohort of patients are necessary to proof the findings and hypotheses of this preliminary study.
Summing up, UAS can be assessed by lung function parameters, and correlation with the degree of stenosis seems possible. Therefore, we suggest using lung function test to detect and quantify UASs. Compared to Cotton-Myer classification, there is no need for invasive procedures, and results reflect the functional relevance of symptoms. This helps surgeons to evaluate the severity of the stenosis and to decide about the need for surgery. To simplify the classification, we propose a 3-step assessment as depicted in Table 3. This is independent of subjective clinical evaluation or CT-based assessment of stenosis but is based on the direct proportional dependence of RV–TLC ratio and degree of stenosis. A normal RV/TLC could rule out a significant UAS, as all patients in our cohort were symptomatic and had a stenosis of at least 60% and an elevated RV–TLC ratio >100%. All high-risk patients had an RV–TLC ratio >130%. Therefore, a potential grading system might be based on clinical symptoms (dyspnea, stridor) and RV/TLC elevation. It is important to understand that lung function testing and the calculation of RV–TLC ratios does not replace laryngoscopy but may serve as an additional screening tool.
Proposed Grading System for Upper Airway Stenosis.
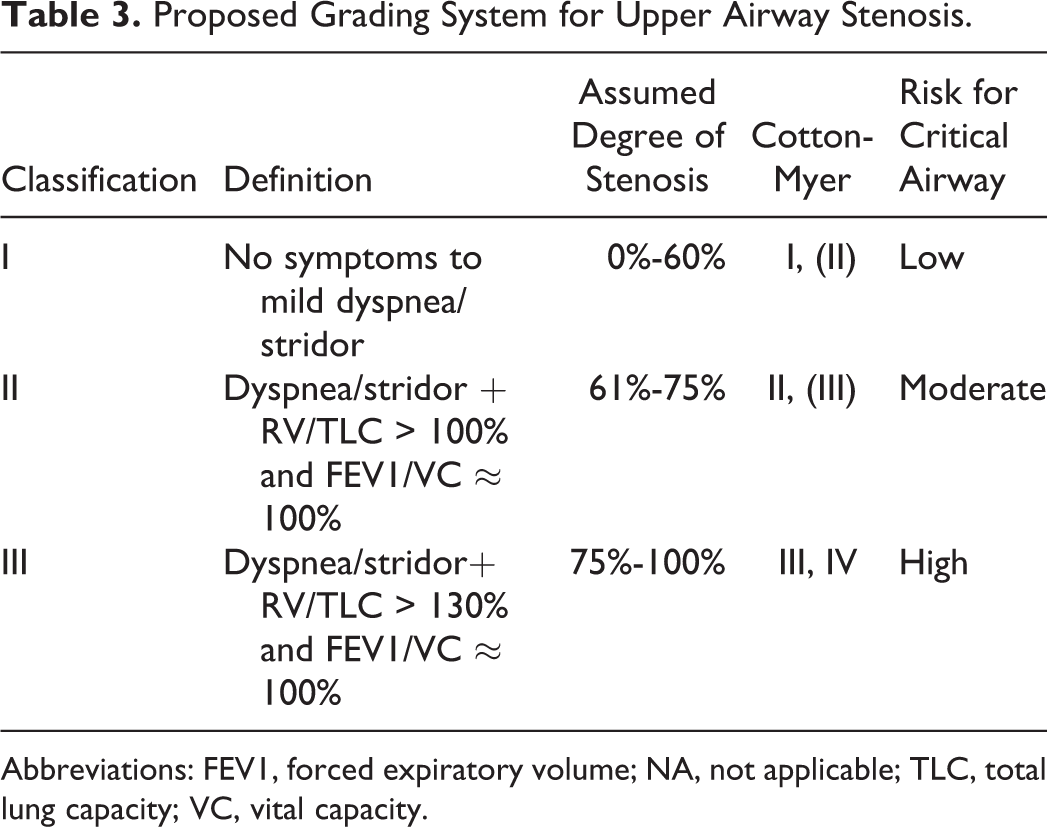
Abbreviations: FEV1, forced expiratory volume; NA, not applicable; TLC, total lung capacity; VC, vital capacity.
Conclusion
Measurement of RV–TLC ratio might be used as a new and easily obtainable parameter to screen for the degree of an UAS—especially for nonotorhinolaryngology specialists. Additionally, FEV1–VC ratio could be used to distinguish between obstructive pulmonary disease and UAS. But further studies are necessary to validate findings and cutoffs found in this preliminary retrospective case series.
Footnotes
Authors’ Note
All procedures performed in studies involving human participants were in accordance with the local ethical standards of the institutional research committee and with the 1964 Helsinki declaration and its later amendments or comparable ethical standards. Informed consent was not obtained from all individual participants included in the study as this study was designed as an anonymized retrospective study.
Declaration of Conflicting Interests
The author(s) declared no potential conflicts of interest with respect to the research, authorship, and/or publication of this article.
Funding
The author(s) received no financial support for the research, authorship, and/or publication of this article.