
Abstract
Laryngopharyngeal reflux (LPR) is an inflammatory condition suspected to be associated with dysphonia. In this study, we investigated multidimensional perceptual, aerodynamic, and acoustic voice changes in patients with clinically diagnosed LPR compared to healthy participants. We prospectively included 80 outpatients with Reflux Finding Score (RFS) >7 and Reflux Symptom Index (RSI) >13 from September 2013 to April 2016 and we compared clinical and voice quality assessments of these patients with 80 healthy participants. Statistically significant differences were found between groups with regard to Voice Handicap Index, perceptual voice quality (grades of dysphonia, roughness, strain, breathiness, asthenia, and instability), phonatory quotient, percentage jitter, percentage shimmer, peak-to-peak amplitude variation, standard deviation of fundamental frequency, and noise to harmonic ratio. Granulation score of RFS was found to affect the highest number of acoustic parameters. We did not identify significant correlation between vocal fold edema and objective voice quality measurements. This study supports that patients with LPR have significant deterioration of both subjective and objective voice quality compared to healthy participants.
Introduction
Laryngopharyngeal reflux (LPR) is an inflammatory condition of the upper aerodigestive tract tissues related to direct and indirect effect of gastroduodenal content reflux, which induces morphological changes in the upper aerodigestive tract. 1 Following some American studies, LPR symptoms would concern 4% to 10% of outpatients visiting Otolaryngology—Head and Neck Surgery departments and up to 50% of patients in voice centers. 2,3 Although with the increasing number of clinical researches on LPR over the last 3 decades, only a few studies interested to the occurrence of voice disorders. 4 However, among the common symptoms related to LPR, hoarseness is found in 71% to 79% of patients 5,6 and affects patient’s communication and quality of life. 7 Thus, some 20 prospective trials were conducted to assess the voice quality changes throughout treatment, 8,9 and only 5 case–control studies assessed voice quality impairments in patients with LPR compared to healthy participants. 10 -14 Among the case–control studies, no study assessed voice quality with multidimensional approach including, at least, subjective, perceptual, aerodynamic, and acoustic evaluations. Moreover, the trials that measured objective voice quality reported mixed results, 10 -13 which are probably due to methodological measurement discrepancies between studies. 8,15 Overall, the controversial results of these studies led some authors to put into question the occurrence of voice quality impairments related to LPR. 16
The purposes of this study are to investigate the voice quality impairments in patients with LPR compared to healthy participants and, according to our results, to identify the relationship between videolaryngostroboscopic findings and acoustic parameters.
Materials and Methods
From September 2013 to April 2016, 122 patients with LPR symptoms were recruited at the Ear, Nose, and Throat (ENT) Departments of EpiCURA Hospital and Liege University Hospital. Reflux Symptom Index score (RSI > 13) and Reflux Finding Score (RFS > 7) were used for the LPR diagnosis with regard to the thresholds proposed by Belafsky et al, which are associated with a positive double-probe pH monitoring result. 17,18 To decrease the risk of inclusion of confounding diseases, we carefully excluded patients with the following conditions: upper respiratory tract infections, neurological or psychiatric diseases affecting laryngeal function, active smokers, alcoholics, pregnant, active seasonal allergies, asthma, patients with inhaled corticosteroid treatment, chronic obstructive pulmonary disease, previous history of cervical surgery or radiotherapy, laryngeal trauma, vocal cord paralysis/paresis, benign vocal fold lesions, pharyngolaryngeal malignancy, prior antireflux surgery, or chemical exposure causing laryngitis. Patients who have already started an antacid treatment were also excluded. Because it is expensive and inconvenient for the patient, and according to the weaknesses of this examination (ie, high false-positive and false-negative rates, interpretation difficulties, inconsistency between pH findings, signs and symptoms), 19,20 we did not systematically use pH-impedance metry for the LPR diagnosis. Yet, to be definitively included in the study, patients had to be cured (RSI ≤ 13 and RFS ≤ 7) after 3 or 6 months of treatment (proton pump inhibitors twice daily and diet). Only in case of lack or poor clinical improvement at the posttreatment time, the LPR diagnosis of resistant patients was confirmed with multichannel intraluminal impedance-pH monitoring. Patients with nonacid reflux were treated by the addition of alginate and were included in the study.
A control group composed of 80 healthy participants was included in this study. These participants were matched for gender and age, and benefited from an ENT examination. Exclusion criteria previously described were applicable for the control group.
Clinical and Voice Quality Evaluations
Usual symptoms of LPR were assessed in both groups with RSI. Videolaryngostroboscopic signs were assessed with RFS by a blinded laryngologist regarding the patient complaints. Subjective voice quality was evaluated in both groups with the French version of the Voice Handicap Index (VHI). 21 The assessment of perceptual voice quality was performed by three experienced speech therapists using Grade, Roughness, Breathiness, Asthenia, Strain and Instability (GRBASI) scale. The voice samples used for the GRBASI evaluation consisted of a balanced text and a sustained vowel /a/. These three judges have previously demonstrated high intra- and interrater reliabilities 22 and were blinded in regard to the clinical state of the patient (pre versus posttreatment), RSI, and RFS. To study the repercussion of voice quality impairments on overall quality of life, patients with LPR fulfilled the Short Form 36 Health Survey (SF36).
Aerodynamic measurements were performed during the ENT consultation by a trained laryngologist (J.R.L.) with a calibrated spirometer, taking into account the age, sex, height, and ethnicity of the subject (Spiro-USB100; Medical Electronic Construction, Brussels, Belgium). Maximum phonation time (MPT) was measured 3 times and only the best realization was used for the study. Phonatory quotient (PQ) consists of the ratio between vital capacity (VC, mL) and MPT (seconds).
To realize the acoustic measurements, participants produced the sustained vowel /a/ at a comfortable pitch and intensity, holding the utterance as long as possible. The three samples were recorded in a sound-treated room with a high-quality microphone (Sony PCM-D50, New York, New York) placed at a distance of 30 cm from the patient’s mouth. Fundamental frequency (F0), standard deviation of F0 (STD), peak-to-peak amplitude variation (vAm), percentage jitter (Jitt), percentage shimmer (Shim), noise to harmonic ratio (NHR), and Voice Turbulence Index (VTI) were measured on the entire signal of the 3 sustained vowels using Multi-Dimensional voice program software (KayPentax; Montvale, New Jersey, USA).
To identify relationship between LPR signs and acoustic measurements, a correlation analysis between videolaryngostroboscopic findings (RFS items) and acoustic parameters was realized. The procedures followed in this study were in accordance with the ethical standards of the responsible committee on human experimentation and with the Helsinki Declaration of 1975, as revised in 1983.
Statistical Analysis
Statistical analysis was performed using the Statistical Package for the Social Sciences for Windows (SPSS v22.0; IBM Corp, New York City, New York). To compare various items according to the group, Mann-Whitney test was used. Spearman correlation test was used to study relationships between subjective voice quality and overall quality of life and between videolaryngostroboscopic findings and acoustic measurements. A level of significance of 0.05 was adopted.
Results
From the 122 recruited patients with LPR, 80 completed the study. The 42 remaining patients were excluded for many reasons (ie, the occurrence of aerodigestive tract infections during the last month before the posttreatment consultation and the absence from the medical appointment 3 months after treatment initiation). Twenty-one patients did not respond to proton pump inhibitors at the end of 3 months of treatment, and 5 did not respond to a prolonged therapy. According to impedance-pH monitoring, 3 had mixed reflux and 2 nonacid reflux. Eighty healthy participants were recruited in our university after strict exclusion of cofactors described in Materials and Methods. The mean age of LPR and healthy participants was 51.3 (18-80) and 45.5 (18-76) years, respectively (P = .156, Mann-Whitney test), and there were 40 females and 40 males in each group.
Globus sensation and hoarseness were the main complaints of patients with LPR at baseline. The main and secondary complaints (RSI) of patients with LPR are described in Table 1. As expected, patients with LPR had higher score of RSI (total and items) than healthy controls (Table 2). The videolaryngostroboscopic signs of patients with LPR reported a mean RFS score of 10.65 ± 2.38. Among the RFS items, the more important clinical scores were arytenoid or diffuse redness (3.05 ± 1.05), posterior commissure hypertrophy (2.13 ± 0.68), and endolaryngeal mucus (1.33 ± 0.95). Redness of arytenoids and posterior commissure hypertrophy were the most prevalent signs encountered in participants with LPR while we did not often find subglottic edema.
Clinical Characteristics of Patients.
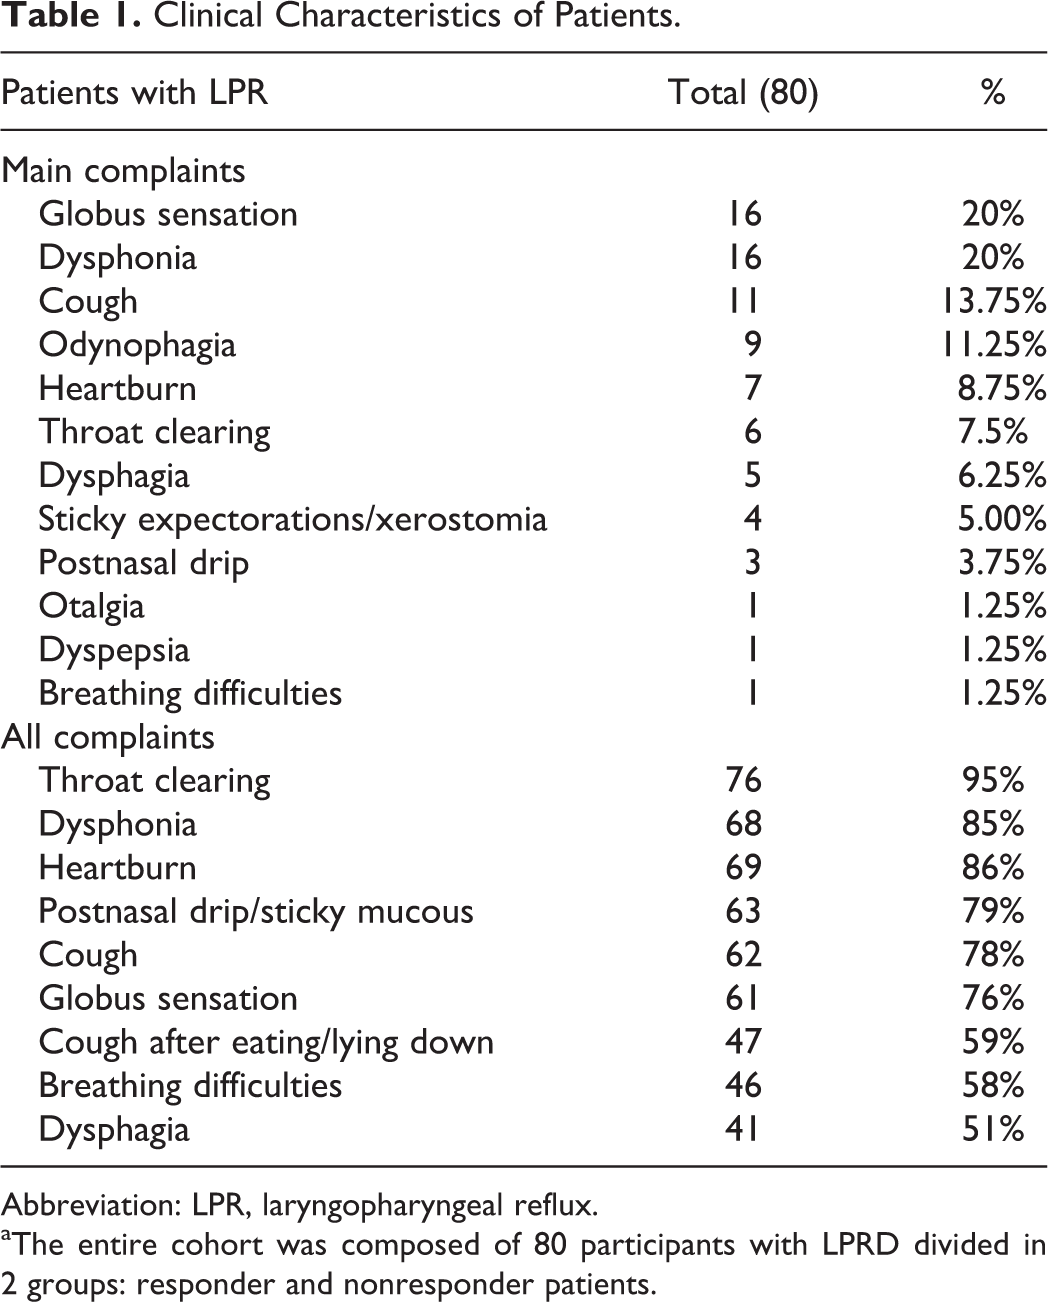
Abbreviation: LPR, laryngopharyngeal reflux.
aThe entire cohort was composed of 80 participants with LPRD divided in 2 groups: responder and nonresponder patients.
Reflux Symptom Index Scores in LPR and Healthy Participants.
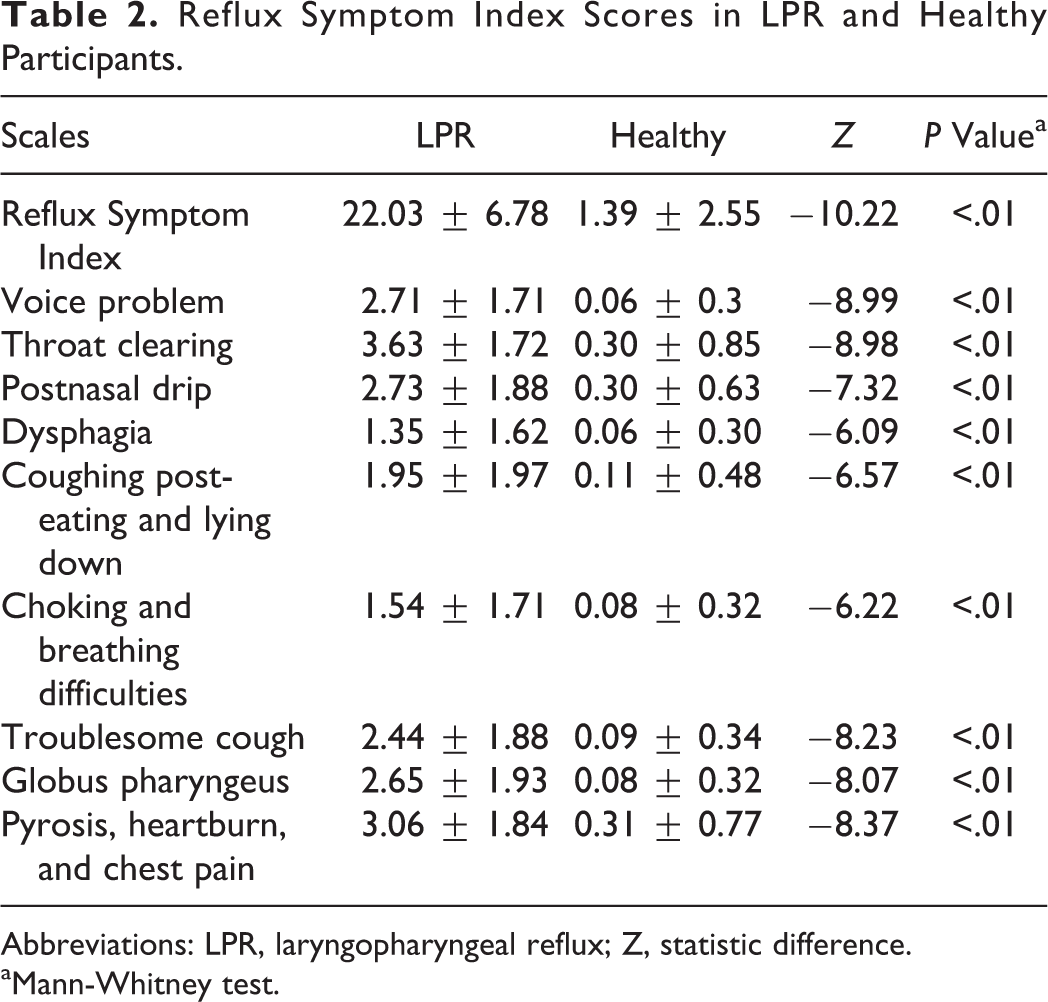
Abbreviations: LPR, laryngopharyngeal reflux; Z, statistic difference.
aMann-Whitney test.
In reference to normative data of SF36 scores, 23 patients with LPR had lower scores of SF36 (Table 3). The VHI total and items scores were significantly better in healthy controls than patients with LPR (Table 4). According to our correlation analysis, we identified a significant correlation between VHI total score and physical health score of SF36 (correlation coefficient: 0.287, P < .05). Physical health score was also correlated with functional (correlation coefficient: 0.372, P < .01) and emotional (correlation coefficient: 0.281, P < .05) VHI subscores. Mental health score of SF36 was correlated with emotional VHI. Mental health score of SF36 was correlated with emotional VHI (correlation coefficient: 0.244, P < .05).
Short-Form 36 Health Survey Values of Patients With LPR.
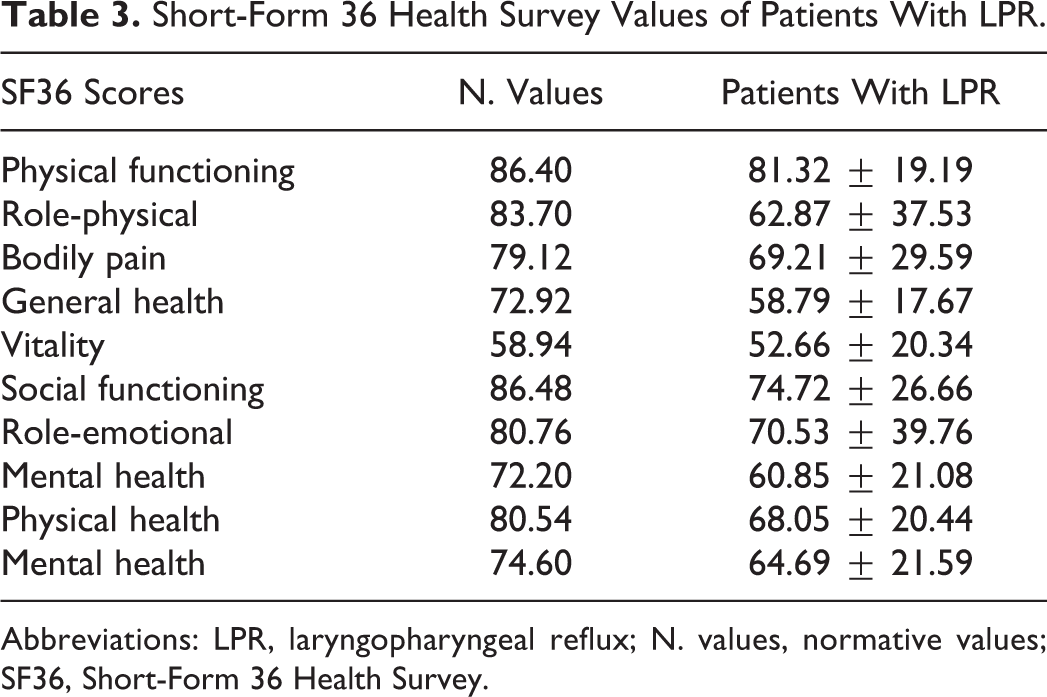
Abbreviations: LPR, laryngopharyngeal reflux; N. values, normative values; SF36, Short-Form 36 Health Survey.
Subjective Voice Quality in LPR and Healthy Participants.
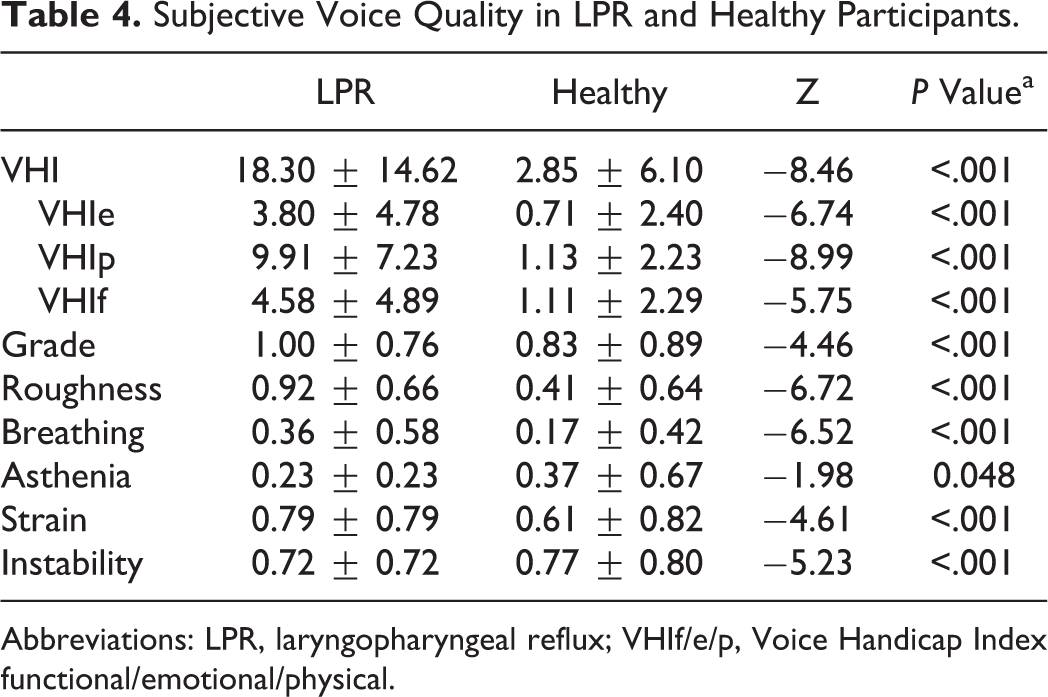
Abbreviations: LPR, laryngopharyngeal reflux; VHIf/e/p, Voice Handicap Index functional/emotional/physical.
The perceptual evaluation of voice quality by our jury reported that patients with LPR had more impaired scores of grade of dysphonia, roughness, breathiness, asthenia, strain, and instability than controls (Table 4). The aerodynamic analysis of voice quality of both groups revealed that only PQ was significantly better in healthy participants compared to patients with LPR (Table 5). With regard to acoustic analysis, healthy participants had significant better values of Jitt, Shim, vAm, STD, and NHR than patients with LPR. Our correlation analysis exhibited significant correlations between granulation score (Figure 1), Shim (correlation coefficient: 0.241, P < .05), and NHR (correlation coefficient: 0.228, P < .05). We did not identify significant correlation between vocal fold edema score and acoustic measurements.
Aerodynamic and Acoustic Measurements in LPR and Healthy Participants.
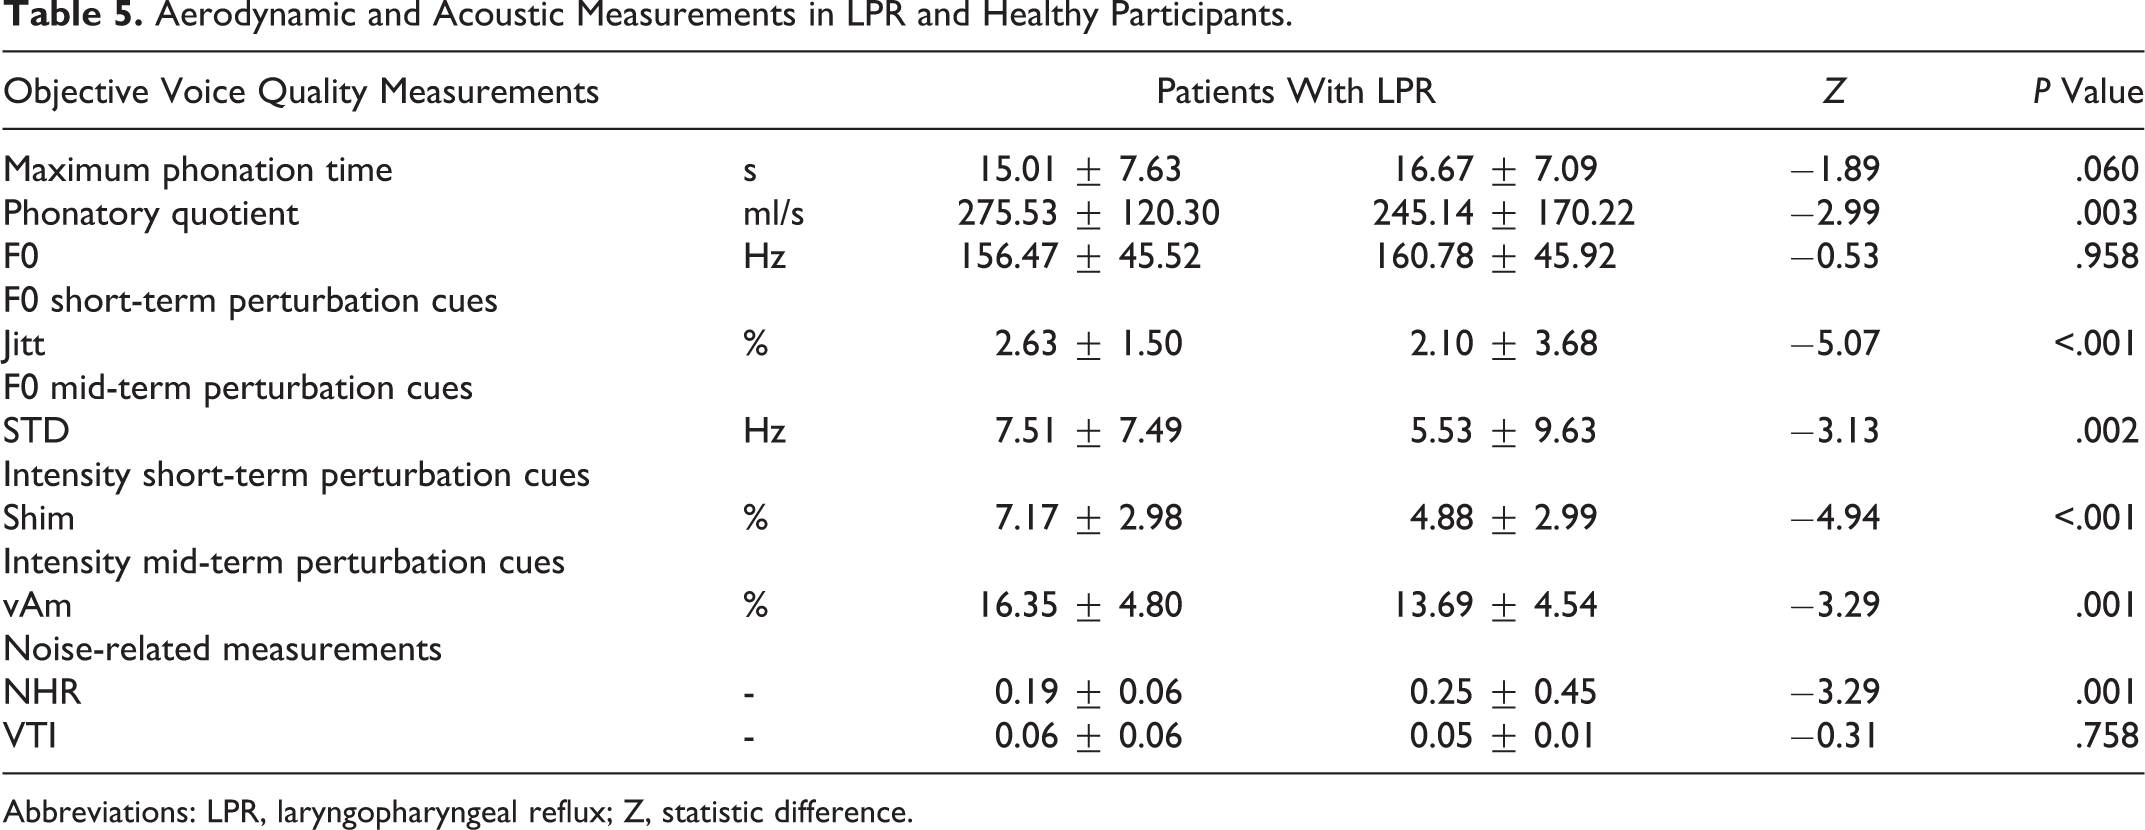
Abbreviations: LPR, laryngopharyngeal reflux; Z, statistic difference.
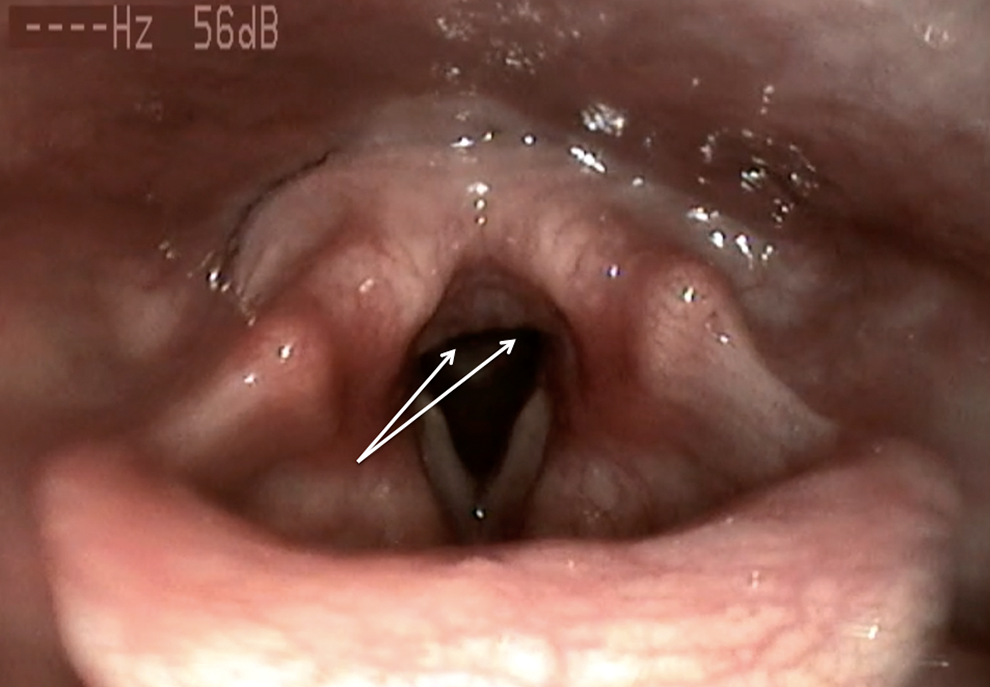
Granulations of the posterior commissure. Granulations of the posterior commissure (also called nodularity of the posterior commissure) is an inflammatory sign of LPR. It can be suggestive of chronic laryngeal irritation in LPR disease.
Discussion
The association between LPR and chronic laryngitis has been known for a long time but a few researches really studied laryngeal findings and voice quality in patients with LPR and healthy participants. First, we aimed to compare the subjective voice quality of healthy participants and patients with LPR. Clinically, the main LPR complaints reported in consultation were globus sensation and hoarseness. Moreover, according to RSI evaluation, hoarseness concerned 85% of our patients that corroborates the high prevalence of dysphonia related to LPR in the study of Lee et al who reported 79% of hoarseness in their 455 patients with LPR. 6 Our 2 studies and other 11 -13 strengthen the interest to better identify voice quality impairments related to LPR disease. With regard to the evaluations of subjective voice quality, patients with LPR had higher values of both VHI and perceptual voice quality (ie, grade of dysphonia, roughness, strain, asthenia, and instability) than healthy controls. Among the 5 case–control studies, only one 11 assessed subjective voice quality. So, in a cohort of 108 patients with LPR, Pribuisiene et al identified impaired scores of VHI and grade of dysphonia in patients with LPR in comparison with healthy participants. 11 Because the communicative disorder related to dysphonia can have a significant impact on overall voice quality, we studied the relationship between VHI and overall quality of life in patients with LPR. Thus, our correlation analysis identified a clear relationship between the communication handicap and many items of SF-36. These findings support that the communication disabilities related to LPR may negatively impact the overall quality of life of patients with LPR. Moreover, this association between the impaired voice quality and the overall quality of life has already been identified in some uncontrolled prospective studies. 7,24
Second, we observed that patients with LPR had stronger values of PQ and many intensity and frequency short- and midterm perturbation parameters than controls. Concerning aerodynamic measurements, Kumar and Bhat did not find significant difference in PQ values between LPR and control participants, even though they identified better values of MPT in healthy controls. 14 In the same way, Pribuisiene et al exhibited significant better values of MPT in the control group compared to the LPR group without calculating PQ, which is however recommended because it takes into consideration the VC of the participants. 11 Concerning the identification of impaired acoustic parameters in patients with LPR, the results reported in the case–control studies are mixed. Indeed, among the 4 studies that compared acoustic measurements between LPR and healthy participants, all reported different results. Percentage shimmer and percentage jitter were respectively identified as significantly different between LPR and healthy participants in three 10,11,13 and two 11,12 studies. The majority of these studies did not find substantial differences in the values of F0 and NHR between patients with LPR and healthy controls, which corroborates our findings. 10 – 14 Interestingly, as reported in the present study, Akyildiz et al showed that VTI is a better noise-related parameter to differentiate LPR and healthy participants than NHR. 13 The lack of concordance in the acoustic results of these studies is probably due to inconsistencies about the method used to measure acoustic parameters. Indeed, as demonstrated in a recent methodological study, depending on the selection of the time interval over which the acoustic parameters are measured, the potential effect of a treatment or the potential acoustic differences between groups may or may not be statistically demonstrated. 15 Among the 4 acoustic studies, authors of the first study measured acoustic parameters in the 3 central seconds of a sustained vowel 13 ; in the second study, physicians made the acoustic measure on an entire sustained vowel of 2 seconds 11 ; in the third study, the analysis was performed on the 3 most stable seconds of a sustained vowel (without providing any selection criteria of the most stable portion) 12 ; while in the last study, complete information about the method of acoustic measurements was unavailable. 10 This methodological question raises the matter of the nonstandardization of the measurement method of acoustic parameters. In the present study, we decided to perform the acoustic measurements on the entire signal of 3 sustained vowels because we consider this measurement sample as more representative of the voice quality of the patient than a selected interval of 2 or 3 seconds.
Third, the causality between LPR disease and voice disorders has not really been established, 9,16 even though some authors have long claimed that vocal fold edema is the main cause of hoarseness. 6 To date, no study has formally proven this affirmation. For this reason, we aimed to study the potential relationship between videolaryngostroboscopic findings and acoustic parameters. Indeed, acoustic parameters are very sensible tools in the detection of subtle voice changes and consist of an appropriate reference tool for our correlation study. Thus, our study of correlation did not report significant correlation between vocal fold edema and acoustic measurements. Furthermore, we identified a significant correlation between the granulation score and some acoustic parameters including percentage shimmer and NHR. These results corroborate those of Jin et al who did not find significant correlation between vocal fold edema and objective voice quality measurements such as acoustic parameters. 3 These results are not surprise because, in practice, the majority of patients who consult in our department have no vocal fold edema. According to previous systematic reviews, 8,9 our results suggest the need to explore other hypotheses able to support the etiology of hoarseness in LPR disease. Thus, hoarseness could be related to some macroscopic and microscopic histological changes in the mucosa of the vibratory margin of the vocal folds, including epithelial cell dehiscence, microtraumas, inflammatory infiltrates, Reinke’s space dryness, mucosal drying, and epithelial thickening. 9 The occurrence of these changes may be associated with modifications of the biomechanical properties of the vocal fold tissue, which are characterized by aerodynamic disorders and impairments of the periodicity of the vibration cycle and glottic closure. Moreover, our aerodynamic and acoustic results support the occurrence of both aerodynamic and acoustic impairments in patients with LPR disease. Precisely, the LPR voice quality disorder could involve the control of the stability of both glottal airflow and voice intensity that is reflected in the alterations of PQ and intensity perturbation parameters (ie, percentage shimmer, and vAm). However, we did not identify significant differences in F0 between groups that could be due to some compensatory mechanisms (muscular forcing) that overall preserve the mean F0 as well as increasing the instability of the vibratory process. Some of these signs are known to develop in the context of a chronic course of LPR disease such as keratosis 25,26 and microtraumas. 27 As demonstrated in a recent study, granulations of the posterior commissure may reflect a chronic history of LPR disease. 28 According to our observations, we suggest that the relationship between granulations and some acoustic parameters could indirectly report the presence of chronic inflammation of the larynx, including vocal folds, and histological and biomechanical properties changes of the vocal fold mucosa. However, our study does not confirm this hypothesis.
The use of RFS could represent a weakness of the study because many laryngeal signs (ie, laryngeal keratosis, ulcerations, or thickening of the vocal folds) that may be involved in the development of hoarseness are not described in RFS. 29,30 The lack of consideration of these signs limits the elaboration of a clear explanation about the occurrence of hoarseness in LPR disease. In addition, some aerodynamic measurements (ie, estimated subglottic pressure, voice intensity, etc) have not been used in the present study, although they would have improved our understanding of the pathophysiological mechanisms underlying the development of hoarseness. With the increasing data supporting the significant rate of nonacid reflux, 31 the lack of impedance-pH monitoring for all patients is another weakness, although the use of RFS and RSI is a cost-effective approach. It could be interesting to compare the cost and the efficiency of both approaches (empiric versus systematic use of additional examination). Another point that can be addressed in the future concerns the study of voice quality impairment according to the profile of reflux (acid, nonacid, mixed). This comparison makes sense with regard to some previous data that exhibited laryngeal finding differences between acid and nonacid patients. 31 The main strength of this study is the rigor of inclusion and exclusion criteria of both groups. Thus, the application of strict exclusion criteria (excluding a large number of confounding factors) and the realization of a clinical examination of healthy participants have ensured the composition of a reliable control group. Furthermore, the mean value of RSI total score in healthy participants was lower than previous publications 32 and the voice quality differences between groups were more pronounced than the other case–control studies.
Conclusion
The present study supports the association between LPR and voice quality impairments. Patients with LPR have more subjective and objective voice quality disabilities than healthy participants. However, if we do not exclude the involvement of vocal fold edema in the development of hoarseness related to LPR disease, our results suggest that it does not correspond to the main pathophysiological mechanism in the high majority of patients. Future studies are needed to precisely identify videolaryngostroboscopic signs that could be associated with the development of hoarseness in LPR disease.
Footnotes
Authors’ Note
Bernard Harmegnies and Sven Saussez contributed equally to this work and should be regarded as joint last authors.
Acknowledgments
The authors thank American Journal Expert for the proofreading of the manuscript. This research has been subsidized by the ARC NAUWB-2012-12/17-UMONS convention from Communauté Française de Belgique.
Declaration of Conflicting Interests
The author(s) declared no potential conflicts of interest with respect to the research, authorship, and/or publication of this article.
Funding
The author(s) received no financial support for the research, authorship, and/or publication of this article.