
Abstract
Keywords
Worldwide, there are 295 million people who have moderate to severe vision loss, and 43 million have total loss of vision, most of whom live in low- to middle-income living environments. Interacting with individuals experiencing any form of visual impairment (i.e., blindness or low vision) reveals the challenges they face in their daily functioning, social inclusion, communication, and work. Further complicating these challenges was the COVID-19 pandemic, since it posed new restrictions and, simultaneously, decelerated the development rate of innovative assistive technologies (Senjam et al., 2021).
Over the last decades, solutions have been proposed for both indoor and outdoor navigation. Specifically, indoor navigation solutions are based on inertial odometry (Ren et al., 2021), sensor-based pedestrian dead reckoning (Huang et al., 2019), indoor localization utilizing computer vision and deep learning on camera-based input or beacons readings (Koutris et al., 2022; Viset et al., 2022), as well as methods for reliably evaluating the adaptability of these solutions (Schyga et al., 2022). Likewise, outdoor navigation employs approaches incorporating both the smartphone sensors and external higher accuracy GPS receivers coupled with patent-pending novel routing algorithms (Theodorou et al., 2022a); deep learning computing vision for detecting user path obstacles, car directionality, and crosswalks near traffic lights (Chandna & Singhal, 2022; Das et al., 2021; Hsieh et al., 2021; Shelton & Ogunfunmi, 2020); and “smart” traffic lights devices for the safe passage of crossings (Theodorou et al., 2022a).
by answering questions on this article. For more information, visit:☑Earn CEs Online
Despite the abundance of assistive technologies, their biggest issue is the high abandonment rates of such technology. This problem is difficult to resolve, since acceptance depends on correctly performing the assessment of needs and desires; the application design; the selection of performant and cost-efficient equipment; the provision of customization, as well as the conduct of special training courses; and, finally, facilitating users to integrate assistive technologies into their daily life. Failure in any of these areas creates a negative proclivity against the assistive technology and, given their complexity, they do not become as useful as we hope them to be.
Another factor affecting acceptance of assistive technology, according to Lee et al. (2020), is users’ perception of technological solutions, which, in turn, depends on whether users have direct or indirect experience with them. The present study highlights the significant positive effect of the former on users’ opinions about assistive technology. One way to facilitate direct experiences with assistive technology is during orientation and mobility (O&M) courses, since training is a key ingredient that could decrease abandonment of assistive technology.
Having a framework to understand technology acceptance can help researchers better understand the strengths and weaknesses of any assistive technology solution. Technology acceptance has matured over the years and can be used to study assistive technology systems. However, acceptance of assistive technologies is an area that has not been widely explored for people with visual impairments, and the existing literature neglects the importance of training as an influencing factor.
In this paper, the link between training and acceptance of technology was explored in terms of the degree to which an improvement in training can positively affect the acceptance of assistive technology in general. We pursued this goal by extending the widely used Unified Theory of Acceptance and Use of Technology (UTAUT) model and testing its applicability and effectiveness.
In the next section, Background and Methodology, we present the original and extended research model, followed by the hypotheses we made, and proceed with the methodology utilized in assessing their correctness. The Results section presents both the questionnaire's and measurement model's validity, the exploratory factor analysis, confirmatory factor analysis, structural equation modeling results, and user experience results. The Discussion section addresses the results’ significance, current limitations, and describes the road ahead. The Conclusion restates the paper's takeaways.
Background and Methodology
Research Model
UTAUT forms the basis for the model proposed in this paper. Previous research (Dwivedi et al., 2011; Fusilier et al., 2008; Oshlyansky et al., 2007; Scherer, 2016) has demonstrated its effectiveness in describing the variance of the intention to use an application up to 70% (Aggelidis & Chatzoglou, 2009). In behavioral research, UTAUT is considered to have a high prediction ability and constitutes a significant result, since it explains over 40% of the acceptance variance (Venkatesh et al., 2003), showing an improvement over the previously existing models.
UTAUT utilize four constructs to explain behavioral intention of information systems: performance expectancy, effort expectancy, social influence, and facilitating conditions. Behavioral intention and facilitating conditions predict usage behavior while performance expectancy and effort expectancy, and social influence are key determinants of behavioral intention. The key relationships are controlled by users’ experience, gender, age, and voluntariness of use. Gender and age control performance expectancy while gender, age, and experience control effort expectancy. All factors impact social influence while voluntariness is impacted by experience and age. However, due to the widespread use of smartphones, experience and voluntariness of use are no longer relevant. Similarly, to Moon et al. (2020), we chose factors relevant to the personal characteristics and attitudes of blind individuals.
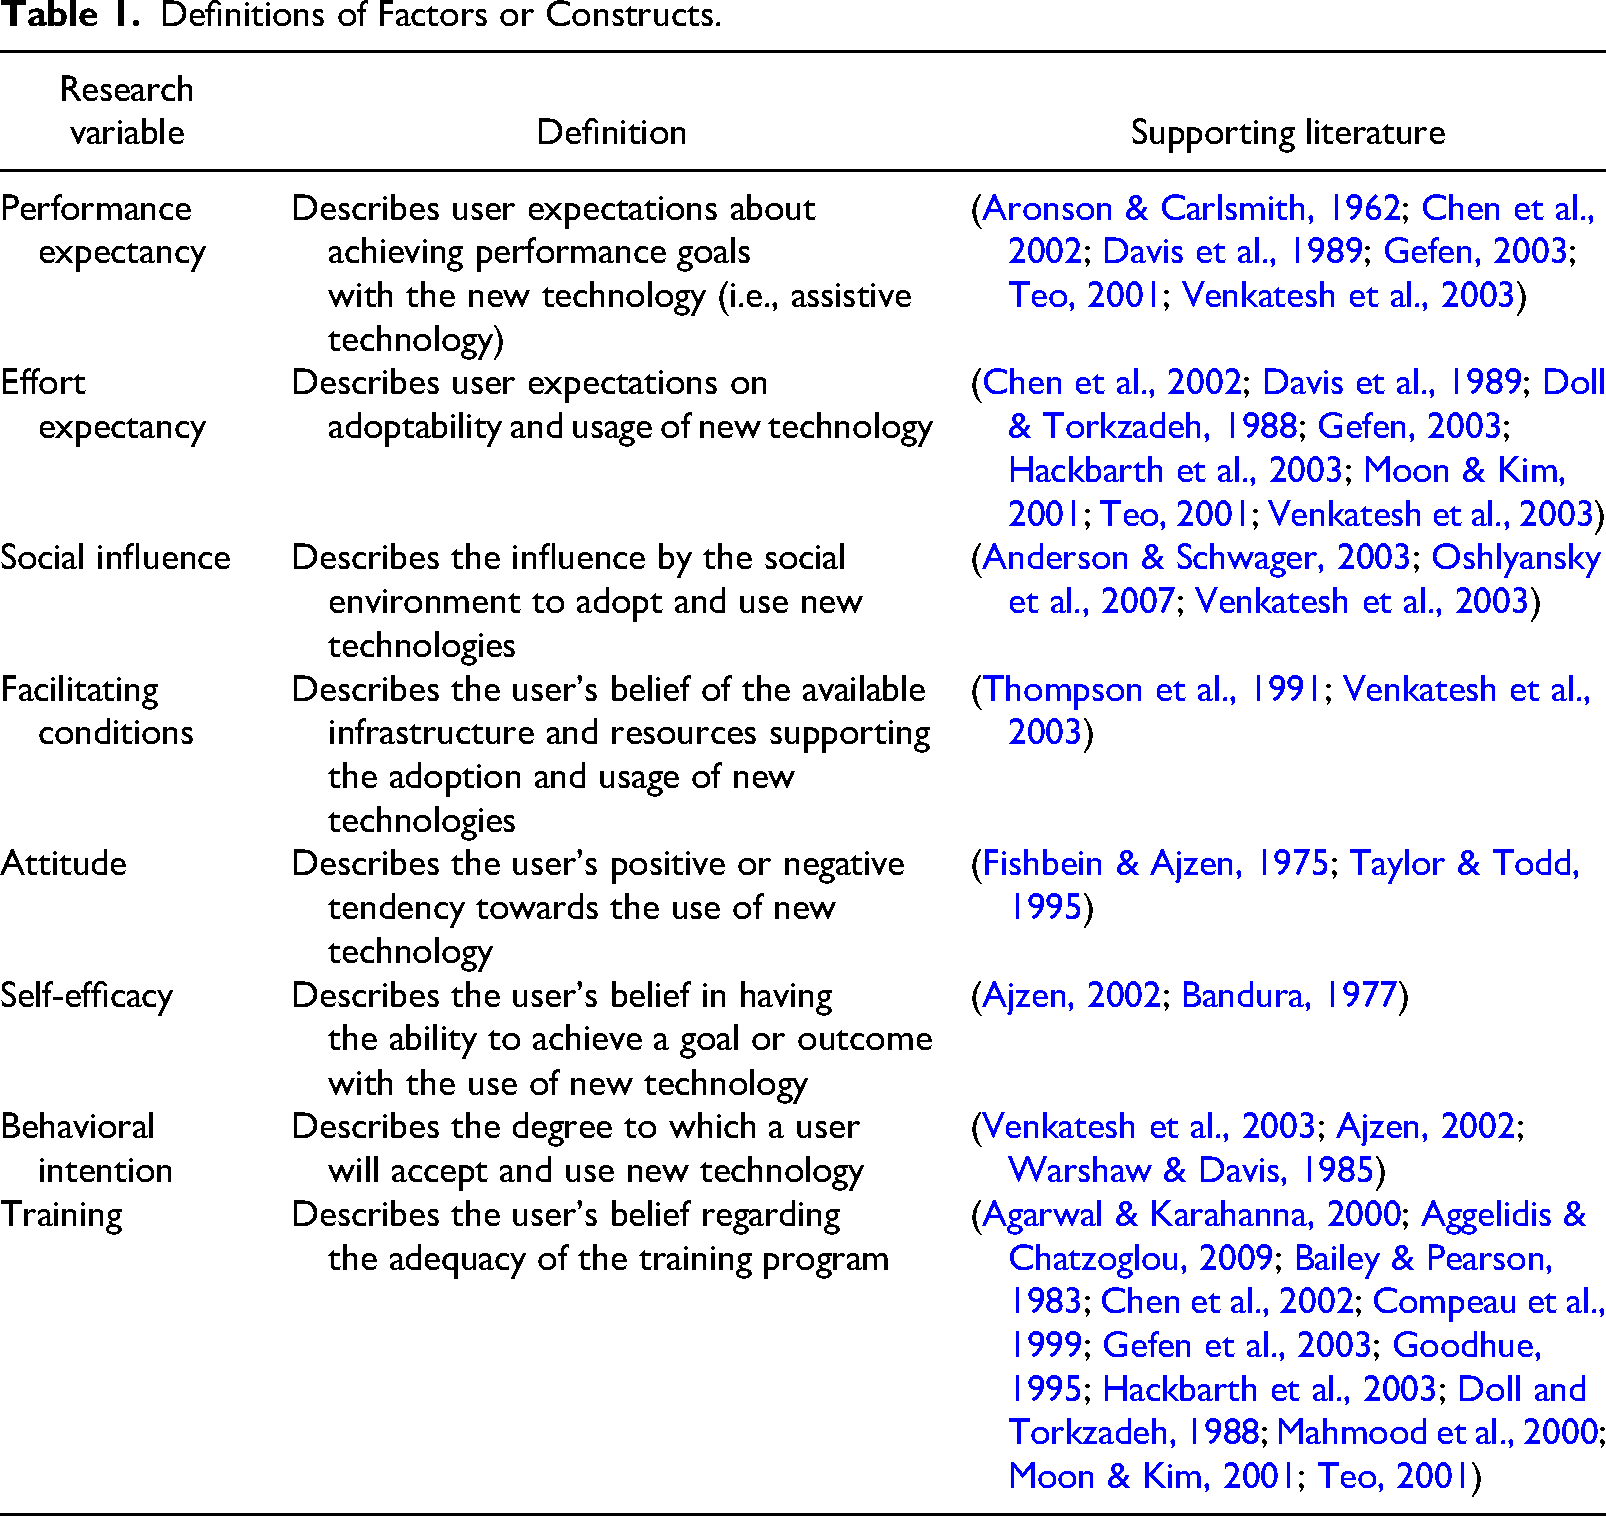
Theodorou et al. (2022a), while developing assistive technologies for indoor and outdoor navigation by people who are visually impaired, highlighted the importance of training. Thus, we were motivated to examine it as an independent factor even though it is usually part of the facilitating conditions construct. Our model adds training to the existing factors and hypothesizes that they are moderated by age, gender, attitude, and self-efficacy. Figure 1 depicts the relations between the factors and Table 1 describes their definition.
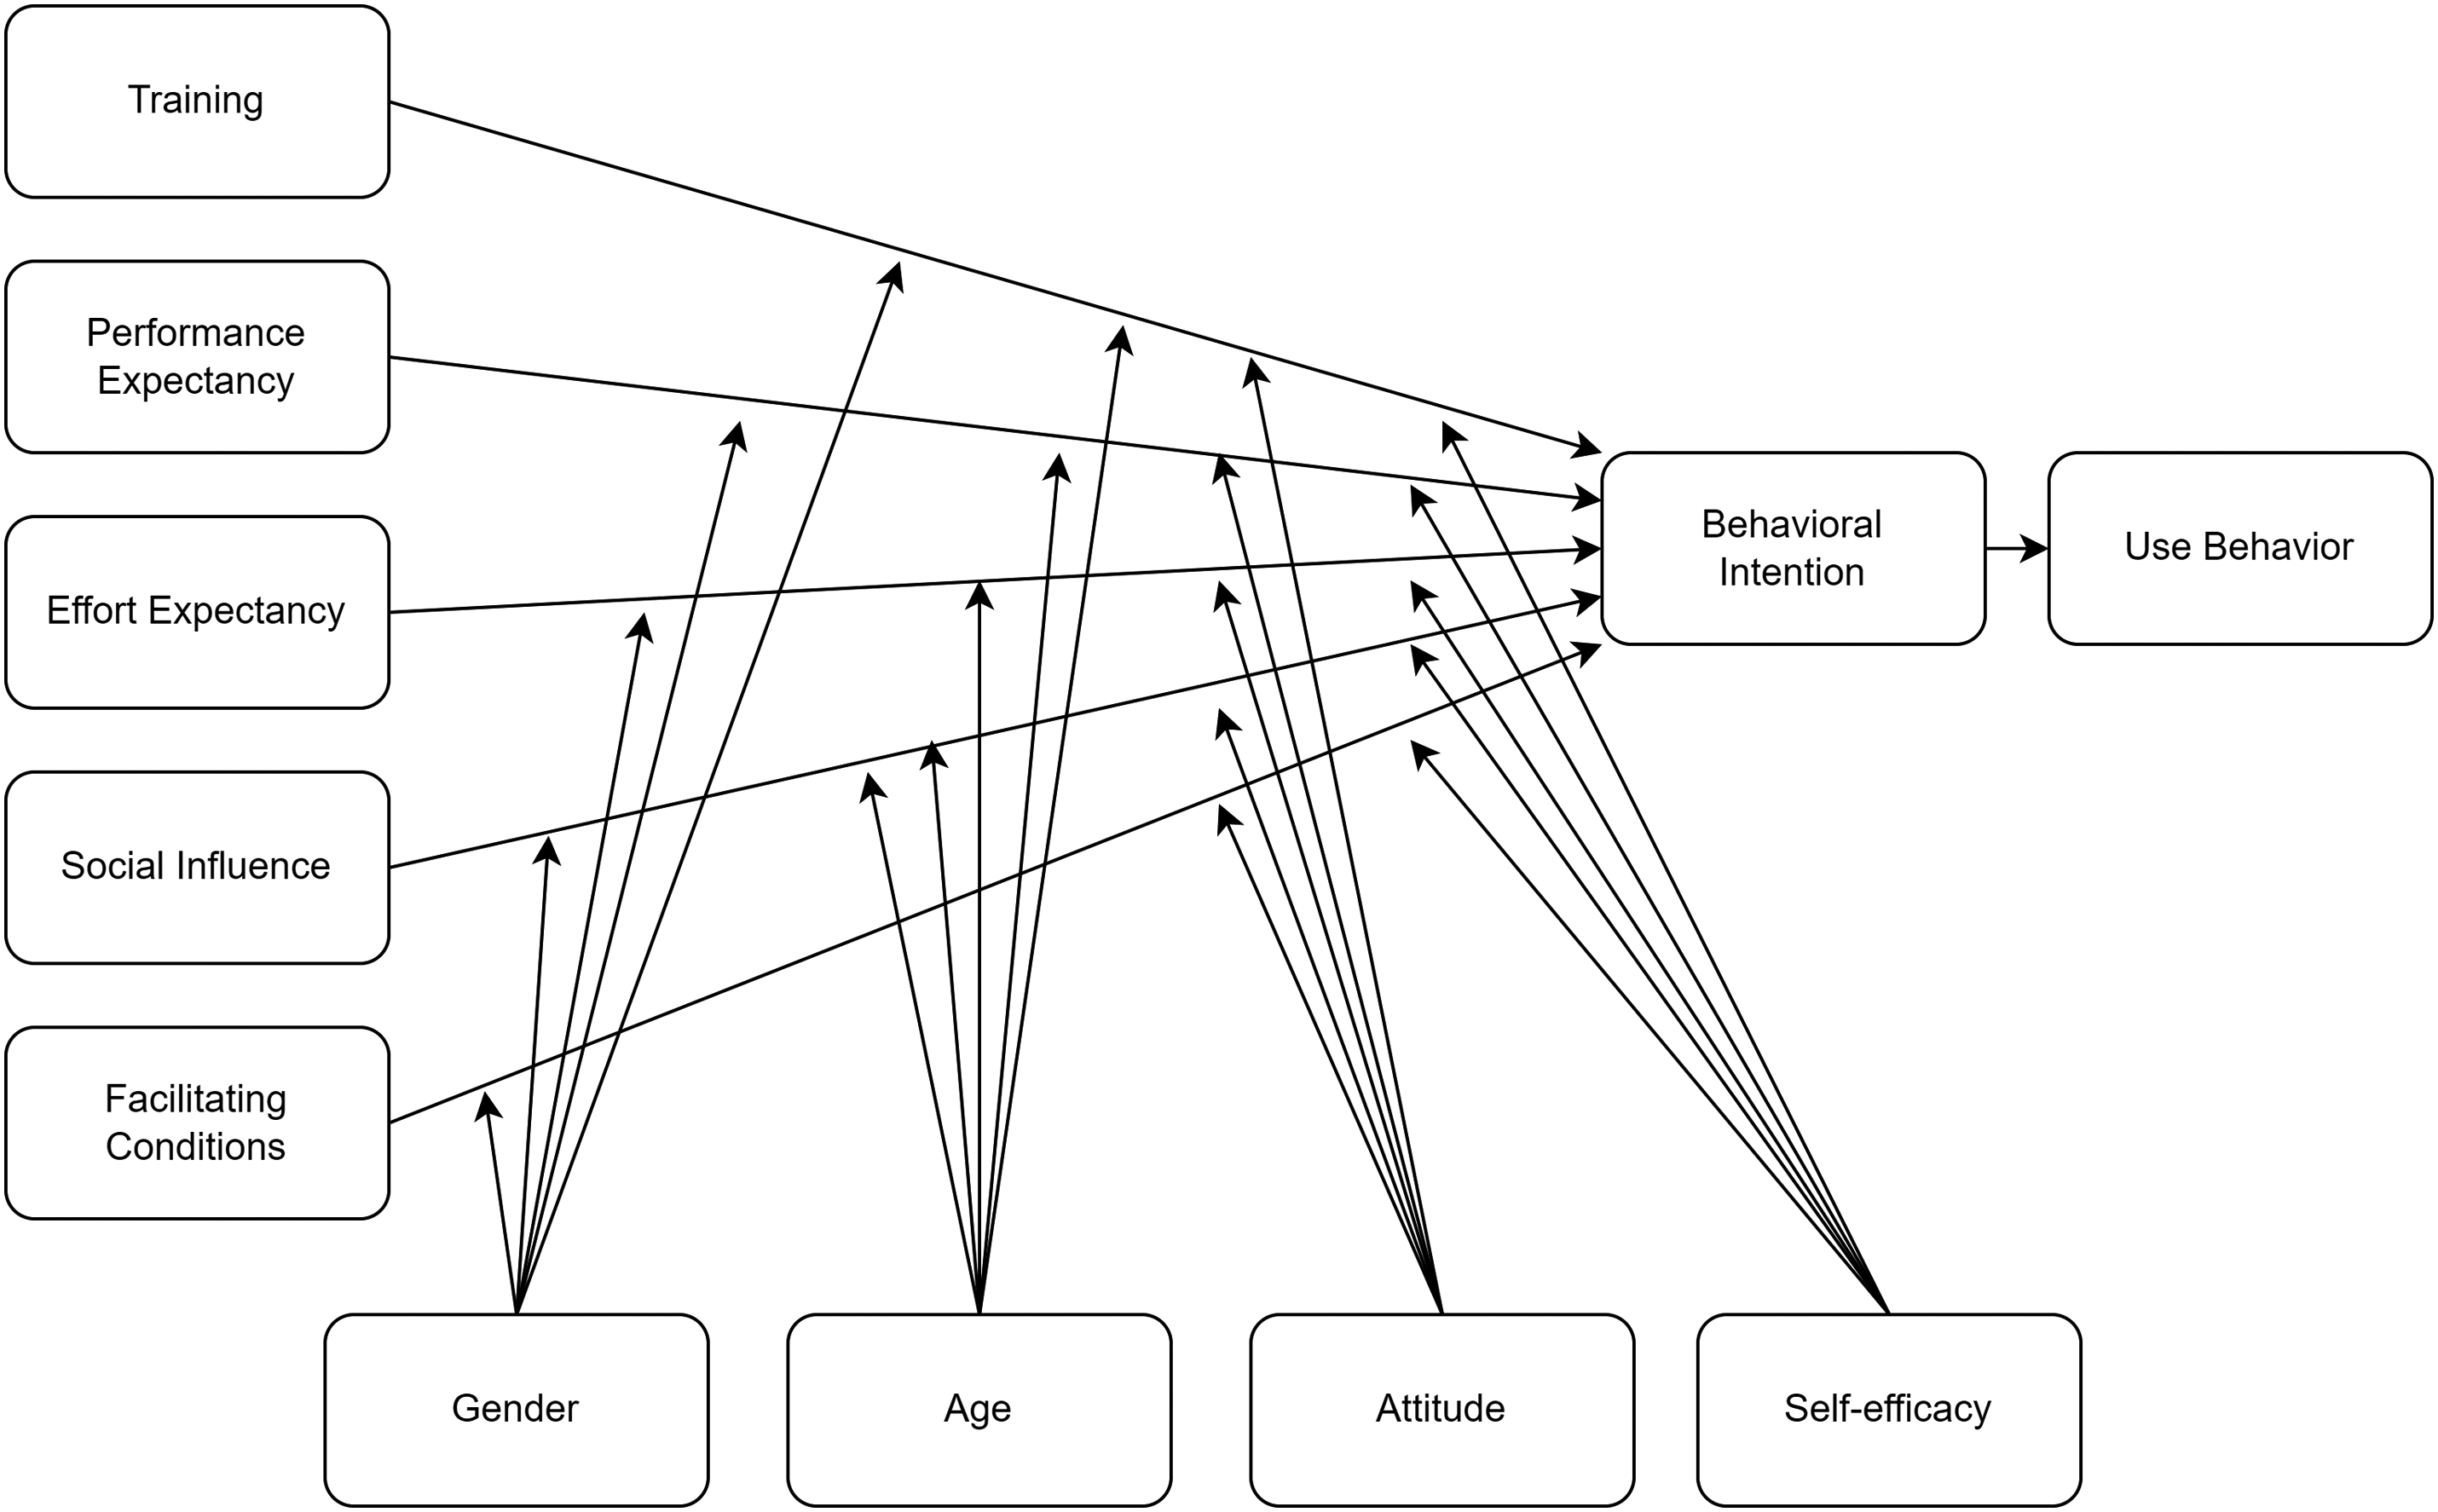
Extended UTAUT Model.
Definitions of Factors or Constructs.
Model Hypotheses
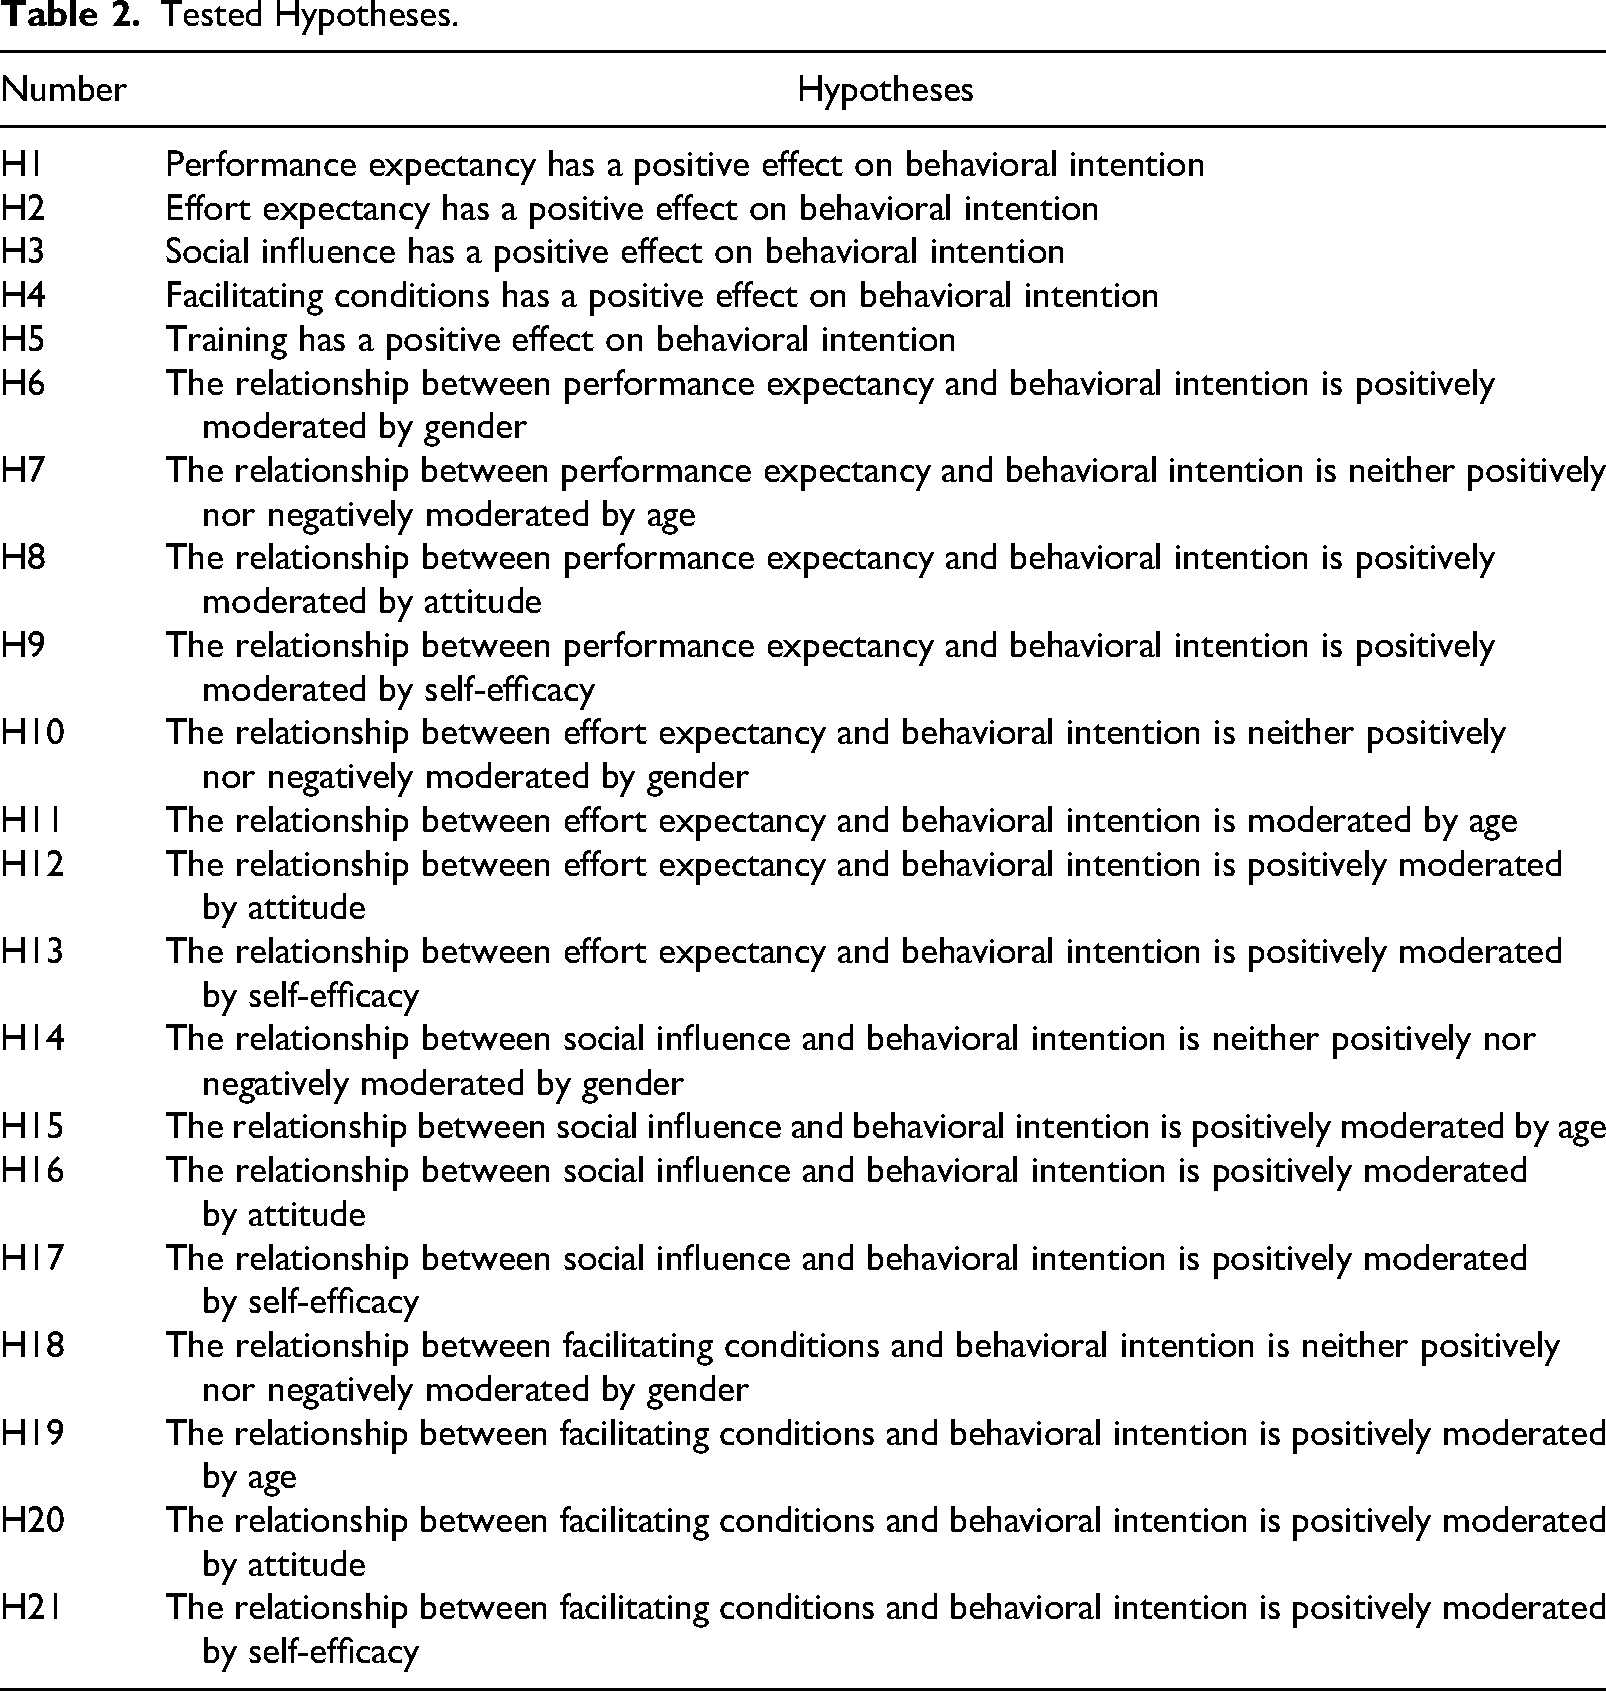
This study examines the causal relationships contained in Table 2. They predict the effect of constructs or factors on behavioral intention regarding the adoption of an outdoor navigation mobile application for people with visual impairments that was developed by our research team.
Tested Hypotheses.
Methodology
To examine the model's validity, we conducted a study with 231 participants. Furthermore, we conducted a usability and user experience evaluation employing the methodology followed by Theodorou et al. (2022a) and Theodorou et al. (2022b). The sample consisted of individuals with a wide range of visual impairments and ages, all coming from different socioeconomic backgrounds. In particular, the genders were almost equally represented with 55.6% being males and 44.4% females with ages between 35 and 60. The participants were 53.8% completely blind, 38.4% almost completely blind, and the remaining had severe visual impairments. Congenital blindness was the most frequent cause (61.5%), while the rest were due to other causes such as cancer and retinopathy. Finally, 48.1% had low digital skills.
Questionnaires were the main technique for gathering data. We were interested in gathering information about the population's demographic characteristics, assessing the extended UTAUT model, assessing usability and user experience, and, finally, semi-structured interviews for user feedback on functionality. The questionnaires were either via Google Forms or in the vicinity of the Lighthouse of the Blind in Greece.
Disclaimer: Informed consent was obtained from all participants involved in the study. Written informed consent for publication was not required and, therefore, was not obtained from anonymized users participating in the system evaluation. All procedures performed in studies involving human participants were in accordance with the 1964 Helsinki declaration and its later amendments or comparable ethical standards.
Results
IBM SPSS was utilized for conducting descriptive and exploratory factor analysis and IBM AMOS for confirmatory factor analysis followed by structural equation modeling. This method of analysis is the standard procedure as suggested in Anderson & Gerbing (1988) and followed by many similar studies (Aggelidis & Chatzoglou, 2009; Baroni et al., 2022; Moon et al., 2020). The assessed model is depicted in Figure 1.
Exploratory Factor Analysis and Exploratory Factor Analysis: Item Reliability and Measurement Model Validity
Principal factor analysis was selected for preliminary assessing the constructs’ validity (Ajzen, 2002) while Promax with Kaiser Normalization as the rotation method. According to Bandura (1977) items related to a construct must exhibit higher loadings values while manifesting lower ones on unrelated constructs.
Next, for the exploratory factor analysis stage, we modeled the extended UTAUT model factors as latent variables and measured them via a questionnaire (see Appendix A). Robust maximum likelihood estimation was used to estimate the exploratory factor analysis model and measured the following:
the items’ loading on UTAUT factors (i.e., item reliability); and UTAUT factors’ correlations (i.e., discriminant validity).
The standard recommendation for an acceptable measurement item's loading coefficient is an absolute standardized value of 0.5 and above. Anything lower indicates a lack of the construct or factor to explain the variance of the item and, thus, is of low reliability. To test the measurement model's convergent validity, we followed the Fornell and Larcker methodology (1981). This method computes for all constructs or factors the composite reliability, which measures internal consistency and the average extracted variance, which measures the construct's variance related to the measured variance affected by the measurement error. For composite reliability, the threshold is 0.70 while for average extracted variance is 0.50. In addition, we report each construct's Cronbach’s alpha coefficient values. Finally, we tested discriminant validity by performing exploratory factor analysis runs examining the constructs’ relationship and covariance. According to Fornell and Larcker (1981), the average variance's square root of a construct's items sets the upper limit the inter-items correlations of any two constructs should not exceed. Furthermore, the heterotrait-monotrait ratio of correlations was used to access discriminant validity.
Model-fit assessment utilized the following goodness-of-fit measures: comparative fit index (CFI), Tucker-Lewis index (TLI), and the root mean square error of approximation (RMSEA). To maximize model fitting, the modification index suggestions were taken into consideration.
Exploratory Factor Analysis and Exploratory Factor Analysis Results
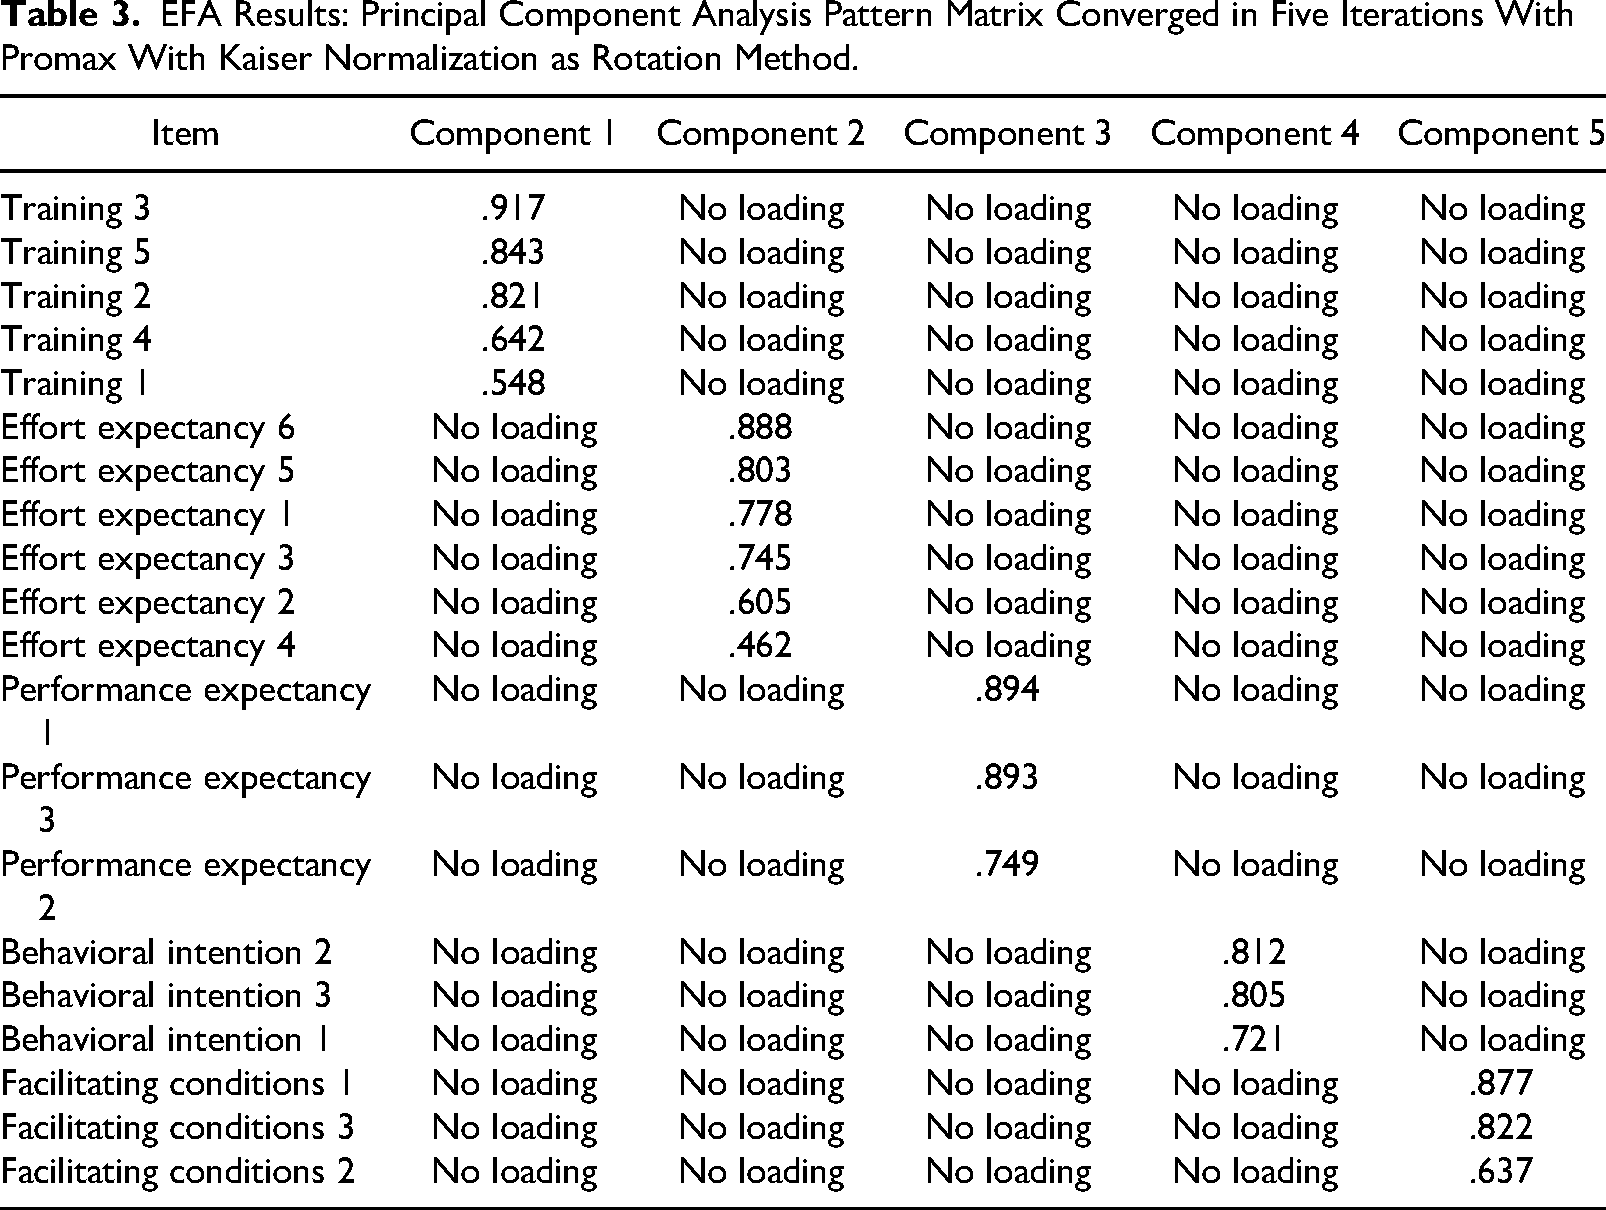
We start by demonstrating the exploratory factor analysis results. Table 3 demonstrates that the questionnaire items measure the constructs as originally intended.
EFA Results: Principal Component Analysis Pattern Matrix Converged in Five Iterations With Promax With Kaiser Normalization as Rotation Method.
Next, the exploratory factor analysis results are presented. Table 4 demonstrates the questionnaire items’ loadings on the constructs being above the required threshold and statistically significant (p < .001).
Factor Loadings of Items on Constructs.
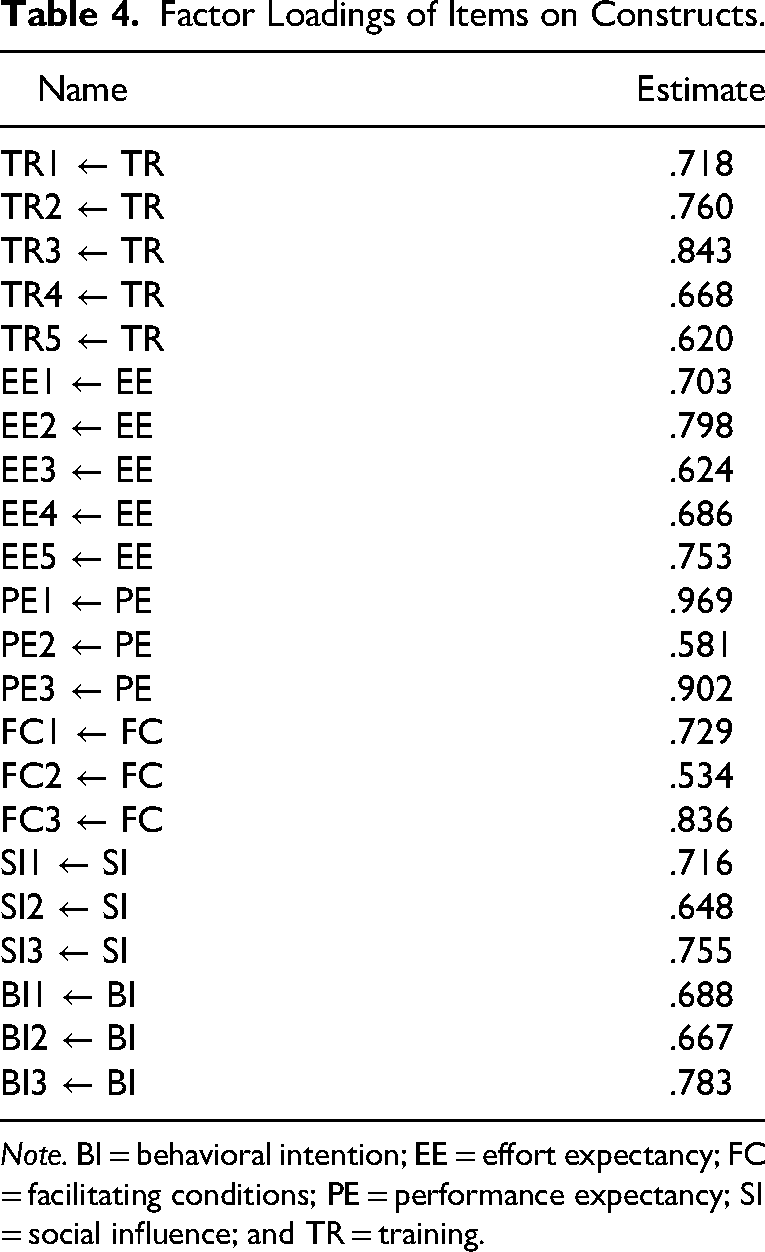
Note. BI = behavioral intention; EE = effort expectancy; FC = facilitating conditions; PE = performance expectancy; SI = social influence; and TR = training.
Table 5 presents the convergent validity results of the measurement model as measured by composite reliability and average extracted variance, satisfying the Fornell and Larcker criterion as well as the heterotrait-monotrait threshold. We also note that the Cronbach's alpha coefficients were above the desired thresholds.
Validity Analysis Measures.
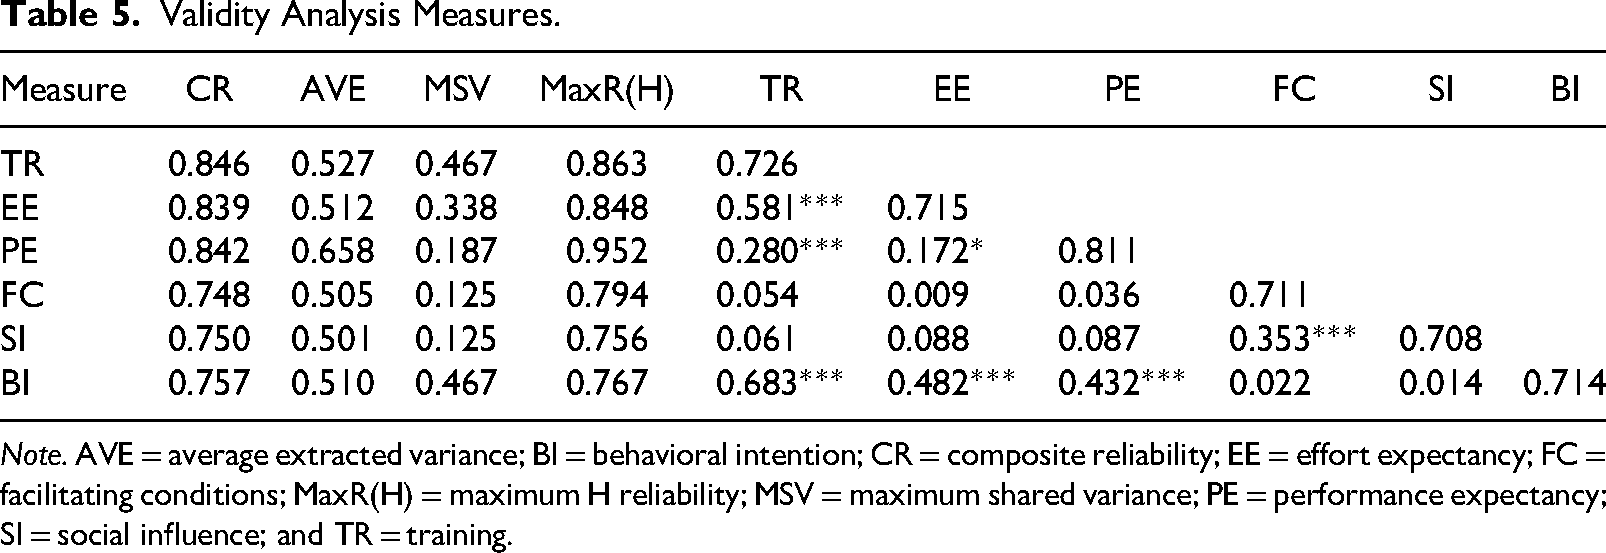
Note. AVE = average extracted variance; BI = behavioral intention; CR = composite reliability; EE = effort expectancy; FC = facilitating conditions; MaxR(H) = maximum H reliability; MSV = maximum shared variance; PE = performance expectancy; SI = social influence; and TR = training.
The exploratory factor analysis model yielded a good fit (CFI = 0.957, TLI = 0.947, and RMSEA = 0.045). Finally, we measured the model's invariance across the different gender and age groups. We considered two genders (male and female) and two age groups (over and under 40 years of age). First, we checked the configural invariance followed by a metric invariance check. The former tests whether the measurement model is equivalent across groups while the latter tests whether the constructs have the same meaning across the different groups. Examining the model fit and model comparison statistics highlights the equivalence of our measurement model among gender and age groups.
Structural Equation Model
Structural equation modeling explored the effects of performance expectancy, effort expectancy, social influence, facilitating conditions and training (our newly proposed latent variable) on predicting behavioral intention and the moderation effects of attitude, age, self-efficacy, and gender on these relationships. Our method of choice was the robust maximum likelihood estimation.
The analysis concluded that most hypotheses were rejected except for the first (“performance expectancy has a positive effect on behavioral intention”) and fifth (“training has a positive effect on behavioral intention”), which were found to be statistically significant. These concern the link between performance expectancy and training with behavioral intention respectively. In particular, the effect of both factors is positive and significant (p < .001), with a standardized regression weight of 0.264 and 0.538 respectively. This finding suggests that an increase in training makes it more plausible for an individual to stick with the application. Likewise, the positive effect of performance expectancy on behavioral intention means that it is more plausible for the technology to be used in the future on the condition it remains useful.
Subsequently, we examined the moderator variables’ effect (gender, age, self-efficacy, and attitude) on the relationships between the five factors or constructs and behavioral intention. The analysis indicated that gender, age, and self-efficacy do not demonstrate any significant interaction effect on the examined relationships except for attitude with the latent factor of training. It demonstrated a significant interaction (p < .007) strengthening the positive relationship between training and behavioral intention (standardized regression weight 0.142). Finally, the structural equation modeling model yielded a good fit (CFI = 0.957, TLI = 0.947, and RMSEA = 0.045).
Qualitative Analysis: User Experience Evaluation and Usability
The qualitative analysis assessed the application's user experience characteristics and usability. For the former, we used the modular User Experience Questionnaire Plus (UEQ+) framework while for the latter, we employed the measures of effectiveness and efficiency. For this evaluation, we selected the following user experience scales: (1) efficiency, (2) dependability, (3) perspicuity, (4) adaptability, (5) usefulness, (6) trustworthiness of content, and (7) response behavior. For a more detailed presentation of the employed processes, tools and concepts as well as the definitions of the usability measures, readers can refer to Theodorou et al. (2022a).
All scales demonstrated a Cronbach’s alpha coefficient score above the threshold of 0.7, thus proceeding with confidence about the result's reliability.
The analysis demonstrated a positive evaluation of the application. Adaptability (0.67), which describes the application's customizability, was the least preferred. On the contrary, usefulness (1.05) and dependability (1.02) received the highest scores: the application, according to the users, removes pedestrian navigation restrictions, and they highlighted the reliability and predictability of the operation. Closely following were efficiency (0.88), since users achieved their goals both quickly and efficiently, and trustworthiness of content (0.86), which emphasizes navigational information quality. Perspicuity (0.83) received a score that indicated the desire for improvements in operation learnability, followed by response behavior (0.72), which demonstrates the users’ request for better-quality characteristics regarding the application's issued instructions. Finally, the UEQ + key performance indicator demonstrating the overall user experience impression received a positive score of 1.18.
The values of the participants' answers ranged between 3 and 7, while 70% of the answers received a score between 4 and 5.
Usability, on the other hand, was evaluated with fewer participants (62 out of 231), given the challenges of large-scale trials with people who are visually impaired. Three tasks were employed in this phase. These included (1) the completion of a known and unknown pedestrian navigation route, (2) public means of transport combined with pedestrian navigation, and (3) the passage of traffic lights marked crossings. After the analysis, effectiveness was measured to be 74.5% while efficiency was 72%.
Discussion
Despite the plethora of assistive technology solutions, their acceptance and usage rate are very low. Although we do understand that many of the efforts are of exploratory nature, nonetheless, there are still enough attempts to try to address the everyday challenges of the target group. This lack of acceptance inevitably raises the question, Why have none of these efforts have been widely established? A possible answer could be the fact that either user evaluation is poorly conducted, or they disregard the practicality of their solutions in favor of more features.
A step closer to addressing the negative predisposition of people who are visually impaired towards assistive technologies would be to conduct training sessions in as close to real-life scenarios as possible while also minimally disrupting the habits acquired over the course of many years. The incorporation of assistive technologies in training courses besides teaching critical O&M skills more effectively improves the digital sophistication of people who are visually impaired. However, executing proper training courses requires resources, both human and technical, and know-how of the particularities.
The exploration of training as a new factor or construct of the widely used UTAUT model for people with visual impairments was the result of observing a difference in intention to use the application before and after the completion of the training courses. Thus, we conjectured that training, although usually part of facilitating conditions, should be an independent factor or construct as it could potentially affect behavioral intention, the factor that drives actual usage of technology according to the UTAUT model.
From the conduct of exploratory factor analysis and structural equation modeling analysis, we uncovered that no factor besides performance expectancy (standardized regression weight = 0.264, p < .001) and training (standardized regression weight = 0.538, p < .001) significantly predict behavioral intention. Furthermore, the analysis demonstrated a significant interaction (p < .007) strengthening the positive relationship between training and behavioral intention (standardized regression weight = 0.142). These findings demonstrates the plausibility for a person with a visual impairment to adopt an application if they are properly trained and acquainted with the features and the way the application responds to real-life scenarios as well as whether they find the application to be beneficial for their day-to-day life and activities.
Behavioral intention was not significantly predicted by social influence. To a certain extent, this result is justified, since more than 66% of the participants were aged 40 years old and above, an age group that is not that easily influenced by their social environment. Likewise, facilitating conditions had no significant impact on the factor of behavioral intention. This partial satisfaction of the UTAUT model is found in other similar attempts in the literature as it is demonstrated in the Dwivedi et al. (2011) meta-analysis.
We acknowledge that the validity of our proposed model is not conclusively proven with this use case study. However, it does bring forth the role of training in UTAUT under the context of assistive technologies for people with visual impairments. In the future, we intend to further validate our proposed model with a variety of assistive technology applications, as well as education platforms adjusted for sensory disabilities.
Another limitation of our proposed model is the inability to determine the actual usage despite the intention to use assistive technologies being a predictor of actual usage. Tracking the use of assistive technologies by study participants, however, is not always feasible.
A limitation affecting the generality of the user experience results is the unidimensional representation of geographical regions and languages, along with limited diversity in terms of the living environment, gender, age, and previous experience with assistive technologies. In the future, the inclusion of participants from around the globe facilitated through related World Wide Web communities can help to address this limitation.
Another concern related to the process of employing questionnaires to evaluate UTAUT, usability, and user experience is the possibility of the participants responding with bias due to the socioeconomic characteristics and preferences of the interviewer (Dell et al., 2012). Although the questionnaires were distributed via digital communication channels, guaranteeing the separation of participants from researchers, there were cases in which help from the research team was requested. Participants with low digital sophistication especially needed such help. In the near future, we plan to also release the questionnaires in braille to ameliorate this limitation.
Conclusion
We tried to comprehend and address the issue of low technology acceptance by people with visual impairments related to smartphones, which are the most widespread solution for providing assistive technologies. The result of this work revealed a multitude of contributing factors (learning and exploring, adapting mental models, accessibility of applications, forced interfaces, ubiquitous accessibility information, enabling sharing, and peer support) and many possible ways to address the issue. Given the scarcity of available resources, it is not realistically possible to address them all. It is our conviction that introducing specifically designed training courses will have the greatest effect on technology acceptance. We believe training is of paramount importance, so we incorporated it as a factor in UTAUT. We evaluated the model and experimentally tested it on the application for outdoor navigation of people with visual impairments (Theodorou et al., 2022a). Although this research is the first evaluation of our proposed UTAUT model, we believe it can describe more accurately the acceptance of assistive technology solutions.
The analysis demonstrates that behavioral intention is strongly and positively affected by performance expectancy and training while assistive technology acts as a positive moderator on the relationship between training and behavioral intention. Despite being an early result, it highlights the importance of training in technology acceptance. This result can be leveraged by other research teams to make appealing solutions to people with visual impairments, thus, moving a step closer to the desired goal of lifting the barriers as dictated by the social model of disability. Finally, future work will involve the application of the extended model to other systems, possibly refining or even further extending it.
Supplemental Material
sj-docx-1-jvb-10.1177_0145482X241231990 - Supplemental material for Challenges in Acceptance of Smartphone-Based Assistive Technologies: Extending the UTAUT Model for People With Visual Impairments
Supplemental material, sj-docx-1-jvb-10.1177_0145482X241231990 for Challenges in Acceptance of Smartphone-Based Assistive Technologies: Extending the UTAUT Model for People With Visual Impairments by Paraskevi Theodorou, Kleomenis Tsiligkos and Apostolos Meliones in Journal of Visual Impairment & Blindness
Footnotes
Declaration of Conflicting Interests
The author(s) declared no potential conflicts of interest with respect to the research, authorship, and/or publication of this article.
Funding
The author(s) disclosed receipt of the following financial support for the research, authorship, and/or publication of this article: Τhis research was supported by the MANTO project funded by the National Operational Programme Competitiveness, Entrepreneurship & Innovation - EPAnEK 2014-2020 under contract 593.
Supplemental Material
Supplemental material for this article is available online.
References
Supplementary Material
Please find the following supplemental material available below.
For Open Access articles published under a Creative Commons License, all supplemental material carries the same license as the article it is associated with.
For non-Open Access articles published, all supplemental material carries a non-exclusive license, and permission requests for re-use of supplemental material or any part of supplemental material shall be sent directly to the copyright owner as specified in the copyright notice associated with the article.