
Abstract
The field of orientation and mobility (O&M) has importantly reported on drivers’ yielding to pedestrians who are blind in various circumstances and at different intersection geometries; however, there are no studies that have compared the behavior of drivers in daylight to low-light conditions. The early twenty-first century saw a noticeable interest, within the field of O&M, in drivers’ behaviors toward pedestrians, especially at locations considered to be particularly difficult for pedestrians who are blind, such as roundabouts (Ashmead et al., 2005; Geruschat & Hassan, 2005). Beginning in 2011, a series of research studies were published exploring drivers’ delay and yielding rates to a pedestrian utilizing a mobility cane, as well as specialized roadside signage (Bourquin et al., 2011, 2014, 2017, 2018; Sauerburger et al., 2012). These contemporary studies showed, across research conducted during daylight hours, a consistent hierarchy of effects related to pedestrian behaviors at a crosswalk, with increasing yielding resulting from lowest to highest: a simple cane display; flagging a cane; using a hand gesture; and a cane flag along with a reversible forward step.
Although unexplored in the yielding literature, the effect of nighttime travel upon the safety of pedestrians is well known in an immense corpus of traffic and injury prevention literature from the United States and around the world (Spainhour et al., 2006). Pedestrian risks are generally greater in lower-light conditions (National Transportation Safety Board, 2018). Higher levels of danger for pedestrians at night are related to conspicuity, how well and how often pedestrians
by answering questions on this article. For more information, visit:☑Earn CEs Online
Research has shown that accidents with pedestrians are far more frequent at night and twilight than during the day (Pour-Rouholamin & Zhou, 2016; Spainhour et al., 2006). There appears to be no significant disagreement among traffic management researchers that roadway lighting is related to incidences of death; the majority of pedestrian deaths in the United States, around 75%, happen in the evening and nighttime (National Transportation Safety Board, 2018). Pour-Rouholamin and Zhou (2016) found that pedestrian fatalities in the dark were three times more likely, and Spainhour et al. (2006) stated that “[d]ark conditions or insufficient lighting was a contributing factor in 60% of the cases” and a primary contributing factor in pedestrian mortality in Florida (p. 90). Not only do lower-light conditions correlate highly with pedestrian accidents and deaths, the relative frequency and severity of these crashes during the night are also significantly higher than during daylight (Batouli et al., 2020). Siddiqui et al. (2006) found that pedestrian crashes were 54% higher at night when there was street lighting present and 83% higher when lighting was absent.
A recent Federal Highway Administration report (2022) recommended, but did not require, a minimum of vertical illumination of 30 lux. The authors noted, . . . FHWA [Federal Highway Administration] research report considered the ability of pedestrians to see and detect hazards on walkways and crosswalks, the visibility of pedestrians to motorists, and impacts of lighting on pedestrian decisions related to whether to cross a roadway. (p. 2)
Heretofore, as far as the researchers can determine, all yielding studies were conducted during daylight hours. Unexplored in the O&M literature are the driver-pedestrian dynamics of yielding in nighttime scenarios when roadside lamp illumination is the source of lighting. Therefore, we sought to answer the following research question: Is there a difference in drivers’ yielding behavior during daytime and nighttime hours at crosswalks that are lighted by streetlamps? The study was submitted to the Western Michigan University institutional review board. Because there were no human subjects in the study, it was determined that no IRB approval was required.
Methods
In order to assess whether there were differences in drivers’ yielding between daylight and low-light conditions, the researchers collected data at two urban and one suburban intersection, during the day and in the evening, using two different pedestrian-cane conditions at each site. Daylight trials were conducted in summer between 8:30
For each trial, a collaborating pedestrian, a 6-foot-tall male who appeared to be blind, using a standard mobility long cane (an Ambutech 56-inch, 4-section, folding fiberglass cane, white with a bottom red strip), approached and stood at the curb in the center of the marked crosswalk at a corner, when drivers at a red signal were prepared to make right turns. Right-turn-on-red was not permitted at these intersections. The pedestrian positioned himself to begin a counterclockwise crossing. The collaborating pedestrian (one of the researchers) wore dark casual clothing, a cap, and dark sunglasses. The pedestrian behaviors (conditions) were selected because they were either determined to be standard practice in the field (Fazzi & Barlow, 2017; Jacobson, 2013) or were known to elicit modest amounts of yielding (Bourquin et al., 2014).
A trial was considered valid when the first vehicle in the lane behind and to the immediate left of the pedestrian turned right after the vehicular circular green signal was lit on the typical three-lamp signal head. There were no dedicated left turn lanes at the intersections; however, in the urban setting, there was a lagging protected left turn phase for the opposing parallel traffic; and in the suburban setting, there was a leading protected left turn phase for the opposing parallel traffic in the traffic signal cycles. The pedestrian signal cycle was a typical W
The two cane conditions included a prominent displaying of a cane (also called here a “cane display”) and the flagging of a cane (also called here a “cane flag”). During the day and after dusk, trials generally rotated between the two cane conditions at the corner crosswalk. In the cane display condition, the pedestrian stood so that his cane tip was near his left foot and the cane grip was held out from the body and extended to the left, partially visible to the drivers planning to make a right turn. Trials terminated after the first turning vehicle crossed the middle of the width of the crosswalk (referred hereafter as simply the middle). In the cane flag condition, the pedestrian began in the same position as the cane display, and at the onset of the vehicular green and W
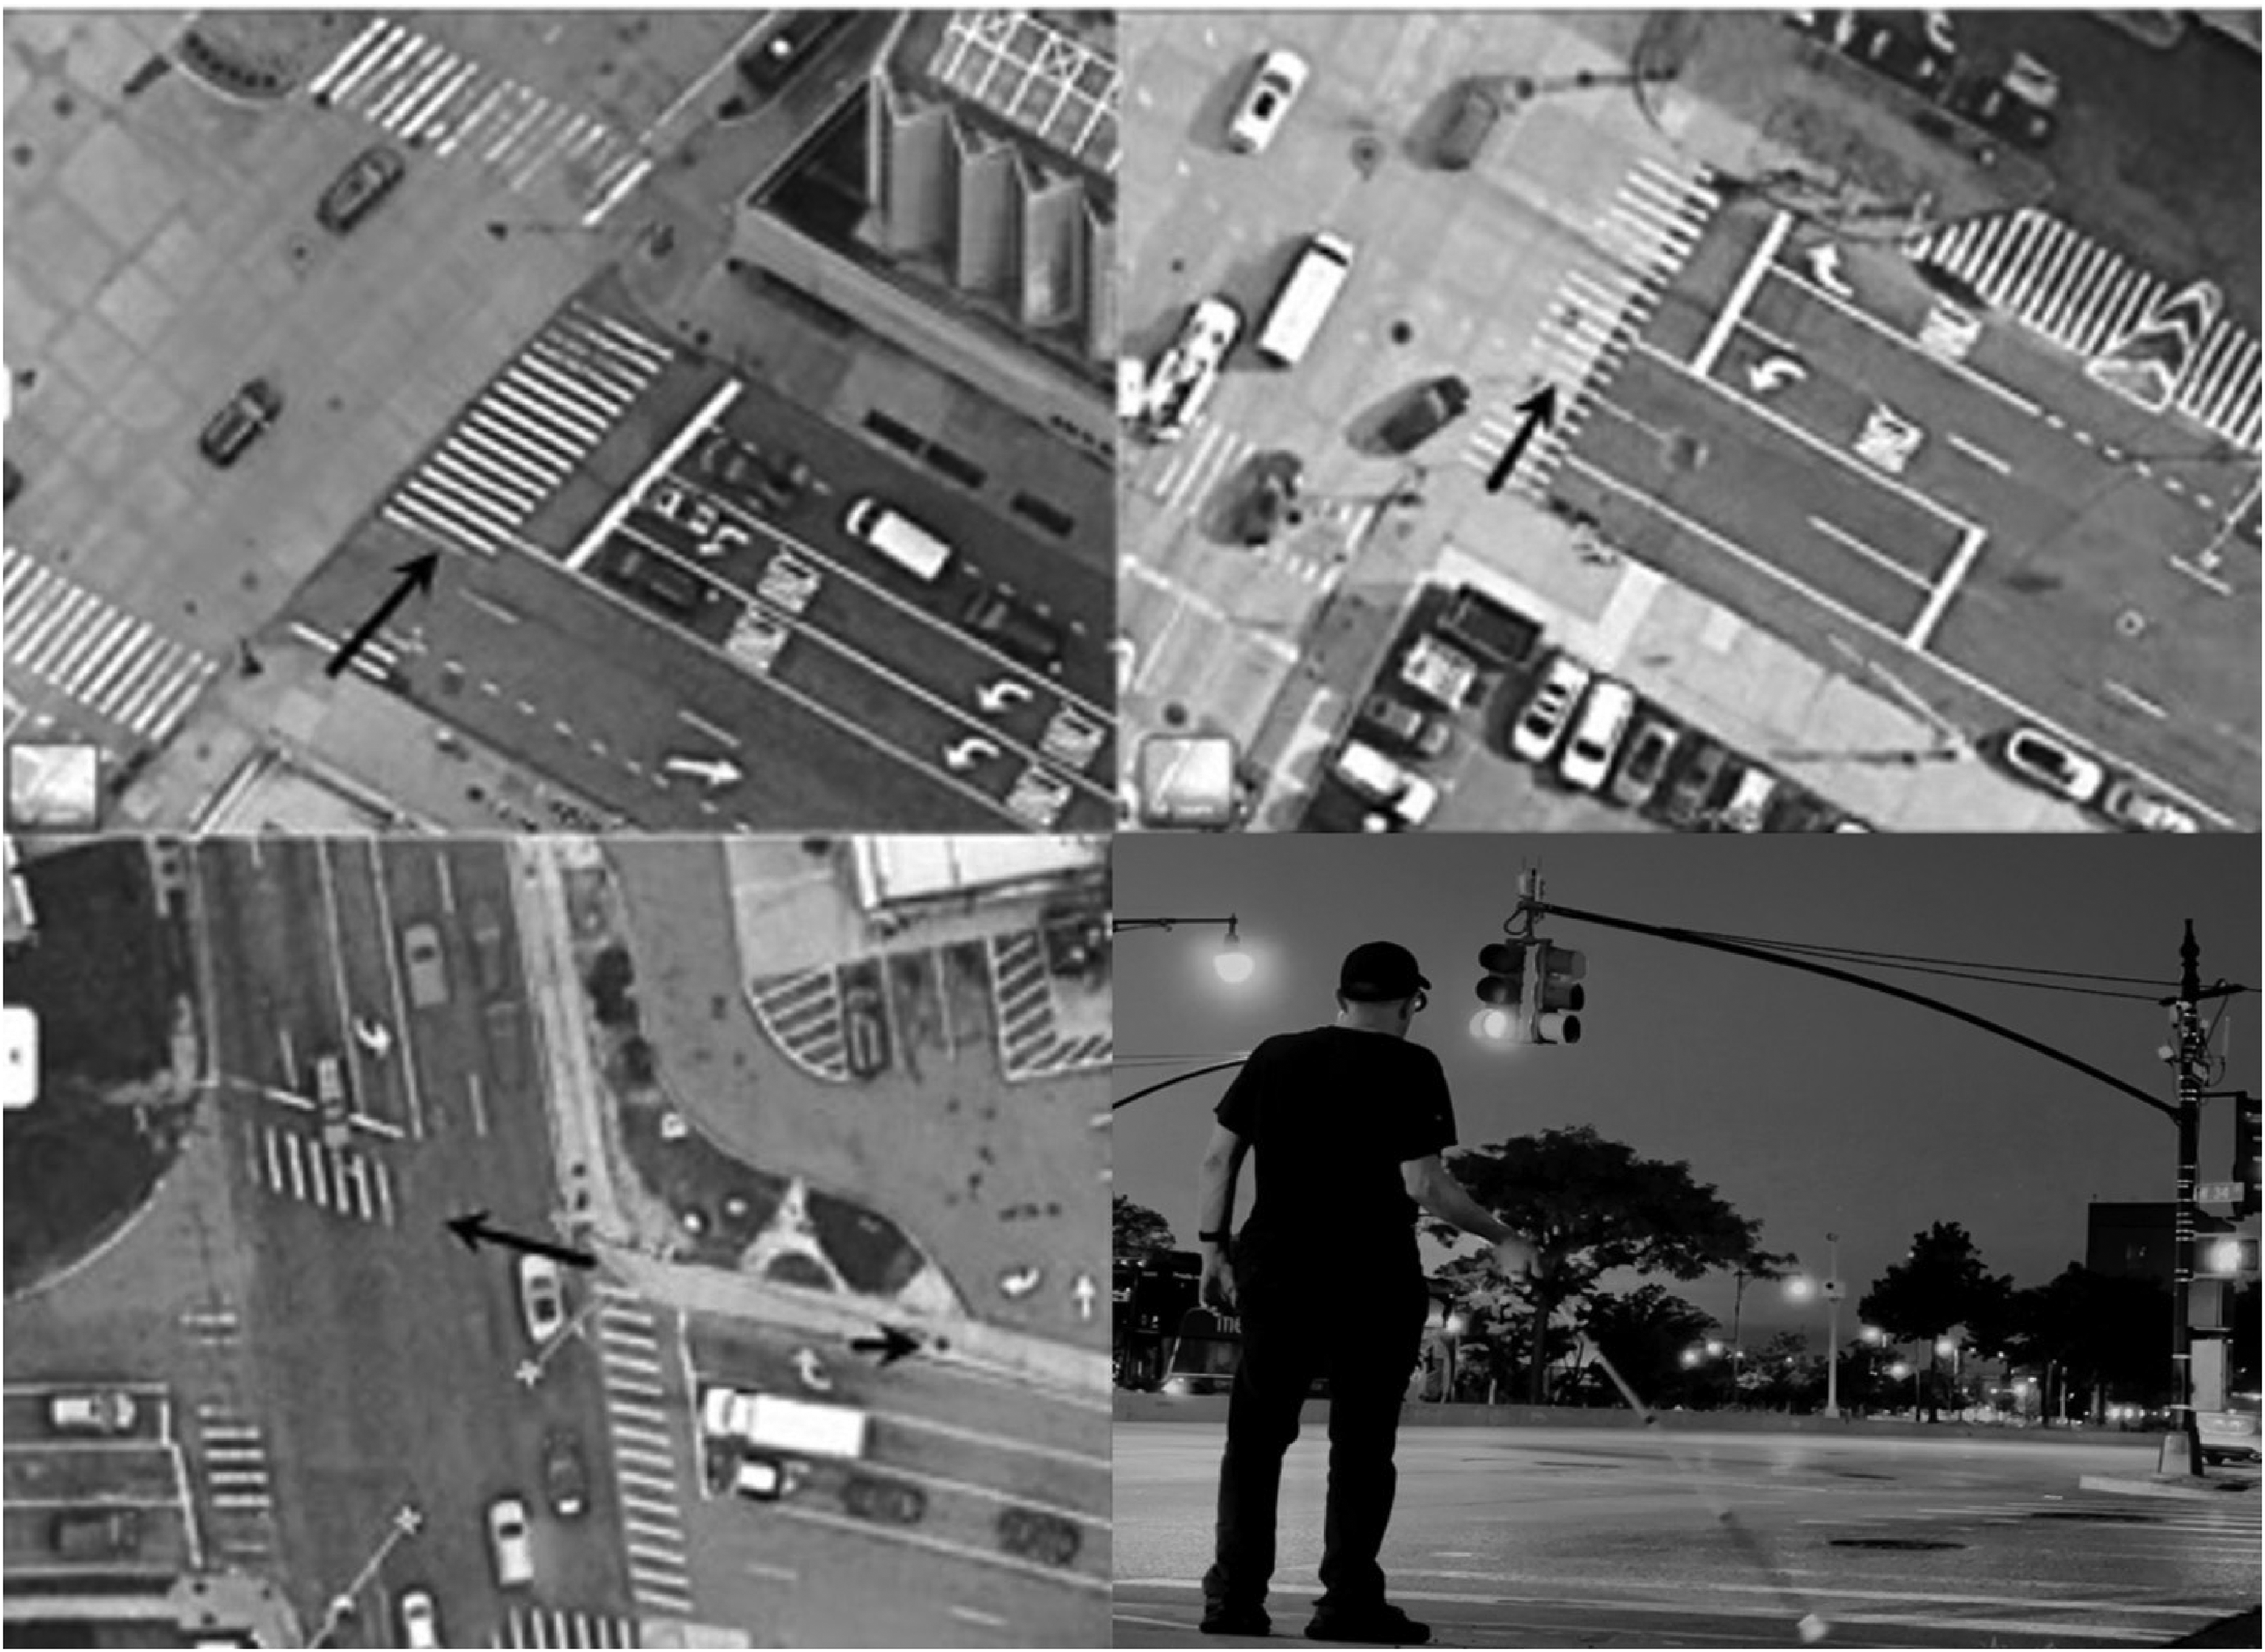
Top Left, Clockwise With Arrows Indicating the Intended Direction of Crossing: Urban Crosswalk 1; Urban Crosswalk 2; Collaborating Pedestrian Flagging a Mobility Cane at Nighttime; Suburban Crosswalk.
Data were recorded as whole-number seconds. Urban trials were recorded in digital video on an iPhone 13 Pro Max, then later reviewed and recorded on a recent model MacBook Air. For suburban trials, the researchers used a standard handheld stopwatch after the smartphone malfunctioned. For each trial, the number of seconds from the simultaneous onset of the vehicular green and W
The researchers did not collect data on traffic volume at the sites, but were able to review and consolidate recent state-published reporting; we estimate from these data that in the urban environment at nearby streets (minor streets) the vehicles per minute (VPM) were approximately 6.0 in the daytime hours when we collected data and 4.5 in the evenings. At the urban avenues (major streets) the estimates were 20 and 21 VPM, respectively. Suburban data were not available separately for day and night; the minor streets were 7.3 VPM and the major streets were 29.7 VPM (New York State Department of Transportation, 2019).
In the urban settings, street illumination came from a Type M lamp pole with a maximum output of 150-watt LED; similarly, suburban streetlights were 110-watt LED lights. To document the differing lighting conditions the researchers used the Lux Light Meter Pro, a highly rated iPhone app, and tested the surface of the crosswalks. During the day, the meter indicated a luminance measure of 1000 lux and above; the evening readings at sites were under 10 lux in value.
Results
Measures
To assess driver delays, the researchers analyzed the data collected in seconds. Also, for this study, a yield was defined as a driver delay of equal to or greater than the time calculated for a pedestrian to nearly clear the first half of the crosswalk and become conspicuous to the driver. The researchers used 3.5 feet per second as a guide, the speed used by traffic engineers for similar calculations for pedestrian signal timing (Federal Highway Administration, 2009, p. 497). We note that this calculation does not account for a pedestrian's delay, if any, in initiating a crossing. For urban 1, it was 9 s; for urban 2 and suburb, it was 8 s. Statistical Package for the Social Sciences (SPSS) version 28 was used to conduct statistical analyses.
Day and Night Driver Delay and Yielding
Data were collected (N = 302) for driver delay in two similar urban locations (urban 1, n = 18; urban 2, n = 150) and one suburban location (suburb, n = 134). Analysis of the data using analysis of variance (ANOVA) revealed no statistical differences in driver delay between day (n = 129) and night (n = 173), either by location or cane condition. Looking at just the urban locations (urban 1 vs. urban 2), there was no significant effect between day or night: F(1,164) = 0.31, p = .58 (mean of day = 8.88, mean of night = 9.03). Adding the suburban site to both urban sites, there was still no significant effect between day or night: F(1,298) = 1.44, p = .23; (mean of day = 8.40, mean of night = 8.72).
Calculated rates of yielding for day versus night were: 53.49% and 61.27% for all trials; for the display cane technique: 41.27% and 48.86; and for the cane flagging technique: 64.18% and 74.18%, respectively. Figure 2 illustrates the pattern and reports statistical significance.
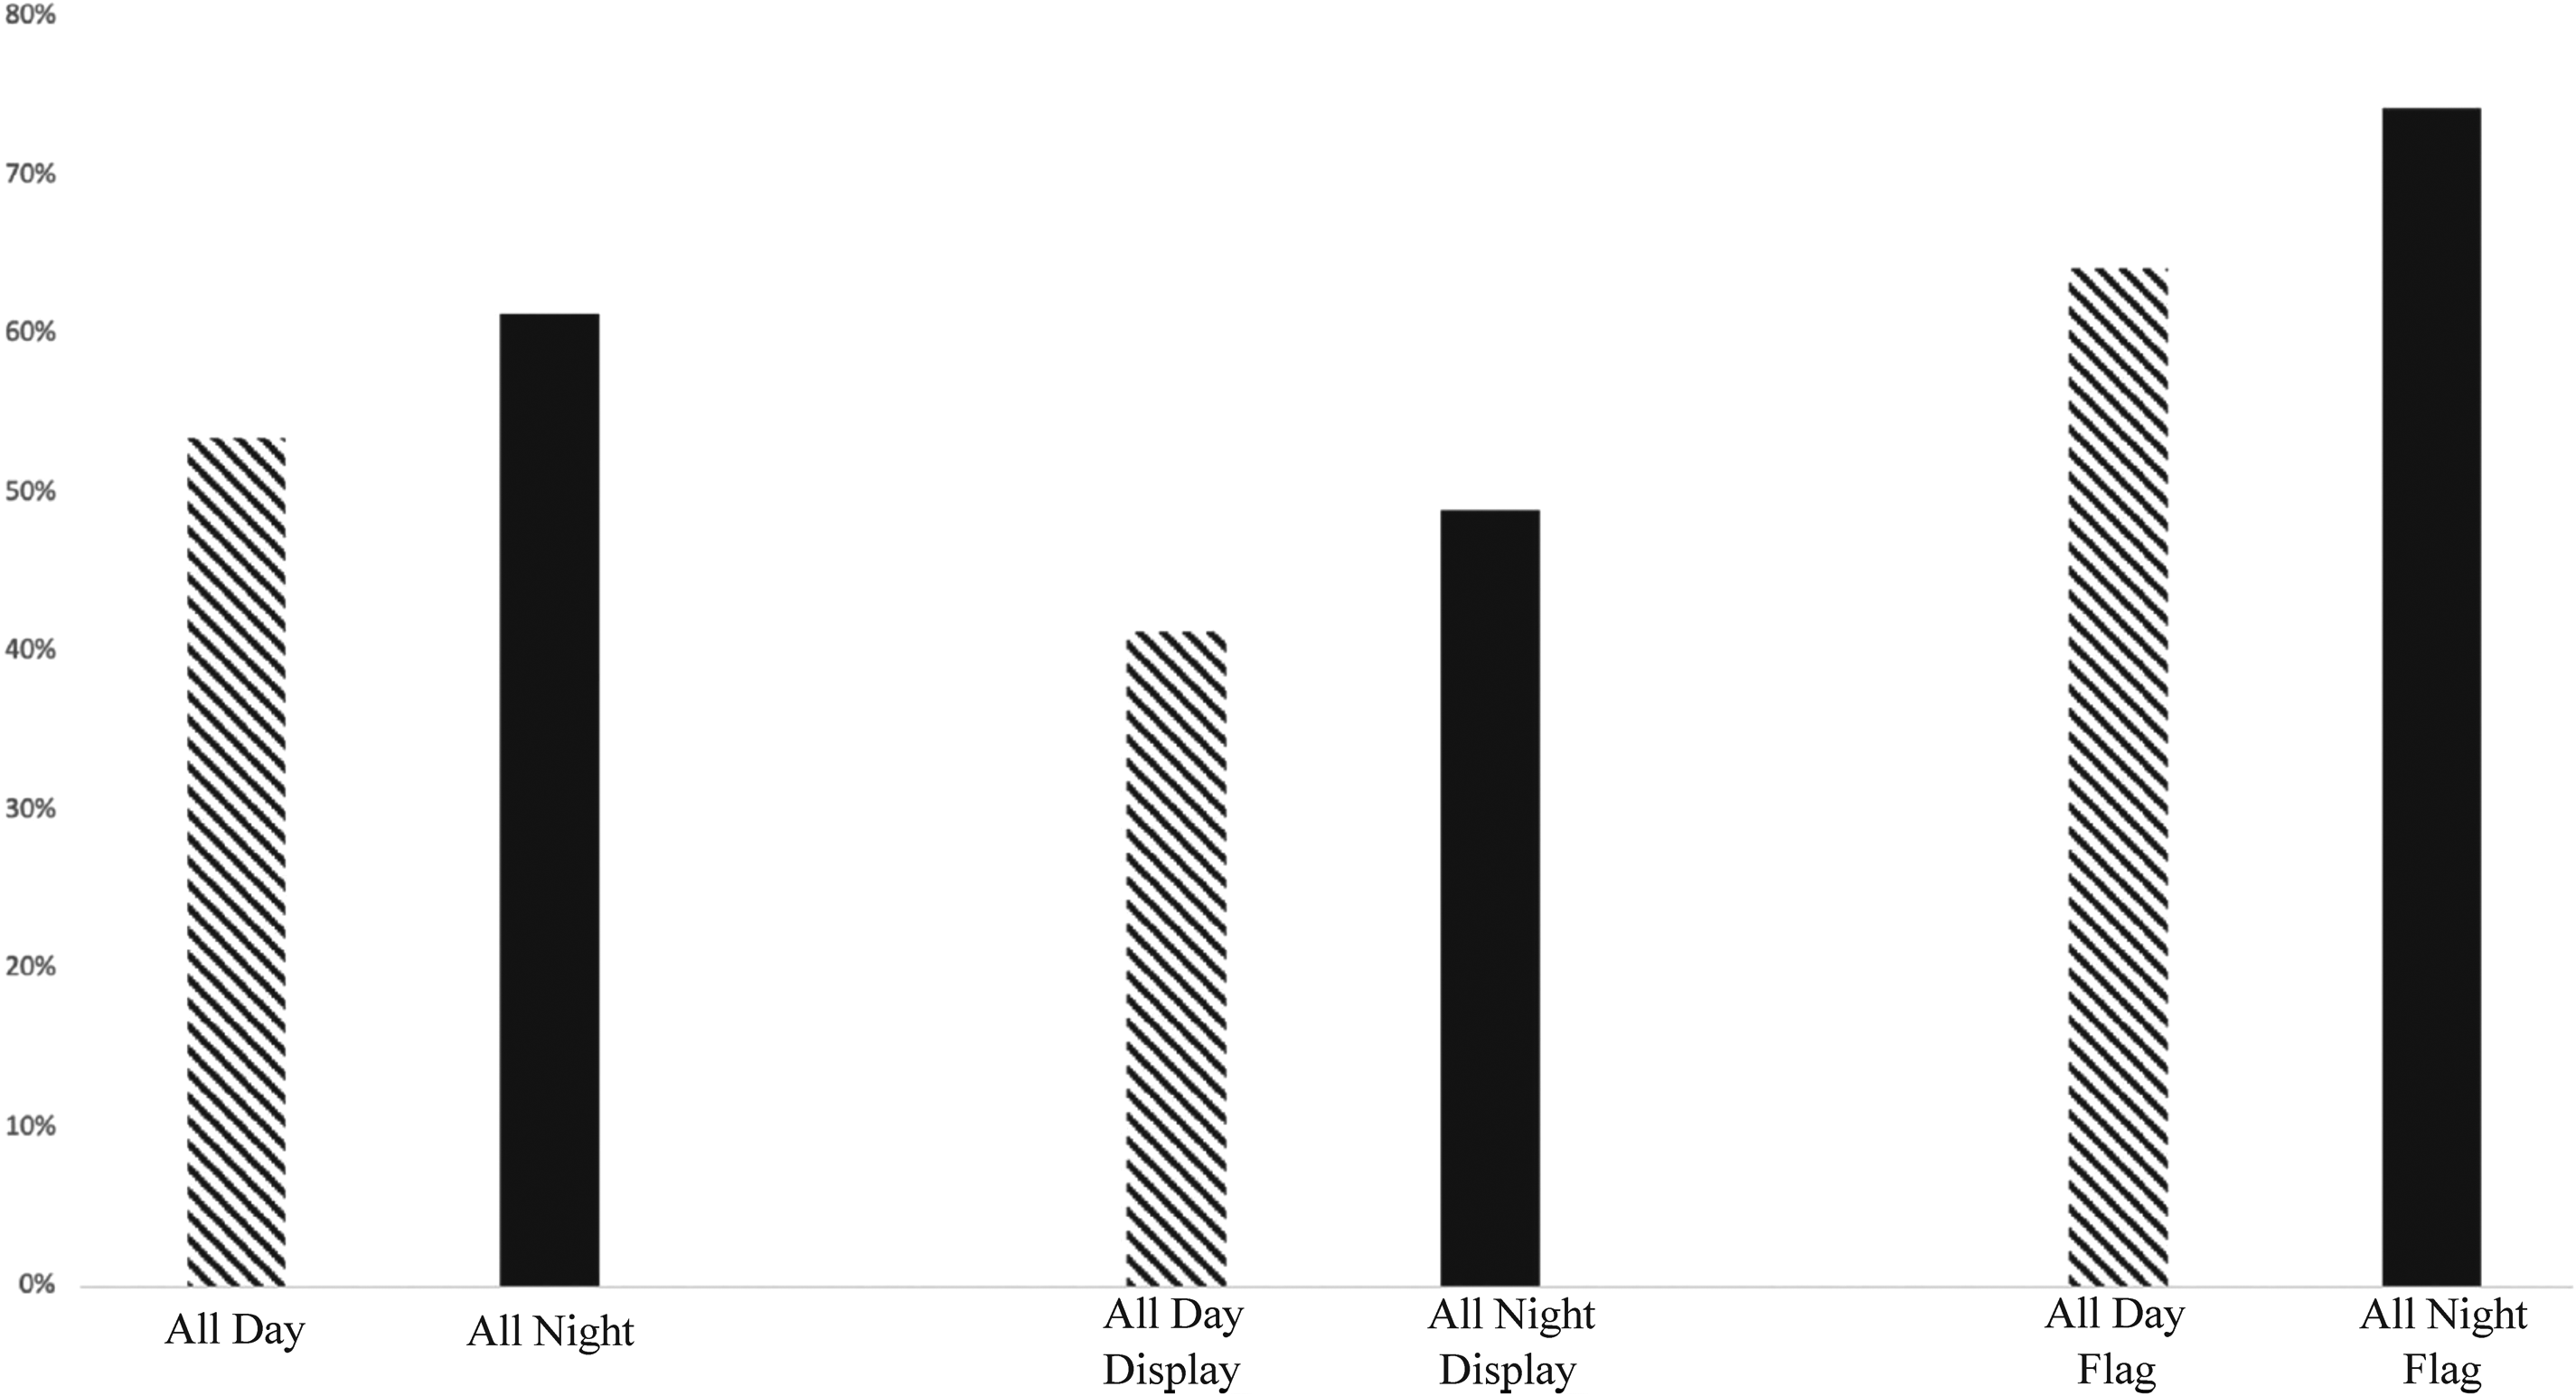
Percentage of Daytime Versus Nighttime Yielding. Description: Percentage of Yields, Left to Right Resulting From: Cluster 1, All Daytime (Striped Bar) Versus All Nighttime (Solid Bar) Trials; Cluster 2, Daytime Versus Nighttime Trials Using The Cane Display Technique; Cluster 3, Daytime Versus Nighttime Trials Using The Cane Flagging Technique. A t-Test Showed at 95% Confidence That There Was No Statistical Difference Between Total Day And Nighttime Yield Rates: t(300) = 1.36, p = .088.
Urban and Suburban Driver Delay and Yielding
There were some statistical differences between the urban and the suburban sites. An analysis of variance showed a significant effect of location, F(2,292) = 3.93, p = .02; with the suburban data showing consistently shorter driver delay times than the urban locations. Urban locations were similar to each other. For just the urban data, an analysis of variance showed that there was a significant effect of cane condition: F(1,164) = 17.023, p < .001 (mean of display = 8.14, mean of flag = 9.78). When the suburban data were added there was a larger significant effect of cane condition: F(1,298) = 26.829, p < .001 (mean of display = 7.81, mean of flag = 9.34).
The results for yielding rates showed a similar pattern with urban and suburban yields being 62.5% and 52.24%, respectively. This pattern for urban and suburban yields was true across time of day, and cane conditions. Figure 3 illustrates the pattern and reports statistical significance.
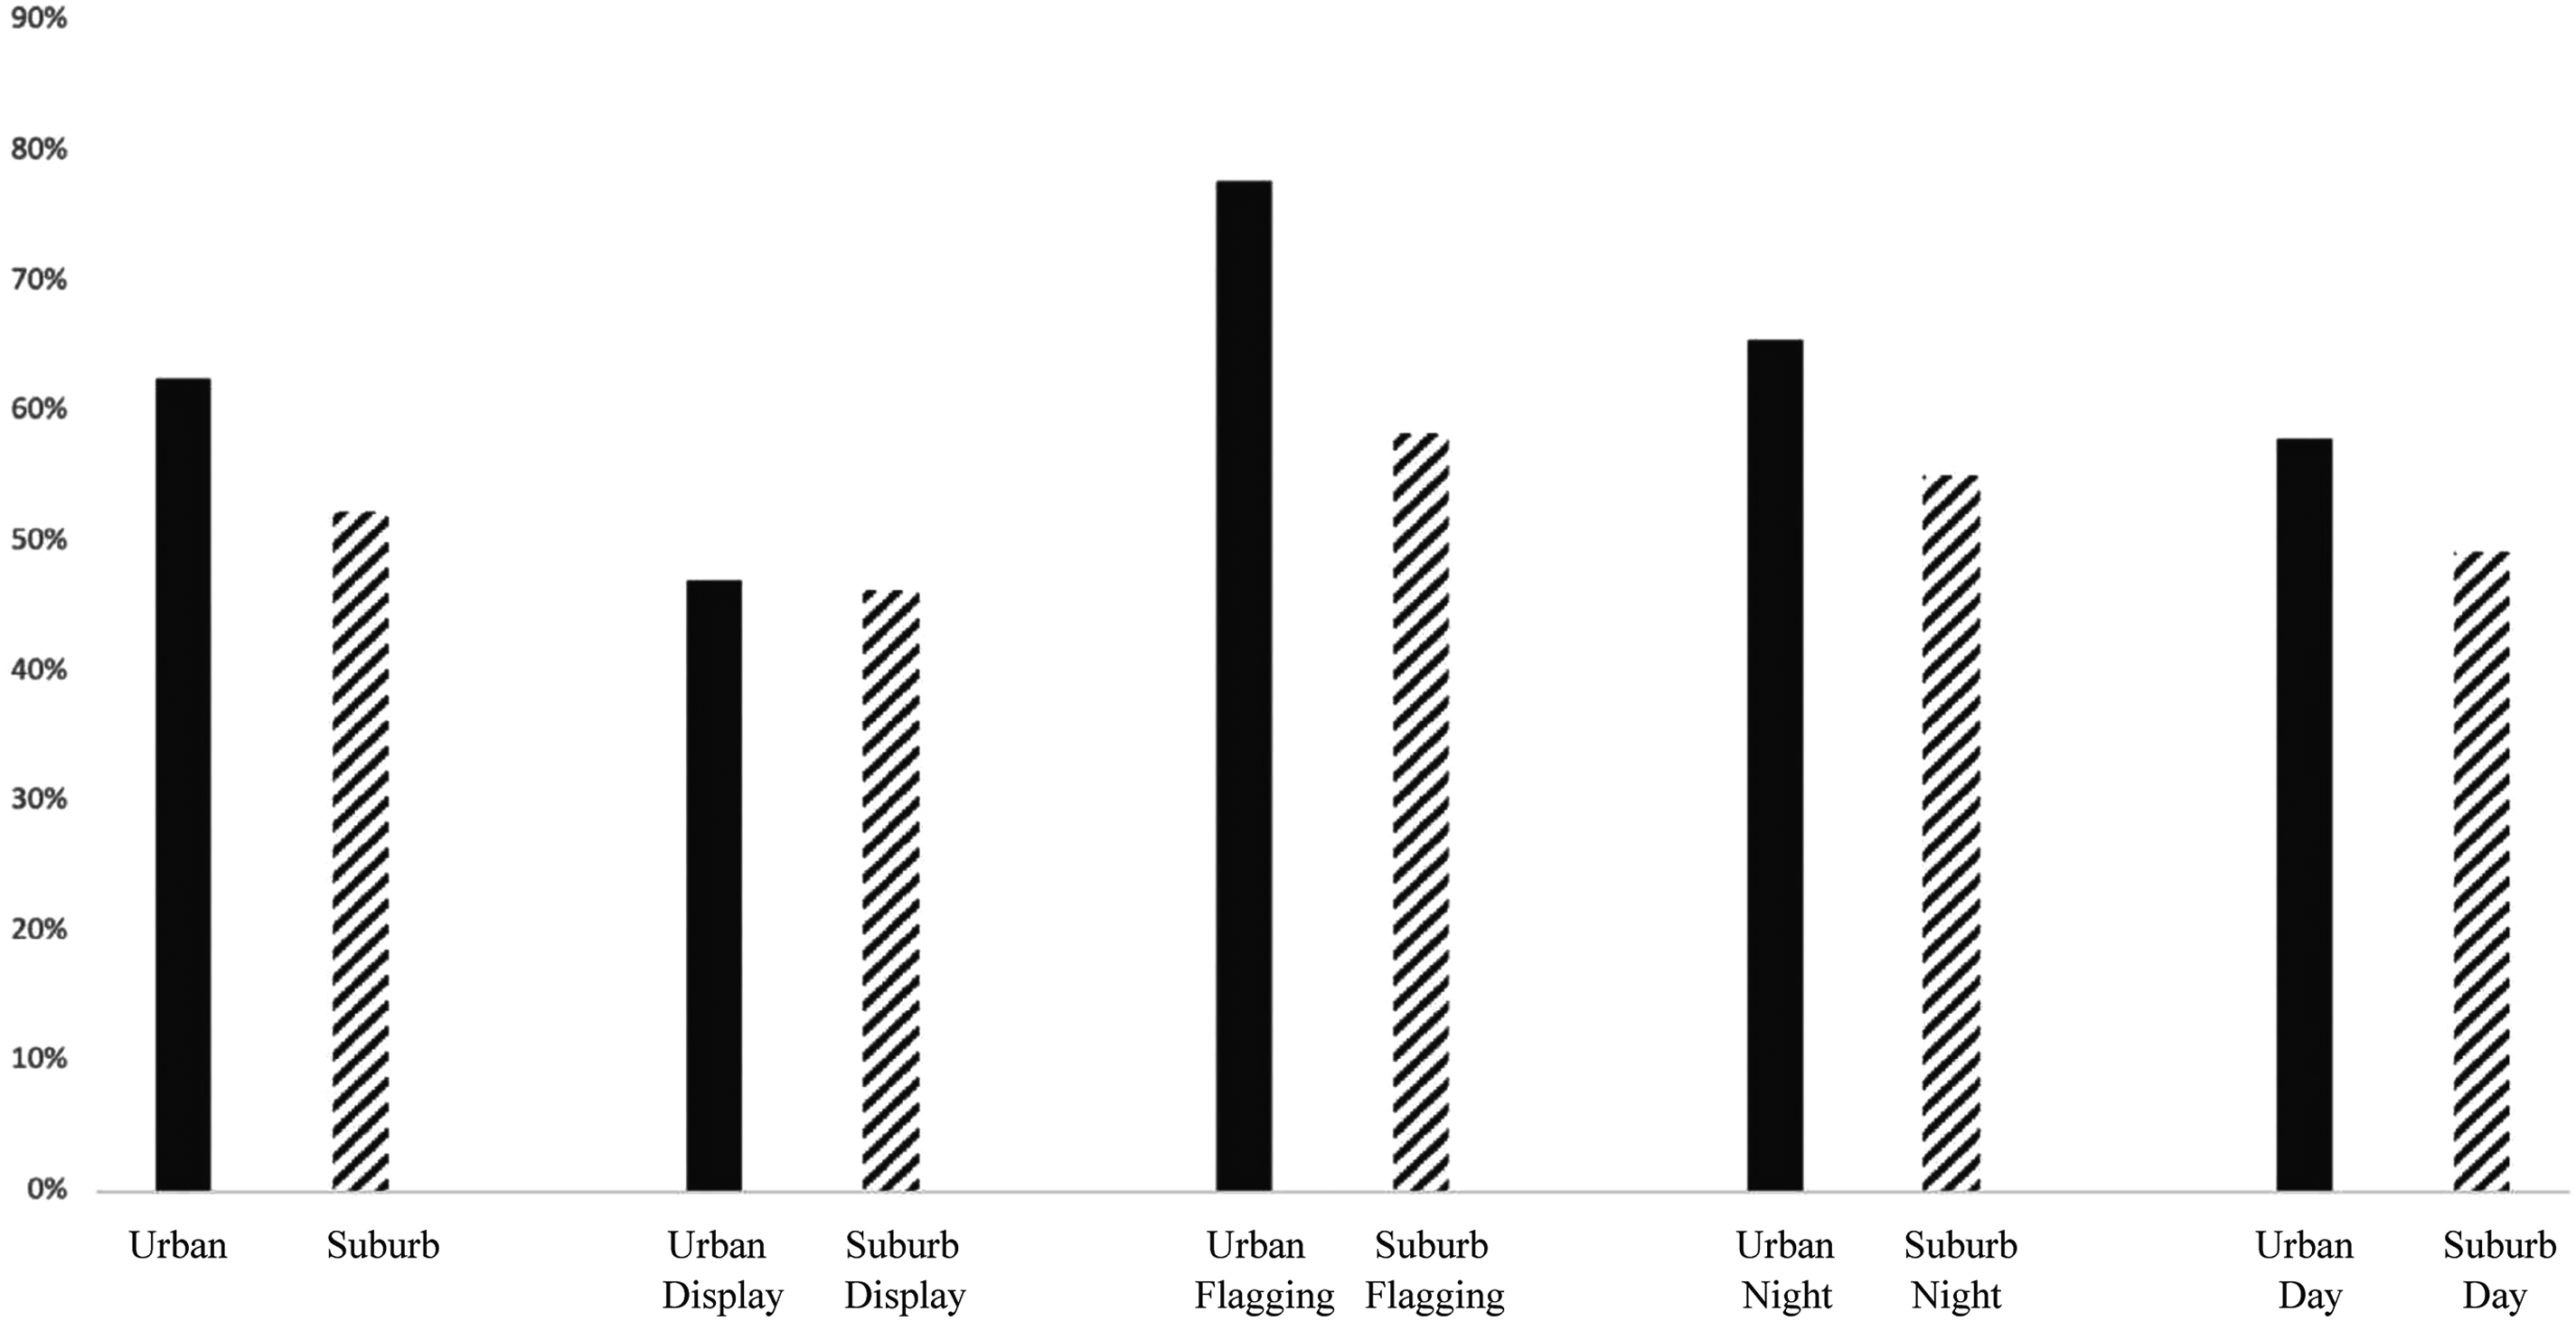
Urban Versus Suburban Yielding. Description: Percentage of Yields, Left to Right, Resulting From: Cluster 1, All Urban (Solid Bar) Versus All Suburban (Striped Bar) Trials; Cluster 2, All Cane Display Trials in The Urban Versus Suburban Locations; Cluster 3, All Cane Flagging Trials in The Urban Versus Suburban Locations; Cluster 4, All Nighttime Trials in The Urban Versus Suburban Locations; Cluster 5, All Daytime Trials in The Urban Versus Suburban Locations. A t-Test Showed A 95% Confidence That There Was a Statistical Difference Between Total Urban And Suburban Yield Rate: t(300) = 1.80, p = .04.
Pedestrian-Cane Conditions
We examined drivers’ behavior when there was no pedestrian at the crosswalk in the daytime and evening as a control condition. The results on driver delay when comparing the no pedestrian present, cane display and cane flag conditions confirm previous research. A t-test comparing driver delay in the no pedestrian present and cane display conditions was statistically significant, t(168) = 5.54, p < .001: the average of no pedestrian present was 4.89 and the average of cane display was 7.81. There was also a significant difference in driver delay between the no pedestrian present and cane flagging conditions, t(170) = 7.12, p < .001: the average for no pedestrian present was 4.89 and the average for cane flagging was 9.34. The difference in current data yielding between cane display and cane flag was statistically significant: t(300) = 4.04, p < .001.
Yielding calculations showed the same arrangement: no pedestrian present, cane display, and cane flagging percentages were 10%, 46.67%, and 69.08%, respectively. Outcomes showed a pattern of higher yielding for the flagging cane condition compared to cane display (69.08% vs. 46.67%), greater yielding at the urban sites over suburban (62.50% vs. 52.24%), and somewhat more yielding at night versus day (61.27% vs. 53.49%). See Table 1 for a complete ranking of conditions with all three independent variables. Figure 4 illustrates the pattern and reports statistical significance.
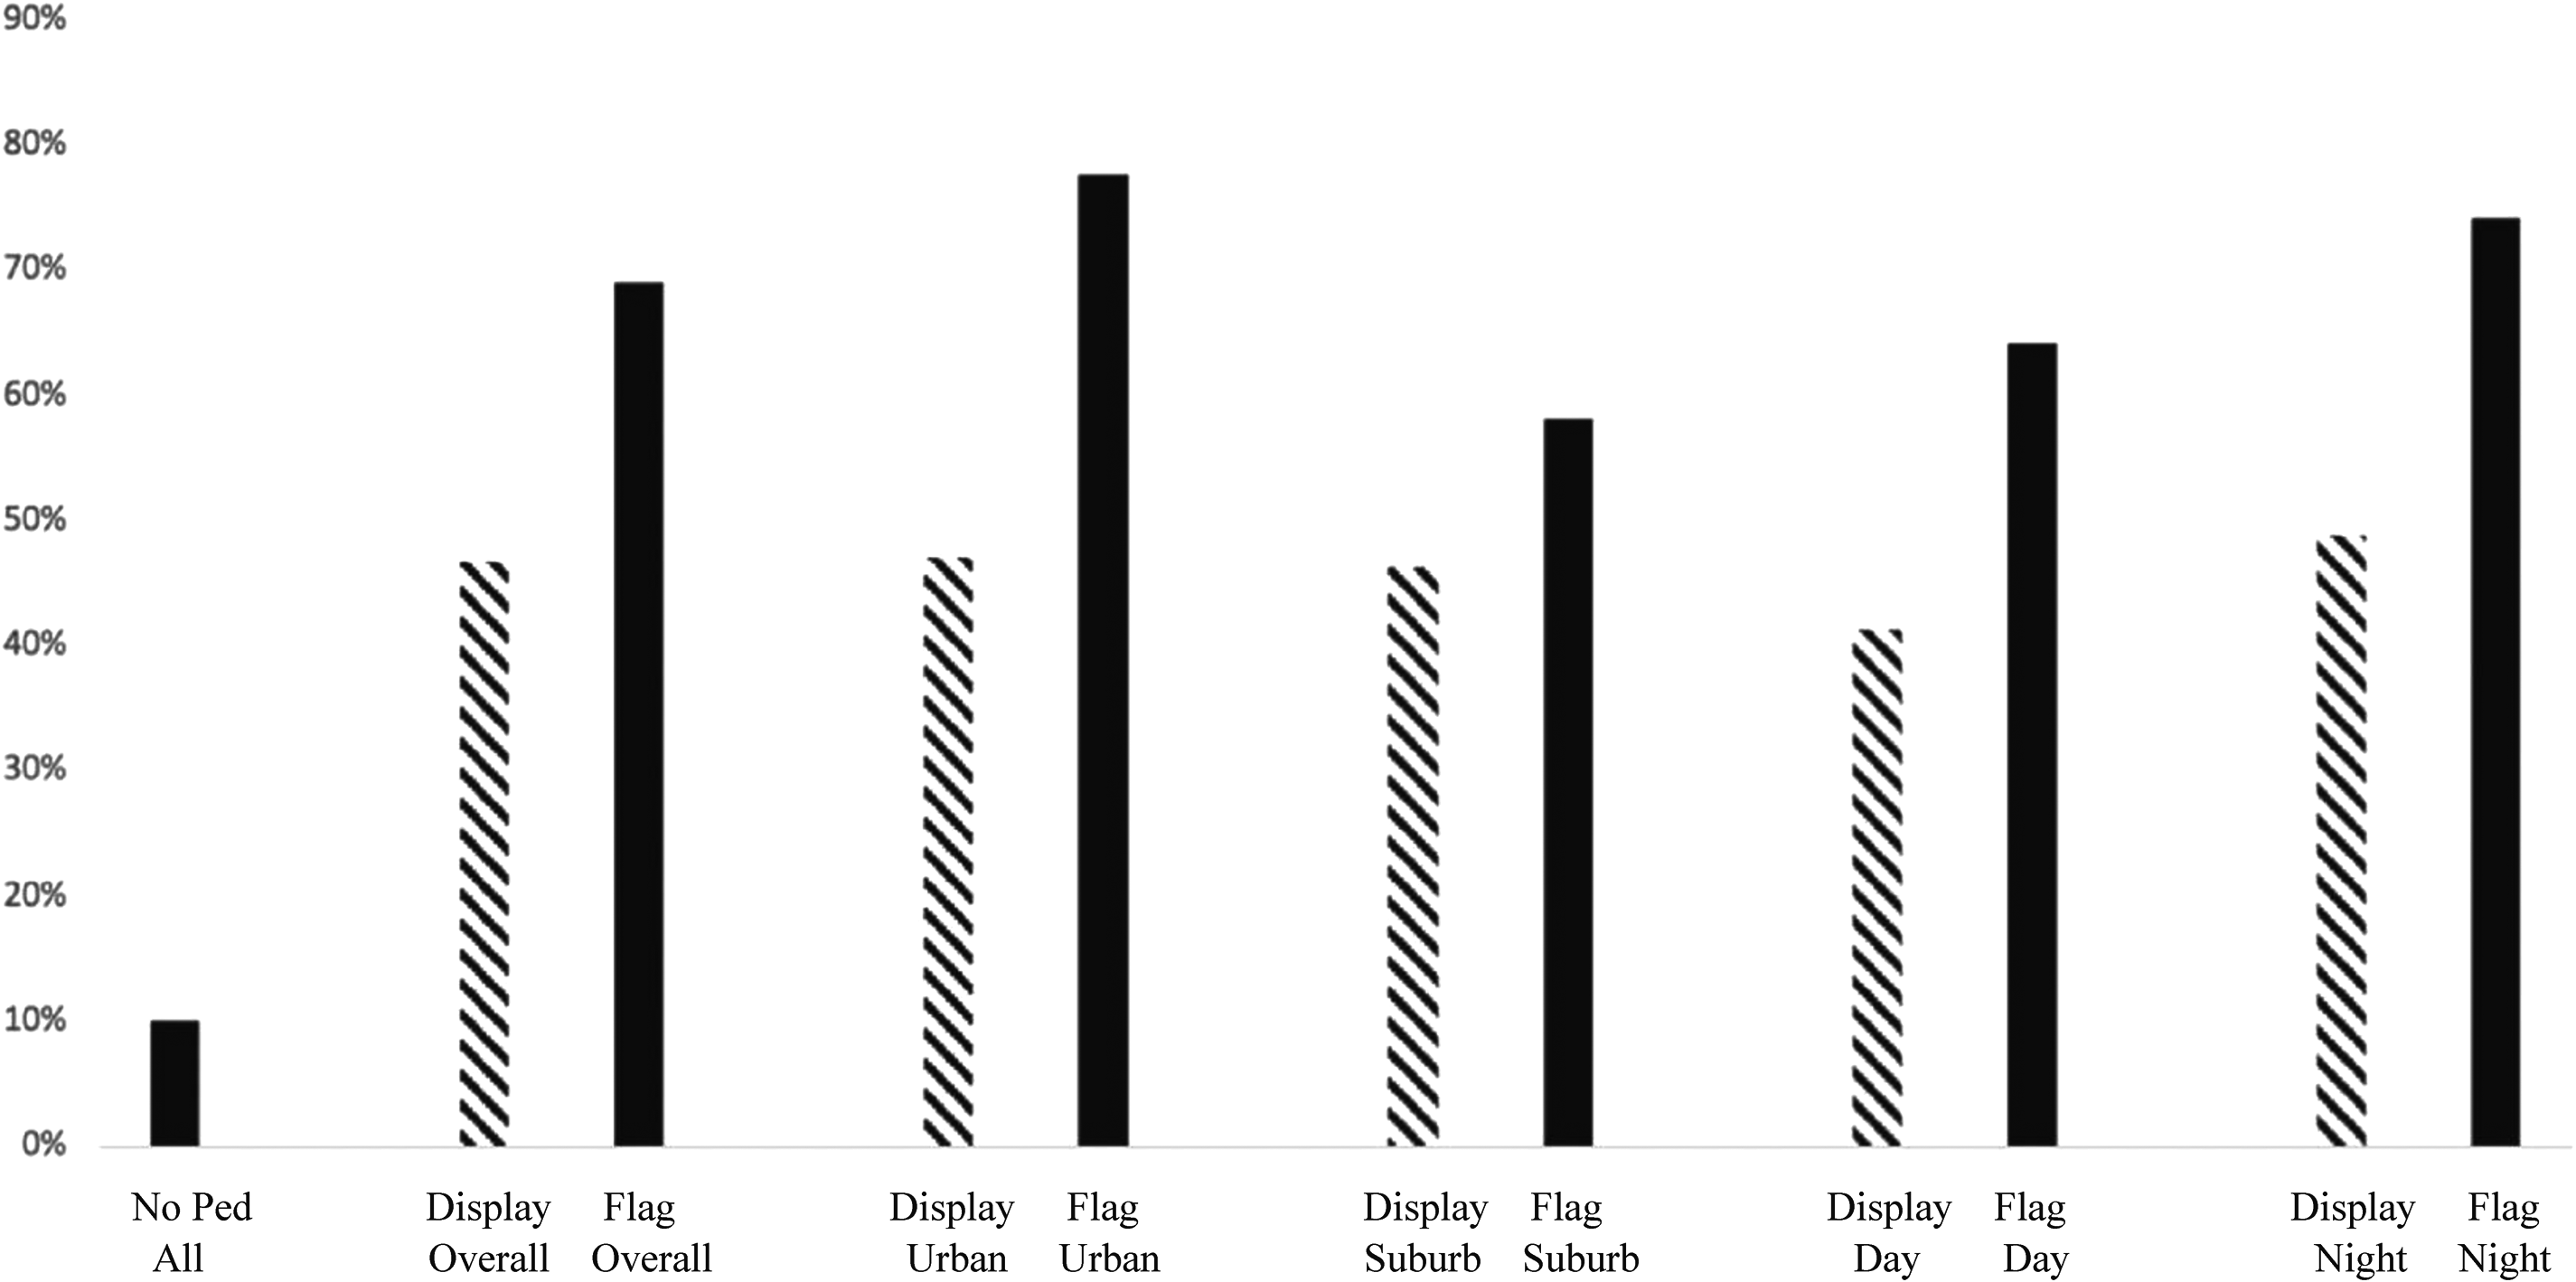
Percentage of Display Versus Flagging Yields. Description: Percentage of Yields, Left to Right, Resulting From: A Control Condition With No Pedestrian Presence At The Crosswalk; Cluster 1, All Cane Display Trials (Striped Bar) Versus All Flagging Trials (Solid Bar); Cluster 2, All Urban Location Trials, Display Versus Flagging Techniques; Cluster 3, All Suburban Location Trials, Display Versus Flagging Techniques; Cluster 4, All Daytime Trials, Display Versus Flagging Technique; Cluster 5, All Nighttime Trials, Display Versus Flagging Techniques. A t-Test Showed at 95% Confidence That There Was a Statistical Difference Between Total Cane Display and Flagging Techniques Yield Rates: t(300) = −4.04, p < .001.
Yielding Rates.
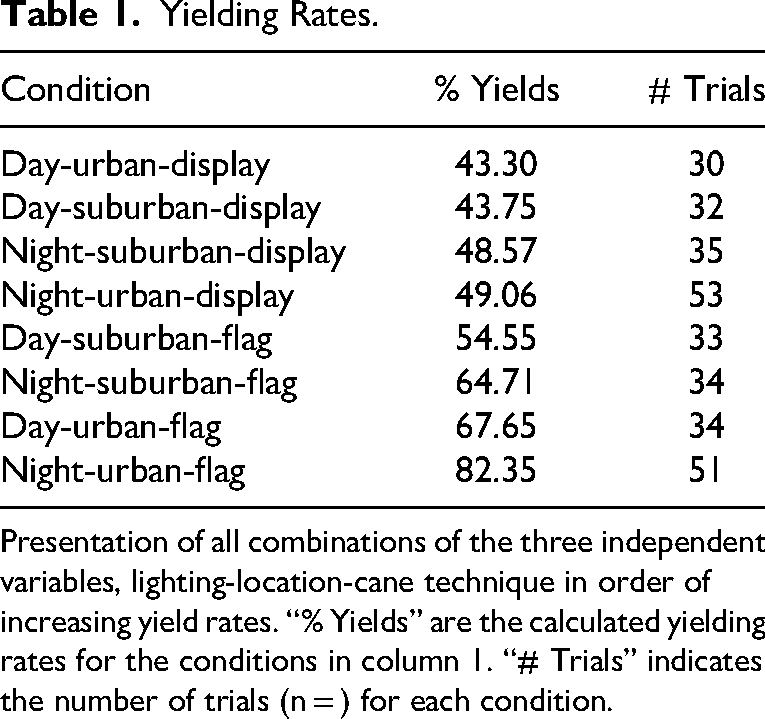
Presentation of all combinations of the three independent variables, lighting-location-cane technique in order of increasing yield rates. “% Yields” are the calculated yielding rates for the conditions in column 1. “# Trials” indicates the number of trials (n = ) for each condition.
Results in Comparison to Previous Studies
We compared results from similar yielding studies using t tests. When data for daytime driver delay in the current data was compared to data from 2014 (Bourquin et al.), no statistically significant difference was found for the cane display condition, t(138) = 1.723, p = .09 (current mean = 7.6, 2014 mean = 8.47); but there was a difference for the cane flag condition, t(142) = 3.731, p < .001 (current mean = 9.15, 2014 mean = 11.14). Comparing daytime driver delay data from the current data to 2017 cane data (Bourquin et al.) showed no statistically significant difference for the cane display condition, t(76) = 1.737, p = .09 (current mean = 7.6, 2017 mean = 6.52); or for the cane flag condition, t(81) = 0.57, p = .57 (current mean = 9.15, 2017 mean = 8.69). For the cane display condition, the averages for these datasets, from lowest to highest, are 2017 data = 6.62, current data = 7.6 and 2014 data = 8.47 with no statistically significant differences among these data. For the cane flag condition, the order is 2017 data = 8.69, current data = 9.15, and 2014 data = 11.14, the same pattern as the display data.
Discussion
In summary, there were no statistical differences between day and night for driver delay in the current study; suburban drivers have lower driver delay and yielding than urban drivers, and as the cane user goes from just displaying a cane to using a more active strategy (flagging), the driver delay time goes up.
This study follows a series of similar research studies published over the past approximately dozen years and represents the first study that analyzes drivers’ yielding in lower-light conditions at signalized intersections with typical streetlamp lighting. The greater complexity of intersection geometry, the growing number of quieter vehicles, and the proliferation of complex signaling schema, such as leading pedestrian signals, protected turn arrows, and exclusive pedestrian phasing, require that blind cane users mitigate increased risks from motor vehicles by incorporating techniques that promise yielding would be more likely before they move into traffic lanes to cross (Barlow & Franck, 2005).
For drivers to yield, they must notice a pedestrian and understand, if only unconsciously, their intent to cross. The researchers note that drivers’ delay is relatively very low, with an overall equivalency of 10% yielding, when there was no pedestrian at the crosswalk, indicating their driving behavior when they do not detect or notice a pedestrian waiting to cross. Previous studies have noted the research related to attentional capture, the involuntary drawing of attention toward an object or person, and its role in increasing drivers’ yielding (Kawahara et al., 2012). This selective attending or ignoring is explained by [v]isual cognition psychologists, who study how vision in humans is redirected and how we respond to environmental stimuli, [and] have conducted voluminous research in vision cognition and, in particular, the involuntary redirection of a person's scrutiny. (Bourquin et al., 2017, p. 406)
Lower-Light Conditions
Because of the voluminous reported data about the safety of pedestrians during evening and night travel and because the researchers speculated that the human vision cognition system might be affected by the distance between driver and pedestrian and amount of illumination, the researchers anticipated a possible negative effect of nighttime lower-light environments (Batouli et al., 2020; Pour-Rouholamin & Zhou, 2016; Spainhour et al., 2006; Subramanian et al., 2022). A Federal Highway Administration report (2022) found that roadways with lower levels of lighting resulted in greater rates of nighttime pedestrian crashes than with higher light levels. We found that intersections illuminated with modern LED streetlamps had similar driver delays compared to daylight hours. We found no statistical difference whether using the means of all the trials, or when we looked at location-specific and condition-specific data (see Figure 2).
Examining yields, the researchers found confirming results. During the day, the amount of time it would take for a pedestrian to nearly clear the first half of the crosswalk was less than the amount of time it took for the driver's car to reach the middle of the crosswalk 57.36% of the time; at night, this calculation was true slightly more often, at 61.20% of the time. The researchers conclude that a pedestrian presence with a cane made of bright and reflective materials, especially combined with movement, may mitigate the impact of lower levels of illumination at an intersection.
Cane Techniques
The current study generally corroborates previous research related to yielding and the use of a mobility cane. Geruschat and Hassan (2005) found that just the presence of the long cane increased yielding rates from 52% to 63% at a roundabout. This finding was further confirmed by research studies that showed that cane techniques used at crosswalks incorporating the flagging technique always rendered greater driver yielding than a simple cane display (Bourquin et al., 2011, 2014, 2017, 2018). In the 2014 study, turning drivers at a signalized intersection yielded in only 44% of trials with a displayed cane, but 64% when a cane was flagged. “For the crosswalk time, the cane display was not significantly different from the control condition, but the cane-flagging [was] significantly better than the control and the cane-display condition” (p. 178). We found that flagging was statistically significant (p < .001) when compared to a cane display.
We found that the hierarchy of effectiveness for cane and pedestrian presence is also confirmed by the study's yielding outcomes. The conditions of no pedestrian present (10%), cane display (46.67%), and flagged cane (69.08%) resulted in the same order of values as previous studies. See Figure 4 for cane condition comparisons. The outcomes in this and other studies suggest that passive pedestrian behavior at a crosswalk does not at all or only mildly mitigate risk and should not be a default technique for travelers who are blind. The current study's cane display results do not statistically differ from the 2014 study.
We also caution readers to be aware of the fact that although techniques such as flagging a cane, holding up a hand, or taking a safe and reversible step off the curb may robustly increase the likelihood of drivers yielding, they are secondary to the traditional tasks used to determine the amount of time needed to cross a street. Pedestrians should incorporate these yielding techniques when they know, by standard O&M practices, that it is appropriate to initiate a crossing. Those techniques include identifying a near-lane parallel surge at a signalized intersection, determining situations of uncertainty at uncontrolled crosswalks, and others.
The researchers also note that the cane techniques employed in yielding studies may not be appropriate for particular travelers—people with physical disabilities and those with cognitive disabilities may not be able to perform or will used modified versions of the techniques. Some pedestrians will have a personal preference for a particular cane presentation. O&M specialists need to determine this in collaboration and deference to consumer preferences. Specialists should understand why the experimental conditions cause increased driver yielding and apply the underlying principles to match the wants, needs, and capacities of their students.
Urban Versus Suburban Yielding
It has been reported that the majority of people who are blind, estimated as high as 78%, live in urban communities (Zuckerman, 2004). Our results indicate that there was a difference in driver delays at suburban versus urban locations: suburban intersection drivers generally turned more quickly for data combining daytime and nighttime trials for both sites. Yielding numbers validated the current driver delay findings (see Figure 3).
The American Association of State Highway and Transportation Officials, in its geometric design of highways and streets policy (Borrero, 2018), generally supports curb radii of 15–40 feet. Smaller radii are generally found in cities, allowing a tighter turn and slower average speed for drivers; large radii are often found in suburban towns. The urban trials in this study were conducted at two very similar intersections, including one that was used in previous yielding research (Bourquin et al., 2017). The curb radii of the two urban intersection corners, measured using Google Earth, were similar at 23 and 27 feet. Both intersections connected two wide major multilane roadways, with a turn-right lane (see Figure 1). The suburban site, also connecting two wide, major roadways, had a right-turn lane with a protected turn arrow. The radius was calculated to be 42 feet. Turning drivers at all sites had multiple lanes to enter on the perpendicular roadway.
The researchers understand these outcomes as the result of the different curb radii for the locations. Larger curb radii cause reduced visibility of pedestrians, higher speeds, and create a longer distance between the drivers and pedestrians at the crosswalk edge (Zangenehpour et al., 2017). Drivers must travel further to reach the middle of the crosswalk when the curb radii are larger. Similarly, in a 2014 O&M study, urban sites showed significantly longer driver delays (Bourquin et al.). The effect of vehicle velocity on yielding has been documented in numerous studies: the higher the speed, the lower the yielding rates (Schneider et al., 2017). It is also possible that the expectation of a pedestrian is higher in urban settings. Pedestrians who are blind may anticipate less yielding from turning drivers because of the typical intersection geometry in suburban locations.
Limitations of the Study
Although the researchers sought typical corners and curb radii, the results must be generalized with caution, since contemporary intersection geometries are complex and varied. Larger and smaller curbs, different streetlamp lighting, and other predictors of drivers’ behaviors may result in different outcomes. The researchers note that the pedestrian in these trials knew when the signal changed, which may not be consistently possible for pedestrians who are blind in the absence of an accessible pedestrian signal.
These research findings add to the growing literature in driver-yielding behavior and fill a gap in the O&M literature. Understanding the variables that can be under the control of travelers who are blind at a crosswalk has the potential for enhancing safety and teaching strategies. This study highlights and confirms some key principles for increasing safety at crosswalks.
Further Research Needed
During the 1970s, regulations changed so that the entire United States allowed drivers to turn right at a red signal except in specifically designated locations. Early concerns prompted a 1982 study to look at the effect of the rule change on pedestrians, finding that accidents increased from between 40 and 107% in the five sampled states (Preusser et al.). The researchers proposed the problem involved the attention of drivers and a tendency to monitor approaching traffic to their left and not pedestrians to the right. These concerns remain, and the Federal Highway Administration (Nambisan et al., 2009; Federal Highway Administration, 2009, Section 2B.54) prescribes that right turn on red be restricted at places and times that have high pedestrian volumes. Future studies should look at the effect of yield-increasing cane techniques, and their ability to involuntarily refocus awareness of pedestrians in the drivers’ peripheral visual fields. It is unknown whether and to what extent these techniques would be effective.
Future researchers should also explore topics that have not been studied but may have substantial influence on yielding and drivers’ interactions with pedestrians who are blind. These topics might include the risks associated with cyclists and the expanding infrastructure of bicycle lanes intersecting crosswalks. Other unexplored areas of yielding might include behaviors at crosswalks during inclement weather conditions and the effect of variables such as race, ethnicity, gender, and yielding in rural road environments.
Finally, the researchers note that further study should include the use of the reversible-step strategy, and the potential benefit to dog guide users of the hand-up technique for increasing drivers’ yielding.
Implications for Practice
Practitioners may find it helpful to review Table 1, which presents from all possible combinations of lighting (daytime and lamplight), location (urban and suburban), and cane technique (display and flag) to understand the variables that are most likely to influence drivers.
The findings of this study have some direct implications for the practice of O&M; some are new, and others confirm or update previous study results. Pedestrians who are blind and O&M specialists can benefit from understanding the influences of environment on risks and the methods they employ to mitigate those risks.
Considering the substantial risks of general travel at night noted in the literature section above, pedestrians may generally be encouraged to choose roadways that are well-lit; however, the current findings indicate that drivers’ yielding behavior does not change at modern crosswalks with streetlamp lighting during evening and nighttime travel when the pedestrian uses a mobility cane. Secondary findings relate to location and cane techniques. Pedestrians, likely because of intersection geometry and visibility, can anticipate that drivers will yield more often at urban crosswalks with smaller curb radii than at suburban intersections. They may modify their risk assessments and change cane techniques to align with various settings. Finally, pedestrians and O&M specialists can employ more effective cane presentation at crosswalks before and while initiating crossings. Depending on the direction of travel, a cane display can be ineffective. This lack of effectiveness is most evident with counterclockwise travel, when the near lane turning traffic conflicts with the pedestrian in the first portion of the crosswalk, and an obscured cane has a diminished ability to reduce risk. The standard practice of cane display, in which the cane is often partially or totally hidden from the view of turning drivers, does not have a significant effect that is able to reduce risk; however, learning to safely flag a cane (or incorporating other cane techniques documented in the literature such as using a hand gesture or a reversible-step) can raise the rate of turning-vehicle drivers’ yielding significantly.
Footnotes
Declaration of Conflicting Interests
The authors declared no potential conflicts of interest with respect to the research, authorship, and/or publication of this article.
Funding
The authors received no financial support for the research, authorship, and/or publication of this article.