
Abstract
Low vision and blindness (i.e., visual impairments) affects 400 million people worldwide, and their prevalence is expected to double by 2040 (Bourne et al., 2021). People who are visually impaired encounter multiple challenges during daily tasks of shopping, cooking, exercising, and transportation use (Khimani et al., 2021). Particularly, they are vulnerable to poor nutrition care (Gregory et al., 2006). Previous literature discovered that, compared to sighted people, individuals with visual impairments spend less amounts of time in food preparation and have inappropriate health literacy in nutrition and diet (Bilyk et al., 2009). Moreover, poor information accessibility significantly interferes with the information-seeking behaviors related to nutrition and diet of people with visual impairments (Burchardt, 2004). For instance, text-based nutrition information, such as food labels detailing the proportion of sugar, fat, and sodium in packaged food, is not legible to people with visual impairments (Brady et al., 2013)
In addition to the above challenges to healthy eating, a high prevalence of chronic diseases, such as obesity, hyperlipidemia, hypertension, and type 2 diabetes, is observed in visually impaired populations (Park et al., 2015). The combinations of chronic diseases and vision loss negatively affect health-related quality of life, which can burden the public healthcare system (Park et al., 2015). However, as individuals’ modifiable lifestyles are significantly correlated with health conditions (Paglia, 2018), evaluating the nutritional status, daily nutrition intake, and dietary pattern of people with visual impairments will be an essential part of a comprehensive strategy for preventing chronic conditions.
Regarding the eating habits of people with visual impairments, approximately 40% tend to consume prepared foods and to frequently use restaurants to avoid cooking (Jones & Bartlett, 2018). Moreover, people with visual impairments have an insufficient intake of fresh vegetables and fruits, and erratic eating patterns—the consumption of processed or junk foods is more frequently observed among unemployed people with visual impairments (Brady et al., 2013). Interestingly, some blind adults do not perceive blindness as an acceptable explanation for avoiding cooking, rather they blame their limited motivation or will power (Jones & Bartlett, 2020).
Most previous literature on the nutrition and diet of people with visual impairments focused on the exploration of food-related experiences or the effects of visual impairment on the nutritional status of people with visual impairments. One of the missing aspects of this research area is the evaluation of an individual's nutritional status and dietary patterns. By analyzing the current nutrition profile, a detailed strategy for health promotion can be prepared. In this study, we explored the following data-driven research questions to compare the nutritional status, daily nutrition intake, and dietary patterns of individuals with and without visual impairments by analyzing the Korean National Health and Nutrition Examination Survey (KNHANES) datasets with the following research questions in mind:
What are the differences in nutritional status (i.e., anthropometric and biochemical tests) between individuals with and without visual impairments? What are the differences in daily nutrition intake between individuals with and without visual impairments? What are the dietary patterns of individuals with and without visual impairments?
Methods
KNHANES (2013–2016) Datasets
The secondary data analyzed in this study were obtained from participants enrolled in the KNHANES project (https://knhanes.kdca.go.kr/knhanes/main.do). The KNHANES has been collecting nationwide data on health status, health-related behaviors, and food and nutrition consumption of sampled Korean adults annually since 1998 and is sponsored by the Korea Disease Control and Prevention Agency. The purpose of the KNHANES is to improve the health status of the population by monitoring the status of health, health behavior and beliefs, nutritional status, and food consumption. The KNHANES includes data on individuals’ socioeconomic characteristics, health history, physical examinations, clinical laboratory tests, lifestyle, healthcare service use, health behavior, nutritional status, and food consumption. Among the series of surveys, those conducted from 2013 to 2016 included both dietary assessments and eye examinations. To investigate the nutritional status, daily nutrient intake, and dietary patterns of the respondents with visual impairments, 190 variables were purposely selected and included in the data analysis.
Selected Variables
The following baseline characteristics of the visually impaired respondents and their counterparts were available: age, education, alcohol consumption, marital status, monthly income, sex, smoking status, working status, and EQ-5D index (i.e., self-reported health-related quality of life). In this study, visual impairment was defined as presenting a distance best-corrected visual acuity less than decimal 0.2 (approximate Snellen equivalent 20/100) or worse in the better-seeing eye (Rubin et al., 1997). When we preprocessed the selected datasets, the total number of respondents with visual impairments was 260. To evaluate the nutritional status of people with visual impairments, the following variables were selected:
BMI (kg/m2), HbA1c (%), HDL (mg/dL), height (cm), hemoglobin (g/dL), LDL (mg/dL), levels of fasting blood glucose level (mg/dL), total cholesterol (mg/dL), triglyceride (mg/dL), waist circumference (cm), and weight (kg). b-carotene (µg/day), carbohydrate (g/day), calcium (mg/day), calories (kcal/day), fat (g/day), iron(Fe, mg/day), niacin (mg/day), phosphate (mg/day), protein (g/day), potassium (K, mg/day), sodium (Na, mg/day), vitamin A (µgRE/day), vitamin B1(mg/day), vitamin B2 (mg/day), vitamin C (mg/day), and vitamin D (µg/day).
To summarize the daily nutrient intake of the participants, data on the consumption levels of the following variables were recorded:
One benefit of using the KNHANES is that it employs the Food Frequency Questionnaire (FFQ) to determine the dietary patterns of respondents. The FFQ used in the KNHANES provides estimates of the frequency of consumption of different food types; however, the assessment did not consider the portion size of food consumption, which can be one of the limitations of the study. The questionnaire contains 115 specific foods, and the respondents recorded their average daily intake per meal in recent years. To discover the distinct patterns of food consumption, we categorized all food items into the following 19 groups (Chung & Lee, 2005): (1) rice; (2) bread and cereals; (3) potato; (4) noodles and dumplings; (5) soups and stews; (6) kimchi; (7) meat and its products; (8) fish; (9) shellfish; (10) eggs; (11) soybean; (12) vegetable; (13) mushrooms and seaweeds; (14) fruit; (15) milk; (16) beverages; (17) sweets; (18) oil and nuts; and (19) alcoholic beverages.
Statistical Analysis
Data management and analysis were performed using the statistical computing software R and the required packages (R Core Team, 2020). The first step of the data analysis was to prepare the KNHANES datasets. Four datasets from all published KNHANES datasets were selected because they included variables indicating the severity of visual impairment and the FFQ items. Next, data cleaning and transformation were performed simultaneously until the final data structure was appropriate for the actual data analysis. Missing data for each variable were handled by multiple imputation procedures (Schafer & Olsen, 1998). Among variables, the proportions of missing data ranged between 23.4% and 31.5%. We followed a step-by-step guide for conducting propensity score matching in R (Randolph et al., 2019). Lastly, the means, standard deviations, frequencies, and percentages were calculated to describe sociodemographic characteristics, daily intake of nutrients, and nutritional status. The mean differences among continuous variables were examined using independent t-tests and analysis of variance. The two-sided significance level was set at .05. k-means clustering, the most commonly used method for splitting datasets into k groups, was used for clustering the dietary patterns.
Ethical Consideration
This study was approved by the Institutional Review Board of the Yonsei University Health System (No. 4-2021-0150).
Results
Baseline Characteristics
The baseline characteristics of the participants are summarized in Table 1. Regarding the usability of the datasets, only participants aged 19 to 49 years who comprised the target population for the FFQ surveys in the original study were included in the data analysis. The mean age of the respondents with visual impairments was 32.58 years (SD = 9.56) and 67.7% were women. Although we matched the participants through propensity score matching, a significant difference existed in their educational level; the educational level of the sighted group was significantly higher than that of the visually impaired group (p = .023). No significant difference in self-reported health-related quality of life was found among the groups (p = .847).
Baseline Characteristics.
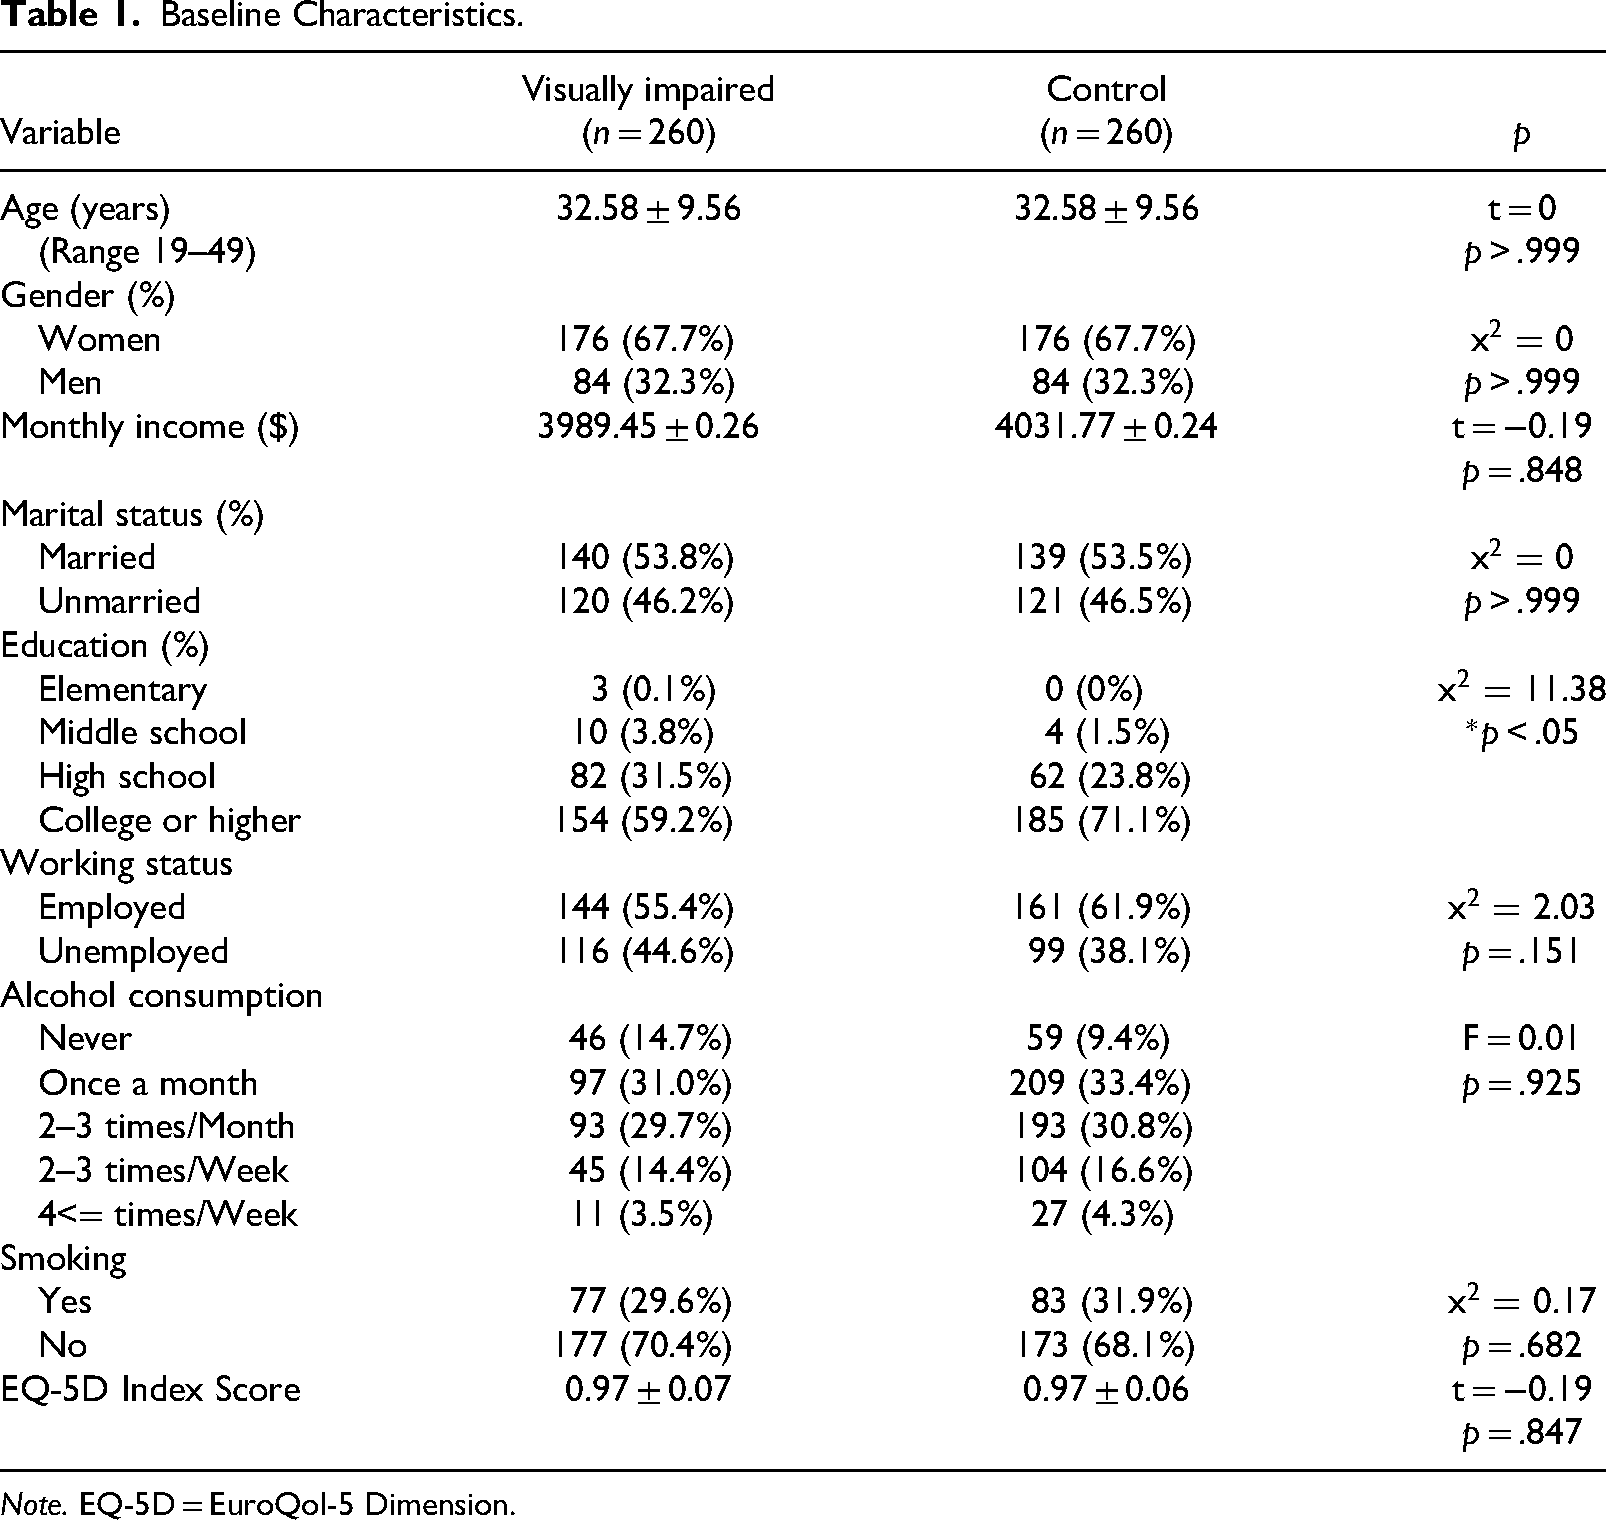
Note. EQ-5D = EuroQol-5 Dimension.
Nutritional Status
Table 2 summarizes the nutritional status of the respondents. The selected indicators for evaluating nutritional status were anthropometric measurements, BMI, and clinical laboratory test results. The average height (cm) of women with visual impairments was shorter than that of the control group (p = .013), and the average BMI of both groups was within the normal range (18.52–25.01). The mean waist circumference values for both groups indicated a low health risk for cardiovascular and metabolic disorders.
Comparison of Nutritional Status Between Gender by Visual Impairment.
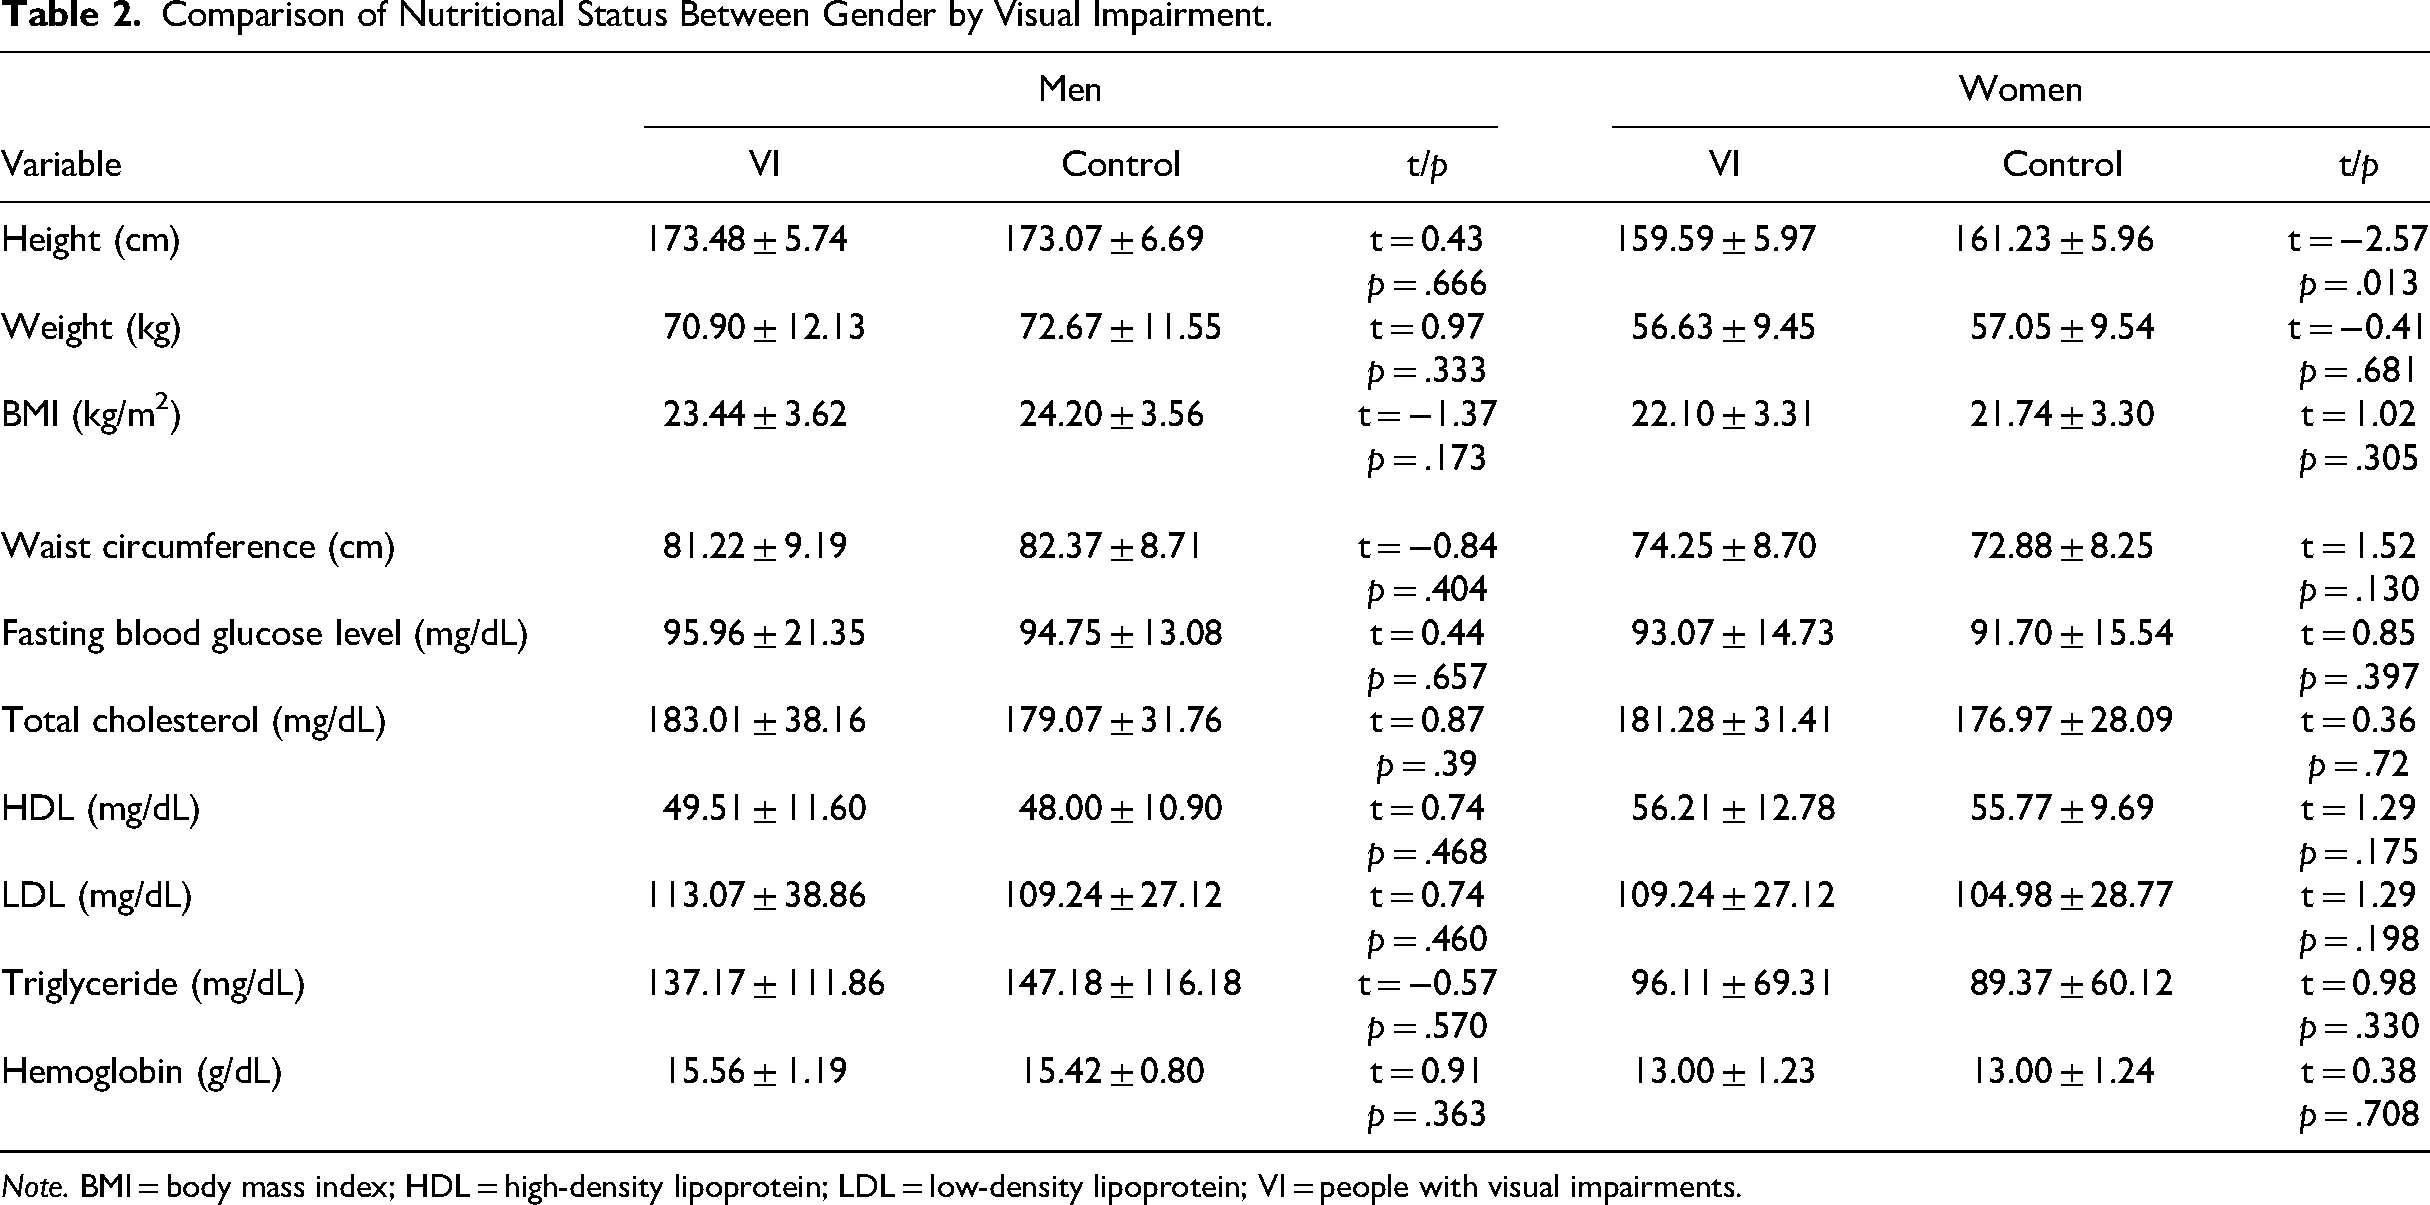
Note. BMI = body mass index; HDL = high-density lipoprotein; LDL = low-density lipoprotein; VI = people with visual impairments.
Daily Intake of Nutrients
The differences in daily intake of nutrients are summarized in Table 3. All subgroups of respondents tended to consume similar amounts of calories. However, men (t = −0.14, p = .885) and women (t = −1.20, p = .231) with visual impairments consumed lower amounts of calcium. This tendency was also observed in vitamin A; the respondents with visual disabilities did not sufficiently consume vitamin A (i.e., men: t = −0.33, p = .736; women: t = −1.60, p = .111). The consumption of sodium was exceedingly high, and the intake of beta-carotene was insufficient in all subgroups.
Comparison of Daily Intake of Nutrients Between Gender by Visual Impairment.
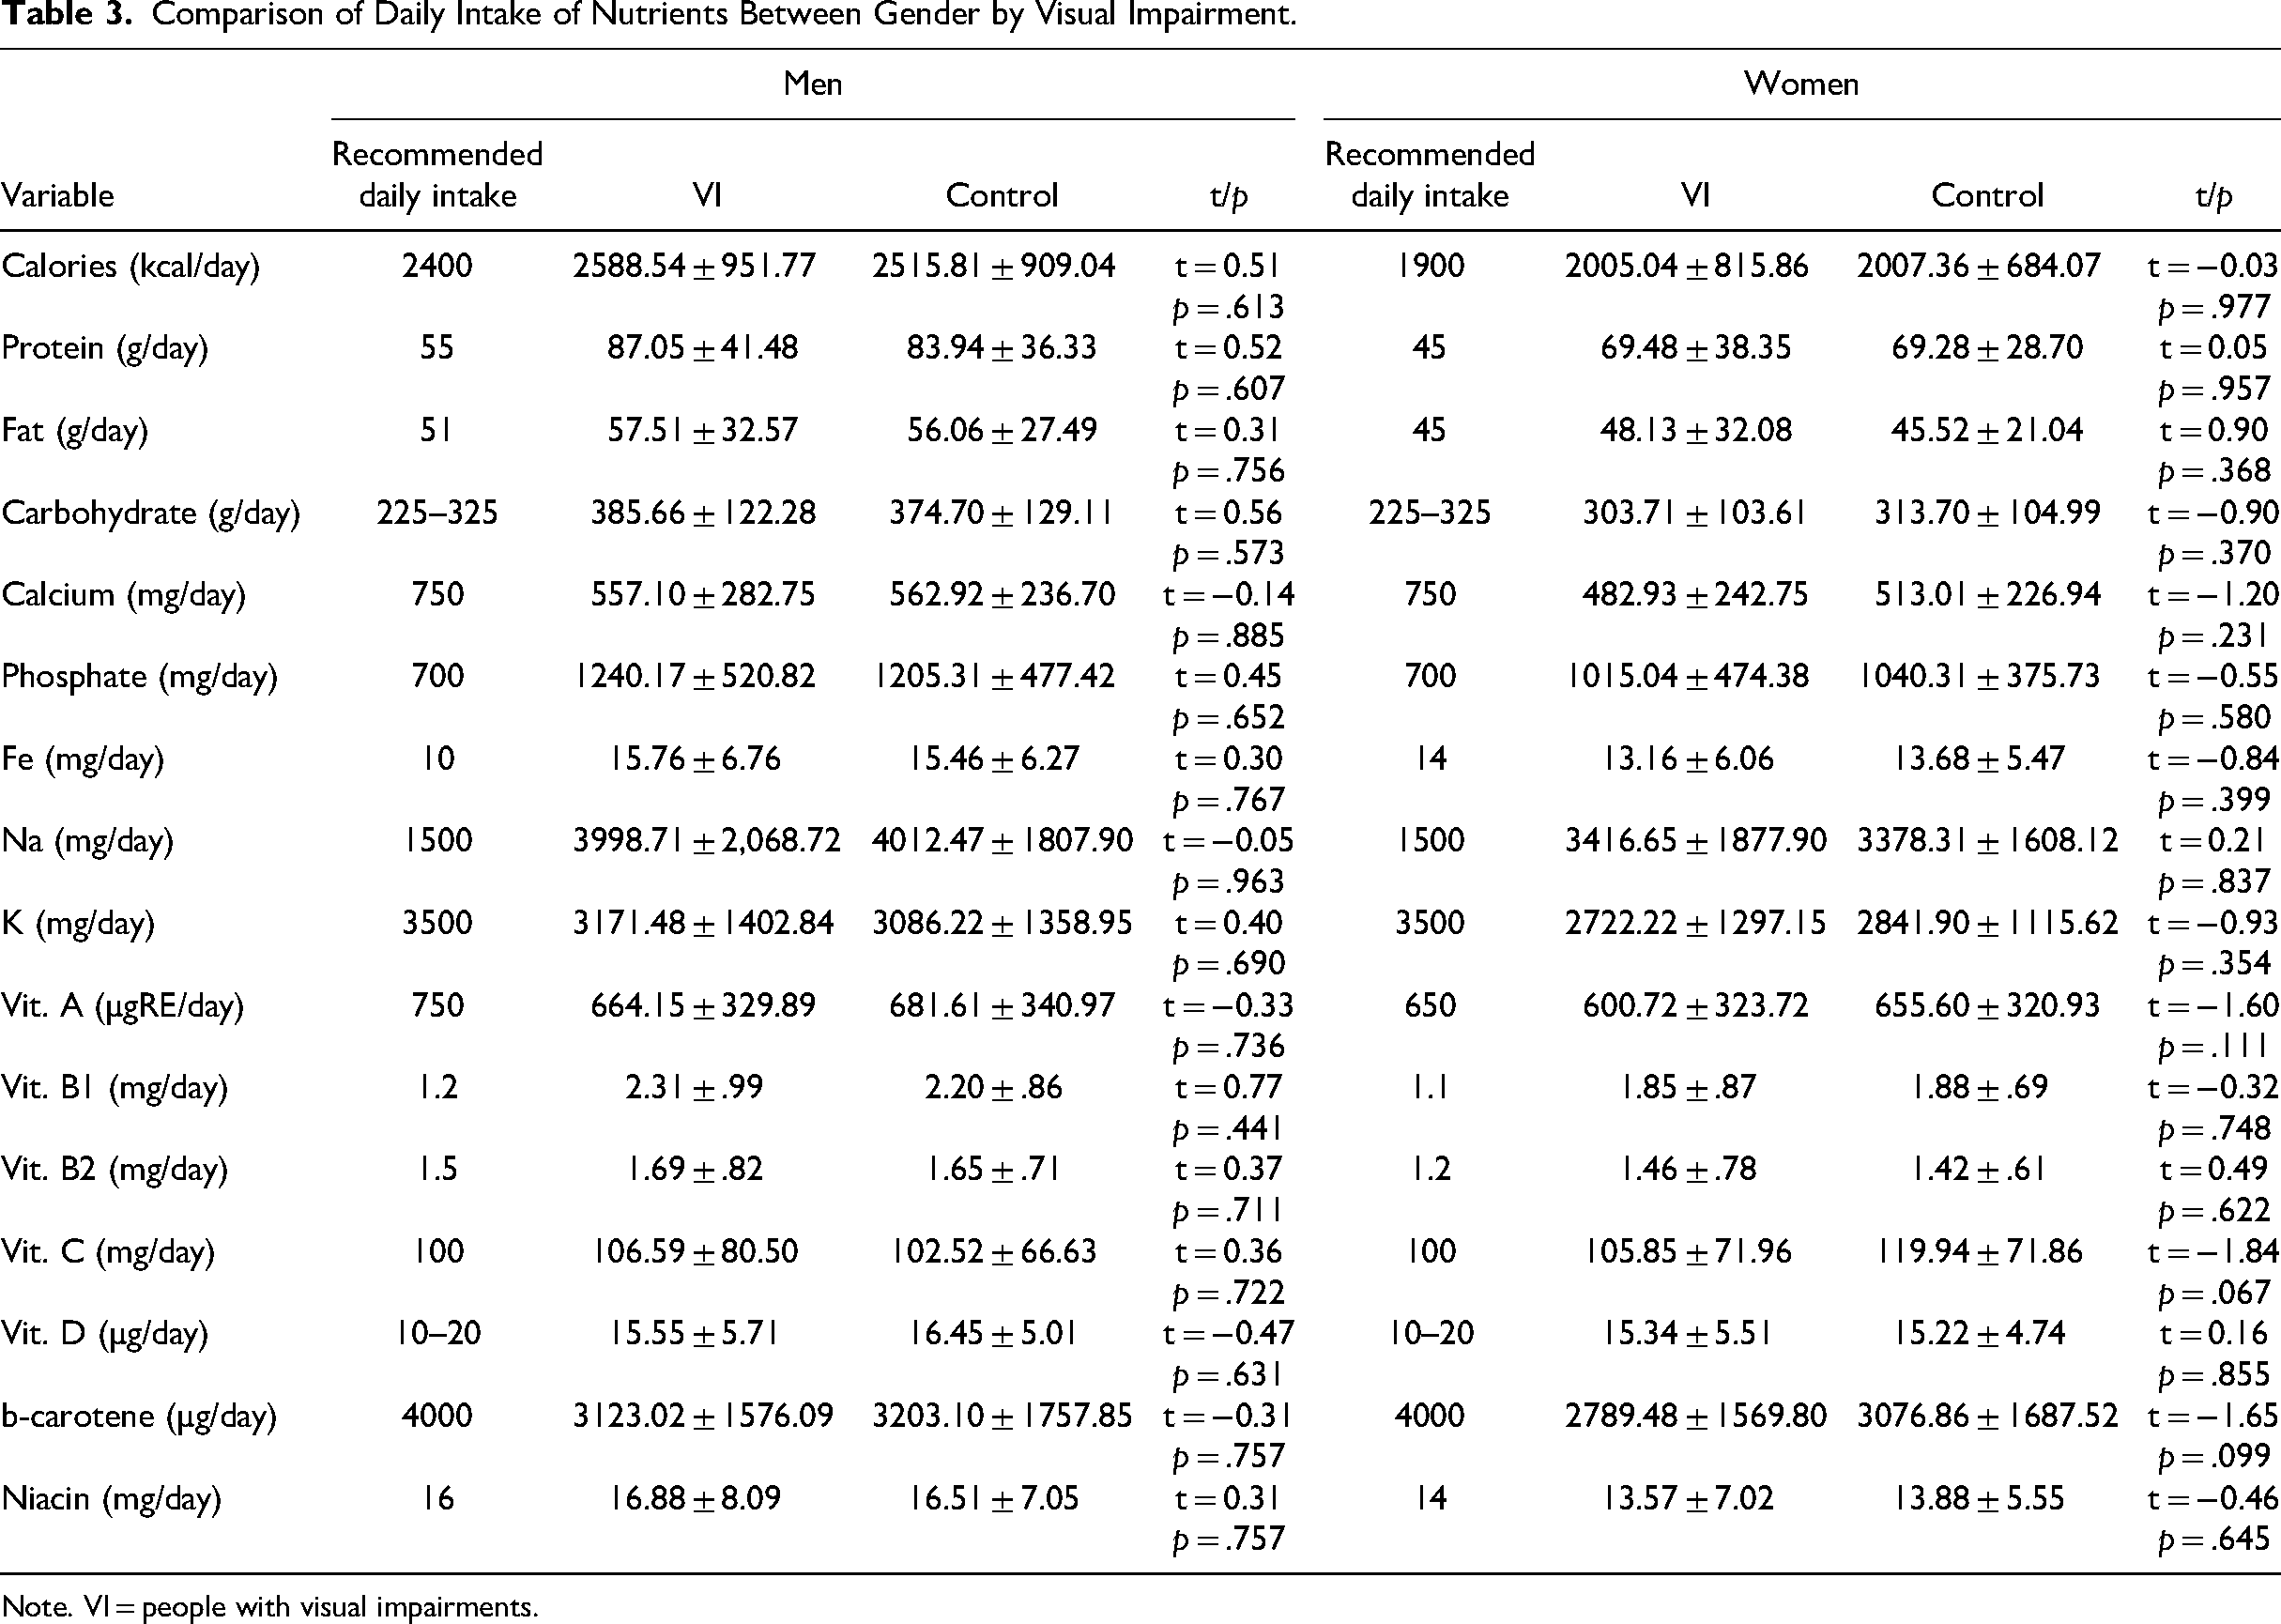
Note. VI = people with visual impairments.
Dietary Patterns
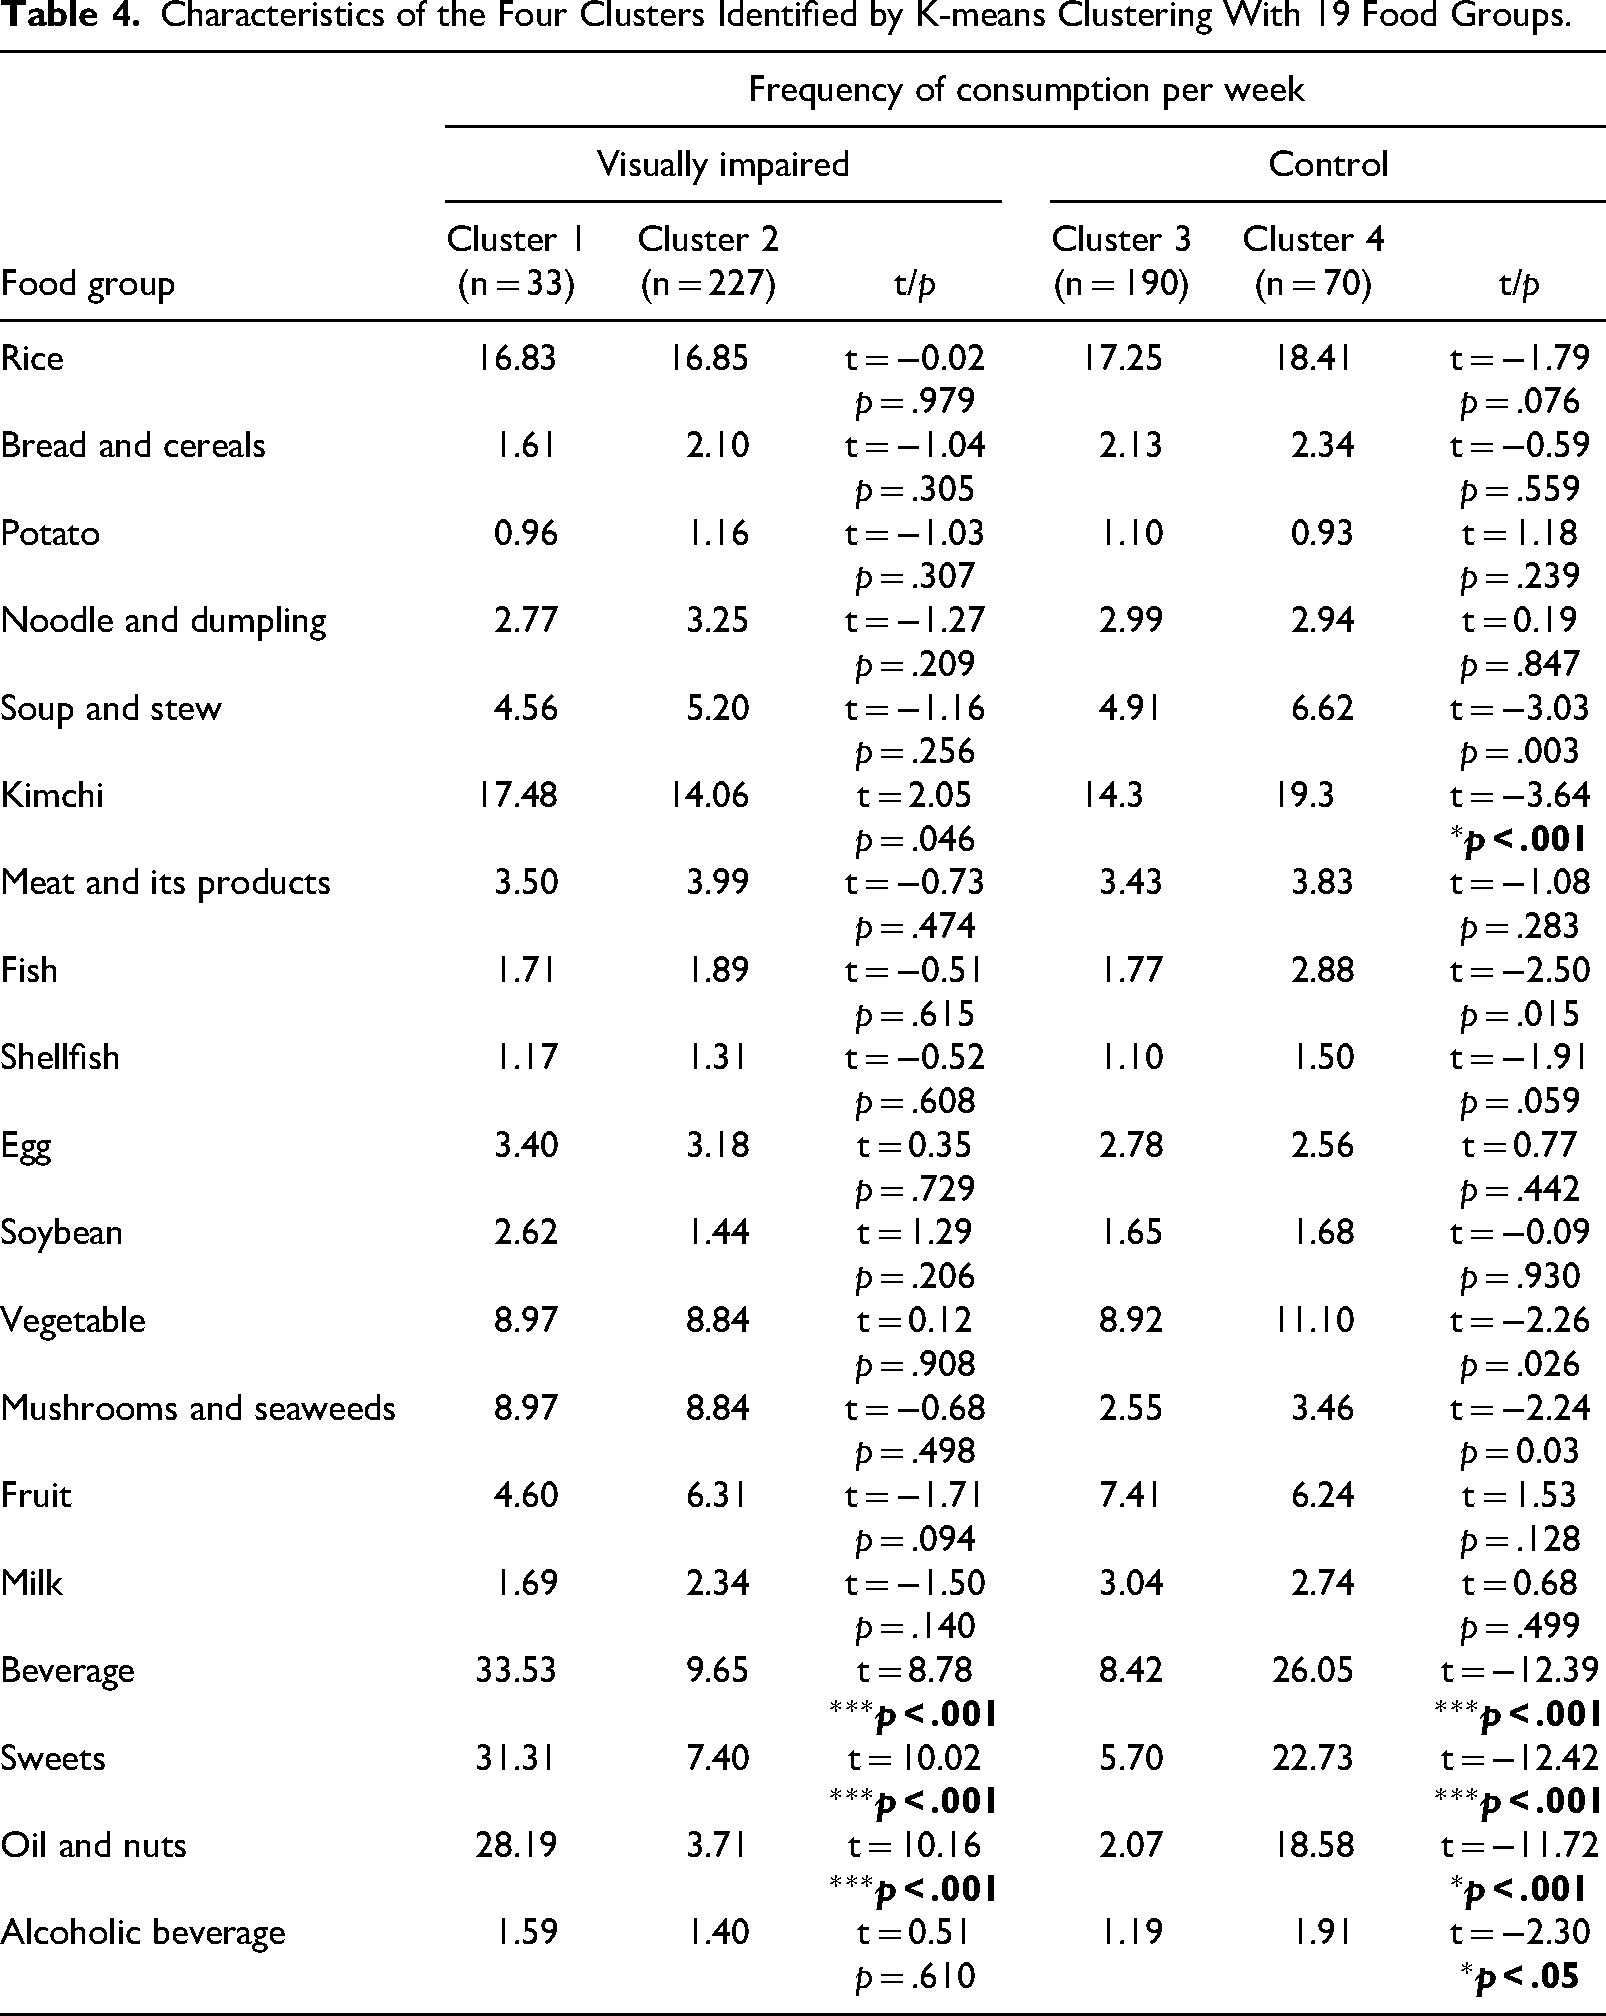
In k-means clustering, we considered three criteria for determining the optimal number of clusters (k): elbow method, silhouette method, and gap statistic (Pham et al., 2005). All three methods suggested that the optimal number of clusters was two; therefore, we performed cluster analysis (k = 2) and extracted the results using two clusters in two groups (i.e., people with visual impairments, control group). The k-means algorithm was run with different centroid seeds a maximum of 10 times, and the maximum number of bootstrapping was 500. Figure 1 and Table 4 show the final outputs from the clusters that converged after 500 iterations. From the respondents with visual impairments, Cluster 1 (n = 33) was characterized by more frequent consumption of kimchi (t = 0.25, p = .046), beverages (t = 8.78, p < .001), sweets (t = 10.02, p < .001), and oil and nuts (t = 10.16, p < .001) than Cluster 2 (n = 227). Similar patterns were also observed from the sighted respondents; Cluster 4 (n = 70) was characterized by a high consumption of soups and stews (t = 3.03, p = 0.003), kimchi (t = 3.64, p < .001), fish (t = 2.50, p = .015), vegetables (t = 2.26, p = .026), beverages (t = 12.39, p < .001), sweets (t = 12.42, p < .001), oil and nuts (t = 11.72, p < .001), and alcoholic beverages (t = 2.30, p = .020). The ratio of the between-cluster sum of squares to the total cluster sum of squares for the visually impaired respondents was 30.4%, and the ratio of the between-cluster sum of squares to the total cluster sum of squares for the sighted respondents was 48.5%.
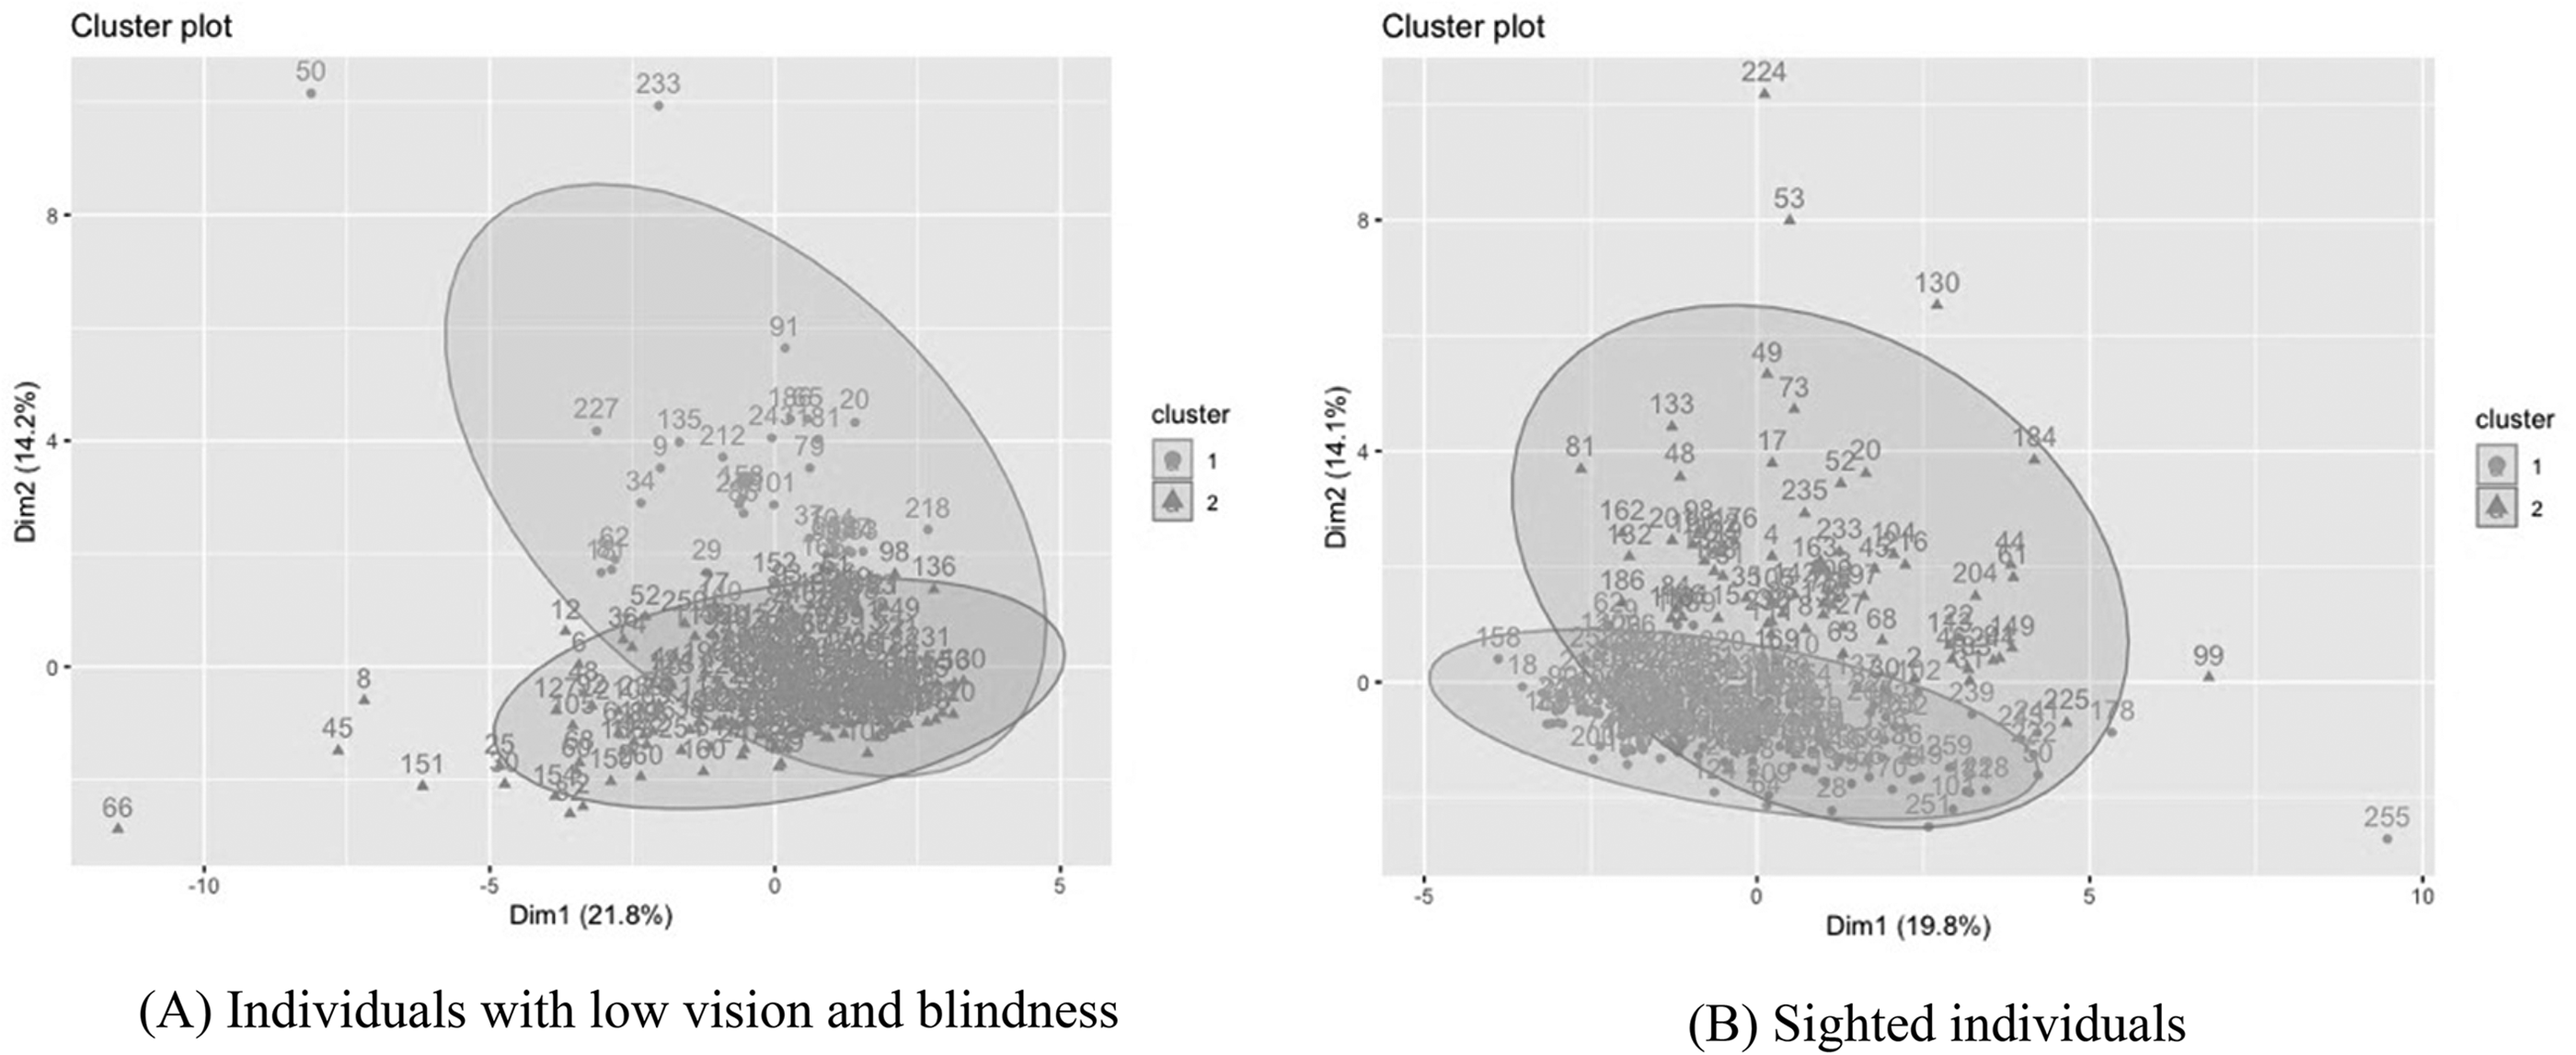
Clusters of dietary patterns. (a) Individuals with low vision and blindness. (b) Sighted individuals.
Characteristics of the Four Clusters Identified by K-means Clustering With 19 Food Groups.
Discussion
This is the first study to examine the nutritional status, daily nutrient intake, and dietary patterns of Korean adults with visual impairments by analyzing the KNHANES datasets. Our analysis showed that most people with visual impairments maintained a balanced physical health status. Although the average weight, BMI, and waist circumference of the visually impaired respondents were lower than those of the control group, the numeric values of these physical measurements were within standard ranges. Previous studies have linked a lack of physical activity and imbalanced food consumption to the high prevalence of obesity (Jones & Bartlett, 2018); however, we did not observe a high prevalence of obesity among individuals with visual disabilities. The younger age of the sample and the Korean diet, which consists of vegetables and high-quality meat and is lower in calories than the Western diet, may have contributed to the individuals’ favorable physical health status.
When we compared the daily nutrient intake between the visually impaired and control groups, we used the Dietary Reference Intakes for Koreans 2020 considering the age and gender of included respondents (Ministry of Health and Welfare, 2020). Unlike the findings of Jones and Bartlett (2020) and Na and Lee (2012), who reported that people with low vision consumed lower energy content and fewer micronutrients than their age-matched group, the respondents of this study consumed appropriate calories and micronutrients except for calcium, potassium (K), vitamin A, and beta-carotene. This inconsistency can be attributed to the social welfare systems for people with disabilities, including government-based financial aid in South Korea. For instance, the National Basic Livelihood Security System (NBLSS) provides livelihood income, housing, and self-support assistance to people with disabilities depending on their welfare needs and ability to work. With the assistance of the social security system, people with severe visual impairments in South Korea may experience a reduced burden concerning daily food intake.
Considering the effects of cultural backgrounds and genetic factors, we primarily compared the findings of this study with the previous studies (Na & Lee, 2012) designed for Korean adults. The high intake of sodium was identified as the most significant problem among all respondents of this study, indicating this unhealthy eating habit should be carefully observed longitudinally to understand its prolonged effects on health conditions. Similarly, Na and Lee discussed the high sodium intake (the average intake of 4,556 mg sodium per day) of 305 participants aged between 38 and 78 years (Na & Lee, 2012). Due to the frequent use of seasonings in Korean cuisine, the consumption of sodium can be relatively higher compared to other countries. Notably, Korea's national food, kimchi, contains high sodium and may contribute to the high prevalence of hypertension among Koreans. To reduce and prevent the prevalence of hypertension and cardiovascular disease in late adulthood, developing health policies aimed at alerting the public to reduce their sodium intake is essential. Additionally, to increase the daily intake of potassium (K), vitamin A, and beta-carotene among all younger adults, practical guidelines informing the recommended intake of micronutrients and their positive effects on the human body should be created and disseminated. For individuals with visual impairments, an accessible format (e.g., audio, braille, digital text) of nutrition education materials should be provided.
When k-means clustering was performed, the dietary patterns of respondents with visual impairments were divided into two groups. Considering the low value of the clustering performance, it was necessary to carefully review the outcomes. Most of the participants shared similar weekly food consumption patterns. When comparing Clusters 1 (n = 33) and 2 (n = 227), the participants in Cluster 1 tended to consume kimchi, beverages, sweets, and oil and nuts more frequently. The excessive intake of certain food items containing a large amount of sodium, fat, and sugar may result in a variety of health problems, including an increased risk of obesity, cardiovascular disease, diabetes, metabolic syndrome, and non-alcoholic fatty liver disease (Harrison et al., 2019). Recommending specific dietary modifications, including increasing the intake of antioxidant-rich food and decreasing fat intake, which can lower intraocular pressure and mitigate nutritional optic neuropathy, is an effective strategy for preventing chronic illnesses among visually impaired populations (O’Callaghan et al., 2018). Concerning beverages that include products containing caffeine, given the deleterious effects of caffeine on the quality of overnight sleep, the overuse of caffeine-infused beverages, such as coffee, tea, and energy drinks, should be assessed and prevented (Ma et al., 2016). However, because the FFQ questionnaire used throughout the original research collected the consumption frequency of each food item without considering its serving size, the identified clusters should be interpreted with caution.
Overall, the findings from the data analysis of this research indicated that the nutritional status and dietary intake patterns of people with visual impairments in South Korea were similar to those of sighted people. However, a small number of respondents showed high-risk eating behaviors and a high possibility of being diagnosed with metabolic disorders. When we took a closer look at 33 respondents in Cluster 1 to identify any shared patterns, their average level of LDL cholesterol was 123 (mg/dL), the average sodium intake was 4,685 (mg/day), 13 out of 22 were men, and 10 respondents’ highest education level was high school. Providing community-based health education with daily tracking of food consumption for the high-risk group among visually impaired people with unhealthy eating behaviors should be prioritized.
Conclusions
Our findings support the need for personalized nutrition education aimed at initiating healthy eating behaviors and recognizing the significance of a well-balanced nutrient intake. Although the physical status of Korean adults with visual impairments included in this study was similar to that of their sighted counterparts, the long-term interactions of vision loss, unhealthy eating behaviors, and nutrition intake should be monitored. Finally, we propose to develop and disseminate accessible nutrition- and diet-related health education for people with visual impairments to encourage the consumption of nutrient-dense foods to prevent the progression of vision loss and secondary health problems.
Limitations
One limitation of this study was that we were not able to rigorously control covariates for the data analysis. Secondly, most analyzed data were collected from individuals aged between 19 and 49 years. Thirdly, the analyses of the cross-sectional data did not capture the longitudinal patterns of nutritional status or dietary patterns, which can vary throughout one's lifespan. Lastly, the food intake assessment of this study did not include the portion size of each food consumption. Therefore, the comparison of food consumption frequencies without considering portion size can misinform us about the nutrition intake of the respondents.
Footnotes
Acknowledgements
Dr. Lee contributed to conceptualization, research design and data analysis. Dr. Choi contributed to research design, data collection, and data analysis. Ms. Lim contributed to data collection and data analysis. All authors contributed to the writing and submission of the manuscript.
Declaration of Conflicting Interests
The authors declared no potential conflicts of interest with respect to the research, authorship, and/or publication of this article.
Funding
The author(s) disclosed receipt of the following financial support for the research, authorship, and/or publication of this article: This work was supported by the National Research Foundation of Korea (NRF) grant funded by the Korea government (MSIT) (No. 2022R1A2B5B01002485) to H. Lee.