
Abstract
Keywords
In the United States, policies that determine the caseloads of special education teachers vary state by state (Hogue & Taylor, 2020; Jackson, 2003). Some states have established a maximum number of students for a special education teacher's caseload, and other states use information about the disability categories of the students, severity of the students’ disabilities, age of the students, type of special education setting, and type of supports the students receive to determine the caseloads of special education teachers (Hogue & Taylor, 2020). Other states mention caseloads in their policies, but do not establish a maximum number of students for special education teachers’ caseloads. Caseload information of teachers serving students with visual impairments is only mentioned by four states: Georgia, Kentucky, Ohio, and Pennsylvania (Hogue & Taylor, 2020).
The National Association of State Directors of Special Education developed guidelines for educating students with visual impairments (Pugh & Erin, 1999). These guidelines did not establish appropriate caseloads for teachers of students with visual impairments (TVIs) or orientation and mobility (O&M) specialists. However, they recommended that caseloads be based on the individualized needs of the students (Pugh & Erin, 1999). According to the National Plan for Training Personnel to Serve Children with Blindness and Low Vision, a caseload of 8 students with visual impairments was reasonable, but not ideal (Mason et al., 2000). Other guidelines suggest that TVIs and O&M specialists should have a caseload of between 8 and 12 students, depending on the needs of the students and the amount of time that is required for an itinerant professional to travel between the students’ schools (Ferrell et al., 2014). Related professional responsibilities, such as consulting with general education teachers and adapting instructional materials, should also be considered when making decisions about caseloads and overall workload (Lewis & Allman, 2017).
☑Earn CEs Online
by answering questions on this article.
For more information, visit:
http://my.aerbvi.org/AER-Store/Publications/BKctl/ViewDetails/SKU/AER
Students with visual impairments in the United States are often served by itinerant TVIs and O&M specialists (Ferrell et al., 2014). Over the last 25 years, several researchers have explored the caseloads of these professionals. Two hundred and twelve dually certified teachers (TVIs and O&M specialists) reported an average caseload of 18 students with visual impairments (Griffin-Shirley et al., 1999). The majority of these dually certified teachers were White (96%) and employed full-time (87%). Twenty-three itinerant TVIs in Colorado reported an average caseload of 17 students (Correa-Torres & Howell, 2004). No information about gender and race or ethnicity was provided. Some of these itinerant TVIs felt that their caseloads were too large and affected the quality of services that they could provide to their students (Correa-Torres & Howell, 2004). In a survey distributed to members of the Association for the Education and Rehabilitation of Blind and Visually Impaired (AER), 422 TVIs and O&M specialists reported a weekly average caseload of 22 students (Griffin-Shirley et al., 2004). Almost all of these professionals were White (96%) and employed full-time (84%). They also reported spending an average of 7 h traveling between educational settings, 18 h providing direct instruction in the expanded core curriculum, 8 h completing related professional responsibilities, and 4 h in assessment and program planning activities. In 2011, Correa-Torres and Durando collected data from vision professionals serving linguistically and culturally diverse students. The 204 TVIs and O&M specialists who participated in the study reported a mean of 19 students on their caseload. The majority of the professionals in that study were itinerant (67.6%) and White (85%). Caseload data after 2011 was not found in the review of research. It should be noted that none of these studies were specifically focused on exploring caseloads, but collected these data as part of the demographic and background information of their participants.
The current study focuses on the questions regarding caseloads from an electronic survey administered to TVIs and O&M specialists across the United States in 2020. The following research questions were explored:
How do reported caseload averages for direct service and consult students differ based on region, employment status, role, or service delivery model? How do reported caseload averages and ranges compare to historical and current caseload policies?
Method
Instrument and Recruitment
The demographic data used in this analysis came from the larger, eight-part survey that focused on the experience of families, children and youths with visual impairments, and professionals at the onset of the COVID-19 pandemic in the United States and Canada (Rosenblum et al., 2020). The survey questions and “skip logic” were reviewed by several professionals in the field, and their input was used in finalizing the survey instrument (available from the second author). Information about the study was widely distributed across the field of education of learners with visual impairment by sponsoring organizations, the researchers, and through the posting of a recruitment flyer on social media and various electronic discussion groups. The electronic survey was open from April 22 to May 13, 2020.
Informed Consent
The study and survey were approved by the American Foundation for the Blind ethics committee and the University of South Carolina Institutional Review Board. Informed consent was obtained on the first page of the survey before participants were provided with the questions.
Current Study
The analysis presented here focuses only on professional demographic data and reported pre-pandemic caseload numbers of professionals in the United States. Reported numbers of students receiving direct or consult services on caseloads were explored in the context of role, employment status, setting or service delivery, and U.S. regions and subregions. The following multiple-choice and open-response (for caseload numbers) questions from the survey were used in this analysis.
Country State and zip code Gender (male, female, non-binary, other, prefer not to answer) Race/origin (Asian, Black or African American, Hispanic or Latinx, Native Hawaiian or Pacific Islander, Multi-Racial, White, other, prefer not the answer) Role (certified/licensed TVI employed in the 2019-2020 school year, certified/licensed O&M specialist impairment employed during the 2019-2020 school year, certified/licensed TVI and O&M specialist employed in both roles for the 2019-2020 school year (Dual)) Setting/service delivery (select all settings you were working in on March 1, 2020: itinerant, resource room in a public school, residential/specialized school, early intervention/preschool program, charter/private school, other) Employment status (full-time, part-time, as needed/contract, other) Number of direct service students on your caseload on March 1, 2020 (The survey defined direct service students as students who professionals met with regularly to provide instruction in the expanded core curriculum.) Number of consult students on your caseload on March 1, 2020 (The survey defined consult students as students whom professionals monitor or “check in” with periodically.) On March 1, 2020, did you have any direct service academic students who are blind?
For country, only individuals in the United States were used in the analysis due to low response rate for other countries (i.e., Canada). State and zip code were used to code each respondent into a region and smaller subregions as defined by the United States Census Bureau. Subregions were used for post-hoc analyses when a comparison was significant. For setting or service delivery a “multiple setting” variable was created for respondents who had selected more than one setting. Charter school was not used in the analysis due to low selection, but respondents were coded as “multiple setting” if they had selected another setting as well. Other responses were reviewed and coded into a category if relevant.
Analysis
SPSS version 28 statistical software was used for the analysis. ANOVAs, Tukey post-hoc analyses, and Chi Squares were conducted, where applicable, to explore significant differences between the independent variables. Three extreme outliers (one reporting 110 and two reporting 200 direct service students) were removed for the statistical and descriptive comparisons to avoid artificially increasing caseload averages.
Results
Demographics of Professionals
Table 1 shows the breakdown of the number of respondents to the survey in the United States by profession, employment status, service delivery, and region. It should be noted that due to an initial issue with skip logic in the survey, some professional demographic data was not collected. Subsequently, these data were not used in the analysis.
Respondents by Category.
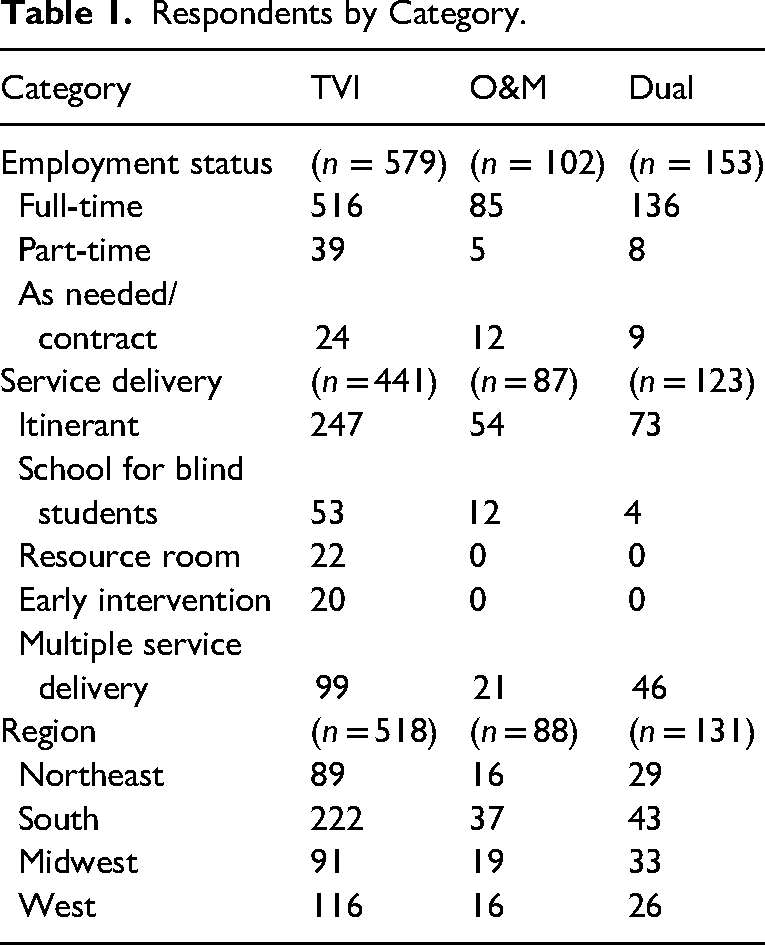
Reported ethnicity was explored by subregion (i.e., New England, Middle and South Atlantic, East and West South Central, East and West North Central, Mountain, and Pacific) for any differences geographically. Subregions were used to look more closely for differences within smaller clusters of states than the general four U.S. regions would likely provide. Pearson Chi-Square tests indicated no significant differences (p = .346) proportionately by subregion, with the percentage of professionals identifying as female ranging from 85 to 95% among the subregion respondents. No professionals identified as nonbinary or “other” in this sample. For race, 68–97% of subregion respondents identified as White. Chi-Square tests indicated some significant differences in ethnicity breakdown between subregions (p = .000). The differences are partially attributed to how many respondents selected “prefer not to answer.” By subregion, respondents identifying as Black or African American ranged from 0–4%; American Indian or Alaskan Native ranged from 0–3%; Asian, 0–6%; and multiracial, 0–2%.
Role and Caseload Sizes
Table 2 shows the average caseload sizes by role (TVI, O&M, dually certified). Tukey post-hoc analyses indicated that average combined caseloads (direct and consult students) were not significantly different by role. A significant difference in caseload size was found between TVI and O&M for both direct (p < .001) and consult averages (p = .04) and between O&M and dual for both direct (p = .004) and consult numbers (p = .006). Caseload averages across roles ranged between 11 and 16 students for direct service, with O&M averages being 16 students. Dually certified professionals had the higher average for consult students (8.1). Combined caseload averages ranged from 18 to 20 students.
Caseload Averages by Role and Tukey Post-hoc Analyses.
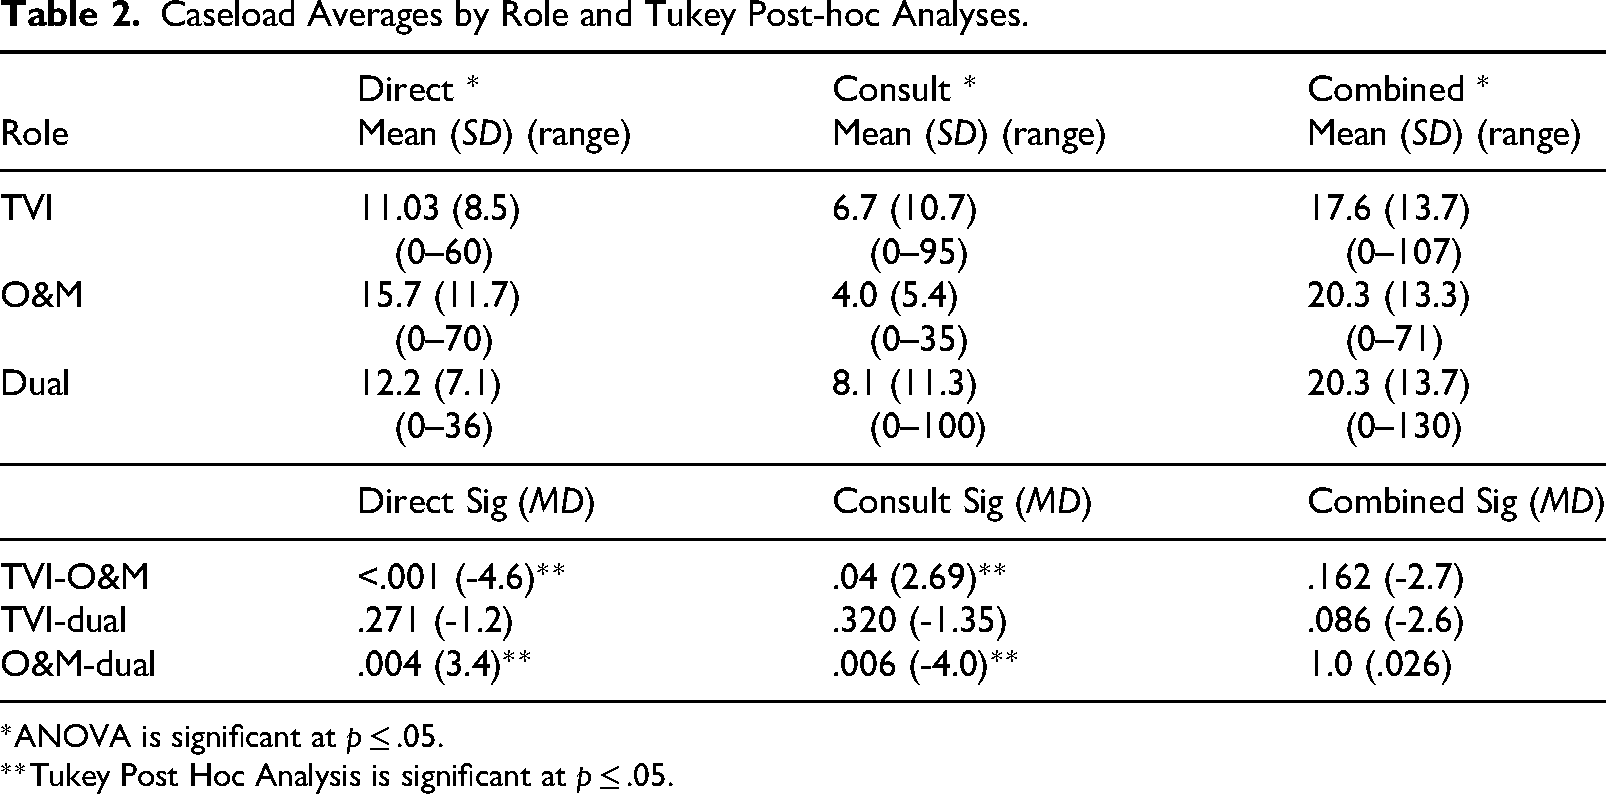
*ANOVA is significant at p ≤ .05.
**Tukey Post Hoc Analysis is significant at p ≤ .05.
Employment Status and Caseload Sizes
Tables 3, 4, and 5 show caseload averages (total caseload, direct service students, consult students) by employment status, service delivery, and U.S. region for TVI, O&M and dual respondents. Total caseload averages ranged between 19 and 21 students for full-time, 12 to 13 students for part-time, and 8 to 17 students for “as needed/contract.” Tukey post-hoc analyses indicate a significant difference between total caseload averages for TVI full-time employment status (direct and consult) and part-time (p = .005) and as needed/contract employment status (p < .001). As needed/contract employment status was also significantly different from full-time for direct service caseload numbers (p = .002). Interestingly, significant differences were not found between full-time and part-time caseloads for either direct (p = .059) or consult averages (p = .076) for TVIs, when considered separately. Significant differences were also not found for O&M caseloads. Dual total caseload averages were significant (p = .026) by employment status, but post-hoc analyses did not indicate significance for any specific comparison. See Table 3 for additional information on employment status.
Direct Service, Consult, and Total (Direct and Consult) Caseload Averages, Standard Deviations, Ranges, and Tukey Post-hoc Analyses for Employment Status.
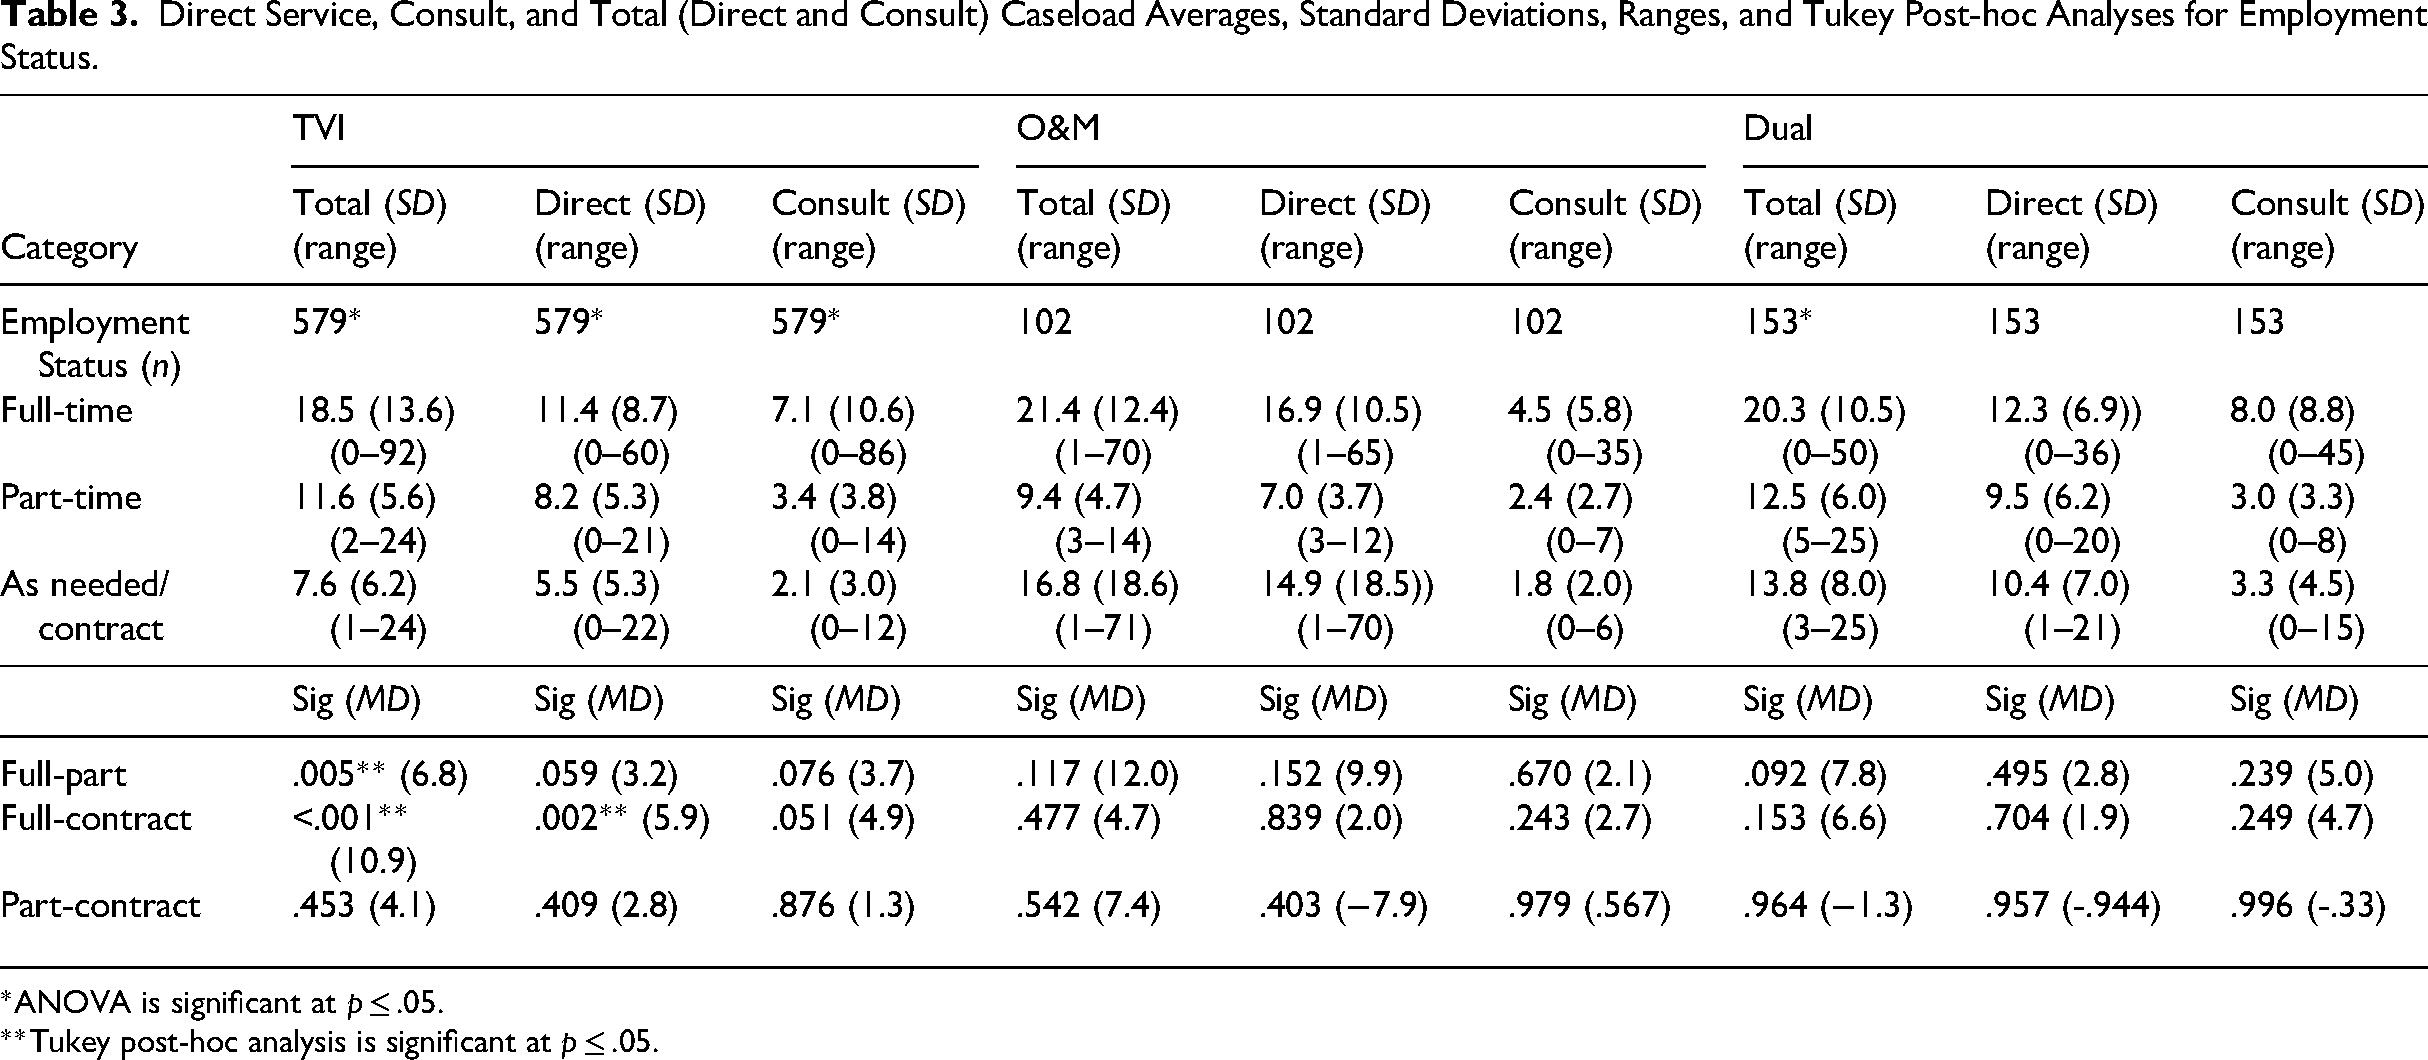
*ANOVA is significant at p ≤ .05.
**Tukey post-hoc analysis is significant at p ≤ .05.
Direct Service, Consult, and Total (Direct and Consult) Caseload Averages, Standard Deviations, Ranges, and Tukey Post-hoc Analyses for Service Delivery.
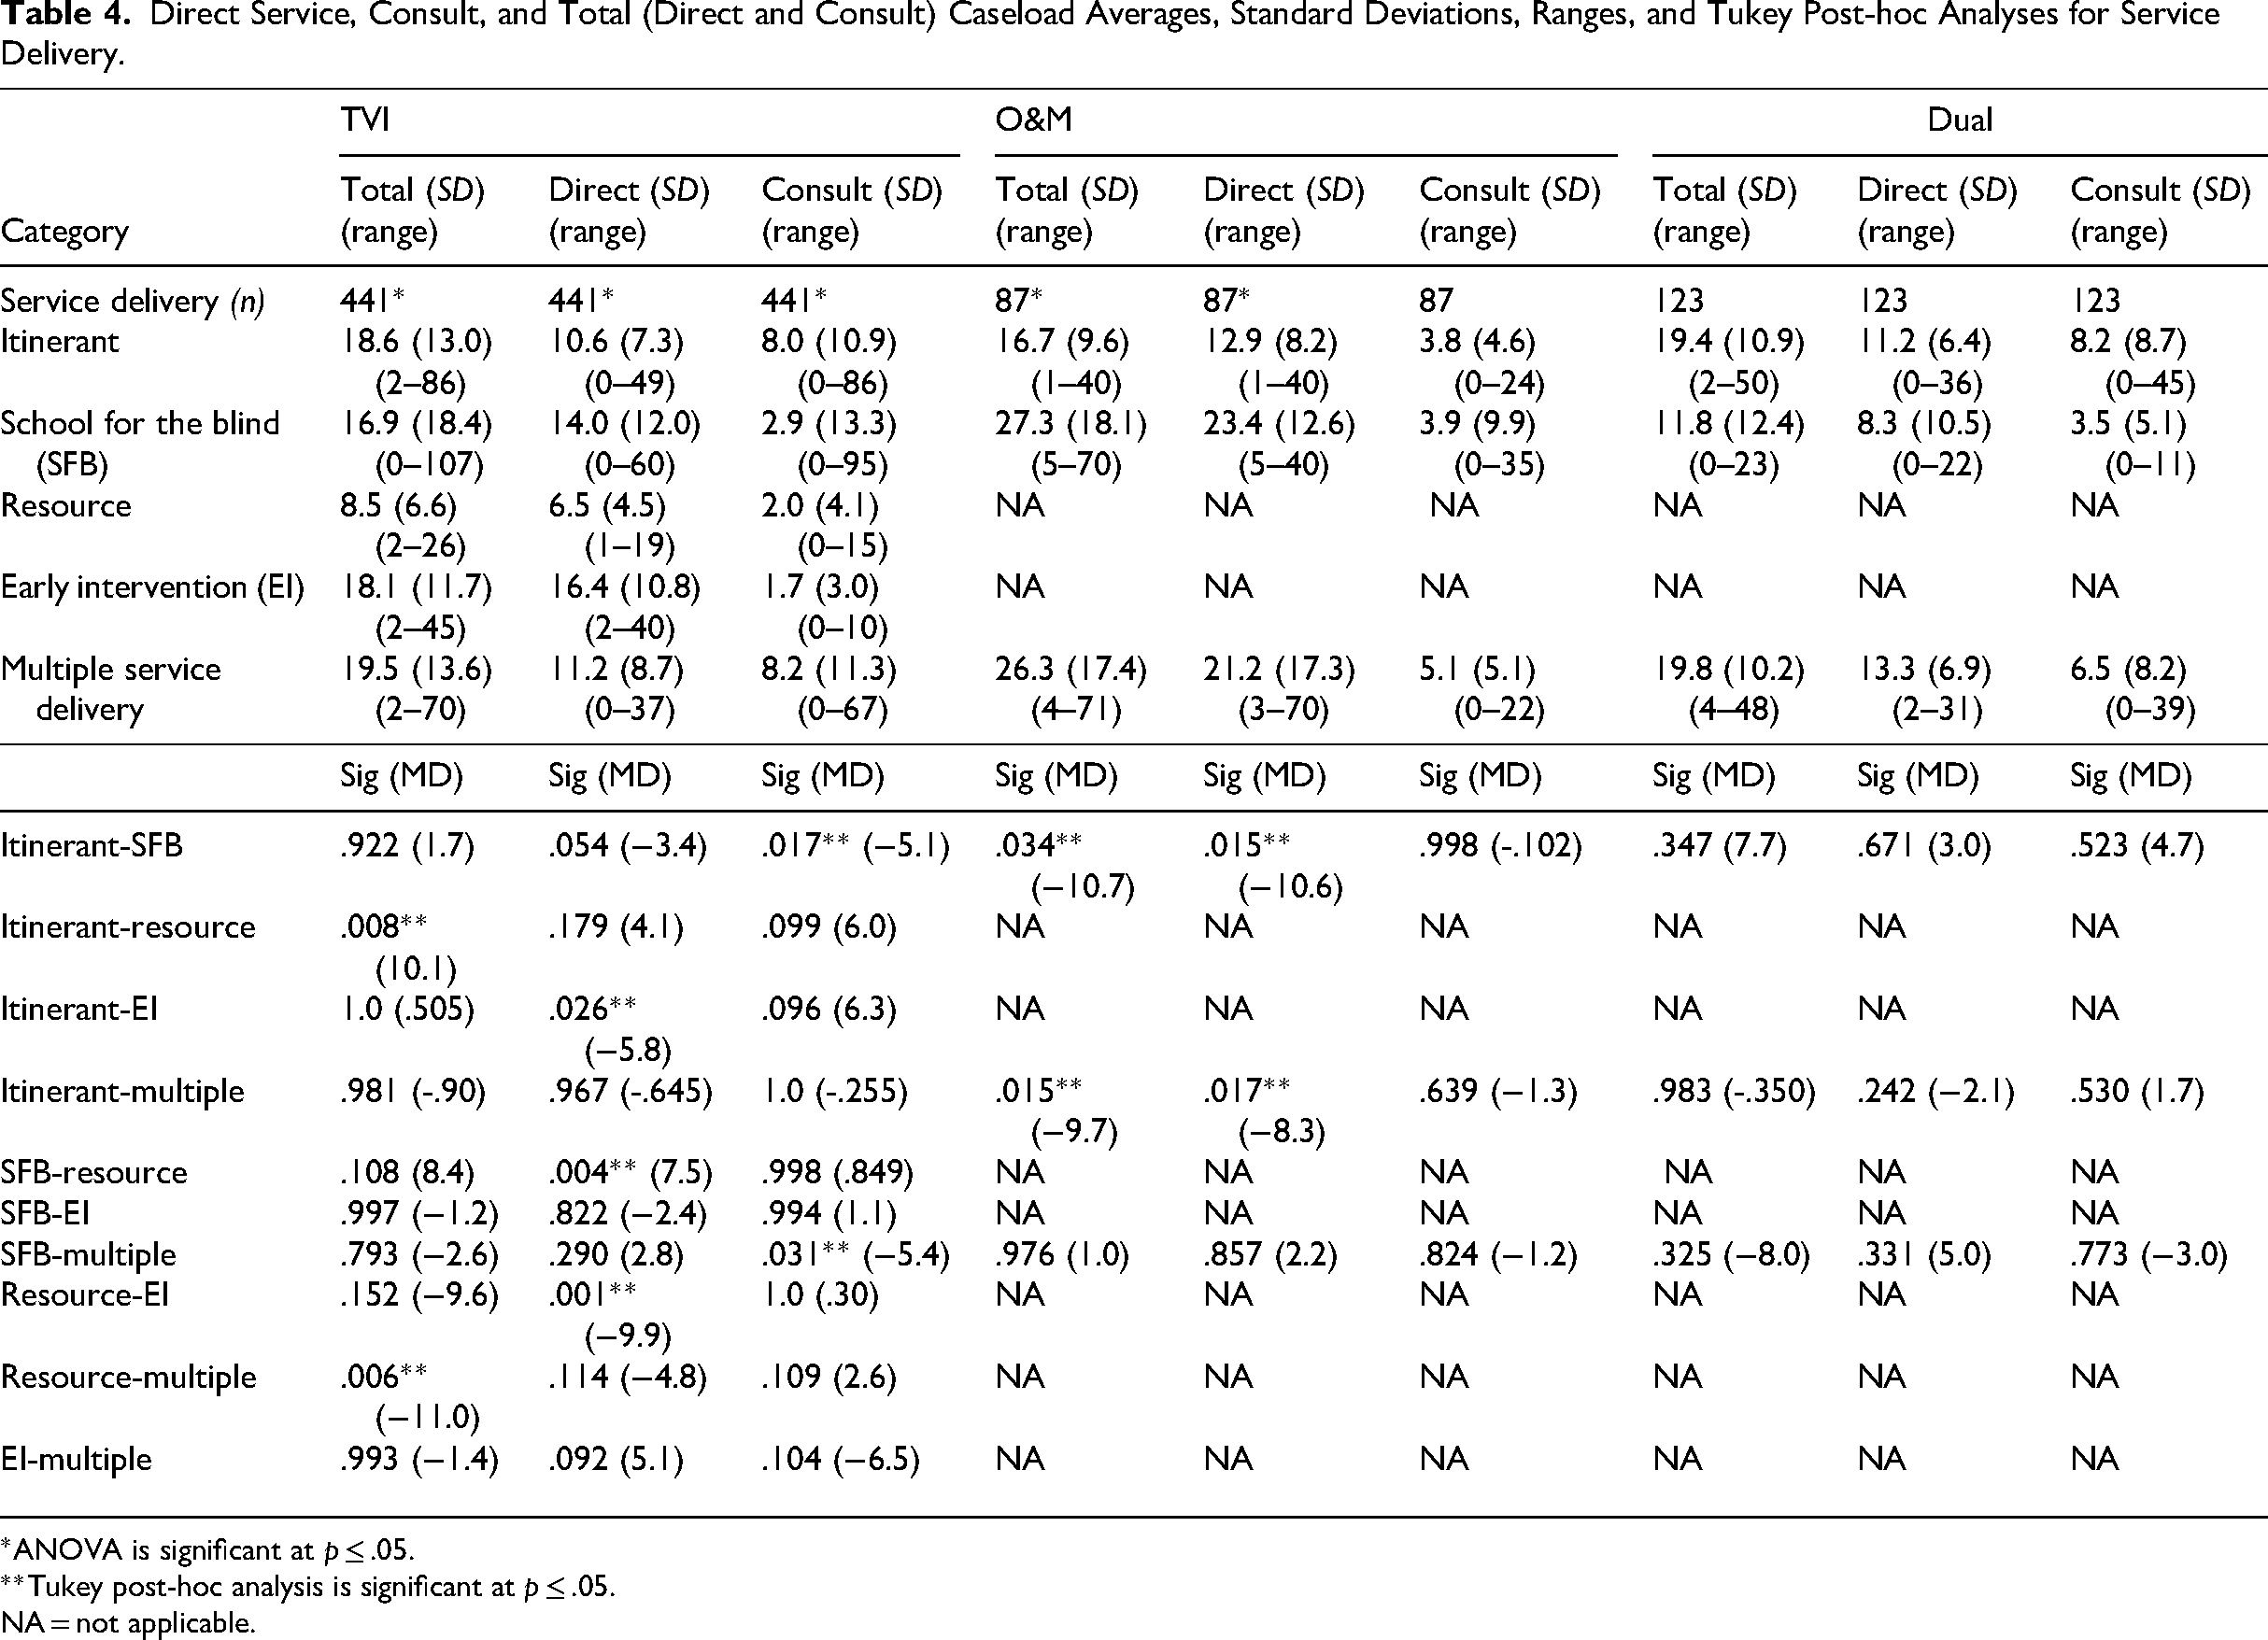
*ANOVA is significant at p ≤ .05.
**Tukey post-hoc analysis is significant at p ≤ .05.
NA = not applicable.
Direct Service, Consult, and Total (Direct and Consult) Caseload Averages, Standard Deviations, Ranges, and Tukey Post-hoc Analyses by Region.
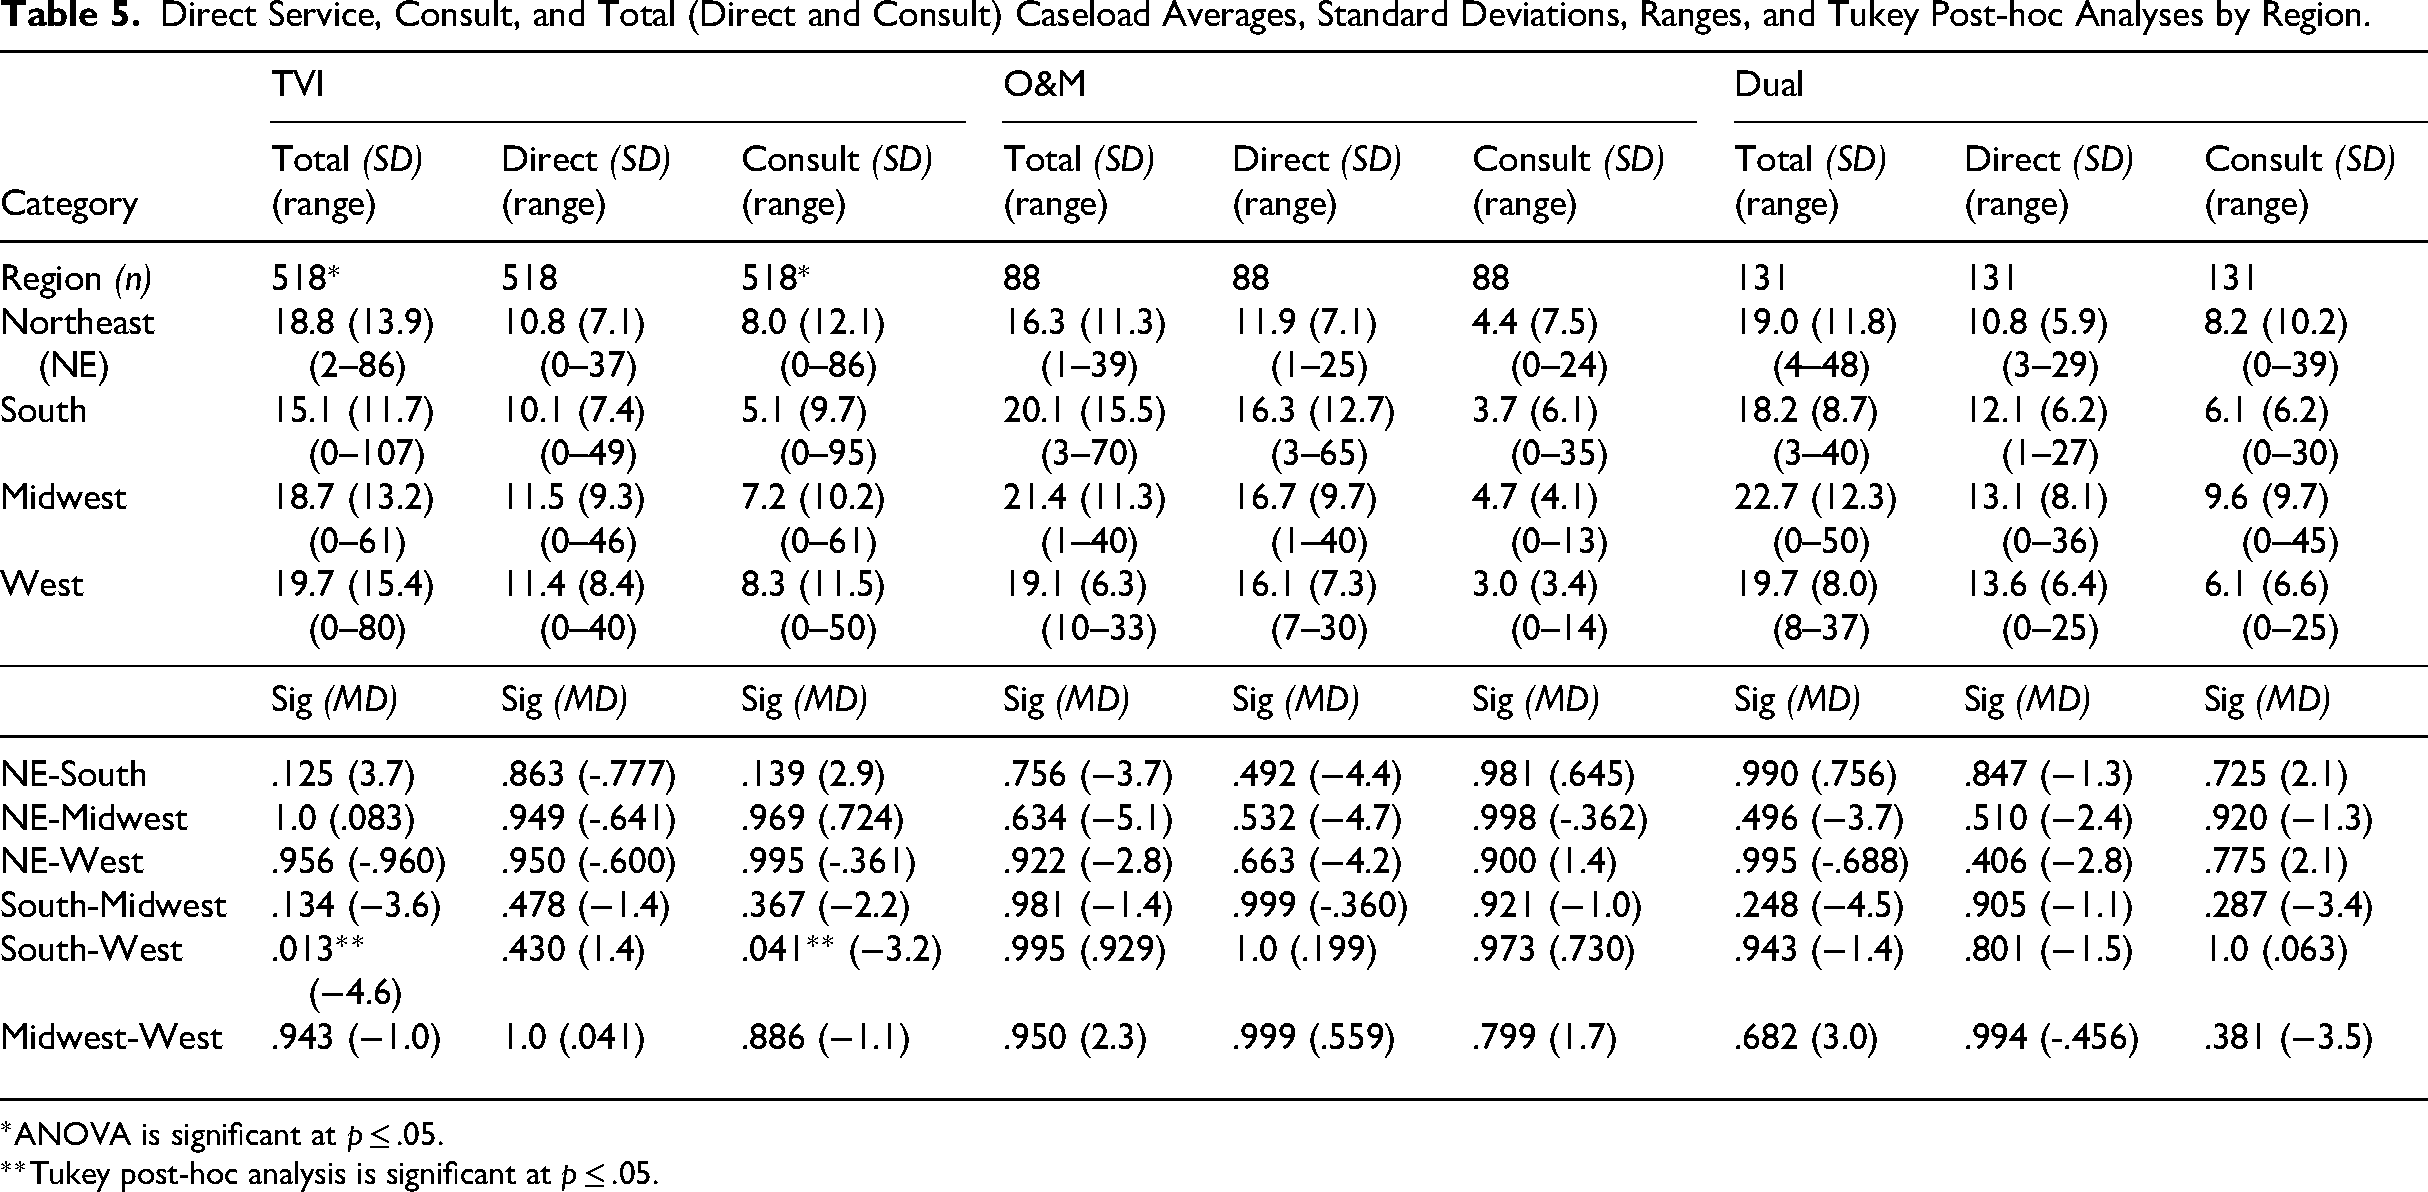
*ANOVA is significant at p ≤ .05.
**Tukey post-hoc analysis is significant at p ≤ .05.
Service Delivery and Caseload Sizes
For service delivery (itinerant, school for blind students, resource room, early intervention, multiple service deliveries) significant differences were found in the TVI and O&M roles. For TVI, post hoc-analyses indicated a significant difference in total caseload averages between resource and itinerant (p = .008) and multiple service deliveries (p = .006). For direct-service averages, significant differences were found between early intervention and itinerant (p = .026) and resource (p < .001). Schools for blind students and resource rooms were also significantly different in direct service averages (p = .004). For consult numbers, schools for blind students were significantly different from both itinerant (p = .017) and multiple service deliveries (p = .031). In addition, for O&M caseloads, total caseload averages were significantly different between itinerant and both schools for blind students (p = .034) and multiple service deliveries (p = .015). A significant difference was also found for direct service averages between itinerant and both school for the blind (p = .015) and multiple service deliveries (p = .017). Across roles, total service delivery caseload averages for itinerant professionals ranged from 17 to 19 students, 20 to 26 students for schools for blind students, and 20 to 26 students or learners for multiple service deliveries. See Table 4 for additional information on the caseload averages, standard deviations and ranges by role for service delivery.
U.S. Regions, Subregions, and Caseload Sizes
Table 5 shows the caseload averages for roles by U.S. region. Across roles, caseload averages ranged from 16–19 students in the Northeast, 15–20 students in the South, 19–23 students in the Midwest, and 19–20 students in the West. Tukey post-hoc analyses indicated a significant difference between TVI total (p = .013) and consult (p = .041) caseload averages in the South and West. More specifically, by subregion, these differences were between the Pacific region and the South Atlantic (p = .004), East South Central (p = .045), West South Central (p < .001), and Mountain (p = .002) regions for total caseload averages. The Pacific region and West South Central were also significantly different for direct service numbers (p = .017), and the Pacific region and South Atlantic were significantly different for consult numbers (p = .032). No other significance was found.
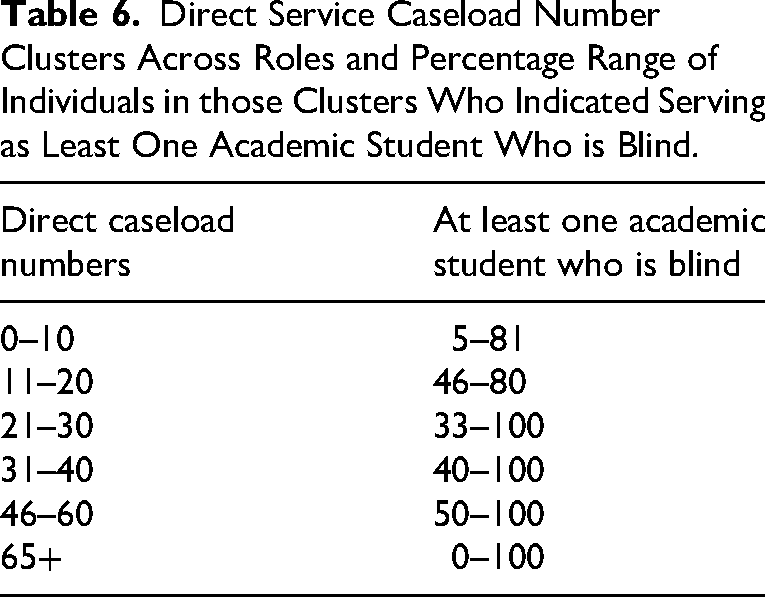
Direct Caseload Numbers and Academic Students Who Are Blind
Respondents were asked if they had at least one academic student who is blind on their caseload. When comparing the number of direct service students to whether or not respondents said “yes” to having an academic student who is blind, percentages indicating at least one student who is blind did not decrease as direct service caseload numbers increased. Table 6 shows the percentage ranges of respondents having an academic student who is blind for direct caseload ranges.
Discussion
This study is the first in about a decade to provide a snapshot of caseload averages for TVIs, O&M specialists, and dually certified professionals across the United States. Caseload averages for these participants were similar to the caseload averages reported by Correa-Torres & Durando, 2011; Correa-Torres & Howell, 2004; Griffin-Shirley et al., 1999; and Griffin-Shirley et al., 2004. Although the averages were similar to prior reports of caseloads, some are above the 8 to 12 student range recommended by Ferrell et al. (2014) and Mason et al. (2000). More than 100 of the full-time professionals (n = 105; 14.2%) in this study reported caseloads between 30 and 200 students, which calls into question the ability of these professionals to provide appropriate levels of services compared to those closer to the reported averages. These findings also cause concern for equity of service provision for all students with visual impairments across the United States. On a more positive note, 322 (43.7%) full-time professionals reported a combined caseload of between 1 and 12 students. Regionally, caseload averages were relatively similar with only one area of statistical difference. The upper limits of the ranges did vary, with the South having wider ranges for TVI consult and O&M direct caseload numbers.
Caseload averages and diversity of TVIs, O&M specialists, and dually certified professionals in general followed expected trends. Most participants were White and female, highlighting a continued need to address diversity in the profession. In addition, collecting data on other aspects of diversity (e.g., disability, linguistic identity) would increase understanding of individuals who serve students with visual impairments and the diverse lived experiences that they bring to the profession. Participants who worked full-time served more students than participants who worked part-time. However, there was not a significant difference between part-time and full-time caseload averages, which might perhaps be partially attributed to the sample size differences. Nonetheless, it is a concerning finding. The number of respondents who indicated serving a dual role was also lower than expected. Dually certified professionals may simply have chosen not to participate in the study, but it is worth noting that perhaps fewer professionals are serving in a dual role than might be assumed. In fact, dual professional and TVI caseloads were not significantly different. Although there may be various factors beyond the scope of this study (e.g., dual professionals providing either TVI or O&M services to some students on their caseload), the similarity raises questions about whether dual professionals are doing two jobs (providing O&M and TVI services) under the umbrella of one position without a caseload adjustment.
The original survey asked several yes-or-no questions about having at least one direct service student in the following categories: an academic student with low vision, a student with visual impairment and multiple disabilities, and an academic student who is blind. This study used the academic student who is blind question to gauge whether higher caseloads were less likely to include a student who would likely have multiple instructional (core and expanded core curriculum) and material-adaptation needs. Although this question is limited in its interpretation, the pattern of responses to this question did not show that respondents with higher caseloads were less likely to have an academic student who is blind. This finding calls into question the ability of the TVIs with large caseloads to provide appropriate services in core and expanded core curriculum areas to their academic students who are blind.
Limitations
This study provided a snapshot of current caseload sizes, reported by professionals who responded to a survey about their experiences at the onset of the COVID-19 pandemic. Since caseload was not the main focus of the study, additional questions that would help elucidate caseload differences were not asked. Also, this study does not account for how caseload sizes were determined (e.g., caseload determination tools, a set cap by a district, etc.). As mentioned earlier, due to an initial issue with survey design, some professional demographic data was lost. Professionals who were not included in the sample due to this glitch may have possibly changed the outcome of some of the comparisons. Several respondents indicated having no students on their caseloads, which may indicate that some respondents are not currently in the typical role that is assumed when discussing implications of caseload numbers. These data were kept in the analysis, which may mean that averages are actually a bit higher.
Implications for Practitioners
Advocacy for appropriate workloads of professionals in the field of visual impairment continues to be essential. Administrators need to be informed of how the roles of TVIs, O&M specialists, and dually certified professionals are similar, yet different, from other special education teachers and related service providers. Otherwise, administrators may base their decisions about caseloads and resource allocation with limited knowledge. Professionals are highly encouraged to document the amount of time they spend working, especially if they are unable to meet assessed student needs within their current caseloads. For example, if professionals are working beyond typical school hours adapting materials or serving students, it is important for them to relay this information to their administrators. Otherwise, the ability of professionals to adequately serve their students may be diminished, and they may become at risk of choosing to leave the field of visual impairment.
Future Research
Although recommended caseload numbers in the past have ranged from 8 to 12, depending on the criteria and source (Ferrell et al., 2014; Mason et al., 2000), these determinations were not guided by newer workload determination tools that are currently available. A comprehensive national study focused on caseload that links other factors (e.g., travel, referrals, student needs, remote instruction, recommended practices in early intervention) and teacher perceptions of meeting student needs (e.g., academic, expanded core curriculum) would be beneficial to the field of visual impairment. Another study focusing on TVIs, O&M specialists, and dually certified professionals who have caseloads that are balanced and small enough for these professionals to meet their students’ needs would be beneficial. Analyzing how those caseloads were determined and the other factors taken into account could inform the field of visual impairment about how to approach other administrators when caseloads are not appropriate.
Direct Service Caseload Number Clusters Across Roles and Percentage Range of Individuals in those Clusters Who Indicated Serving as Least One Academic Student Who is Blind.
Footnotes
Declaration of Conflicting Interests
The author(s) declared no potential conflicts of interest with respect to the research, authorship, and/or publication of this article.
Funding
The author(s) received no financial support for the research, authorship, and/or publication of this article.