
Abstract
Introduction:
The ability of students to engage with graphical materials supports learning in science, technology, engineering, arts, and mathematics areas. For students with visual impairments, understanding the factors that contribute to the effective interpretation of graphics can promote meaningful access to the curricula.
Methods:
Forty students with visual impairments completed multiple-choice question tasks for five types of graphics presented in their medium of choice and provided difficulty ratings. The teachers of students with visual impairments rated the students on several factors. Statistical analyses investigated the relationship between performance differences and teacher-rated factors.
Results:
Significant differences in performance between print and tactile graphics users were found for bar graph, map, and total correct responses on all tasks. For some tasks, perceived difficulty by tactile graphic users did not align with actual performance. Teachers’ ratings of students who had Individualized Education Program goals for graphics, independence in using graphics, problem-solving ability, mathematics ability, and frequency of engaging with graphics contributed to significant differences in performance across total correct and most individual graphic results.
Discussion:
Although medium type was a significant contributor across graphic types, some teacher-rated variables appeared to mitigate the importance of medium on student performance. Depending on the graphic type, experience, content knowledge, skills with graphics, and confidence and motivation can all affect student performance when interpreting graphics.
Implications for practitioners:
Teachers should provide students with early and frequent opportunities to engage with graphics and support their problem-solving abilities regarding how to engage with different graphic types to enhance their independent use of graphics.
Successful entry into the North American workforce is increasingly reliant on a learner’s applied understanding of science, technology, engineering, arts, and mathematics (STEAM) content (Land, 2013). The central role of visual representations may put students with visual impairments at risk for lower proficiency in STEAM learning outcomes and, later, access to this growing segment of the workforce (Bell & Silverman, 2018; Rau, 2017). Researchers have noted a significant “accessibility gap” between students with visual impairments and their typically sighted peers (Wall Emerson & Anderson, 2018). Digital or hard copy alternate format versions of STEAM-focused content may not be available to students with visual impairments, and when these versions are available, the adaptation and transcription processes may introduce meaningful discrepancies between that version and the original material (Butler et al., 2017; Smith & Smothers, 2012).
In addition to the availability and quality of accessible graphical content, researchers and practitioners have pointed to the importance of ensuring robust student skill sets to access and interpret graphics in both print and tactile media. Zebehazy and Wilton (2014b) surveyed teachers of students with visual impairments in North America (N = 306) on their perceptions and practices around graphics use by students with visual impairments. These teachers noted the importance of direct instruction in graphic interpretation skills for students who were using print or tactile graphics. More recently, Rosenblum et al. (2018) conducted focus groups with teachers; they noted teachers’ emphasis on instructional strategies such as systematically familiarizing the student to the graphic, connecting the graphic to students’ experiences, and teaching skills for independent exploration of graphics. The application of these strategies aligns with profiles of successful print and tactile graphic users developed by Zebehazy and Wilton (2014a). The successful user of print graphics has been exposed to graphics consistently, since early in their education, and is proficient in the use of a variety of low-vision devices to access print graphics. The learner has sufficiently independent use of critical thinking skills to analyze the data in the print graphic. Similarly, the successful user of tactile graphics has good literacy skills in braille as well as spatial cognition abilities that are associated with orientation and mobility skills. The learner has achieved a sufficient level of understanding of the concepts referred to in the graphical materials so that this content is not only accessible but also meaningful. This learner also has sufficiently independent use of skills for problem-solving and critical thinking.
Zebehazy and Wilton (2014c) also surveyed 97 students with visual impairments, 64 students who identified as print graphics users, and 33 students who identified as tactile graphics users. Students indicated their perceptions of the effectiveness of instructional strategies emphasized by teachers. Print graphic users (59%) and tactile graphic users (75%) agreed that it was helpful to have someone preview the graphic with them. However, both groups were less likely to agree that this previewing actually occurs (38% and 56%, respectively). Less than half of both groups agreed that graphics helped understand concepts compared to text-based description alone. Rosenblum and Herzberg (2015) reported that the students they interviewed often lacked access to graphics at the same time as their peers, resulting in compensatory strategies such as requesting a description.
These investigations of students’ perspectives indicate a need to better understand actual performance by students with visual impairments when using graphics and the efficacy of the strategies that they employ, especially given the potential lack of practice opportunities. Based on the findings above, Zebehazy (2014) proposed the model of graphic interpretation (MoGI), which illustrates four domains that contribute to a student’s ability to read and analyze information from graphics (see Figure 1). Although the MoGI has the potential to account for the various factors that impact students’ effective use of graphics, it is currently based on perception data alone.
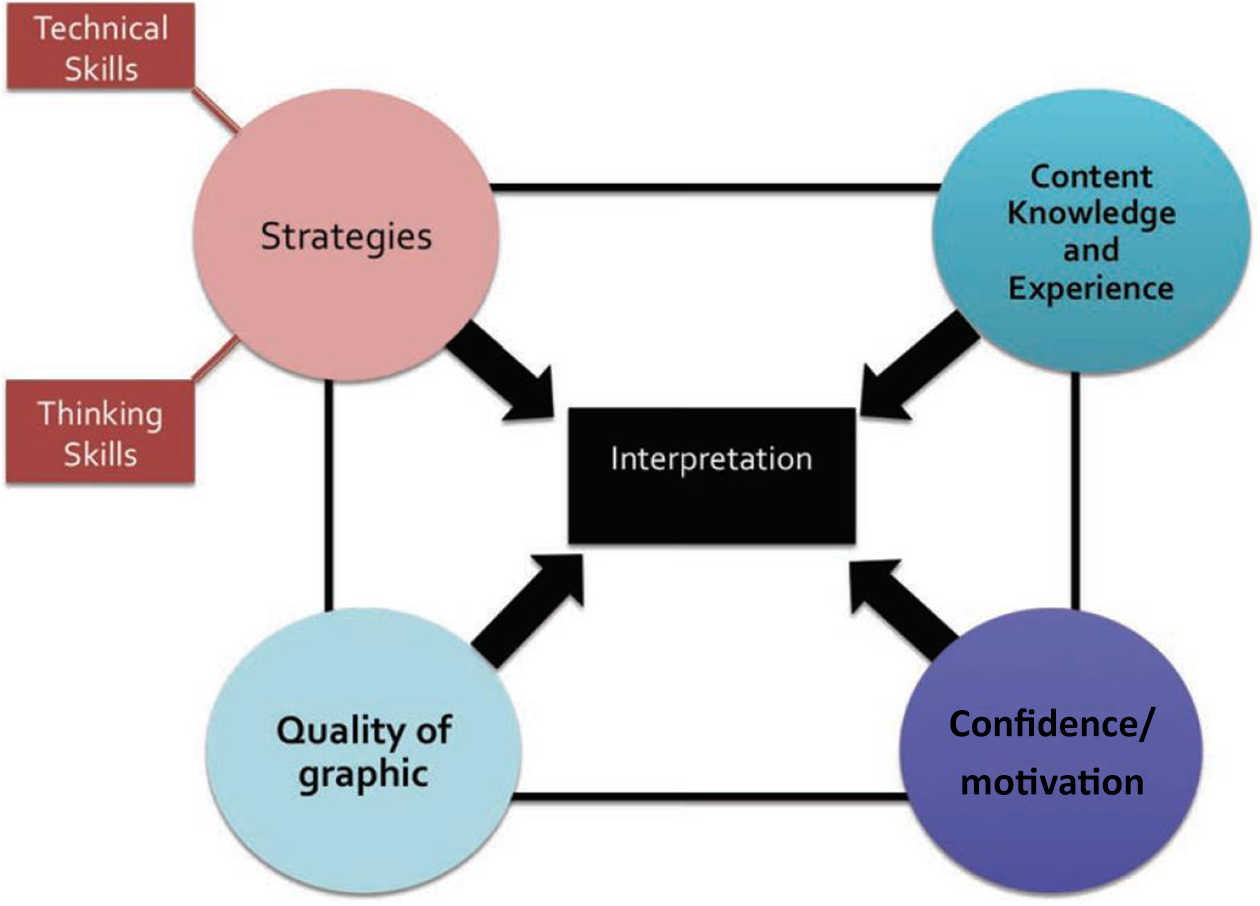
Model of considerations for graphic interpretation. Source: Zebehazy (2014).
The study presented here sought to address the dearth of student performance data by assessing how effectively students with visual impairments complete graphics-based tasks compared to factors that relate to performance on those tasks such as those introduced in Zebehazy and Wilton’s (2014a) profiles. The following research questions were investigated: Do tactile graphic and print graphic readers with visual impairment perform differently? Are there differences in how these users with visual impairments rate the difficulty of different graphic formats? When controlling for graphic medium and task level, what teacher-rated student characteristics are associated with successful student performance in reading and interpreting graphics?
Method
Materials
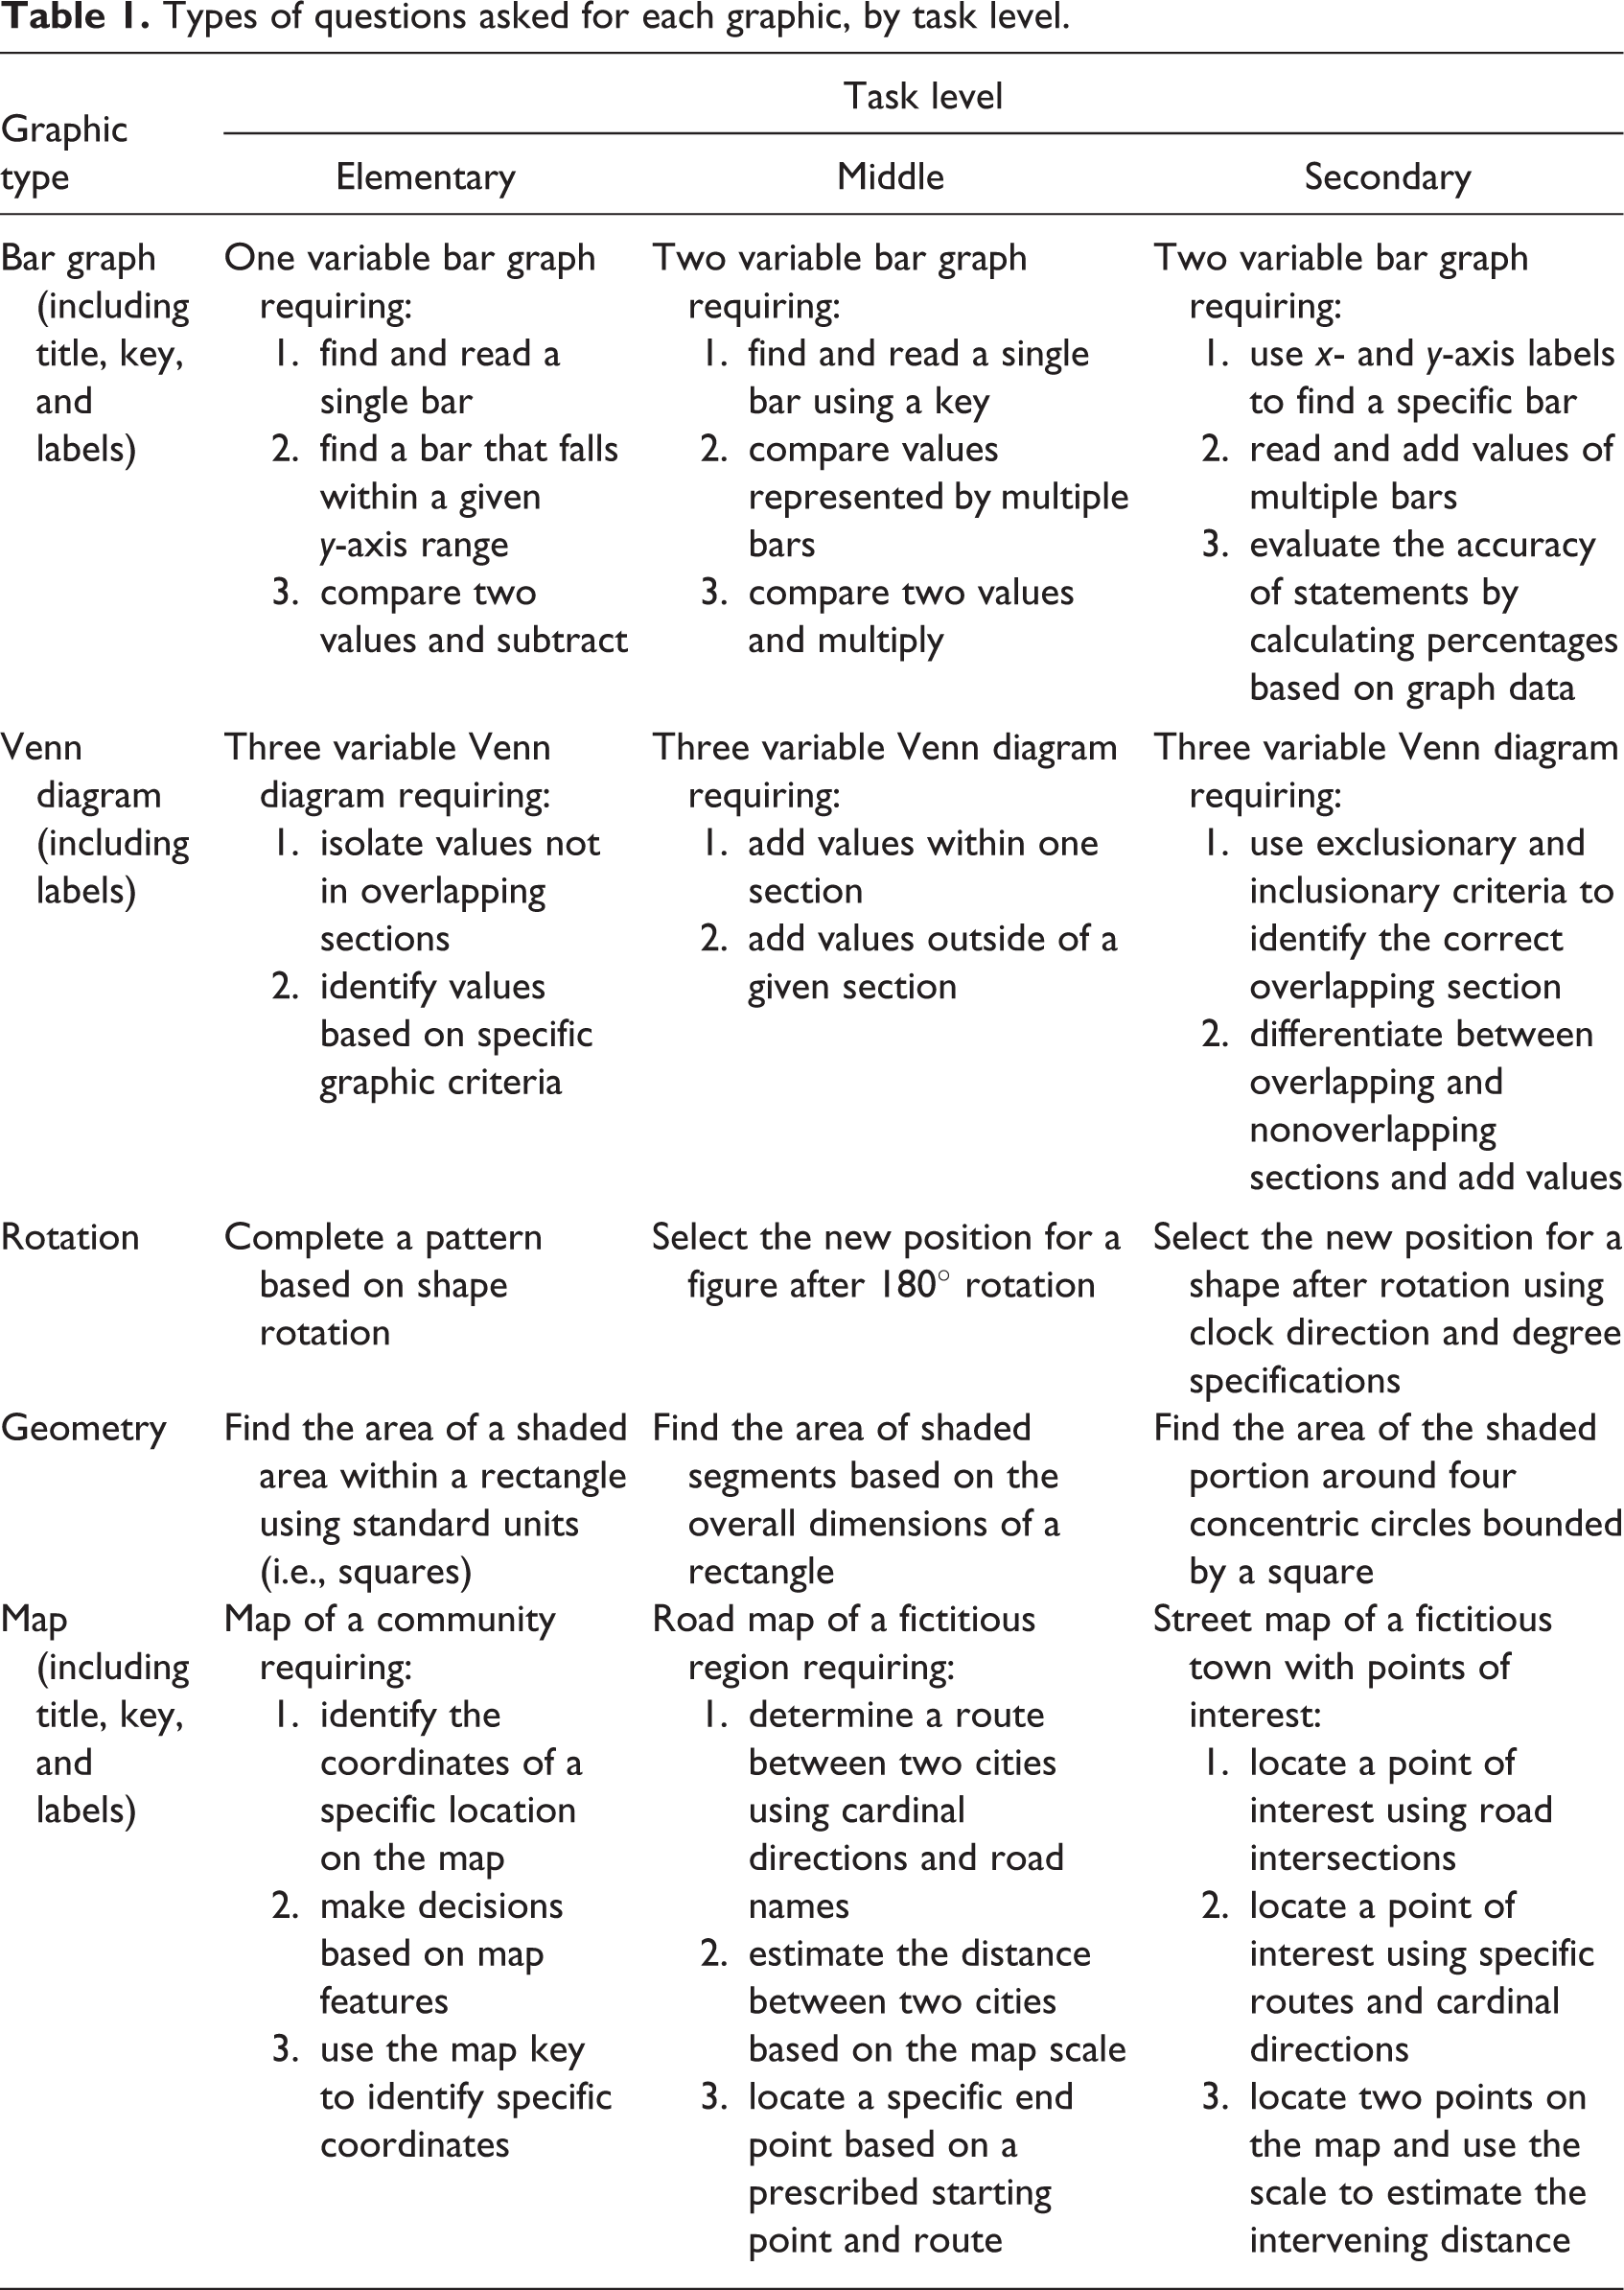
This study was approved by the ethics board for human subjects at The University of British Columbia. Students with visual impairments were asked to complete multiple-choice questions that required them to use graphics (one to three questions per graphic). Five graphics were presented: a bar graph, a Venn diagram, a shape rotation problem, a geometry area problem, and a map. Three task levels of questions and graphics were created to accommodate students across grade levels (elementary, middle school, and high school). In order to represent items often found in standardized assessments, graphics were selected and adapted with permission from Test Ready Plus Mathematics and Test Ready Social Studies Quick Study programs, commonly used test preparation curriculums. The American Printing House for the Blind (APH) created the large print and tactile graphics materials for all grade levels (large print used Verdana 18-point font). APH was used to ensure that high standards for graphic production were upheld (e.g., Braille Authority of North America guidelines) and that the tactile graphics would be produced on durable thermoformed sheets. Materials were produced in Nemeth code within Unified English Braille contexts and contained only numerals. One student had no previous experience with numerals in Nemeth Braille Code for Mathematics and was familiarized at the outset. All three levels had the same graphic types and similar questions; questions were easier or more complex depending on the level (see Table 1).
Types of questions asked for each graphic, by task level.
Procedure
Each participant met the researcher (first author) in a quiet room in their school for the study; these meetings were video recorded using an iPad. Students engaged in a “think-aloud” task while exploring each graphic and answered the associated multiple-choice questions. During a think aloud, students are invited to vocalize their thought processes in real time (Young, 2005). The researcher asked the student to practice the think aloud using a preliminary item (Cartesian grid) and provided feedback as necessary. The researcher only prompted students when they fell silent to remind them to vocalize what they were doing (analysis of the think-aloud data will be the focus of a subsequent article). After the student finished the questions for a graphic, the researcher asked the student to rate the difficulty of the task.
Participants
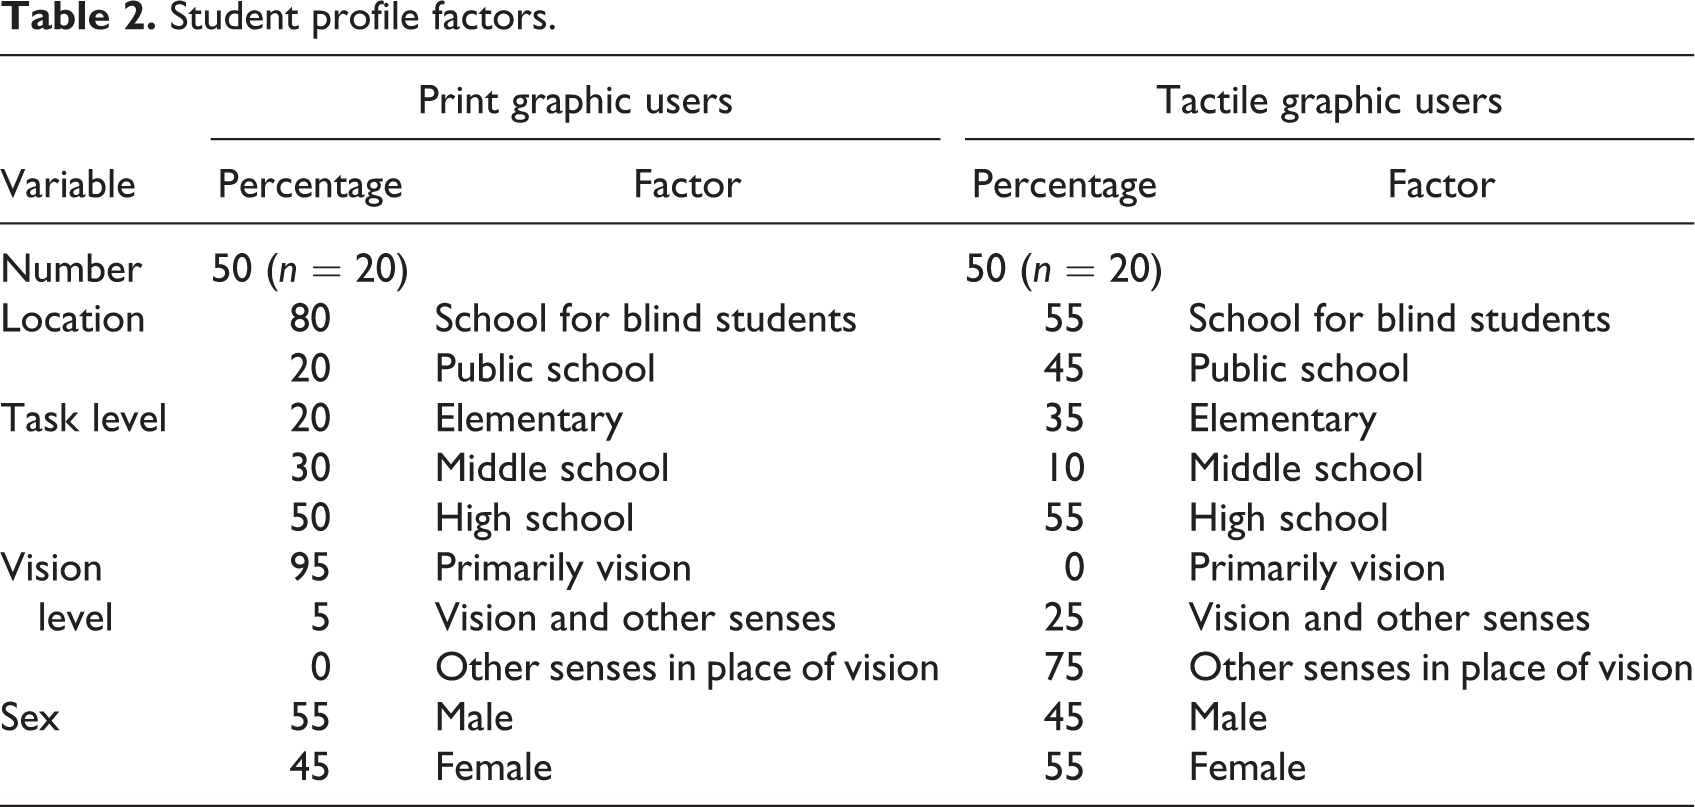
Informed consent and assent was obtained for 40 students with visual impairments (i.e., blindness and low vision), grade level 4–12. A convenience sample of 20 print graphics readers (five standard print, 15 large print) and 20 tactile graphics readers was assembled. Students attended public schools and schools for blind students in Canada (n = 28; three provinces) and the United States (n = 12; three states). Seven students (17.5%) had an additional disability. Table 2 shows the breakdown of study participants by location, task level of study materials used, and functional vision level.
Student profile factors.
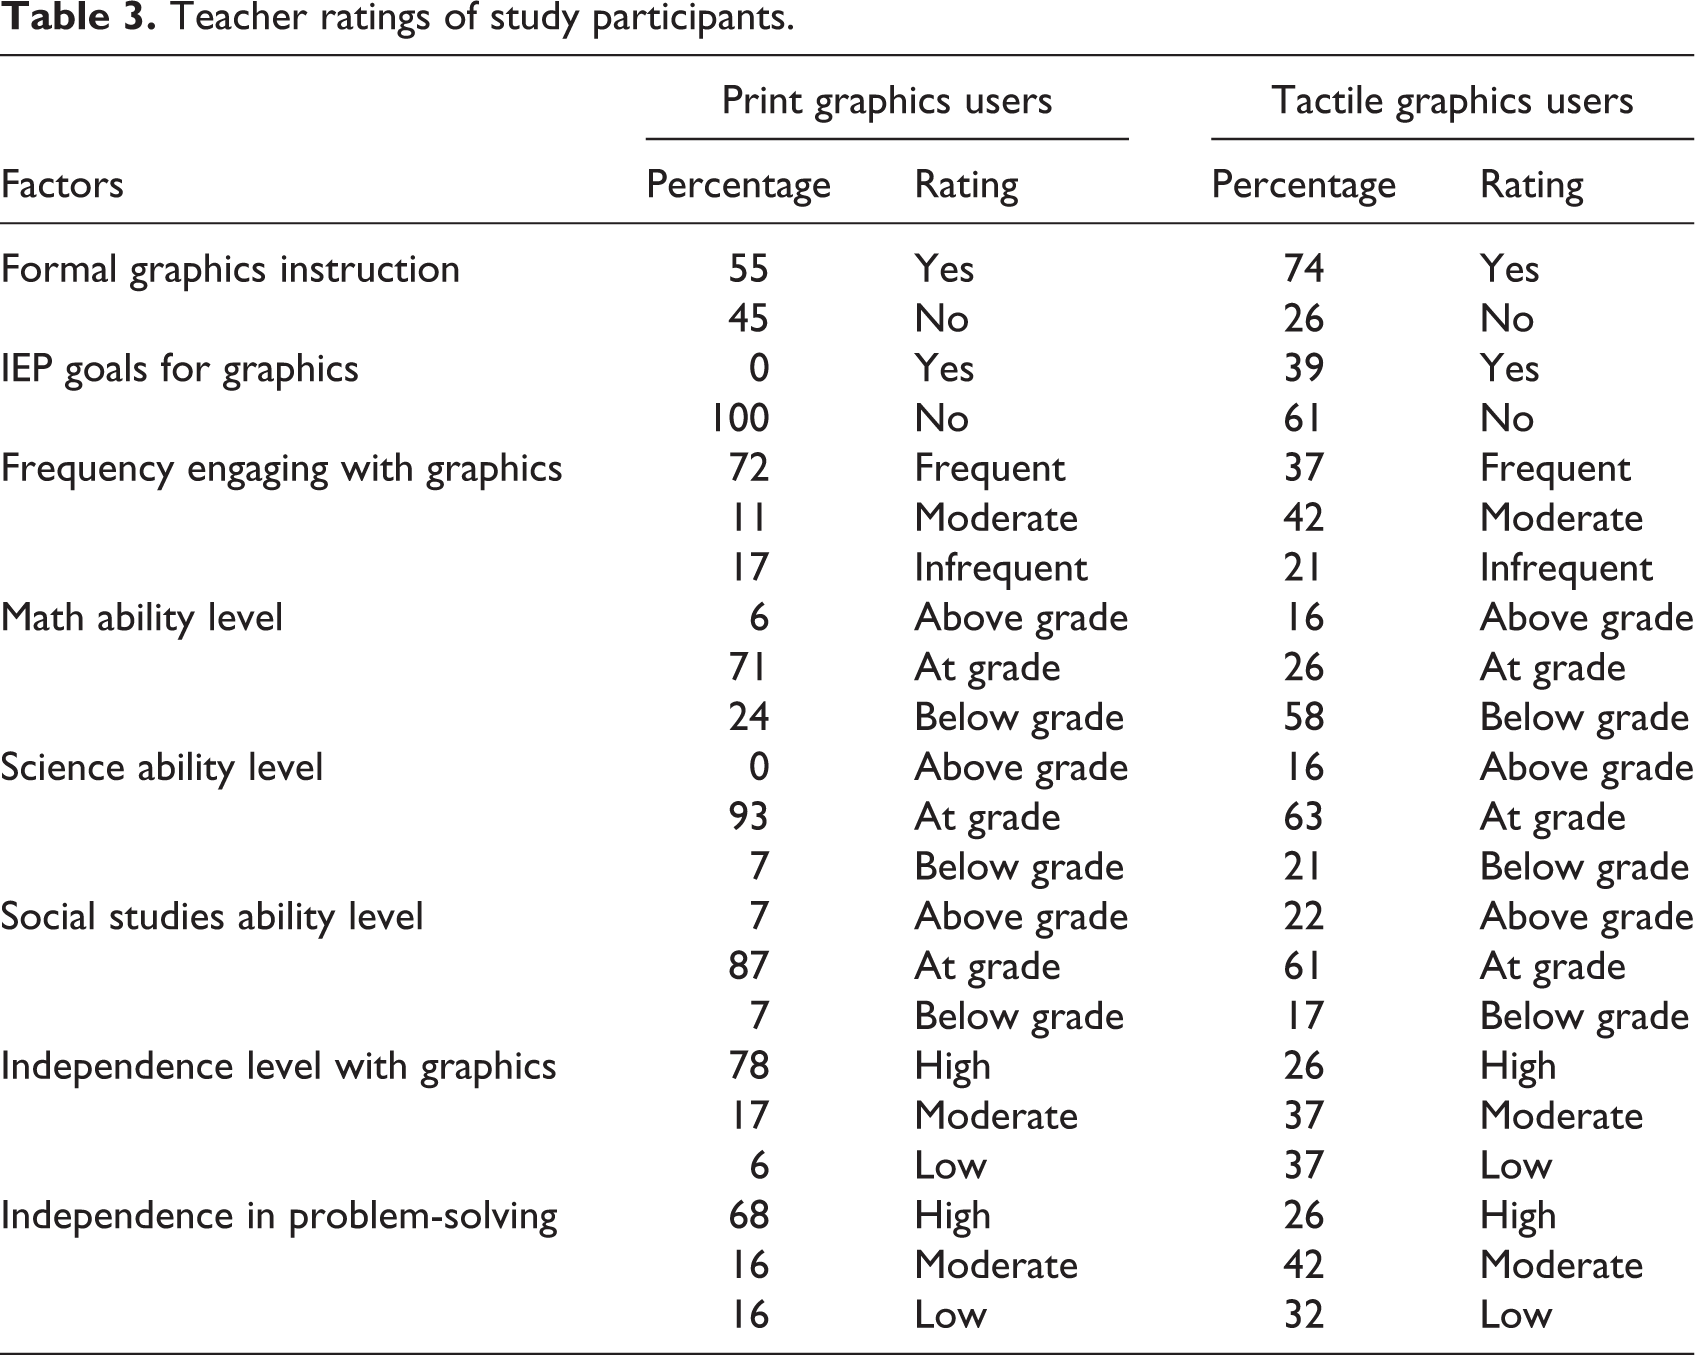
The teachers completed a demographic form for each student, which included information about formal instruction in using and understanding graphics. Individualized Education Program (IEP) goals focused on graphics; ability level in mathematics, science, and social studies (rated as “below,” “at,” or “above grade level”); independence level in reading and interpreting graphics (low, moderate, and high with definitions provided); student’s problem-solving independence level (low, moderate, and high); and frequency of engaging with graphics (infrequent,
Teacher ratings of study participants.
Analysis
Overall performance is reported descriptively for each graphic medium group by the total amount of time and the total number of correct responses for the whole task and by graphic type. Performance level was determined by the number of items correct—low performers achieved a score of 0–4 items correct, and high performers scored between 8 and 10 items correct. Difficulty ratings were obtained by posing the following prompt to participants: “On a scale of 1 to 5, with 1 being very easy and 5 being very hard, how difficult was this task for you?” Difficulty ratings are reported descriptively by graphic format. t-tests were conducted to indicate significant differences in performance and perceived difficulty between medium groups. Correlations (tactile and print graphics combined) between student profiles (e.g., gender, task level) and teacher-rated factors (e.g., graphic independence) were explored to identify student profile information that should be controlled for in regression analyses. Finally, linear regressions were conducted to understand the relative contribution of different teacher ratings to performance. All ordinal variables were converted into indicator (dummy) variables in order to account for them within a linear regression.
Results
Performance
Performance differences existed by medium type for high and low performers. Ten percent of tactile graphic and 30% of print graphic users were high performers based on total score (out of 10), while, 50% and 20%, respectively, fell into the lower performance category. Table 4 shows the percentages of students who answered all questions for a graphic type correctly (e.g., answered three of three questions correctly for bar graph). The amount of time needed to complete all five graphic format tasks also varied by medium type. The total amount of time was calculated by adding the duration of time that the student spent on each individual item (i.e., using the graphic to answer the questions while thinking aloud), excluding time spent responding to the researchers’ debriefing questions. Tactile graphic users, on average, needed 45 minutes (SD = 14.6), with a range of 18–75 minutes. Print graphic users, on average, took 28 minutes (SD = 9.9) to complete the tasks, with a range of 16–49 minutes.
Student performance by graphic format and perception of difficulty.
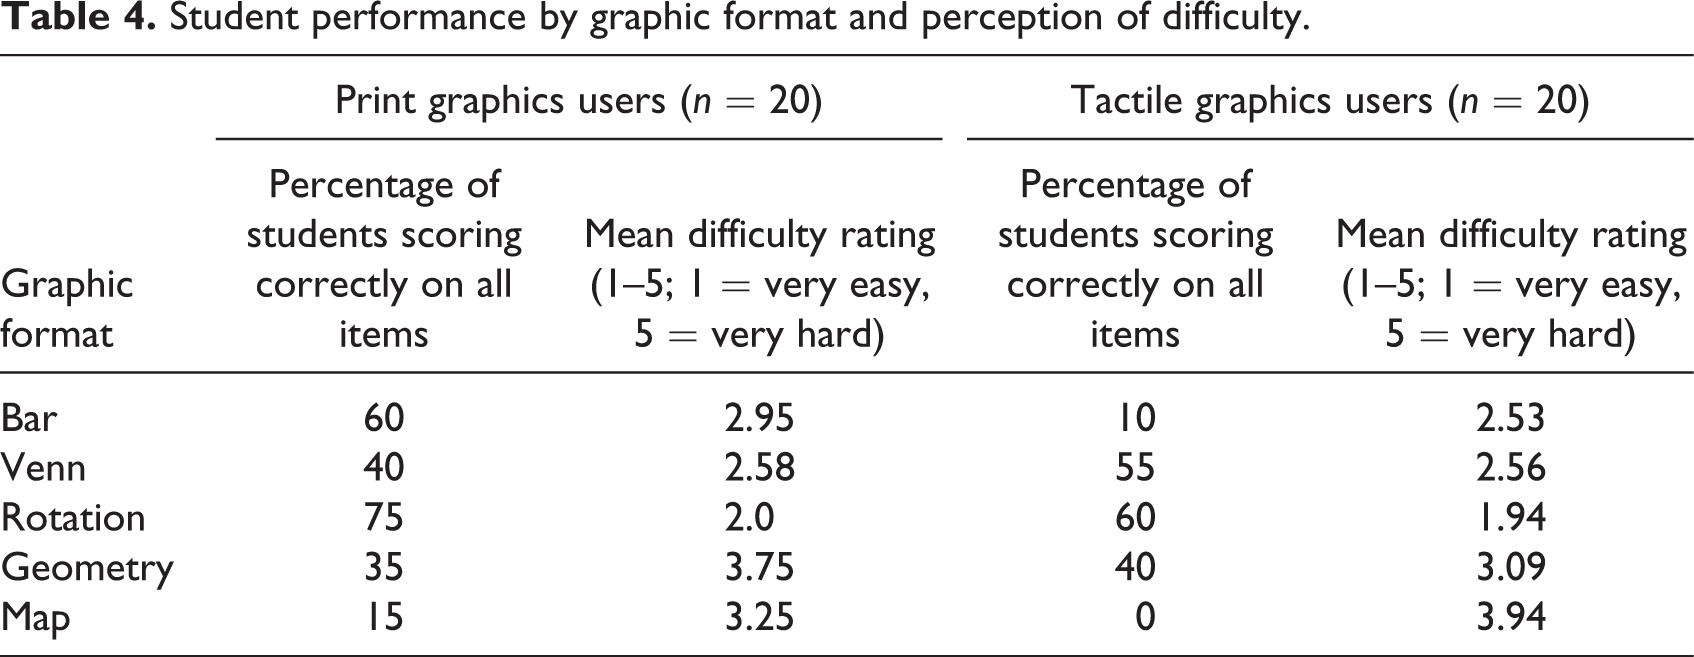
Based on the total number of questions answered correctly, t-tests (Bonferroni adjusted) indicated that print graphic users (M = 2.45, SD = .76) scored significantly better than did tactile graphic users (M = 1.05, SD = 1.05) on the bar graph items: Mean difference (MD) = 1.4 points, p < .001, Cohen’s d = 1.53. Print graphic users (M = 1.55, SD = .89) also scored significantly better than did tactile users (M = .60, SD = .50) on map items (MD = .95, p < .001, Cohen’s d = 1.32). The total number of items answered correctly across all graphic types was also significant, with print graphic users (M = 6.30, SD = 2.15) answering more questions correctly (MD = 2.5 points, p = .004, Cohen’s d = .984) than tactile graphic users (M = 3.80, SD = 2.88). Although mean scores were higher for students who attended public schools (compared to students who attended schools for blind students), these differences were not significant.
Perceived difficulty
Despite the differences in performance between graphics users, the two groups did not vary significantly in how they perceived the difficulty of each graphic format task. Rotation was rated as the easiest (mean print = 2.0, mean tactile = 1.94), followed by the Venn diagram (mean print = 2.58, mean tactile = 2.56) and bar graph (mean print = 2.95, mean tactile = 2.53). The map (mean print = 3.25, mean tactile = 3.94) and the geometry task (mean print = 3.75, mean tactile = 3.09) were perceived as the most difficult of the five tasks.
Correlational data
Spearman’s rho correlations indicated that gender was not significantly correlated with any of the teacher ratings of interest, whereas task level (elementary, middle school, high school) was significantly correlated with receiving formal instruction in graphics (r = 0.600, p < .001), having IEP goals for graphics (r = 0.362, p = .035), science ability rating (r = 0.393, p = .024), and graphic independence (r = 0.411, p = .011). In addition, study medium was significantly correlated with IEP goals for graphics (r = 0.480, p = .004), graphic independence (r = −0.526, p < .001), and problem-solving ability (r = −0.379, p = .019). Vision level (see Table 2) was highly correlated with study medium meaning they were ultimately the same measure (r = 0.935, p < .001). Therefore, study medium and task level were entered into the linear regression models first to control for those two student profile factors.
Linear regressions
Each teacher rating of interest was entered into a separate linear regression model, controlling for study medium and task level, to investigate the amount the addition of that single variable contributed to the performance within the model (R2 change). From a practical sense and given the sample size, simple regression models (addition of one variable to the controls) were explored to identify teacher ratings to which practitioners may want to attend based on their ability to predict performance. Table 5 shows the base models (study medium and task level) for total correct and all graphic types.
Base regression models by graphic type.
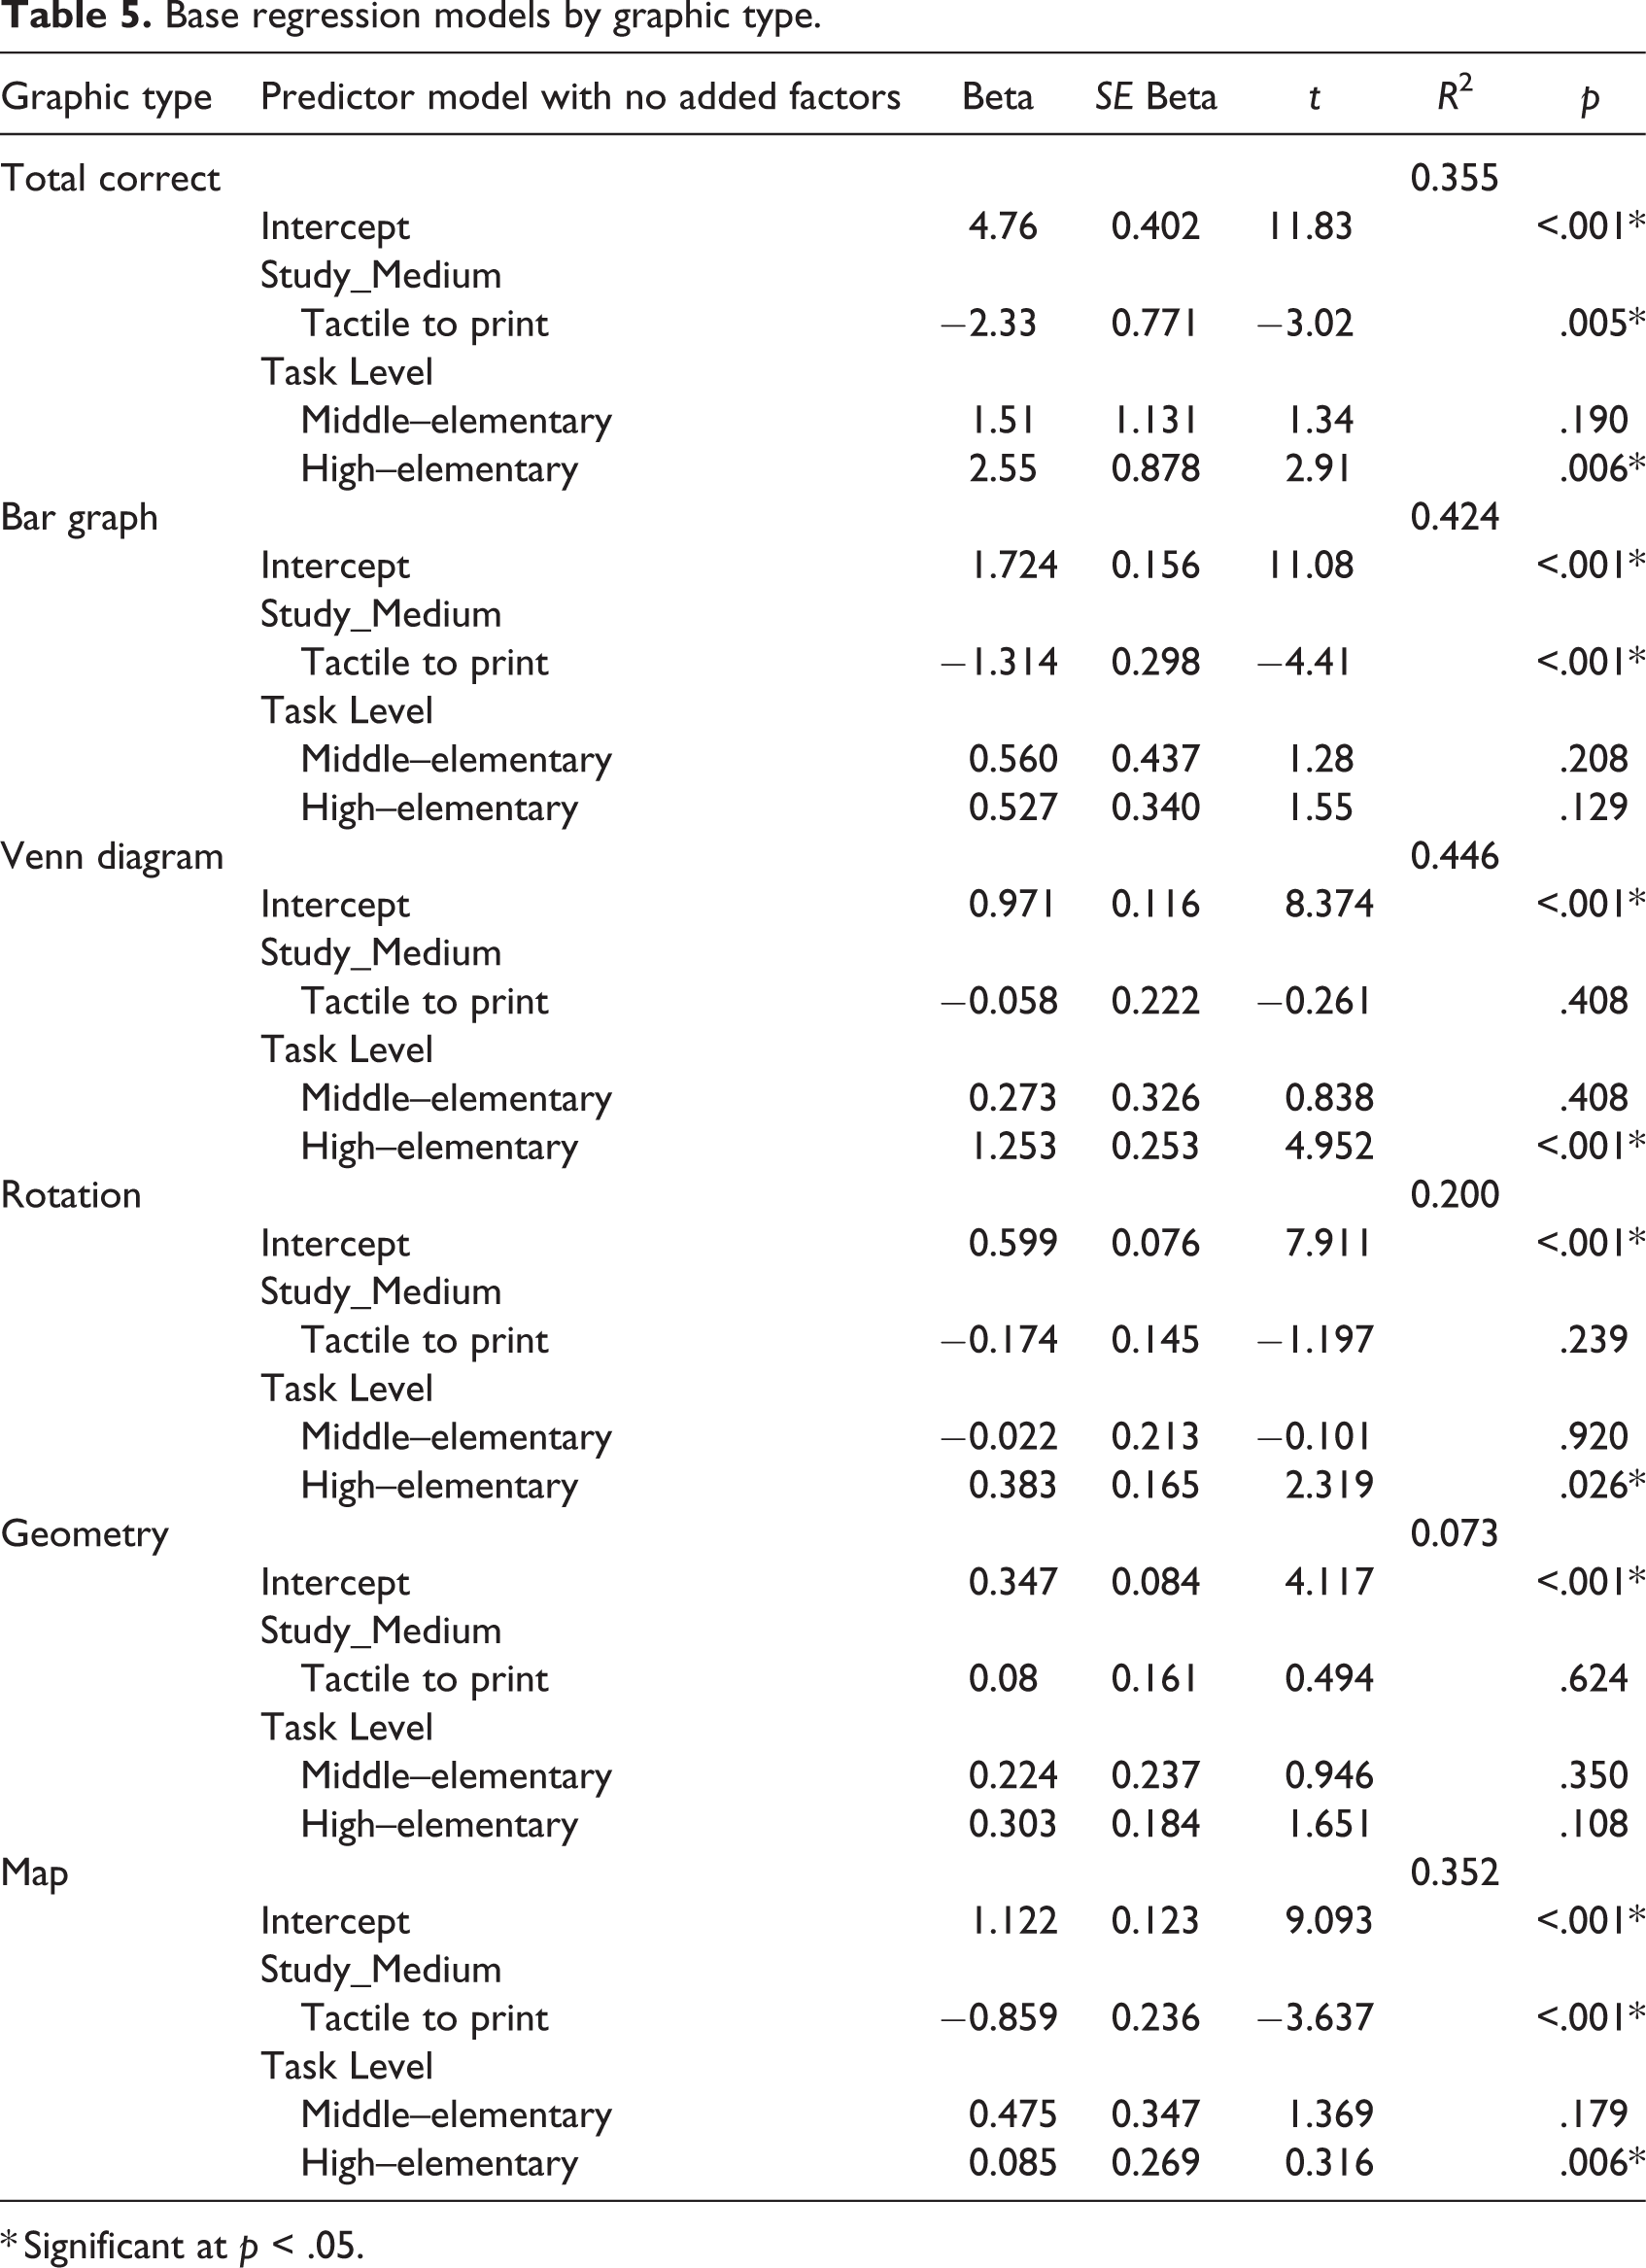
* Significant at p < .05.
Total correct
When total correct was the dependent variable of interest, whether a student had an IEP goal around graphic use (R2 = 0.665, p < .001) was a significant contributor to the base model (p < .001). Ratings of students’ mathematics ability (R2 = 0.571, p < .001) contributed significantly to the base model when comparing above grade level and below grade level (p = .011). Similarly, ratings of science ability (R2 = 0.569, p < .001) contributed to the base model when comparing students above and below grade level (p = .026). Ratings of student independence using graphics (R2 = 0.468, p < .001) contributed significantly when comparing high to low levels of independence (p = .022). Independence in problem-solving (R2 = 0.518, p < .001) was significant when contrasting high to low independence levels (p = .007). Finally, how frequently students engaged with graphics was significant (R2 = 0.481, p < .001) when comparing frequent versus infrequent engagement (p = .017). Task level for high school versus elementary contributed significantly in all models except the model that contained IEP goals around graphic use and independence in graphic use. Study medium was no longer significant in models that contained either ratings of graphics independence, independence in problem-solving, or frequency in engaging with graphics, meaning that there was no advantage to print readers in models containing these variables.
Bar graph
As with total correct, having a goal for graphics in the IEP (R2 = 0.506, p < .001) contributed significantly (p = .001). Student mathematics ability (R2 = 0.562, p < .001) contributed significantly to the base model when comparing above and below grade level ratings (p = .033). Similarly, ratings of science ability (R2 = 0.638, p < .001) contributed to the base model when comparing students above and below grade level (p = .005). Social studies ability also contributed significantly (R2 = 0.673, p < .001) when comparing those rated above and below grade level (p = .023). Finally, frequency of engaging with graphics yielded a significant model (R2 = 0.586, p < .001) when comparing frequent and infrequent engagement (p = .003). Across all models, students engaging with print graphics had a significant advantage to those engaging with tactile graphics.
Venn diagram
When Venn diagram performance was the independent variable of interest, having an IEP goal for graphics (R2 = 0.555, p < .001) was a significant addition to the base model (p = .031). Math ability (R2 = 0.648, p < .001) added significantly to the model when comparing at (p = .039) or above (p = .016) grade level compared to below grade level. Finally, adding problem-solving independence to the model (R2 = 0.506, p < .001) contributed significantly when comparing high to low problem-solving ratings (p = .049). For all contrasts, significant differences existed between the students at high school and elementary task levels.
Rotation
For rotation performance, teacher’s ratings of students’ mathematics ability (R2 = 0.200, p < .001) contributed significantly when comparing being either at (p = .006) or above (p = .021) grade level in mathematics to below grade level. Additionally, the model with graphic independence added (R2 = 0.377, p < .001) was significant when comparing high to low independence ratings (p = .045). Finally, for the model with ratings of problem-solving independence (R2 = 0.446, p < .001), high compared to low ratings contributed significantly (p = .009). Significant performance differences between high school and elementary level students in the base model were only maintained for the model containing ratings of independent use of problem-solving skills.
Geometry
For performance on the geometry item, only problem-solving ability (R2 = 0.356, p < .001) contributed significantly to the base model when comparing high and low ability ratings (p = .032).
Map
For performance on the map graphic type, having an IEP goal for graphics (R2 = 0.524, p < .001) contributed significantly to the model (p = .013). Mathematics ability rating contributed significantly (R2 = 0.493, p < .001) when comparing students at grade level to those below grade level (p = .021). The addition of ratings of student independence when using graphics to the model was significant (R2 = 0.466, p < .001) when comparing highly independent graphic use compared to low independence (p = .017). When adding problem-solving independence ratings to the model (R2 = 0.517, p < .001), high compared to low ability was significant (p = .014). Finally, adding ratings of the frequency with which students engage with graphics (R2 = 0.482, p < .001) was significant when comparing frequent to infrequent engagement (p = .022). The advantage to print users (compared to tactile) remained significant in all models except the model containing ratings for independent use of graphics.
Discussion
Although no single variable was significant across all dependent variables, having an IEP goal around graphics, mathematics ability level, frequency in engaging with graphics, problem-solving ability, and independence level with graphics were a few of the teacher-rated factors that emerged as significant across students’ overall performance and on several individual graphic types.
Medium type played a significant role in some, but not all, of the regression models when the above variables were individually added. This finding indicates that providing frequent, direct instruction in graphics use may mitigate the difference in performance between students accessing print or tactile format graphics. Time to complete the tasks was generally longer for tactile graphic users, which should be a consideration for assessment and instruction. However, there were tactile users who did not have a significantly longer completion time compared to print graphic users, an indication that more than medium alone requires consideration.
An interesting finding in this study was the discrepancy between perceived difficulty by participants and actual performance. Tactile graphic users did not significantly differ in how difficult they perceived the graphic tasks compared to print graphic users; however, performance more closely matched the print users’ perceptions than the tactile users’ perceptions. In particular, this discrepancy was seen with the bar graph where perceived difficulty was low or moderate, but none of the tactile users answered all three questions correctly. Linear regressions of bar graph performance reflect this result—graphic medium remained significant across all regression models. Therefore, graphic medium affected students’ ability to demonstrate that they knew how to negotiate the general graph type. Technical skills and frequency of engaging with bar graphs may have played a role in this finding.
On the map task, the regressions revealed a significant advantage for print graphic users in all models except when considering independence level with graphics. Medium was mitigated when students were highly independent with graphics, as compared to students rated as having low independence. The map task was the most complex in the study, suggesting that students who are rated as being highly independent have learned strategies to engage with and analyze a complex tactile graphic.
For the other graphic types, experience with the content of the actual item played a role. For example, in geometry, neither task level nor medium contributed significantly. Problem-solving independence, however, was significant between those ranked high and low for that variable, indicating that the ability to think through the mathematics problem and having prior experience were associated with performance, not the graphic type itself. Similarly, for the Venn diagram, the study medium is not significant when considering the task level between high school and elementary school. High school students are more likely to have been exposed to Venn diagrams and, as a result, would have had more opportunities to learn how to read and interpret this type of graphic.
In sum, variables contributing to differences in performance for the graphics tasks in this study aligned well with the MoGI (see Figure 1). For example, the mathematics and science ability level would fall under “content knowledge.” The findings for the Venn diagram and the geometry task would also be largely related to content knowledge and experience with that particular type of mathematics task and graphic. Problem-solving ability and independence level with graphics relate to strategy use, and frequency of engaging with graphics would be a catalyst for confidence and motivation.
Implications for practice
The findings presented here highlight the importance of exposing students with visual impairments to graphics early and frequently, providing opportunities for students to learn how to problem-solve, and providing direct instruction on how they need to approach and interpret different graphic types. Quality of the graphic, which was held constant in this study, is an important consideration. Students need the skills to flexibly engage with graphics of variable quality produced using various materials and processes. They need to learn to find common features and be able to problem-solve when using complex graphics. Taken together, in the context of MoGI, these recommendations can promote the development of a robust skill set for the interpretation of tactile and print graphics for students with visual impairments and provide a clear rationale for ensuring data accessibility in graphics content.
Limitations
It is possible that other graphic production methods other than on thermoformed sheets would yield different results in performance for some graphic types. Although the sample size of the study was adequate for the analyses conducted, a larger sample would have allowed for more complex statistical analyses that looked at the combined interaction of different variables in multiple regression models. Results of this study were also subject to the inherent limitations of relying on perception-based ratings rather than direct measurement of independent variables (e.g., students’ mathematics ability).
Future research
The relative contribution of each category in MoGI to performance could help practitioners further target the most important aspects for different graphic types. The results of these analyses may also inform the interpretation of assessment results for situations in which print or tactile graphics are used. Additional analysis of the think-aloud transcripts from this study will target specific strategies and the self-talk used by students who were most successful. In addition, an exploration of the hand movements used by high-performing tactile graphic users will provide additional perspective to effective strategy use. These two analyses will also further delve into the confidence and motivation aspects of the MoGI.
Footnotes
Declaration of Conflicting Interests
The author(s) declared no potential conflicts of interest with respect to the research, authorship, and/or publication of this article.
Funding
The author(s) received no financial support for the research, authorship, and/or publication of this article.