
Abstract
It is considered best practice to conduct a functional analysis and visually inspect data collected to determine the function of problem behavior, which then informs the intervention approaches applied. Visual inspection has been described as a “subjective” process that may be affected by factors unrelated to the data. Structured decision-making guidelines have been established to address some of these shortcomings. The current paper is a follow-up to earlier work describing positive outcomes related to the viability of a decision support system based on structured criteria from Roane et al. Here, we demonstrate important improvements in a computer script’s interpretation of functional analysis data, including improvement in agreement between the updated computer script version and experienced human raters (89%) compared to our original agreement outcomes (81%). This paper further supports the use of decision support systems for functional analysis interpretation.
The field of behavior analysis has primarily used single-case experimental designs (SCED) in which each participant is exposed to all the conditions of an experiment and the participant serves as their own control (Ledford & Gast, 2018; Sidman, 1960). As a phenomenon, behavior exists within an individual and therefore, with a SCED the behavior is assessed across the relevant experimental conditions for each participant (e.g., Johnston & Pennypacker, 2009; Sidman, 1960). The most common approach for analyzing data from SCEDs is visual inspection of the data. Visual is used to determine whether a functional relation exists between behavior and the independent variable of interest (Johnston & Pennypacker, 2009). Broadly, visual inspection includes the development of a graphical display of data and review of that display. The review consists of analyzing the levels, trends, and variability of the data to determine whether a functional relation exists (Ledford & Gast, 2018). With visual inspection, the effect of the independent variable on behavior should be obvious to the “naked eye” (e.g., interocular trauma test; Kazdin, 2011) for a rater to determine that a functional relation exists. It follows, that if an independent variable has an obvious effect on behavior, it may also mean a clinically significant change in behavior has occurred. For these practical and pragmatic reasons, visual inspection has become a favored tool of behavior analysts.
In behavior analysis, best practice in the assessment and treatment of problem behavior recommends that researchers and practitioners conduct a functional analysis (FA; Beavers et al., 2013). Specifically, applying visual inspection to interpret assessment outcomes and using these outcomes to inform treatment strategies has been associated with better outcomes for clients (i.e., reduced problem behavior; Heyvaert et al., 2014). Broadly, an FA is comprised of test and control conditions (see, e.g. Iwata et al., 1982 [1994]). The goal of an FA is to determine the conditions under which behavior is occurring to identify functional variables for that behavior. By identifying the functional variables, a targeted treatment can be developed. The “standard” FA procedure typically apply an “alone/ignore” condition, wherein the participant is in a room alone and there are no consequences applied following problem behavior. This condition assesses whether behavior is not socially mediated. Another common test condition is called “attention,” wherein the client is provided neutral items to engage with if they would like and the therapist/researcher provides brief periods of attention immediately following problem behavior. This condition assesses social positive reinforcement in the form of access to attention as a maintaining variable. The “control” condition typically includes free access to highly preferred items, no demands, and frequent non-contingent attention provided by the therapist/researcher. There are no consequences delivered in response to problem behavior during this condition. Finally, the “demand” condition includes the therapist/researcher providing ongoing instruction to the client and removing the instruction and/or associated materials briefly in response to problem behavior. This condition assesses whether social negative reinforcement in the form of escape from demand is a maintaining variable. Importantly, there are a myriad of FA variations (e.g., latency-based, Kamlowsky et al., 2021; precursor, Fritz et al., 2013). Regardless of the type of FA, these assessments typically enact a multielement design in which conditions rapidly alternate across successive conditions and visual inspection is applied ultimately to identify the function of the problem behavior.
Consistent and accurate FA interpretation is paramount in generating an appropriate and efficacious intervention (Heyvaert et al., 2014). Misinterpreting assessment outcomes can lead to developing and implementing an ineffective intervention, which ultimately can hinder the client’s progress. In the context of problem behavior, ineffective interventions stemming from misinterpreting assessment outcomes, could translate to extended risk of injury to the client, their caregivers, and other community stakeholders who interact with the client regularly (e.g., doctors, respite workers, and nurses). Further, it could mean increased risk of more restrictive interventions (e.g., polypharmacy, restraints, and seclusion) because it appears the problem behavior is “treatment-resistant” (i.e., no observable change in the target behavior despite intervention), even though lack of progress may be the result of misinterpreting assessment outcomes, which led to implementing the wrong intervention.
Visual Inspection Decision Rules
Poor interobserver agreement (IOA) across raters has been an issue that has plagued the credibility of conclusions drawn from visual inspection. Ottenbacher (1990) reported rater historical agreement as low as .38. More recently, Danov and Symons (2008) reported an overall mean rater agreement of .63. Although this may be observed as an improvement over Ottenbacher’s outcomes, it is still unsatisfactory in terms of acceptable IOA (Ledford & Gast, 2018, p. 122). Over the years, researchers have attempted to address low IOA by developing formal decision rules for a variety of SCEDs, such as AB (Jones et al., 1978; Ottenbacher, 1990), ABAB (DeProspero & Cohen, 1979), and multielement designs (Bartlett et al., 2011; Lanovaz et al., 2019). These types of decision rules are designed to lead behavior analysts to complete interpretations of their data (e.g., what is or is not a trend; Ledford & Gast, 2018, pp. 182–194). These systems aim to improve consistency across raters by minimizing bias that may be influencing interpretation. For example, perceived treatment acceptability has been reported to affect visual inspection interpretation (Spirrison & Mauncey, 1994). The way the data are presented (i.e., scaling) has also been reported to affect interpretation and, ultimately rater agreement (Knapp, 1983). Even the data characteristics themselves, such as autocorrelation (i.e., data are connected to the data it preceded) can affect interpretation (Fisch, 2001; Ledford & Gast, 2018).
Specific to the standard FA (i.e., results represented in an multielement design), Hagopian et al. (1997) endeavored to create and validate decisions rules to improve rater agreement across predoctoral interns’ visual inspection of FA data. Roane et al. (2013) revised the Hagopian et al., rules and empirically-validated their revisions to make them more general and cover a wider variety of FA data. Using the Roane et al.s (2013) criteria, a behavior analyst would apply the decision rules to their FA data and end with an interpretation of the data. This is an example of a manually applied system that provides a set of rules to govern the behavior of visual inspection.
Semi-Automating Visual Inspection
Many of these decision rules and support systems, meant to be applied manually, tend to be mathematical in nature (e.g., calculating and plotting the mean rate of response). Thus, it may be an obvious extension to create automated tools to provide these calculations to the behavior analyst. In fact, recent work on developing and evaluating formal decision rules has included creating methods to semi-automate the process of applying decision rules (A. Cox & Friedel, 2022), or examining the viability of supplemental statistical methods (see Hall et al., 2020; Lanovaz et al., 2020; Lanovaz & Hranchuk, 2021). The former aims to support a human rater in interpretation. That is, instead of manually applying decision rule(s) as it relates to the data, a computer applies the decision rule(s) to the data. For example, having a spreadsheet calculate and plot a putative trend line with upper and lower boundaries. Regardless of the approach, these efforts collectively may be working toward promoting standardized interpretation across behavior analysts and, even perhaps improving the process of communicating results to professionals who ascribe to more quantitative data analytic approaches (e.g., doctors; Falligant et al., 2022).
Importantly, harnessing the power that computer programming offers to semi-automate clinical activities (e.g., FA interpretation) does not mean supplanting human clinical expertise. Decision support systems are exactly that, systems developed to support human clinician decision-making. The goal is to capitalize on clinician expertise without replacing it by automating much of the work to save time (Bowen et al., 2018; see Giorgini et al., 2004 for brief introduction of decision-support systems). A human clinician will always be encouraged to reject an automated interpretation if doing so is in the best interest of the client (Behavior Analyst Certification Board, 2020). That is, there may be case specific and additional qualitative variables that a computer did not consider when rendering an output because it was not data supplied the computer.
A. Cox and Friedel (2022) described a computer script that was based on the Roane et al. (2013) criteria to directly interpret FA data. One of the benefits of a script that is based on an existing system (i.e., Roane et al., 2013) is that the script is designed to mimic the steps that a person would take to interpret the data. The procedures that apply statistical techniques (e.g., Hall et al., 2020) to interpret behavioral data may lead to greater reliability than human raters but are using procedures that behavior analysts do not currently use to analyze their data. One of our interests is promoting the uptake of formal decision rules for FA interpretation. By improving implementation ease through automation, and delivering it through a user-friendly interface (i.e., Shiny application); this could facilitate an increased uptake in applying standardized decision rule(s). Increasing consumer uptake of standardized decision rules could translate to improved practitioner efficiency, or even enhanced IOA. The latter could improve the credibility of FA interpretations, garnering buy-in for behavior analysis and SCED from the broader psychological community.
Next Steps in Decision-Support System Development for FA Interpretation
There are several testing phases that need to happen before delivering a useful and reliable product to assist clinicians in FA interpretation. A. Cox and Friedel (2022) described and demonstrated initial steps toward designing and building a decision support system for FA interpretation using previously evaluated structured criteria (i.e., Roane et al., 2013). In this work, we created and tested a computer script that automatically applied the Roane et al. (2013) structured criteria for decision making. The script was developed and tuned to interpret a sample of 42 FA datasets, which included both published and unpublished clinical data. We then tested the accuracy of this script by comparing the script’s interpretation of these 42 datasets to the expert human raters’ interpretation of the same data sets. The script obtained an acceptable level of IOA (i.e., 81%) with human raters, suggesting we achieved our objective of developing a system that could apply the Roane et al. (2013) structured criteria to interpret FA data.
A. Cox and Friedel (2022) identified some concerns with the Roane et al. (2013) decision support system related to instantiating them into an automated system. Specifically, there are decisions that a human rater must make that are potentially subjective. For example, one of the decision rules for assigning automatic reinforcement as the behavior function is: “alone is the highest condition and is significantly higher than toy play” (Roane et al., 2013, p. 145). The term significantly higher does not refer to statistical significance, and so what may fulfill this criterion for one human rater may not for another. Another example of a potential discrepancy with their decision rules is the overall trends rule. This rule states that, “if there is a trend in the toy play condition and most of the other conditions, any condition that is consistently higher than toy play over the course of the assessment meets criterion for differentiation (Roane et al., 2013, p. 145). Importantly, the script relies on a conditional logic system and requires objective expressions of all the Roane et al. decision rules that is present in some of the rules but not others. Human subjectivity and script objectivity may have contributed to interobserver disagreements between the two sources. Relatedly, we also identified several possibilities for modifying existing decision rules. For example, a common problem with Script Version 1 (i.e., the original script, A. Cox & Friedel, 2022) is that it stringently followed the defined criteria, even if a behavior analyst clearly would have ignored the criteria in question. In other words, the script was fully “rule governed” with no possibility of “relevant stimulus control by the data.”
The purpose of the current paper is to describe adjustments and new additions to the original automated system (Script Version 1) and the effects of these script changes (Script Version 2) on reliability (i.e., agreements). In our previous study (A. Cox & Friedel, 2022), we used 42 data sets to develop Script Version 1 and 42 data sets to test the script. In this study, we used all 84 of those initial data sets to refine Script Version 2 and 47 new data sets from published research to test the script.
Method
Data
For this study, the FA data were organized into two groups. The first group of data (84 FA datasets) were used to modify the script (i.e., Script Version 2). As with A. Cox and Friedel (2022), we followed a machine-learning approach to development and testing of Script Version 2. Specifically, 84 data sets are referred to as a training data set because they were used to “train” Script Version 2 (i.e., updates to the script were written only in relation to this training data set). These 84 FA datasets were the same data used in A. Cox and Friedel (2022). Of these 84 datasets, half were obtained from published data and half were from unpublished clinical data. A second array of FA datasets (N = 47) were used for testing purposes. The testing data set was comprised of FA data obtained only from published articles. Data was obtained by extraction from the articles using WebPlot Digitizer (Rohatgi, 2022). Importantly, for the testing dataset, the relevant interpretation for the FA was never used to inform the development of Script Version 2. Thus, the testing data set allowed us to determine the generality of Script Version 2 by having it interpret “novel” FA data, and reporting agreement coefficients. The data, and all of the R scripts can be found at https://osf.io/z95fk/.
Procedures
Development of Script Version 2
Script Version 1 was developed based on this implicit flow of the Roane et al. (2013) structured criteria. Figure 1 and Table 1 are companions that provide the flow of the Roane et al. (2013) decision rules. Figure 1 displays two flow charts for the interpretation of an FA. The top half of the figure relates to determining whether a specific condition is differentiated from the control condition. The bottom half of the figure relates to determining the overall interpretation of the FA data (e.g., single function, multiple control, automatic reinforcement). Table 1 describes the analysis that needs to be completed within each step of the flow chart. That is, the table provides the full description of the rules that are being applied to the FA data in each cell of Figure 1. The figure and table in this paper have been expanded from A. Cox and Friedel (2022) and use the same numbers from that paper. It will be described in greater depth below, but three additional rules that did not exist in A. Cox and Friedel (2022) are included in the figure and table as items −1, −2, and 7.5.
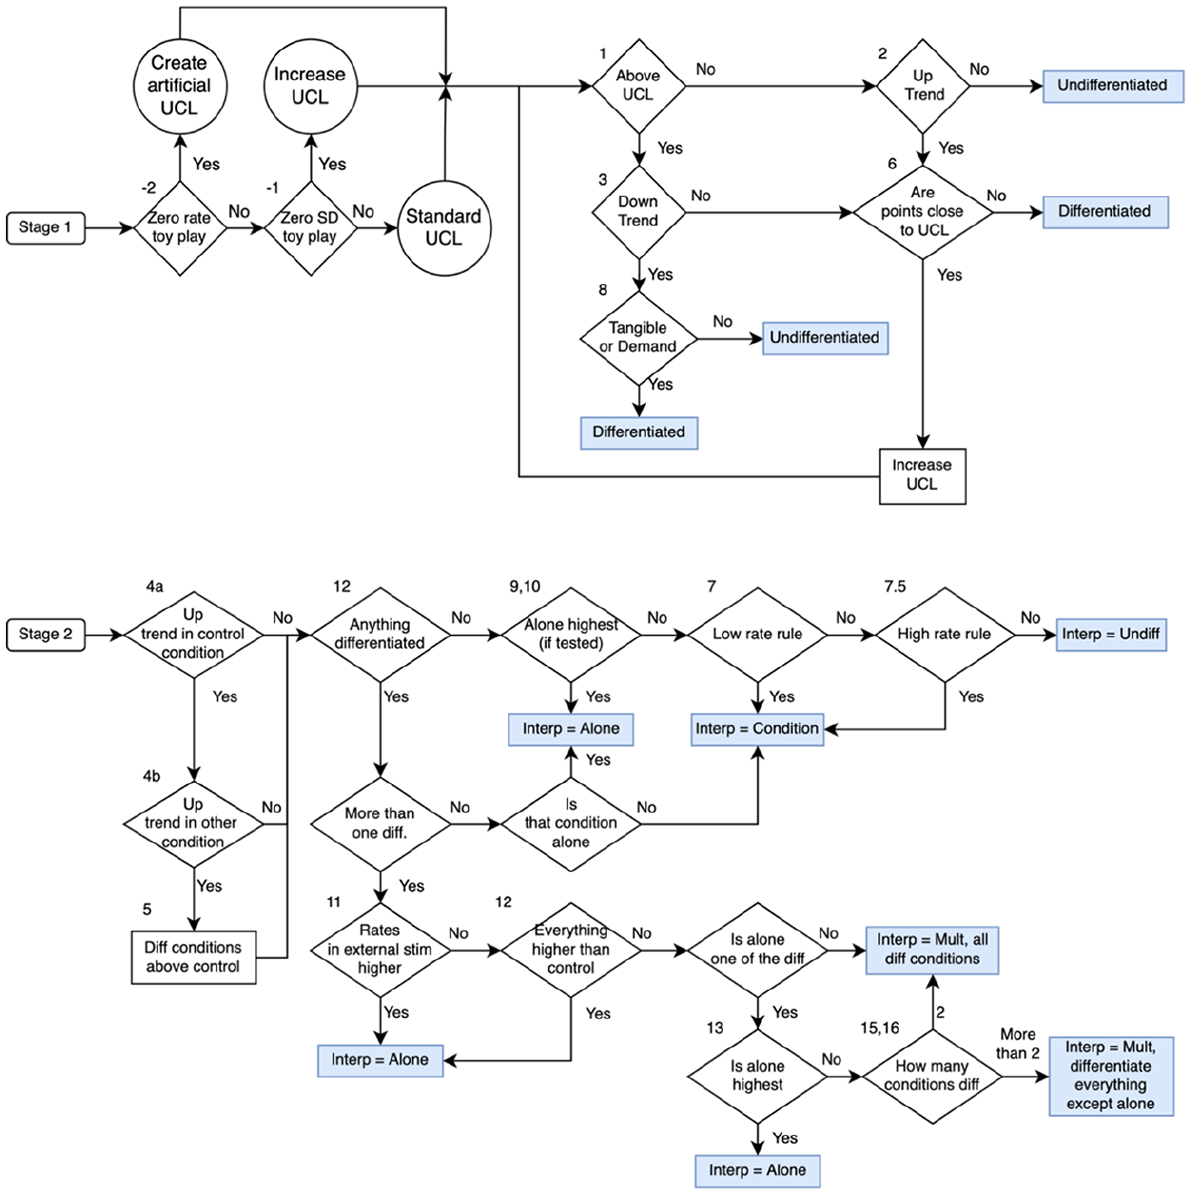
Flow chart of Roane et al. (2013) structured criteria used by Script Version 2.
Visual-Inspection Decision Tree Companion.
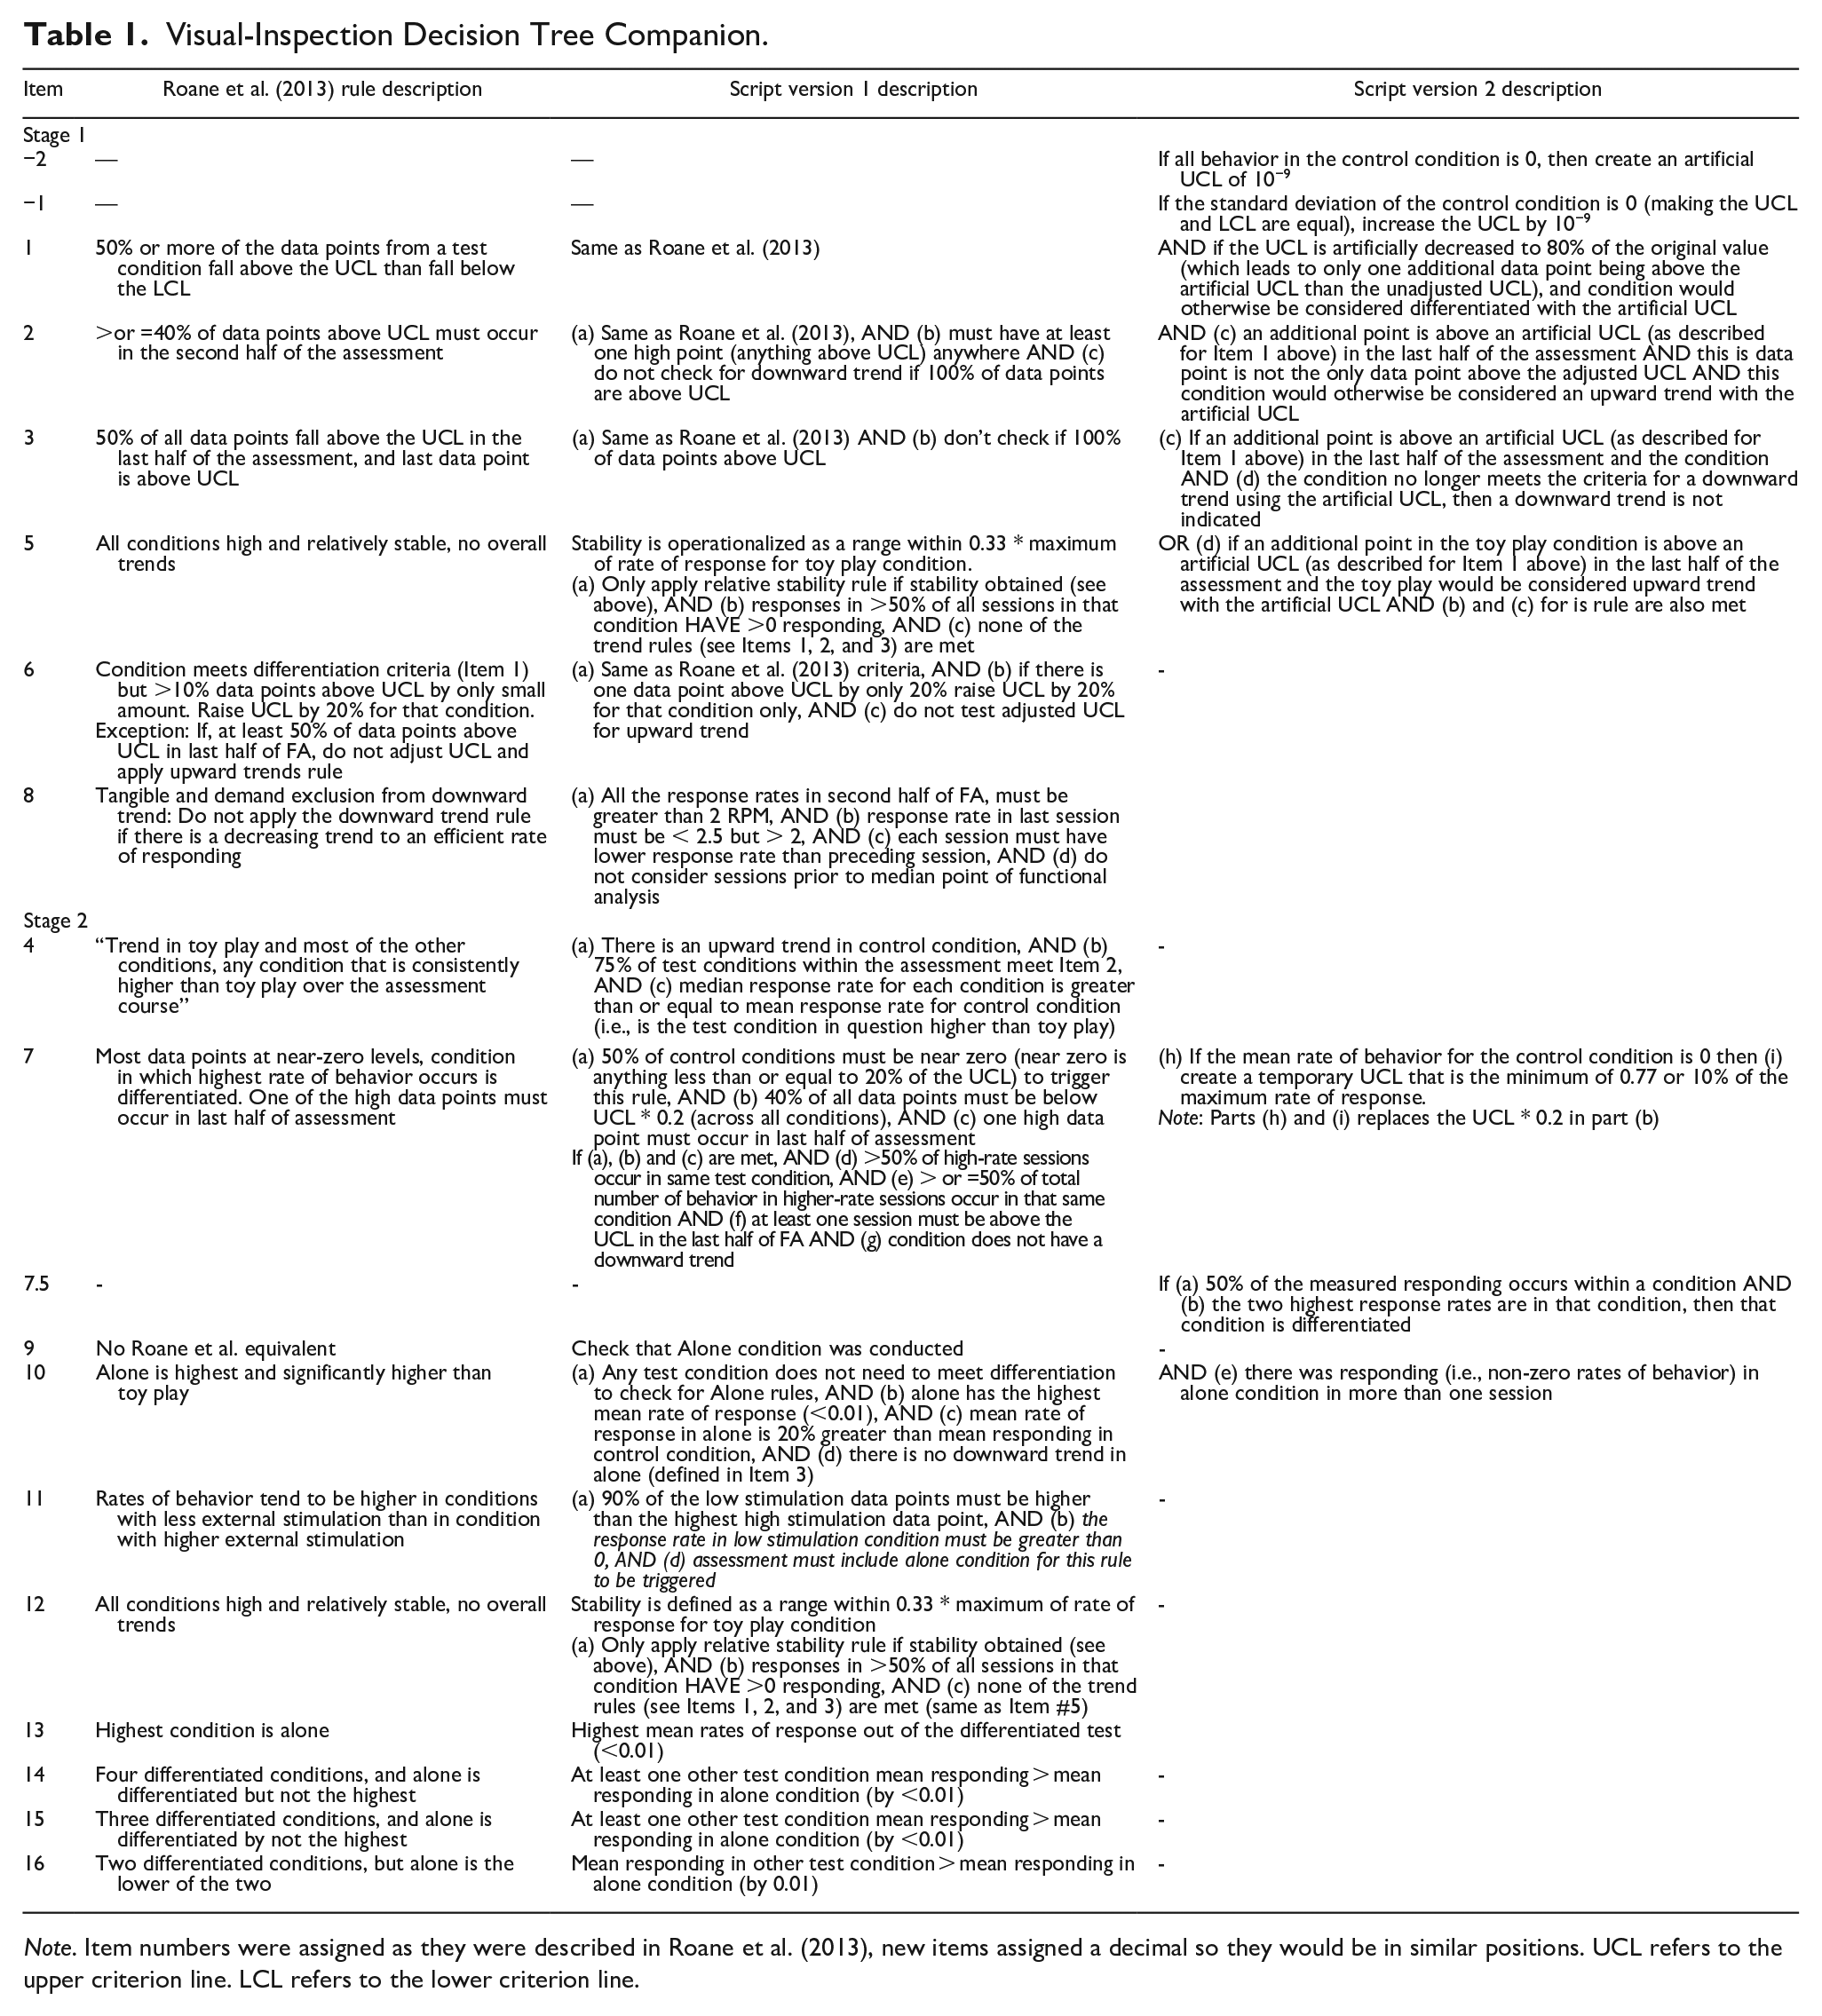
Note. Item numbers were assigned as they were described in Roane et al. (2013), new items assigned a decimal so they would be in similar positions. UCL refers to the upper criterion line. LCL refers to the lower criterion line.
As described in Cox and Friedel, the script evaluates the decision rules across all conditions in the FA simultaneously. That is, the script always evaluates every cell of the flow chart but only provides a full interpretation following the script. For example, the script will always check if there is an upward trend in behavior and a downward trend in behavior for a specific condition even though those two states are mutually exclusive. The major changes to the Script Version 2 (and the implied changes on the Roane et al. (2013) criteria) were grouped into two main categories: (1) rule refinements (i.e., relaxing some of the rules so that some rules were more likely to trigger, and other rules were less likely to trigger); and (2) new rules (i.e., addressing certain relatively uncommon FA conditions that Script Version 1 did not account for, but a human rater could account for).
Rule Refinements
A. Cox and Friedel (2022) highlighted some areas where Script Version 1 did not align with the expert human raters’ interpretations because the script will always slavishly apply the Roane et al. (2013) decision criteria as they are coded. Figure 2 displays data from an FA in which there was a disagreement between the script and the human based on how strictly the decision rules were applied to the data. It should be clear to even a relatively inexperienced behavior analyst that tangible might be a function for this behavior. According to a strict interpretation of the Roane et al. (2013) rules, the behavior in the tangible condition was not differentiated. In the tangible condition, there is a session in the second half of the assessment with the behavior below the upper criterion line to such a small degree it cannot be displayed at the current scale of the y-axis on the plot. That one data point was enough for the tangible condition to fail to meet the criteria for being differentiated because it meets the criteria for a downward trend. It seems reasonable that a human rater would deviate from the Roane et al. decision rules in this case. To resolve these sorts of problems, we made a series of changes to the script that relaxed the Roane et al. decision rules. The goal was not to fundamentally alter the Roane et al. decision rules, rather provide Version 2 of the script with some “wiggle room” to ignore a data point that is close to one of the criterion lines.
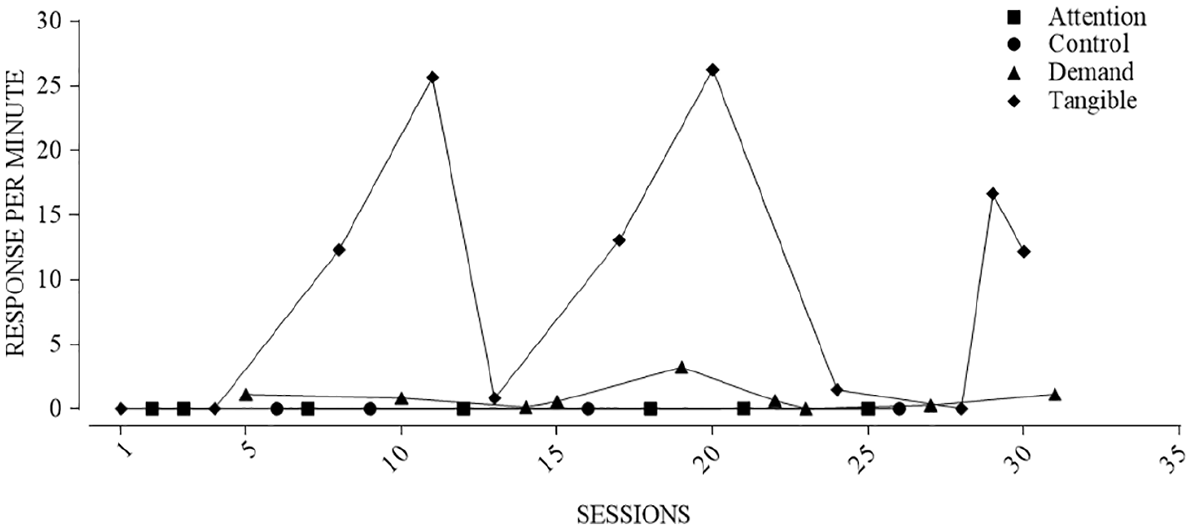
Functional analysis in which there was a disagreement between the script and human rater.
The first adjustment instructed the script to relax the criteria for a condition to be considered differentiated (see Table 1, Item 1). That is, the original rule requires that a certain percentage of the data points be counted as above the upper criterion line for a condition to be differentiated from the toy play condition. We relaxed these decision rules by allowing a single “freebie” data point to be counted as above the upper criterion line, as long as that data point was “close” to the line. Formally, if the upper criterion line was artificially reduced to 80% of the original value, and this adjusted upper criterion line now included only one additional data point that was “above” the reduced criterion line, then we considered this condition to be differentiated. For example, if with the original criterion line 3 of 7 data points were above the line then that condition would not be differentiated. If by applying the artificially reduced upper criterion line produced 4 of 7 data points above the reduced criterion line, then Script Version 2 would consider that as differentiated. If more than one extra data point is above the reduced criterion line then Script Version 2 would not consider the condition differentiated. For example, if the artificially reduced upper criterion line led to 5 of 7 data points above the artificial line, then Script Version 2 would not consider that as differentiated. In addition, a data point can only be considered a “freebie” if it falls above the lower criterion line. That is, to be a “freebie” the data point should be low but not too low. Although the full description of the rule is complex, in essence if only one data point is “slightly” below the upper criterion line and that is the one data point that is keeping the condition from being differentiated, then Script Version 2 will consider the condition differentiated.
The second adjustment pertains to the rule for upward trends (see Table 1, Item 2). The relaxation of the upward trend rule for identifying a potential reinforcer is similar to the rule for determining if behavior is sufficiently high across all sessions to be considered differentiated. The core requirement of the original upward trend rule is that 50% of the data points in the last half of the assessment fall above the upper criterion line (Roane et al., 2013, p. 145). We relaxed the rule by allowing one additional data point to count toward fulfilling the upward trend criterion if it was above an artificial upper criterion line that was 80% of the original value. As in our first adjustment, only one data point was allowed to trigger this rule. To account for assessments that may be relatively short, if the “freebie” data point was the only data point above the upper criterion line, then Script Version 2 would not count that as an upward trend.
The third adjustment pertains to the downward trend rule. In contrast to the previous two adjustments, this rule was relaxed to make the rule less likely to trigger (see Table 1, Item 3). The goal of this adjustment was to reduce the likelihood of ignoring a condition (i.e., it being undifferentiated) that potentially requires further investigation (i.e., reducing false negatives). In the case of our adjusted downward trend, if a single “freebie” data point is slightly lower than the upper criterion line would not trigger the downward trend rule. That is, the upper criterion is reduced to 80% of its original value. If, after employing the adjusted upper criterion line, only one additional data point now counts as being above the upper criterion line, and this is sufficient for the downward trend rule not to trigger, then Script Version 2 will interpret the condition as differentiated according to the adjusted downward trend rule. Importantly, the freebie will not trigger if the data point of interest was zero.
The final rule relating to relaxing trend rules is for “overall trends.” In general, the rule is designed to help interpret FA data when there is a general, overall pattern of responding in test conditions compared to the control condition (Roane et al., 2013, p. 145). Script Version 1 checked if there was an upward trend in the toy play condition and, if there was a trend, compared the median rates of response for all other conditions compared to the control condition. Test conditions with a median rate that were higher than the control condition were considered differentiated. We modified the rule from Script Version 1 so that it was more consistent with the other trend rule modifications for Script Version 2. Specifically, Script Version 2 allows for only one “freebie” data point to be above the adjusted upper criterion line (see Table 1, Item 4). If this condition is met, then the script will determine that there is an overall trend in the control condition. If there is an upward trend after allowing the one “freebie” data point, then Script Version 2 still compared the median rates of response across conditions. Therefore, the modification of the overall trend rule was only related to the criteria to determine if there was a trend in the control condition. This change in the overall trend rule for Script Version 2 makes it slightly more likely that script will rely on the overall trend rule to provide a final interpretation.
Other refinements were not related to “freebie” data points. Roane et al. (2013) included a rule for interpreting FAs when the low-magnitude rule was designed to aid in the interpretation of FAs, wherein a behavior is reliably above the upper criterion line but only by a marginal amount (Roane et al., 2013, pp. 145–146). In essence, the original low-magnitude rule requires temporarily increasing the upper criterion line and reassessing if the condition would still be differentiated based on the temporary upper criterion line. The Roane et al. (2013) decision criterion prescribes, and Script Version 1 uses, a temporary upper criterion line that is 20% higher than the original upper criterion line. This rule does not function when there is no behavior occurring in the control condition because you cannot have a multiplicative increase in a mean rate of zero (e.g., 0 responses × 1.2 = 0). In Script Version 2, we added an additional clause to enhance the functionality of the rule so that it would be more likely to trigger (Table 1, Item 7). This was done so that we could account for cases when the rate of behavior in the toy play condition was zero across all sessions. The additional clause is used to create a temporary upper criterion line when there is no behavior in the toy play condition, thus allowing the low magnitude rule still be available for use in the overall interpretation.
For the calculation of an adjusted upper criterion line for the low magnitude rule, Script Version 2 calculates two possible temporary upper criterion lines and then uses the minimum of those two values. The first possible temporary upper criterion line is 10% of the maximum rate of response across all test and control conditions and sessions. For example, if the maximum response rate recorded for an assessment was 20 responses per min, then the possible temporary upper criterion line would be 2 responses per min. The second possible temporary upper criterion line was set to 0.77 responses per min. This value was selected because it was the mean of all possible temporary upper criterion lines informed by the training data set for Script Version 2. In other words, for every FA in the training data set we calculated a temporary upper criterion line and then obtained the mean of those temporary upper criterion lines from the training data set. We decided to have Script Version 2 use the minimum value to be more conservative because our goal was to allow the rule to trigger in situations where it had previously not triggered while also retaining the original intent of the low magnitude rule.
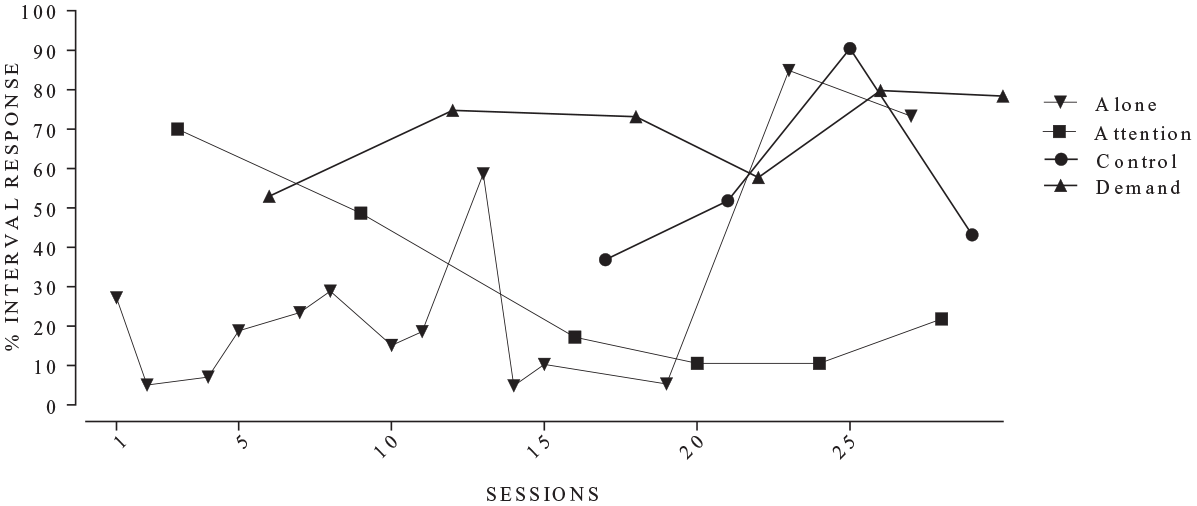
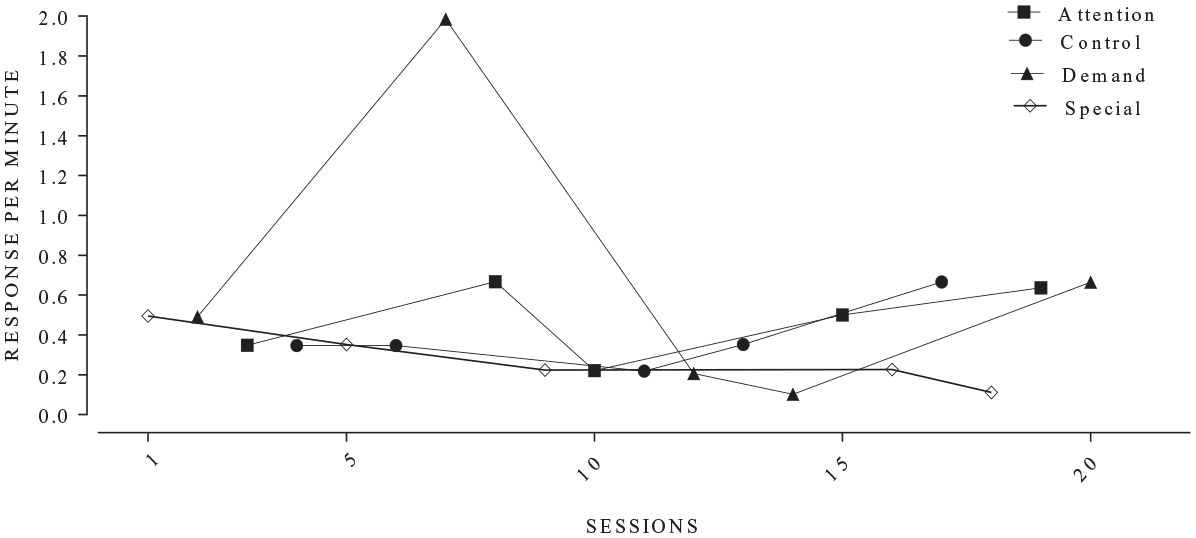
Another rule we modified addressed limitations introduced by a decision rule that is used to interpret FA data as automatic reinforcement (Table 1, Item 10). Specifically, this rule states that if the alone condition has the highest average rate of response in the FA, then behavior function may be interpreted as automatic (Roane et al., 2013, p. 145). In Script Version 2, we modified this rule so that it was less likely to occur. In the training data set we encountered a situation where the alone condition was the highest mean responding, but there was only responding in a single session and that session just happened to coincide with a higher responding compared to all the other conditions combined (see Figure 3). Thus, average responding exceeded the other test condition – even though, responding occurred consistently (but at a lower rate) across sessions. It seems likely and reasonable that a behavior analyst would discount an errant data point that is so far out of the norm compared to the rest of the data. In Version 2 of the script, an FA could only be interpreted as automatic reinforcement using this rule if the alone condition had the highest responding and there was responding in more than one session. The rule change is not designed to alter the existing rule, but rather make it less likely to trigger in case a “fluke” session has a very high rate of behavior.
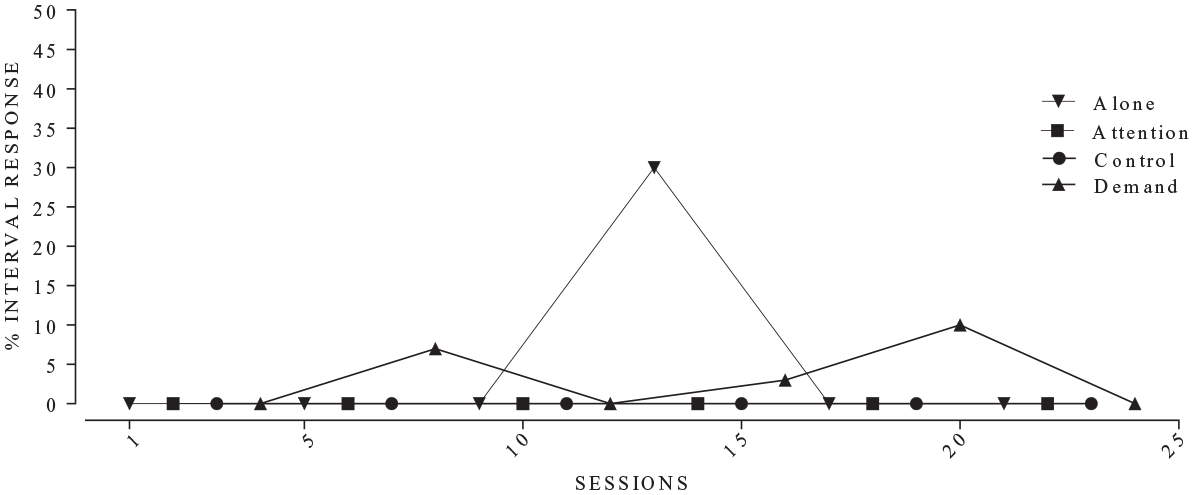
Functional analysis example in which alone condition had higher responding.
New Rules
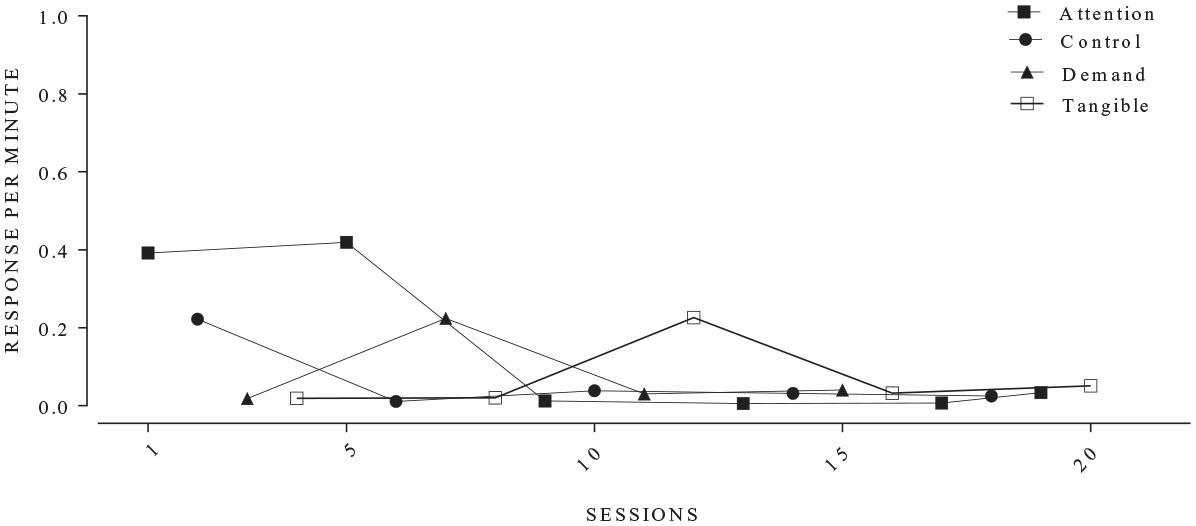
As mentioned above, we created several new decision rules in Script Version 2 to account for uncommon data patterns not covered by the Roane et al. (2013) decision criteria. The first new rule for Script Version 2 accounts for conditions in FA where the resulting data is occurring at a relatively high rate with a high degree of variability (Table 1, Item 7.5). In other words, FA data featuring conditions that depict a high degree of variability as well as behavior that is consistently below the criterion line, but also above the criterion degree by a large margin (see Figure 4). It is reasonable that conditions with a high degree of variability should not meet the criteria for differentiation because too few of the data points are above the upper criterion line. However, an experienced human rater of a FA might take a closer look when a condition is highly variable, and the rate of behavior is also noticeably high relative to the other conditions in the FA. In Script Version 2, a condition is considered differentiated if 50% or more of the total responding in the FA occurs in one condition and the two highest points in the FA occur in that same condition. This rule for differentiation will trigger even if the condition would otherwise not meet other criteria for differentiation (e.g., upward trend).
Example functional analysis with an inflated control condition.
Script Version 2 also included two additional rules regarding calculation of the upper criterion when there is no behavior in the control condition (Table 1, Items −1 and −2). Many of the Roane et al. (2013) decision rules relate to determining if data points are greater than or equal to an upper criterion line or less than or equal to a lower criterion line. The upper and lower criterion lines are defined as the mean plus/minus (respectively) the standard deviation of the response rate in the control condition. As we realized with the adjustment to the low magnitude rule, described above, if there is no variability in the control condition, then the upper criterion line and the lower criterion line will equal zero. Any data point that is equal to no variability control condition will be classified as both above the upper criterion line and below the lower criterion line because each data point is evaluated with a greater/less than or equal to sign. The Roane et al. decision criteria do not explicitly state how to handle the criterion lines if they are equal, and no such rule was included in Script Version 1. We assumed that when there is no variability in the toy play condition that a human rater would treat data points that are equal to the toy play values as below the UCL (see Table 1, Item −1). Therefore, our change forces data points at the equal criterion lines to be counted as below the lower criterion line.
In Figure 1 and Table 1, Items −2 and −1 indicate the steps for adjusting the upper and lower criterion lines. When there is no variability in the control condition, we artificially increase the upper criterion line by an arbitrarily small amount of 10−9. Increasing the upper criterion line by a miniscule amount has two benefits as a solution to this problem. First, a data point that is equal to the values in the control condition will now be below the artificial upper criterion line. Second, it is unlikely that a behavior analysts will have sufficient data precision to measure differences in rate of response of 10−9 and increasing the upper criterion line (by any amount) does not require adjusting any of the other rules that use the upper criterion line to evaluate data. Rule-2 activates if all of the data points in the toy play condition equal zero. Rule-1 activates if all of the data points in the toy play condition are equal to each other and not equal to zero. 1 For clarity, we have written this process out as two separate rules. These rules were assigned negative values because the creation of the artificial criterion line happens outside of the normal loop to differentiate single conditions of the FA because the upper criterion is set once, before any other decisions are made. In addition, by giving the items negative numbers the item numbers between Script Versions 1 and 2 of the script can be consistent.
Obtaining Experienced-Human Interpretations
Two experienced raters individually applied Roane et al. (2013) structured criteria to generate the human raters’ interpretation of each graph that would be compared to other outcomes (e.g., script outcomes, published authors interpretations). The experienced raters were the current paper’s second and third author with 10 and 5 years of experience conducting and visually inspecting FA outcomes, respectively. At the time of the study, the second author had been practicing at the postdoctoral level for 7 years, was a Board Certified Behavior Analyst at the doctoral level (BCBA-D), and had previously published work that incorporated Roane et al. (2013) criteria into its study’s methodology (see A. Cox & Friedel, 2022; A. D. Cox & Virues-Ortega, 2016). The third author was a PhD candidate. She had several years practicing as a master’s level Board Certified Behavior Analyst supporting children and adults with intellectual and developmental disabilities who engaged in problem behavior. For clarity, we will use “human raters’ interpretation” to refer to the visual analysis of the included FA data by the experienced raters using the Roane et al. (2013) structured criteria.
There were 13 possible interpretation outcomes for an FA data set (12 from Roane et al., 2013, plus 1 “special” condition). These outcomes included: social positive (access to attention); social positive (access to tangible); social negative (escape from demand); automatic; maintained by attention and escape; maintained by attention and tangible reinforcement; maintained by tangible and escape; maintained by automatic and escape; maintained by automatic and attention; maintained by automatic and tangible; maintained by attention, tangible and escape; undifferentiated; and maintained by “special” condition. The special condition was included to account for occasional uncommon idiosyncratic conditions that were included in the FA assessments in the published papers. For example, one paper included separate conditions for potentially functionally different tangible stimuli (see for example, Healey et al., 2001). The “special” condition was subject to the same Roane et al. rules.
Percentage agreement across the two raters was 79%. Most disagreements resulted from “subjective” criteria in the Roane et al. (2013) structured criteria (i.e., “any condition that is consistently higher than toy play over the course of the assessment”; p. 145), and all were settled via consensus for 100% agreement on FA interpretation. For the visual analysis, all figures were plotted in separate figures using the same functions in R (Version 4.2.1) and had similar stylings across the plots (e.g., the same symbols for each condition, the same font size). Each plot included upper and lower criterion lines, and figures were presented in a way that could not be linked back to the original published article without a side-by-side comparison of the figures.
Results
To conduct an evaluation of our work to date, we examined and report percentage agreement across several comparisons. For the current training set (N = 84; i.e., data set from A. Cox & Friedel, 2022), we report agreements between three FA rating sources. The rating sources are: (1) human rater interpretations generated by visually inspecting the data by applying Roane et al. (2013) criteria, (2) interpretations generated by Script Version 1, and (3) interpretations generated by Script Version 2. For the testing data set (N = 47), we report agreements between the three rating sources listed above and included interpretations from the authors of the studies that included the FA data (i.e., the published interpretation). The Script Version 1 and 2 produce two sources of information from each FA data set: whether an individual function should be considered differentiated (Table 1, Stage 1) and what the overall interpretation of the data is (i.e., undifferentiated, automatic, etc.; Table 1, Stage 2). For greater clarity and more thorough analysis we will discuss each of these outputs separately.
Overall Interpretation Analysis
Table 2 summarizes agreement across each rater source comparison (e.g., Human Raters vs. Published Interpretation, Human Raters vs. Script Version 1) for each overall FA interpretation, as well as the breakdown of agreement across specific function interpretation outcomes (e.g., undifferentiated, automatic, access to attention). For the training data set, the agreement between the Human Raters and Version 2 of the script was 77.4%, which was worse than the agreement between Script Version 1 and Script Version 2 (86.9%). Regarding the breakdown of agreement across possible FA outcomes, readers may look to the fourth row of the table. Here, Script Version 2 interpreted 6 data sets as being attention-maintained behavior, with 15 data sets interpreted as escape from demand, 10 data sets interpreted as access to tangible, etc. The percentages in the respective cells are the percent agreement between the two rater sources (i.e., Script Version 2 versus Script Version 1). This analysis was not reported in A. Cox and Friedel (2022) and offers a novel addition.
Full Interpretation Agreement.
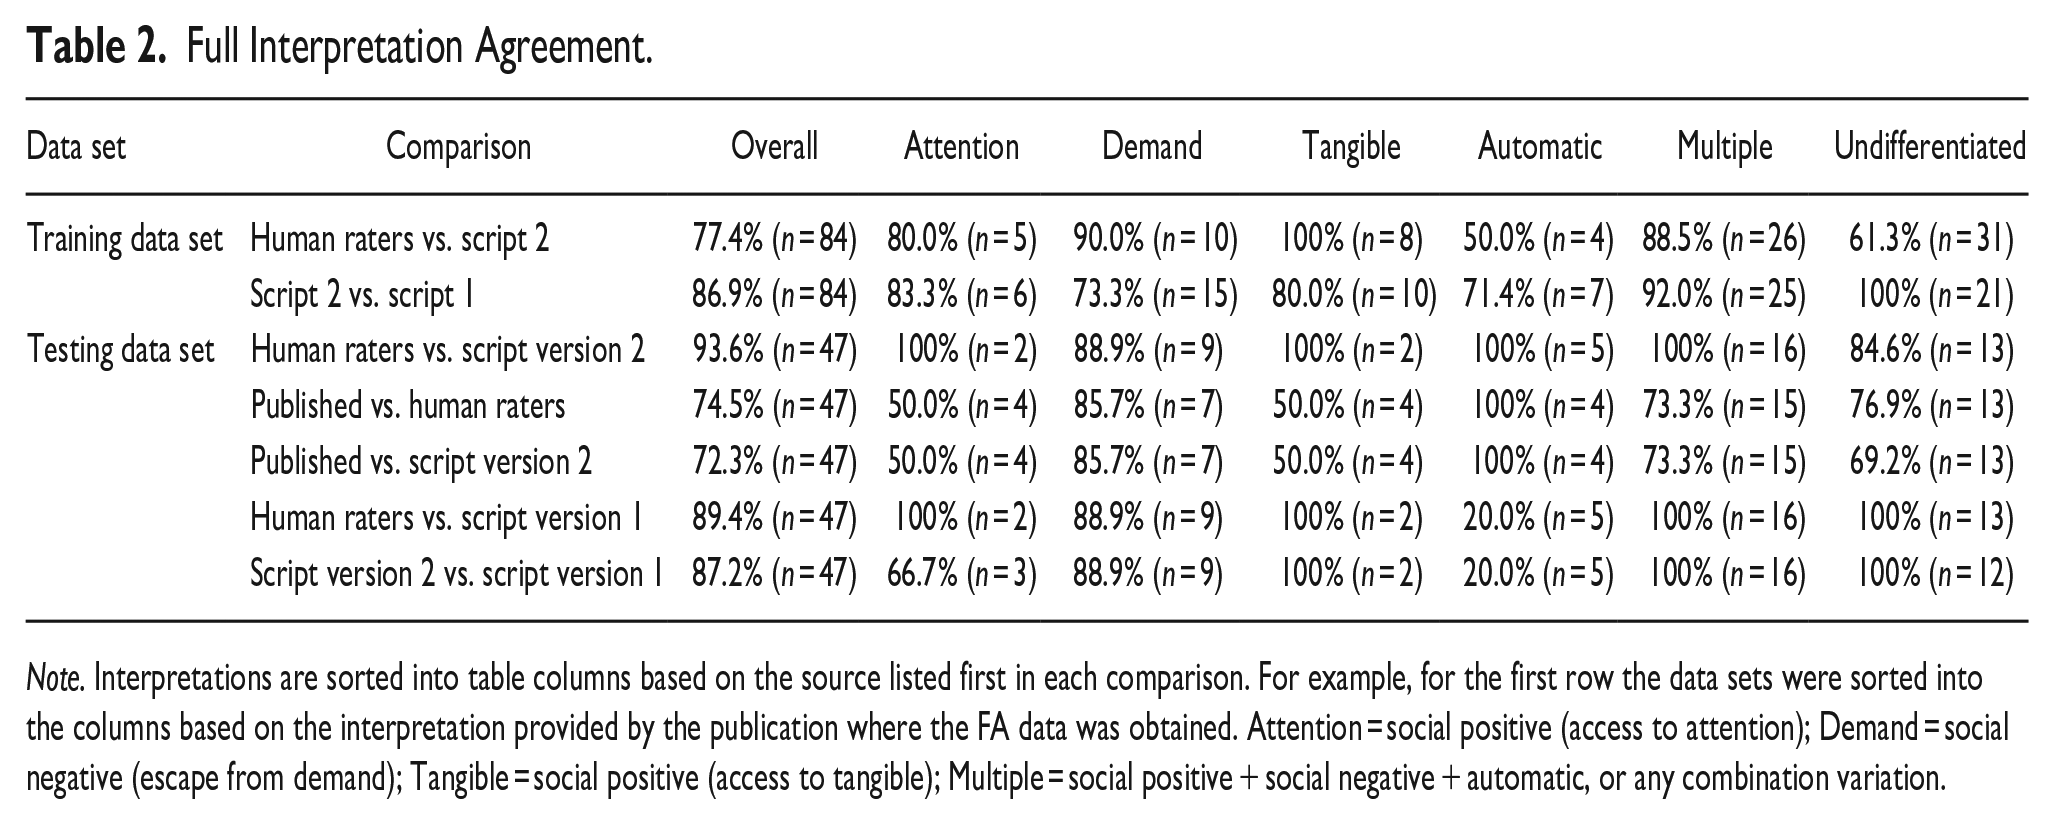
Note. Interpretations are sorted into table columns based on the source listed first in each comparison. For example, for the first row the data sets were sorted into the columns based on the interpretation provided by the publication where the FA data was obtained. Attention = social positive (access to attention); Demand = social negative (escape from demand); Tangible = social positive (access to tangible); Multiple = social positive + social negative + automatic, or any combination variation.
Importantly, for the training data set there does not appear to be a systematic bias in the interpretations. That is, we did not observe high agreement rates for most interpretations that coincided with one or two specific function interpretations showcasing an extremely low agreement rate. The lowest agreement rate in the training data set was for automatic reinforcement between the Human Raters vs. Script Version 2. However, the Human Raters only identified four FA data sets as being automatic reinforcement so this could reflect a false positive error due to small sample size in that cell.
For the testing data set, the agreements ranged from a low of 72.3% for the Published Interpretation vs. Script Version 2 to a high of 93.6% for the Human Raters vs. Script Version 2. For the agreement rates between the specific function interpretations, again a specific pattern does not appear have emerged. In general, the lower agreement rates seem to be associated with interpretations for attention, tangible, and automatic. The lowest agreement was recorded under the automatic function (20%) between the Human Raters and Script Version 1. Interestingly, whatever problems in Script Version 1 that lead to the disagreements was eliminated in Script Version 2, as evidenced by a 100% agreement on this item. Considering the low values in some of the cells for the testing data set, it is possible that there are systematic problems with the Roane et al. (2013) rules and the Script for interpreting those conditions. Although, it seems more likely that there are simply very few FAs in the respective cells which may again lead to false positives.
Individual Function Analysis
Table 3 provides whether rater sources agreed the behavior was differentiated in each individual function (e.g., access to attention, escape from demands) within each data set. It should be noted that because each FA included different functions, the total n is not a multiple of the total number of FAs. The overall agreement rate of individual function for the training data set were high, and there did not appear to be systematic disagreements across the individual functions within each data set. For the testing data set, the agreement rates were generally lower when the Published Interpretation was one of the rater sources. Within those conditions, there does not appear to be a systematic bias (although, conditions that evaluate for automatic reinforcement had relatively high rates of agreement). For the remaining comparisons that focused on Script Versions 1 and Script Version 2, and the Human Raters, both the overall total and individual function agreements were relatively high. In summation, there does not seem to be any systematic bias across any of the FA rater sources in whether a specific function was identified as differentiated.
Individual Function Agreement.
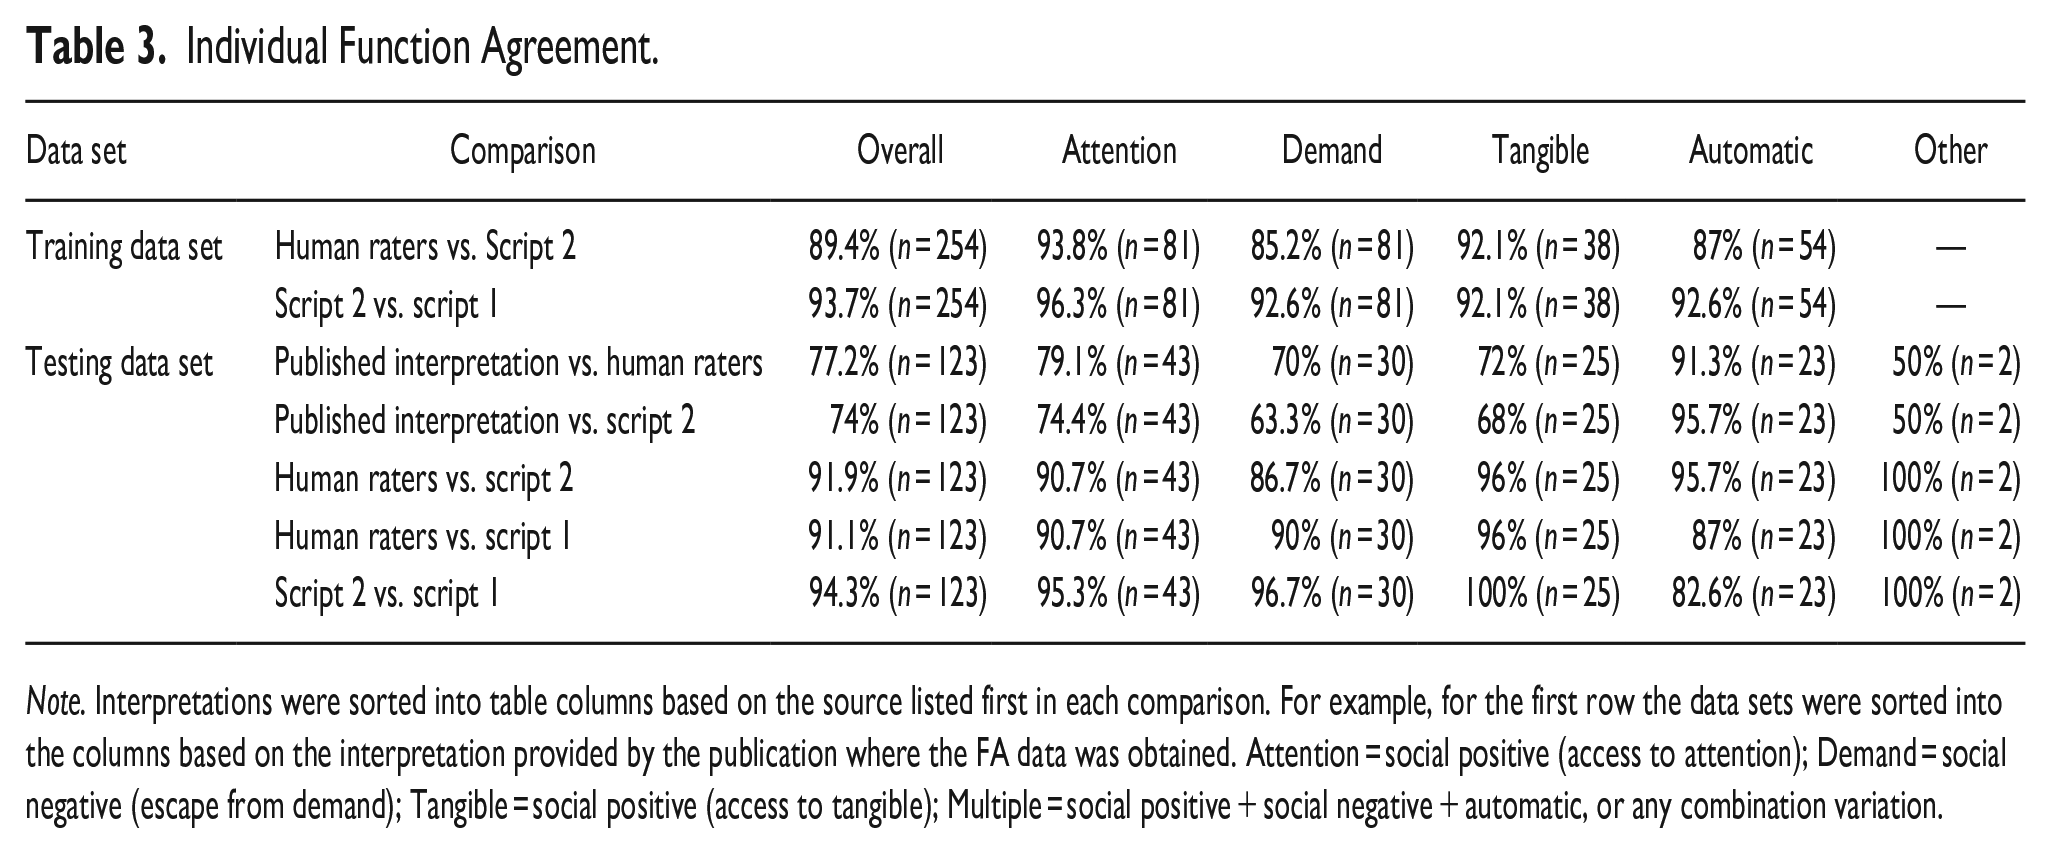
Note. Interpretations were sorted into table columns based on the source listed first in each comparison. For example, for the first row the data sets were sorted into the columns based on the interpretation provided by the publication where the FA data was obtained. Attention = social positive (access to attention); Demand = social negative (escape from demand); Tangible = social positive (access to tangible); Multiple = social positive + social negative + automatic, or any combination variation.
In comparing Human Raters’ interpretation to Script Version 2, disagreements occurred when escape from demand was the FA outcome as well as when the outcome was undifferentiated. Notably, a specific behavior function outcome (e.g., escape from demands, access to attention, undifferentiated) did not appear to reliably coincide with disagreements. That is, it does not appear to be the case that the script is incapable of interpreting a specific type of FA data. It appears reasonable to conclude that FA outcome type (i.e., behavior function) are not differentially affecting the script outcome. This could suggest our sample data sets were not unduly influencing percentage agreement across comparisons.
In reviewing the individual function agreements (Table 3), the outcomes are similar to those for the agreement for the overall FA interpretation (Table 2). That is, although percentage agreement varied across behavior function (range, 50% to 100%), disagreements between rater sources appeared to be randomly distributed across behavior function. This may offer further evidence that the sample data set was not unduly influencing comparison percentage agreement.
Script Version 3
During the final examination of the overall interpretations derived from Script Version 2 (see Results below), we discovered two unanticipated disagreements between the script and the Human Raters that required remediation through new “additional rules” (see A. Cox & Friedel, 2022 for the full details of identifying the cause of disagreements and making changes to the script). We identified these disagreements by systematically examining why the script and the expert human raters disagreed. That is, we assessed the scripts internal analysis data to uncover discrepancies in how we as humans would have conducted each specific analytical step (e.g., Table 1). Importantly, these disagreements did not cause the script to fail (i.e., crash) nor did the script do something different than intended (i.e., a bug). The disagreements were caused by specific rare occurrences in the testing dataset that we did not account for, and which occasioned the creation of the additional rules in A. Cox and Friedel (2022).
The first new rule is more properly described as a conditional requirement for the high-rate rule. Specifically, Script Version 2 neglected to consider any downward trends that would have negated differentiation when evaluating the high-rate rule. That is, there could be enough high data points early in the condition to trigger the newly created high-rate rule but also have sufficient low data points in the second half of the FA to suggest a downward trend (see Figure 5). The new high-rate rule in Version 2 of the script was not intended to override the pre-existing downward trend rules, so the high-rate rule was modified to not trigger if a condition also had a downward trend. The second new rule was related to how overall trends were calculated. The overall trend rule requires that there be a trend in (1) the control condition and a (2) 75% of other conditions in the FA. In calculating the percentage of conditions with a trend for the second part of the rule, Script Version 2 also included the control condition in the calculations. This would potentially inflate the likelihood of the overall trend rule triggering because the control condition was being counted in two places (see Figure 4).
Example functional analysis in which the script did not consider downward trend rule.
We do consider these changes to be minor fixes (see A. Cox & Friedel, 2022 for how these fixes would have been classified). However, the problems were not discovered, nor the changes made until after all of the other analyses were complete. For clarity, we will refer to the corrected script as Script Version 3 and the results of Version 3 will be reported separately from Version 2. Interestingly, we observed a 5% agreement improvement between Published Interpretations to Script Version 3 outcomes (77%). In comparing Script Version 3 to the Human Raters’ interpretations, we found the script adjustments resulted in a 5% agreement improvement. This meant a 98% (46/47) agreement between the two sources. Discussion content related to these outcomes is provided below.
Discussion
There were several noteworthy outcomes worth exploring. First and foremost, recall that agreement between Published Interpretation and the Human Raters’ interpretation was only 75% for the testing data set (N = 47). This outcome is important to highlight because it depicts ongoing visual inspection IOA issues that have been described for several decades (see Ninci et al., 2015). Admittedly, Script Version 2 agreed with the Published Interpretation for only 72% of the sample (N = 47), which technically meant IOA was worse between Script Version 2 and Published Interpretations compared to IOA between the Published Interpretation and Human Raters’ interpretations. However, this value appears to demonstrate an improvement over some existing research exploring human rater agreement (e.g., .66; A. D. Cox et al., 2021; .63; Danov & Symons, 2008). Further, researchers evaluated Script Version 3 to address some coding oversights and, in doing so agreement with Published Interpretations improved by 5% (77%). This improvement directly showcases three beneficial features inherent in using decision support system for interpreting FA data. First, a decision support system can always be improved or modified according to the user’s specifications. These revisions would comprise an objective set of changes that could be easily enacted by another user to generate similar changes simplifying replication (i.e., technological, Baer et al., 1968). Second, by assessing (script) parameter adjustments against a reference array of FA data sets, a user could expeditiously test whether a change to the system increased accuracy, had no effect, or decreased accuracy without having to worry about confounds affecting interpretation (e.g., extra-graphical features). Moreover, using a decision support system to interpret FA data engenders the opportunity to change the system and test the results, which may be akin to a behavior analyst retraining themselves or others to interpret FA data in some new way. Unlike retraining a human rater, however, the decision support system adjustment would not be affected by history. That is, as with all human behavior, history effects will always exist for the behavior analyst interpreting FA data. In other words, a scripted decision support system has no memory or knowledge of other script versions. The system uses only the current version of the script, its parameters, and the FA data. If a faulty version of the script is developed, it can be deleted and have no impact on any future FA data interpretations. By contrast, it is not as easy to deal with the behavioral history when trying to modify a behavior analysts’ interpretations. Finally, it is possible (and important) to have behavior analysts rate and re-rate FA data sets using new systems until they reach some level of proficiency with the new system. However, the labor involved in having behavior analysts rate a large array of FA data sets is onerous. By comparison, the labor involved in having a decision support system rate a large array of FA data sets is trivial even if the original development of that system is non-trivial.
A second outcome worth further discussion is the observed agreement between Human Raters’ interpretation and Script Version 2 of the script (93%; 44/47). An investigation into the source of the disagreements suggested that one disagreement resulted from differences in how stringently Script Version 2 applied the decision rules compared to the Human Raters (see Figure 6). Specifically, the Human Raters concluded this FA data set depicted an escape from demands function because of a low rate rule (i.e., most of the behavior is occurring in the demand condition because of the high data point). However, responding in the demand condition did not strictly meet differentiation criteria because only 40% (and not the required 50%) of behavior occurred during this condition. The other two disagreements resulted from coding oversights. When these oversights were addressed, agreement improvements followed (i.e., 93%– 98% between Script Version 3 and Human Raters). The benefits of a decision support system described earlier may be re-affirmed by this outcome. Thus, it may be reasonable to consider this further evidence that a decision support systems approach to FA interpretation may be viable and well-suited for circumventing interpreter bias and systematizing improved IOA, among the other benefits described above.
Example functional analyses in which there was disagreement between the script and human rater due to stringent application of the decision rules.
One final outcome worth commenting on was the fact that we were able to replicate agreement outcomes observed in our earlier publication (A. Cox & Friedel, 2022). That is, in the sixth row of Table 2, (Human Raters versus Script Version 1) overall agreement was 89%, which is slightly higher than the original final agreement level we observed in A. Cox and Friedel (2022; 81%). This outcome may be considered evidence (i.e., replication) corroborating the value of Script Version 1 because we applied it to an entirely new dataset (i.e., current testing data set) and were able to produce similar (slightly elevated) results. Relatedly, in comparing Script Version 2 outcomes to the Human Raters’ interpretations using the original training and testing data sets combined (A. Cox & Friedel, 2022; N = 84), we observed 77% agreement. Importantly, the performance of Script Version 2 matched that observed in A. Cox and Friedel (2022; 78%, pp. 163–164 for full details). This could suggest that Script Version 2 may be robust because it performed equally well to Script Version 1 with a data set partially comprised of clinical, unpublished data, which may feature less clear (i.e., more ambiguous) data patterns compared to published FA data. Given part of our “targeted consumer base” are clinicians who may not always be working with very clear FA data patterns, it suggests Script Version 2 may be ecologically valid. Future research may consider testing Script Version 2 (or Script Version 3) with a data set entirely comprised of unpublished clinical data with the intention of possibly improving agreement outcomes through additional script adjustments – and thus addressing ecological validity as the primary objective. Pursuing this initiative, may also further demonstrate the flexibility and transparency of a decision support system for the purpose of semi-automating FA interpretation.
Limitations
There are a few study limitations that warrant discussion. First, we reported 79% agreement between the two experienced human raters (second and third author) during the process of generating the “final” Human Raters’ interpretations for each FA data set. Despite this, the experienced raters were able to come to consensus for all FAs in the dataset, and disagreements largely stemmed from vague decision rules (as noted above). Further, this agreement value may be described as falling in the “higher” range of IOA as reported in existing literature on this topic (e.g., Danov & Symons, 2008). As such, the error source likely did not unduly influence the other agreement outcomes (e.g., Human Raters’ vs. Script Version 2).
Another limitation may be related to the modest IOA observed between Published Interpretations and Script Version 2 (72%). However, as mentioned above adjusting for coding oversights (i.e., Script Version 3) produced a 5% improvement in agreement. Admittedly, this outcome suggests future work may include minor script adjustments before embarking on the development of a user-friendly interface to disseminate to consumers.
It is possible that there may be artefacts in the interpretation system related to the how many data points comprise an FA, which could stem from either the Roane et al., 2013 criteria, or the current script version. Specifically, many of the rules rely on means or the proportion of data points being higher/lower than other data points. Importantly, the original rules developed by Hagopian et al. (1997) could not be enacted with datasets comprised of fewer than 10 data points per FA condition. Roane et al. (2013) rightly identified that most FAs do not have a minimum of 10 data points per condition. As a result, they modified the original Hagopian et al. (1997) rules accordingly. Admittedly, this vestige may make the current script overly sensitive in circumstances where there are few data points in the FA, and this empirical question would require further testing. We suspect that for an FA comprised of fewer data points per condition and no clearly delineated pattern (i.e., high responding in one test condition versus control condition responding), the script would likely render an interpretation of undifferentiated. In such a case, the interpretation of undifferentiated would occur in part because the script’s math is based on the differences in proportions. That is, a small number of data points per condition means there are small denominators. If there is a one data point change in the numerator, the overall proportion swings more wildly simply because the denominator is so small. Thus, unless an FA data set is relatively clear, with the proportions being 0 and 1 for most of the decisions to be made, the final interpretation will be “undifferentiated.” Practically, we would hope if there were FA data with relatively few data points per condition (3 points per condition) than the results of the FA ideally should have an extremely clear interpretation or be interpreted as undifferentiated. At the same time, funding resources are not unlimited, and caregivers are often paying out of pocket for services. At times, this can limit extending an assessment to generate clearer outcomes. Ultimately, it is important for practitioners to understand the limitations of tools they choose to support their practice, such as this one, and do their best to make informed decisions around assessment and treatment within the service environment they are functioning.
Importantly, even in research there may be instances where extending assessments may not be feasible. In applied behavioral pharmacology research, for example, behavior analytic researchers have little to no control over the primary independent variable (prescription adjustments; A. D. Cox & Virues-Ortega, 2022; Valdovinos et al., 2009). Furthermore, in situations where problem behavior is truly severe extending assessment sessions may increase participant risk exponentially (Foxx, 2003). Notably, these research scenarios are less commonly observed. As such, the current script version may be helpful for most of the existing datasets observed in the literature. However, we recommend future work on this topic include refining rules so that they can better handle shortened data sets; that is, developing and testing rules that are less affected by fewer data points and can be invoked when applicable (i.e., FA data set with 3 or fewer data points per condition).
Finally, as previously mentioned Script Version 2 in its current form is not ready for widespread use by practicing behavior analysts and/or researchers. This was a problem also identified in A. Cox and Friedel (2022). However, in our proof-of-concept paper the reason Script Version 1 was not prepared for widespread use was largely because our agreement coefficient was relatively modest (81%). Presently, the reason we elected to refrain from developing a user-friendly interface based on Script Version 2 is because our primary objective was to refine and test these refinements before committing to the undertaking of developing a user-friendly interface. We fully recognize interested parties must have extensive computer coding and R skills to input their data to generate an output with the current versions of the script. These required skills are too high a “barrier of entry” and would likely negatively affect uptake. Given our promising outcomes, future work will include creating (and assessing the social validity of) an easily accessible system.
Implications
Semi-automating FA interpretation may have applications beyond the clinical realm, including shifting publication processes. For example, as noted in A. Cox and Friedel (2022) interpreting FA outcomes during the peer-review process represents an IOA of sorts. This process could be standardized, if a consistent set of decision rules (i.e., Script Version 2) were employed and applied semi-automatically by reviewers for the purpose of scrutinizing manuscripts submitted for publication consideration that featured FA data. If a script outcome resulted in an interpretation disagreement with the researcher or reviewer, relevant stakeholders (e.g., editor, reviewer, and researchers) would do well to collectively examine the discrepancy and provide objective justification of their interpretation rather than relying on arguments informed by subjective differences.
Another possible implication is related to the process of developing, evaluating, and finalizing a decision support system. Specifically, the transparency afforded by this process may address reliability issues associated with visual analysis, in a way previous work cannot. These reliability concerns could be a contributing factor to the ongoing exclusion of our science from related fields who rely on other means (e.g., standardized outcomes analyzed via group design) to communicate treatment effects. As we have previously argued, we are not suggesting that a single automated system should replace the expertise of behavior analysts. However, through the mechanisms inherent in developing decision support systems, we may be successful in generating a standardized “playbook” that is entirely objective, transparent, and can be explained to others when interpretations informed by visually inspection are questioned. Furthermore, decision support systems in other sectors grew out of the need for improved efficiencies and clinician performance (Bright et al., 2012). Uptake in the field of behavior analysis may afford similar benefits. For example, semi-automating FA interpretation could have the added benefit of eliminating the need for obtaining IOA or extended discussions to generate consensus by several clinicians because the script enacts a deterministic process and can be used as an interpretation reference point. Currently, employment demand for certified behavior analyst exceeds the supply (BACB Inc, 2018). Thus, the need for greater efficiency across all aspects of behavior analytic work could not be more apparent.
As with A. Cox and Friedel (2022), we feel it is important to reiterate that we it may not be appropriate to tune the script until it will reach a 100% agreement rate. Empirically, 100% agreement between human raters has not been observed (e.g., Danov & Symons, 2008). So, even if we could get the script to be 100% accurate, should it be 100% accurate given Person A or Person B were unable to reach full agreement (and should the script be aligned to Person A or Person B)? It seems likely that any designed system that is sufficiently detailed to be 100% accurate with some ideal human rater may also be over specified. Additionally, overspecification of a model is a problem for generalization to novel FA data. For example, an ideal human rater will just generalize their skills to new data, even if they had not experienced the novel data set previously. By contrast, an over specified script is more likely to make mistakes with novel data because the script was designed not to generalize; it was designed to make definitive conclusions based on the data that was used to create the model. While the script may not be perfectly accurate, we feel it can do a reasonable job interpreting novel FA data (i.e., the testing data set).
Finally, our series of work provides a systematic demonstration of the processes included in generating a viable decision support system. An end user may use a decision support system as a black box: FA data input with no concern for how an interpretation output is obtained. However, we have provided the data and code to users. Barriers to understanding what the script is doing fall mostly in lacking the technical skills in the programming language not the code being locked behind a proprietary door. We feel the behavior analytic community may be better served if the decision support processes are open systems that are featured as steps to better inform consumers (e.g., clinicians, researchers) on the precise approach enacted to produce a useable interface. In addition, a fully instantiated version of this script may be a useful teaching tool in that it could help future generations of behavior analysts learn how to evaluate FA data. That is, if the script provides an interpretation and a rationale for reaching that interpretation then students could use that rationale to hopefully increase the stimulus control to the relevant features of the data set. Future research may consider generating a “user-friendly” version to distribute to trainees so that they may examine the added value of using this system to augment teaching FA interpretation. An open, informative approach may also offer transparency and better adheres to the technological dimension of behavior analytic practice (Baer et al., 1968).
Footnotes
Declaration of Conflicting Interests
The author(s) declared no potential conflicts of interest with respect to the research, authorship, and/or publication of this article.
Funding
The author(s) received no financial support for the research, authorship, and/or publication of this article.