
Abstract
This research examines the difficulties in estimating the price elasticity of energy demand during periods of extreme market volatility, with a focus on the Czech Republic as a small open economy. Utilising a detailed dataset of monthly electricity and natural gas consumption from January 2021 to December 2024, we evaluate the consistency of regression models over different time periods and the impact of auxiliary variables. Our results indicate that models based on three- and four-year datasets are notably more dependable than those using only two-year data. Monthly data analysis reveals low absolute short-term price elasticities for electricity (0.062−0.167) and natural gas (0.091−0.205), indicating that energy demand remains highly inelastic even amid sharp price increases. This suggests that price signals alone are not sufficient to drive significant short-term reductions in energy use.
Keywords
Introduction
In general terms, elasticity quantifies how sensitive the response of one variable is to a change in another. In this case, we examine the sensitivity of energy consumption to changes in energy prices, i.e. price elasticity. The price elasticity of demand is negative; according to economic principles, as the price rises, the quantity demanded falls. Estimating the price elasticity of demand for energy remains a key concern, particularly during periods of rapid price increases. This estimate enables energy companies to set prices effectively and energy market regulators to minimise adverse effects on consumers and businesses. Regulatory authorities use elasticity estimates to assess how taxes, fees, or subsidies affect energy consumption, informing policy decisions to reduce consumption or promote sustainable energy. Companies and investors use elasticity estimates to analyse how price changes affect demand, which in turn influences decisions to build new sources or modernise existing ones.
The period is marked by a global pandemic, the war in Ukraine, and legislative changes linked to the European Union's environmental goals. These events have significantly affected energy prices and provide researchers with a unique dataset on the behaviour of energy consumers during periods of extreme turbulence, characterised by sharp price changes and high uncertainty in energy markets. The aim of this study is therefore to estimate the price elasticity of demand for electricity and natural gas and to assess the suitability and availability of the necessary data in the Czech Republic, a representative of European small open economies.
Literature review
Previous research shows that household energy consumption, including electric vehicle charging, has low price elasticity of demand. A meta-analysis by Labandeira et al. (2017) reports that short-term price elasticities for energy products ranged from −0.09 to −0.76, while long-term elasticities ranged from −0.31 to −1.16. Previous work also indicates that elasticities tend to decline in absolute terms over time. This pattern may reflect both the income effect and the impact of improved energy efficiency, which could reduce consumers’ price sensitivity. The findings further show that, among specific energy goods, gasoline has the highest price elasticity and heating oil the lowest, although the dispersion of price elasticities is relatively small. Another interesting finding of this meta-analysis is that price elasticity estimates from panel data are significantly higher than those from time-series data and significantly lower than those from cross-sectional data. Furthermore, price elasticities are significantly higher when commercial energy demand data and complex demand models are used, or when related studies are published in professional journals, and significantly lower when data from after the crises (1973, 1979, and 2008) are used.
Fouquet (2014) draws on 200 years of observations of energy elasticity in the United Kingdom. The price elasticity of demand is U-shaped, with efficiency improvements leading to rebound effects. In this context, the rebound effect is the phenomenon whereby efficiency gains aimed at reducing energy consumption lead to higher consumption through changes in consumer behaviour. Several prior studies indicate that energy demand elasticity, particularly in households, remains low in absolute terms. Havranek et al. (2012) suggested that the literature on the price elasticity of demand for gasoline shows publication bias. After correcting for publication bias, the average short-term elasticity was estimated at −0.09, and the average long-term elasticity was −0.31. Schulte and Heindl (2017) estimate the price and expenditure elasticities of demand for energy among German households and find that low-income households respond only weakly to changes in energy prices, whereas high-income households are more price-elastic. The increase in energy prices had a regressive effect, exacerbating economic inequality.
Zhu et al. (2018) report a short-term price elasticity of demand for household electricity of approximately −0.228. Atalla et al. (2018) attempted to estimate the aggregate elasticity of energy demand in the household and commercial sectors. Their econometric analysis provided quantitative evidence of cross-country differences in income and price elasticities and highlighted the effects of weather and capital stocks on energy demand. According to their work, electricity is more of a luxury good in advanced economies, and electric vehicles are now beginning to have a greater impact on electricity consumption. A different approach to estimating elasticity was used in Sahari's (2019) study of Finland, in which price sensitivity was expressed as the elasticity of the total amount of installed electric heating with respect to the electricity distribution price. The elasticity of demand for electric heating technology with respect to electricity prices was estimated at −0.71 at the average price level. Based on this result, the authors concluded that an increase in energy prices, for example through taxation, would shift demand towards less energy-intensive technologies.
As expected, estimates of long-term price elasticity of demand are higher in absolute terms than those for short-term price elasticity. Liu (2004) estimates the price and GDP/income elasticities of various energy commodities in OECD countries between 1978 and 1999 using a dynamic panel approach. The results show that the absolute price elasticities of electricity, natural gas, and gasoline are higher in the residential sector than in the industrial sector. GDP/income elasticities are lower in the residential sector than in the industrial sector for these energy commodities. Long-term GDP/income elasticities generally hover around unity. Woo et al. (2018) report relatively high absolute elasticity values. Estimates of long-term own-price elasticity for household and industrial electricity demand are −1.12 and −1.36, respectively.
Liddle (2022) examines the time-series elasticity of GDP with respect to energy consumption in OECD countries between 1960 and 2019. Before the first energy crisis, GDP elasticity with respect to energy consumption in OECD countries was approximately 1. The extreme oil price shocks of 1974–1985 reduced GDP elasticity to around 0.6, a level that has remained stable since 1986. Since the end of the second energy crisis, GDP elasticity has remained stable at approximately 0.5–0.6. Trotta et al. (2022) report an inverse relationship between price elasticity and income level, with price elasticity higher at the lower end of the income distribution (25%) and lower among households in the top 25% of the income distribution. Lower-income households are more likely to monitor price increases and adjust their heating behaviour accordingly. However, demand for district heating is inelastic across all income groups. Price increases, therefore, lead to higher household expenditure. Regarding the relationship between price elasticity and consumption levels, the results suggest that households with higher consumption are more responsive to price changes. This may be because users with higher energy consumption are more likely to engage in discretionary consumption activities that can be avoided without sacrificing much thermal comfort. For example, households with higher consumption can reduce it by lowering the temperature by just one degree. However, both estimates are statistically indistinguishable at conventional significance levels. Liddle (2023) later addresses a similar topic, examining evidence on time-varying elasticities of GDP and energy/electricity demand prices, and concludes that these elasticities are generally stable over time, with exceptions such as the decline in electricity demand elasticity in OECD countries due to saturation and policy changes.
Current work already addresses the 2022 energy crisis. Alpino et al. (2024) examine the impacts of this crisis on medium- and large-sized industrial enterprises in Italy and find minimal price elasticities for electricity and natural gas. Their results show that the average price elasticity of demand for electricity and natural gas is very close to zero, indicating minimal responsiveness to price changes. Yu and Chang (2024) examined the interconnectivity between carbon and energy price volatility using Realised Semi-variance and Elastic-Net-VAR models, finding a strong correlation with time-varying network interconnectivity and identifying how shocks such as COVID-19 and geopolitical risks affect this interconnectivity in different ways. According to the study, network connectivity varies over time from 21.54% to 83.34%. Carbon markets primarily act as recipients of price volatility, while energy markets serve as initiators. Another finding was that the inflow of negative price volatility was more pronounced than that of positive price volatility. Mortha and Arimura (2024) examined the substitutability of electricity and fossil fuels in Japanese manufacturing plants and found that a 1% increase in electricity prices leads to a 6.55% increase in fossil fuel consumption, particularly in sectors such as pulp and paper, iron and steel, chemicals, and cement. The study suggests the need for comprehensive taxation of both fuels and electricity to prevent attempts to substitute away from decarbonisation.
Kuang et al. (2024) estimate the price elasticity of demand for public electric-vehicle charging in Shenzhen, China, and find it inelastic, with an average elasticity of −0.7581. Negative price shocks change elasticity only slightly, whereas positive shocks increase the price sensitivity of electric-vehicle charging users, suggesting that electric-vehicle drivers are more sensitive to price increases than to price decreases. The study further quantifies the side effects of demand changes due to price fluctuations and provides policy implications for promoting electric-vehicle charging and the transition to renewable energy sources (RES). Another study addressing energy consumption in transport is Bardazzi and Grazia Pazienza (2024), which examines the effectiveness of fuel taxes in reducing transport fuel consumption and finds that Italian households are more sensitive to tax changes than to oil price changes, with implications for climate change and energy transition policies. The results suggest that Italian households are more sensitive to changes in fuel tax rates than to changes in oil prices. Tax elasticity is therefore higher than the elasticity of net gasoline and diesel prices.
High-quality estimates of the price elasticity of demand for energy require additional variables beyond energy consumption and price data. As early as 1951, Houthakker (1951) used non-economic variables such as temperature and daylight hours to explain changes in energy consumption, rather than economic variables, which did not adequately explain seasonal fluctuations. Menegaki (2014) conducted a meta-analysis of 51 studies on the relationship between energy consumption and GDP growth. The long-term elasticity of GDP growth with respect to energy consumption is influenced by the cointegration method, the type of data, and the inclusion of variables such as price level and capital. The presence of bidirectional causality and the number of countries in the study positively affect elasticity. When examining multiple countries, their interdependence is taken into account. Burke and Csereklyei (2016) employed a panel data model to estimate energy consumption, using GDP, average temperature, precipitation, population, and land area as explanatory variables. Their study found that the residential sector exhibits relatively low energy elasticity with respect to GDP, whereas the transport, industry, and services sectors exhibit higher energy elasticity. GDP elasticity was low for solid biofuels and relatively high for electricity. Energy elasticity with respect to GDP was higher at high income levels. Another perspective is applied in the research by Abu Al-Haija et al. (2023), where a model for predicting global energy demand is introduced using nonlinear autoregressive neural networks.
Based on monthly billing data from 51,177 end users, the price elasticity of demand for natural gas in Italy shows that residential customers respond more to price changes than non-residential customers, yet overall price elasticity remains below 1%, indicating relatively inelastic demand (Favero and Grossi, 2023). This micro-level analysis is useful for energy policy and public service management. The analysis also shows that natural gas consumption is significantly influenced by environmental factors, particularly temperature. Idsø et al. (2024) focus on the Norwegian electricity market, which is dominated by renewable energy and relies heavily on electricity for heating. This market exhibits low price elasticity and significant temperature elasticity, with consumption influenced primarily by temperature rather than price.
Estimating the price elasticity of energy demand can be done using several methodological approaches. The standard approach uses a regression model in which the dependent variable is the logarithm of energy consumption, and the independent variables include the logarithm of the energy price and accompanying meteorological and socioeconomic variables. For time-series data, so-called Error Correction Models (ECMs) are commonly used, as they can distinguish between short-run and long-run elasticities. The foundations of ECM were laid by Engle et al. (1989); notable applications in energy demand modelling include the works of Halicioglu (2007) and Dilaver and Hunt (2011). Currently, the autoregressive distributed lag (ARDL) model is frequently used as a modern form of ECM.
Another approach, structural demand models, is based directly on microeconomic utility theory. The foundation is the Almost Ideal Demand System, see Deaton and Muellbauer (1980), which allows estimation not only of own-price elasticity but also of cross-elasticities across energy sources. Practical implementation often uses instrumental variables models estimated by Two-Stage Least Squares; see, e.g. Burke and Abayasekara (2018). To use this approach, it is necessary to identify a variable (the so-called instrument) that correlates with price and is exogenous, i.e. does not influence energy consumption in any way other than through price. In the energy sector, potential instruments include raw material prices, meteorological factors affecting energy production, changes in the tax burden, and regulated price components. Finally, with the advent of smart meters, non-parametric methods based on machine learning (including gradient boosting and random forests) and Big Data are gaining traction, as they can better capture generally nonlinear relationships and the influence of weather; see, for example, Peplinski et al. (2024).
Although the price elasticity of demand for energy has been addressed in the current literature, there are still gaps in the research that our study addresses. While previous studies, such as Labandeira et al.'s (2017) meta-analysis and Fouquet's (2014) long-term study, provide a general overview of elasticity, our study offers estimates for an unprecedented period of turbulence. Russia's invasion of Ukraine has reshaped European energy markets by driving up energy prices and intensifying efforts to diversify away from Russian supplies. This topic is discussed by Brkić (2024) in the context of Serbia and is also relevant to the Czech Republic. Most studies also focus on large economies, whereas our article provides insight into a small open economy transitioning from Russian natural gas supplies to other sources. Unlike others, our work places greater emphasis on short-run price elasticity estimates and discusses individual estimates in detail from both substantive and methodological perspectives. To address these research gaps, we have formulated the following research questions:
RQ1: Is the quality of price elasticity estimates significantly affected by the scope and length of the data collection period used to estimate them? RQ2: Is energy demand in a small open economy inelastic for both electricity and natural gas, even during periods of rapid price growth?
We have also formulated the following research hypotheses:
H1: The short-run price elasticity of demand for electricity and natural gas is low in absolute terms, confirming high inelasticity even in crisis situations. H2: Regression models based on longer time series (four years) provide better estimates of elasticity than short-term (two-year) models. H3: Heating degree days (HDD) explain a significant share of the variability in consumption, not only for natural gas but also for electricity.
Materials
In the Czech Republic, long-term monthly data on electricity and natural gas consumption, expressed in megawatt-hours, have been available since 2021, but energy prices have been available only on a semi-annual basis since then. The Czech Republic has a long-established energy market, and data on daily consumption and commodity prices are available at frequencies ranging from daily to annual. The usability of these data for estimating the price elasticity of demand is limited because, for electricity, the day-ahead market covers only about a quarter of total consumption, and for gas, only a few per cent. Data from the day-ahead market are shown in Figure 1. A similar trend is evident in energy prices, with prices rising during the 2022 energy crisis and then gradually declining to near the 2021 level. Electricity consumption from the day-ahead market is consistent with a decline due to higher prices, whereas natural gas consumption from the day-ahead market shows a relatively balanced volume throughout the period under review.
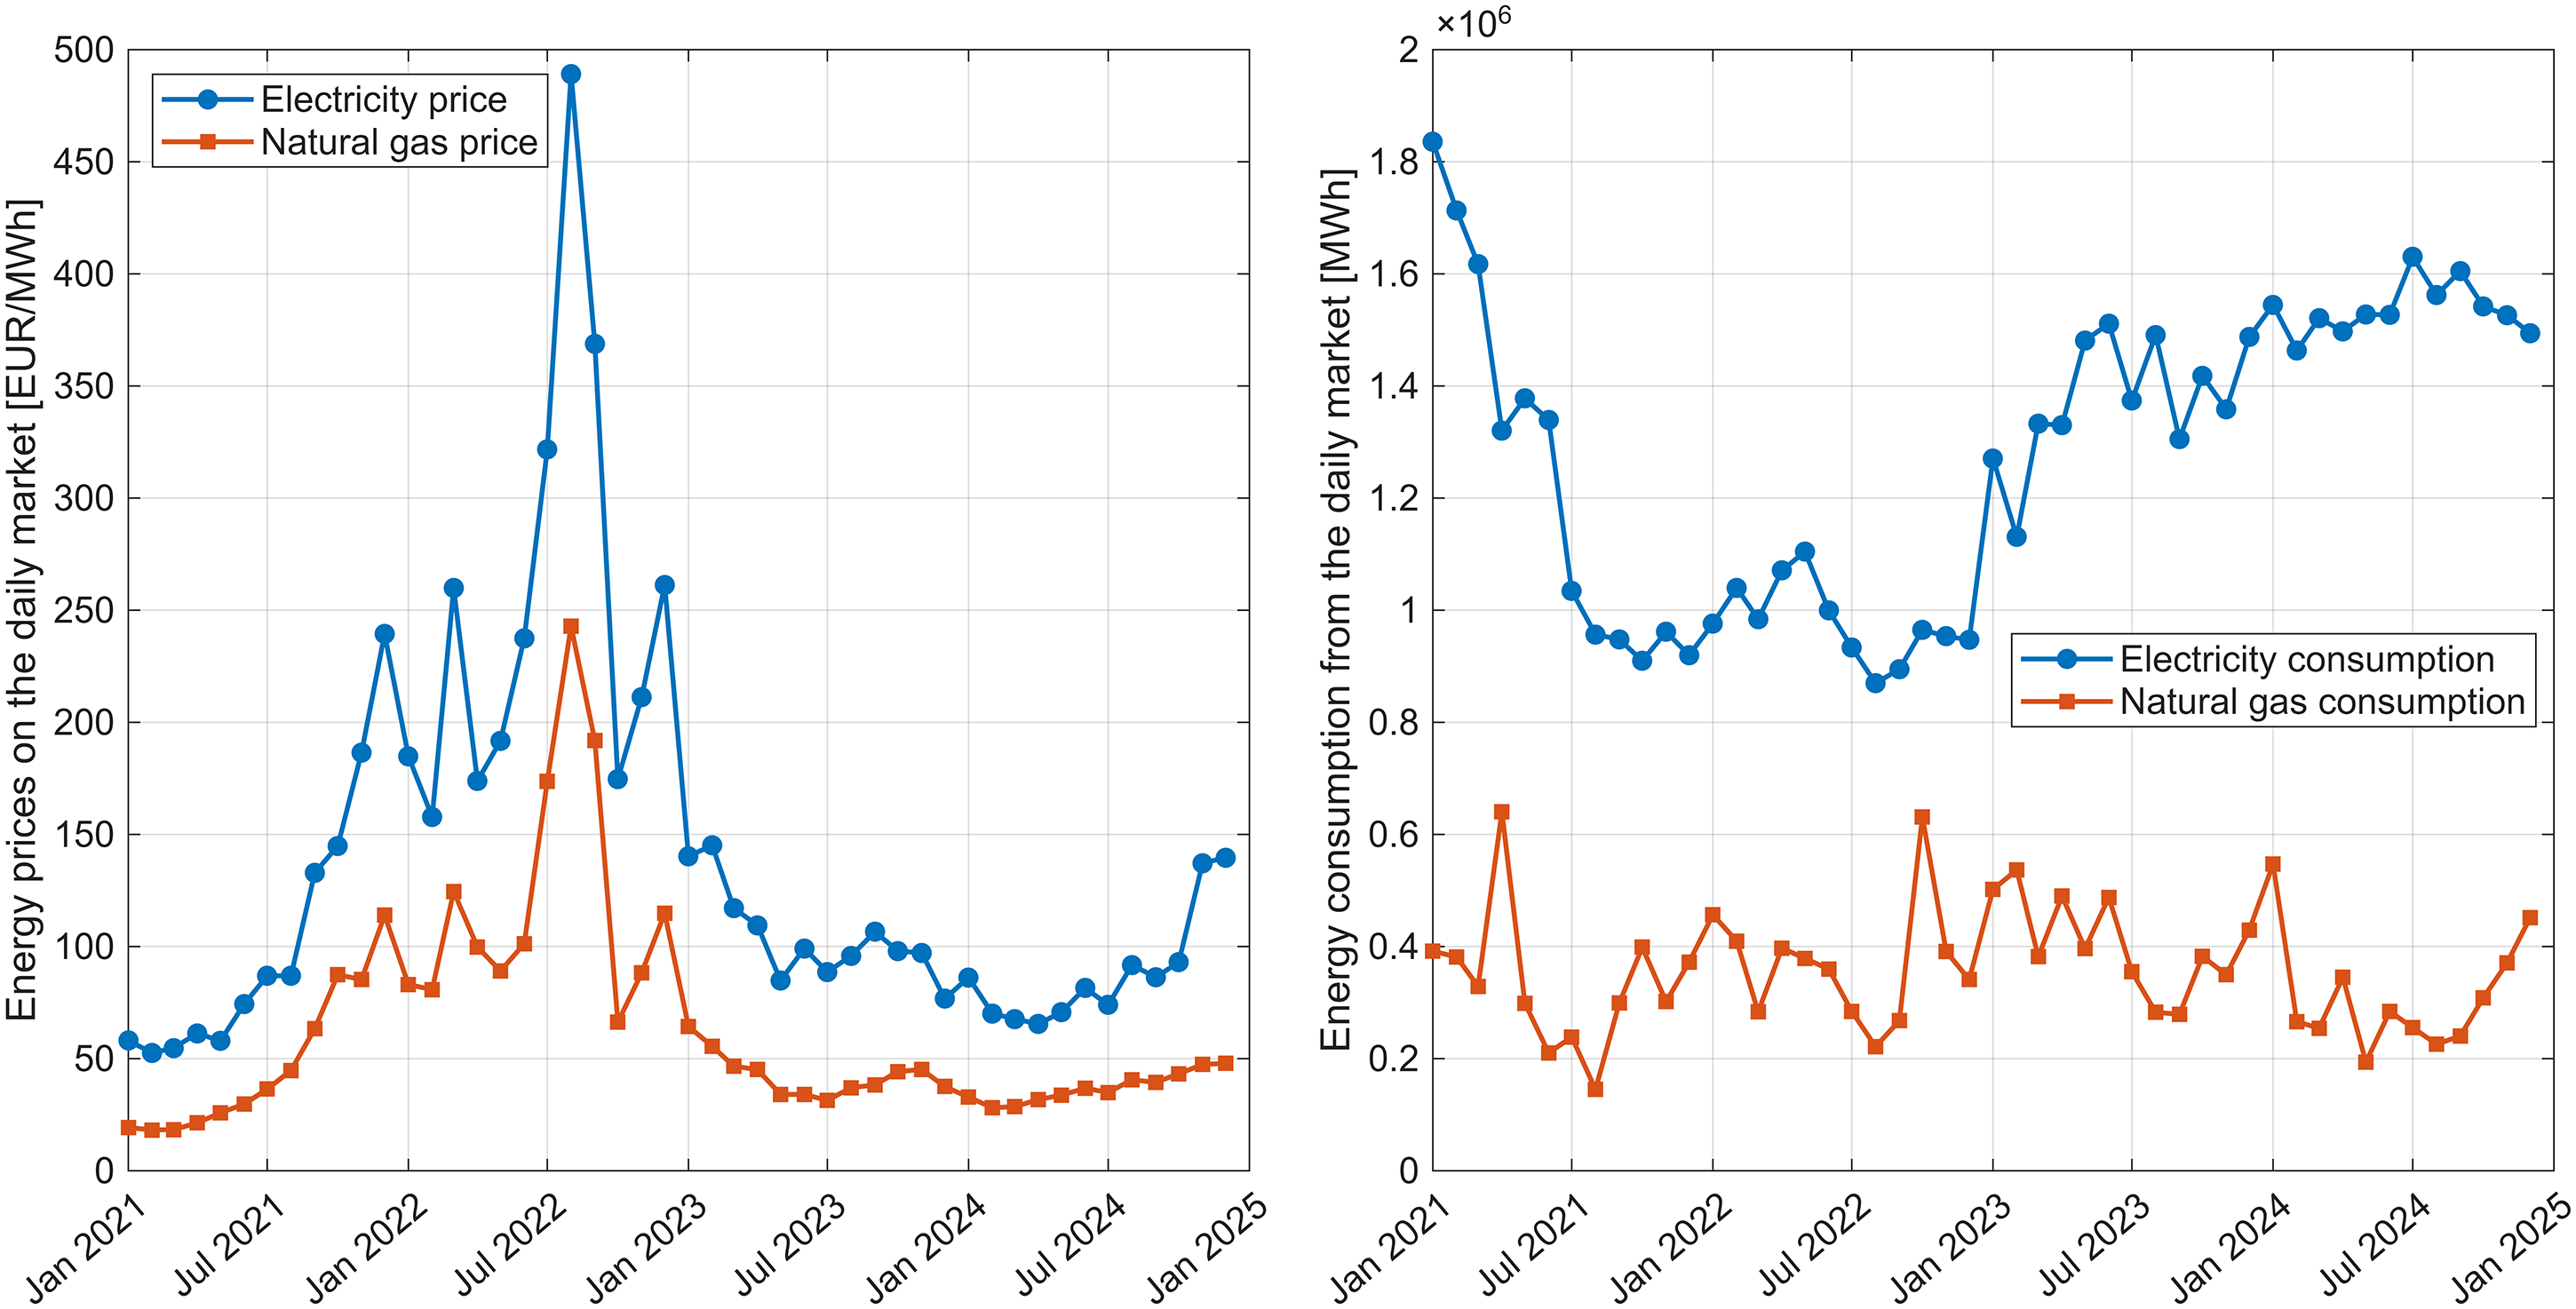
Energy prices (left graph) and energy consumption (right graph) traded on the daily market.
Half-yearly price data raise concerns about the accuracy of the estimated regression models, as prices remain constant for six months when monthly data are used. To verify the robustness of the estimated models, we adjusted the half-yearly price data for each half-year by weighting it according to price developments in the daily electricity (Peadj) and natural gas (Pgadj) markets, see the left graph in Figure 2. The average of these data for each half-year gives the original data, Pe and Pg. Figure 2 shows a rapid increase in energy prices in 2022, followed by a gradual decline from 2023 onward. For electricity, a new equilibrium price is expected relative to 2021, whereas natural gas prices continue to decline slowly and are approaching 2021 levels. Consumption of both energy sources follows a seasonal cycle, with natural gas showing a significantly greater amplitude, primarily due to winter heating. There is also a noticeable downward trend in natural gas consumption. Electricity consumption is more balanced, with higher levels in the winter months, but in the summer months, it is increasingly driven by air conditioning. GDP per capita (gdp) is included in the model as an indicator of economic strength. Data on the numbers of battery electric vehicles (BEVs) and hybrid electric vehicles are included because the gradual transition of passenger transport from combustion to electric powertrains is a significant factor shaping electricity demand.
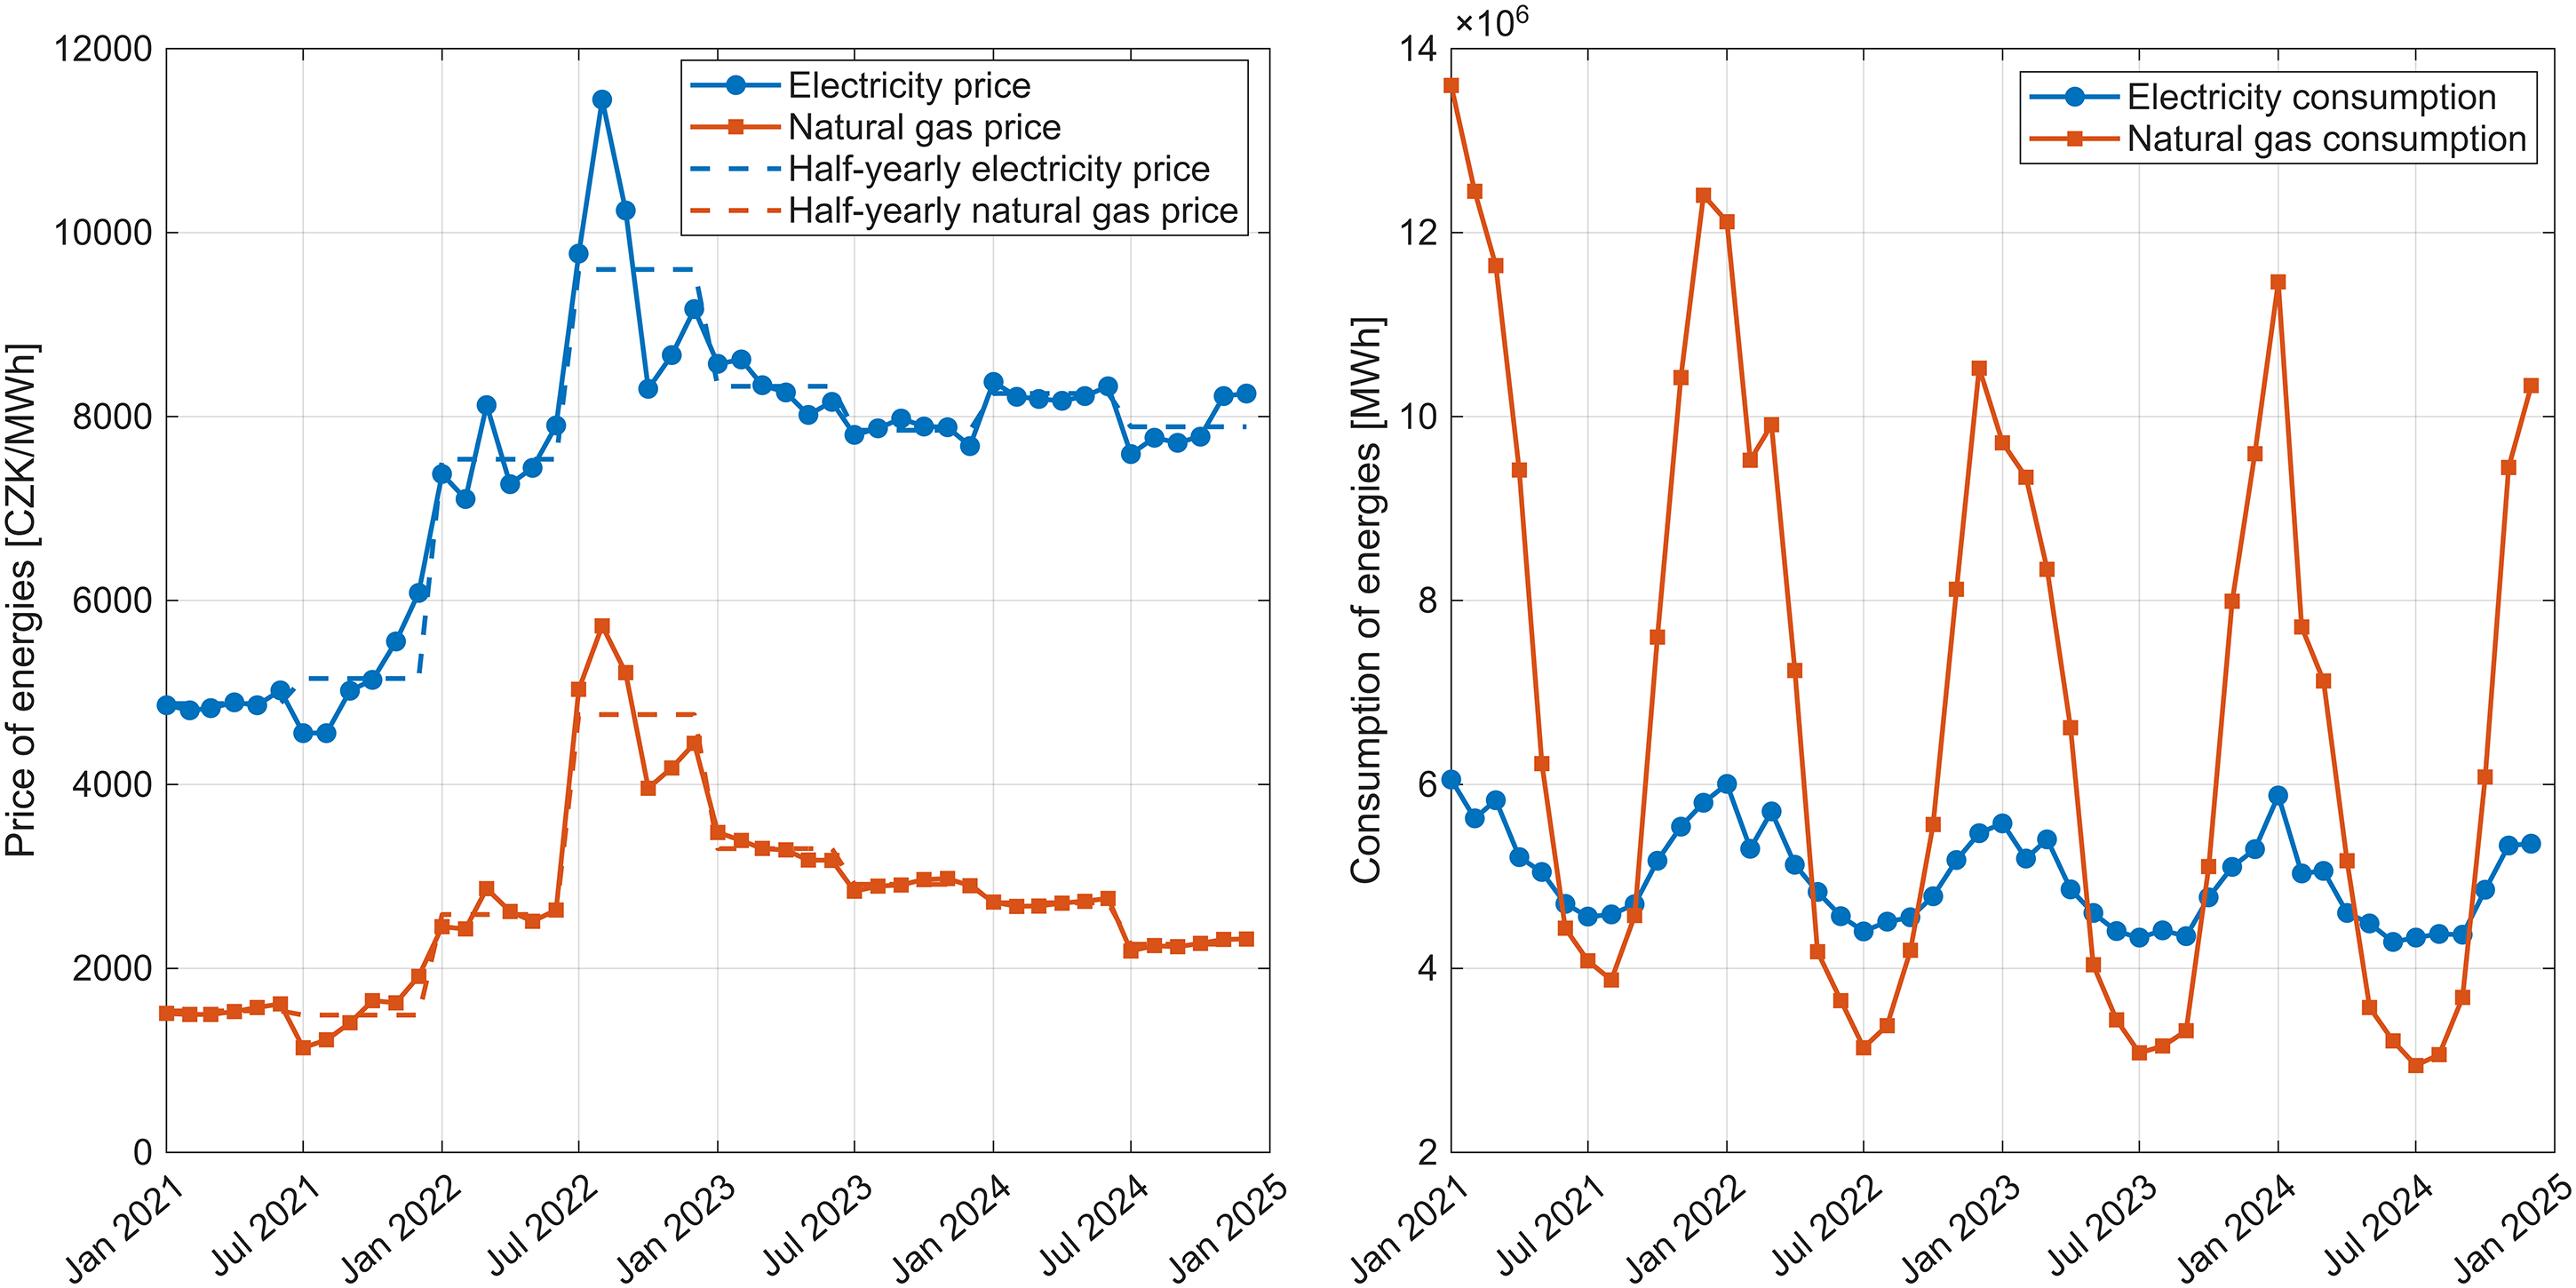
Energy prices for ordinary consumers: original half-yearly data and data reflecting fluctuations on the daily market (left graph), energy consumption (right graph).
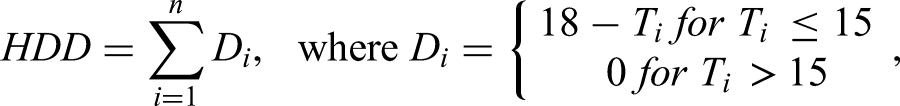
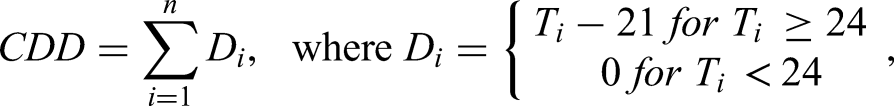
In addition, meteorological variables such as total precipitation (rain) in mm, average monthly temperature (avg_t) in °C, and hours of sunshine (sun_h) are used. Sunshine hours are included to capture seasonal changes in lighting demand, although the transition to more energy-efficient technologies, such as LEDs, has made lighting less of a factor in electricity consumption than in the past. There are no statistics on the average number of hours of sunshine for the entire Czech Republic; therefore, data from 31 stations across all regions were used to calculate the average monthly sunshine durations. Unusually, we will use cooling degree days (CDD) and HDD, which measure temperature deviations from the comfort zone and signal the need for cooling or heating. It is assumed that only one of these variables will be used in the model, as CDD and HDD are to some extent interrelated. For the Czech Republic, we use the characteristics defined by the European Commission's Research Centre (in general, the calculation may vary depending on the temperature threshold). The HDD indicator for a period of n days is calculated as
Finally, for a 2SLS application, we need instrumental variables that influence energy prices in the Czech Republic and are exogenous. Two supply-side variables were selected: the price of gas on the title transfer facility exchange and the volume of electricity generated by wind power plants in Germany. In addition, the level of compulsory payments for RES in the Czech Republic and the Czech Republic's VAT rate are included as exogenous shocks that affect the final price without being related to demand behaviour. The development of these variables is depicted in Figure 4.
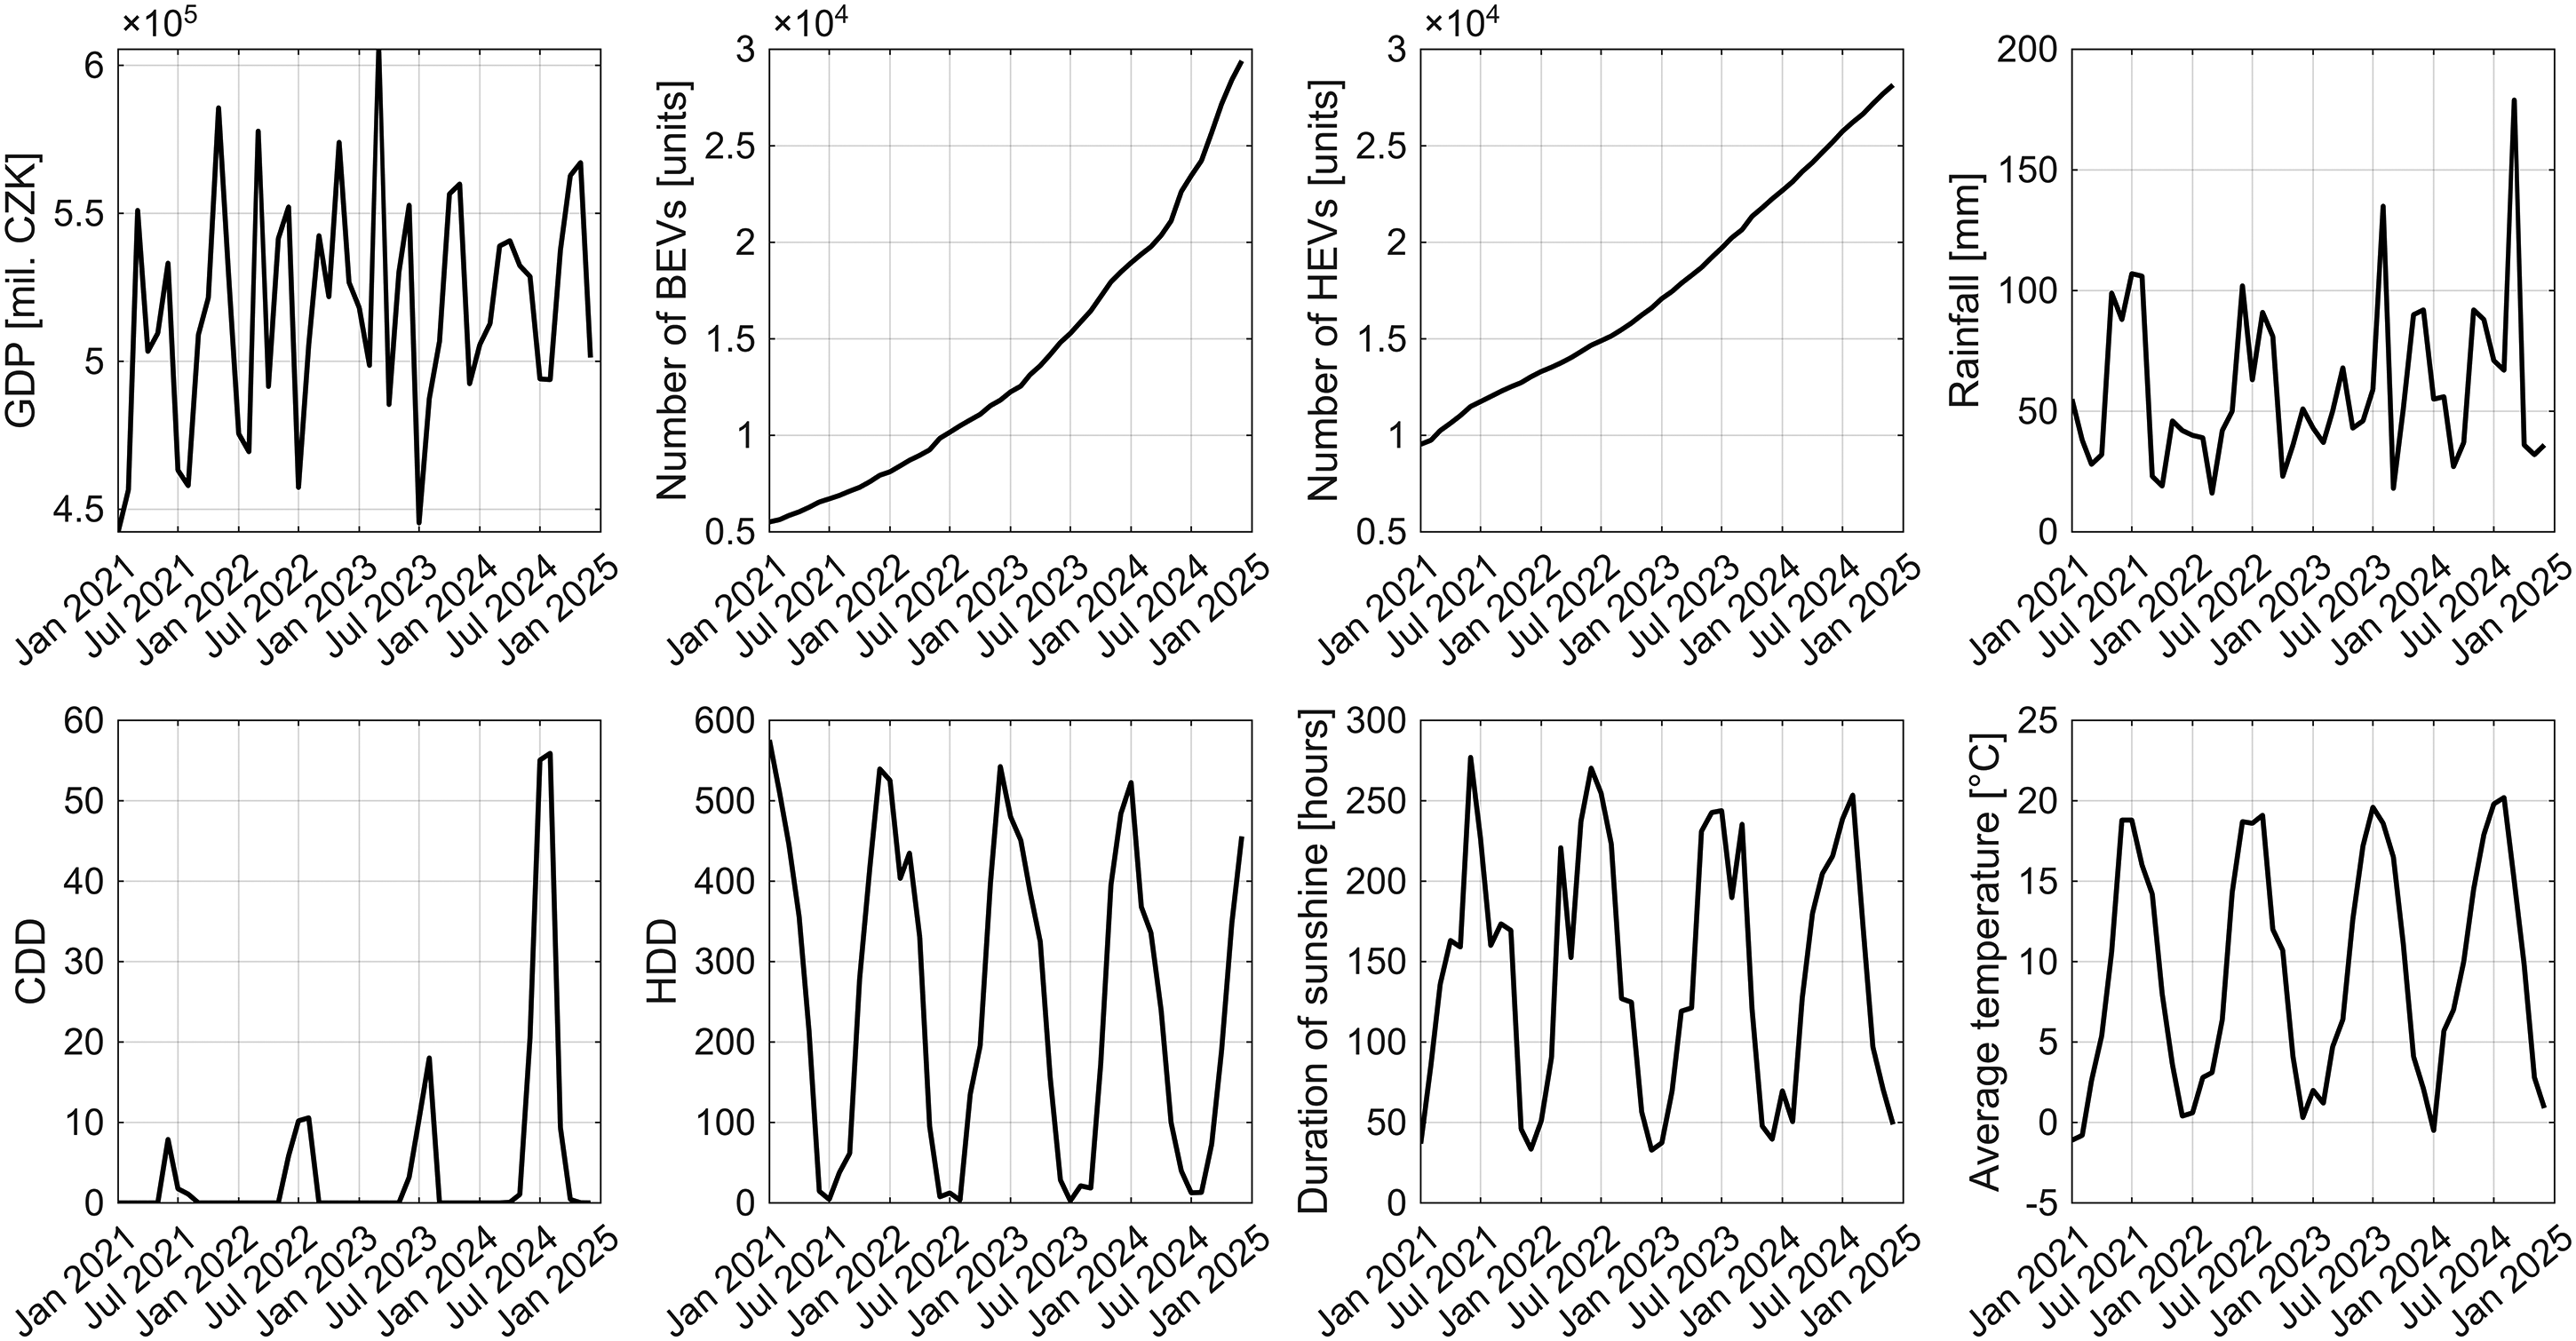
Development of accompanying variables between 2021 and 2024.
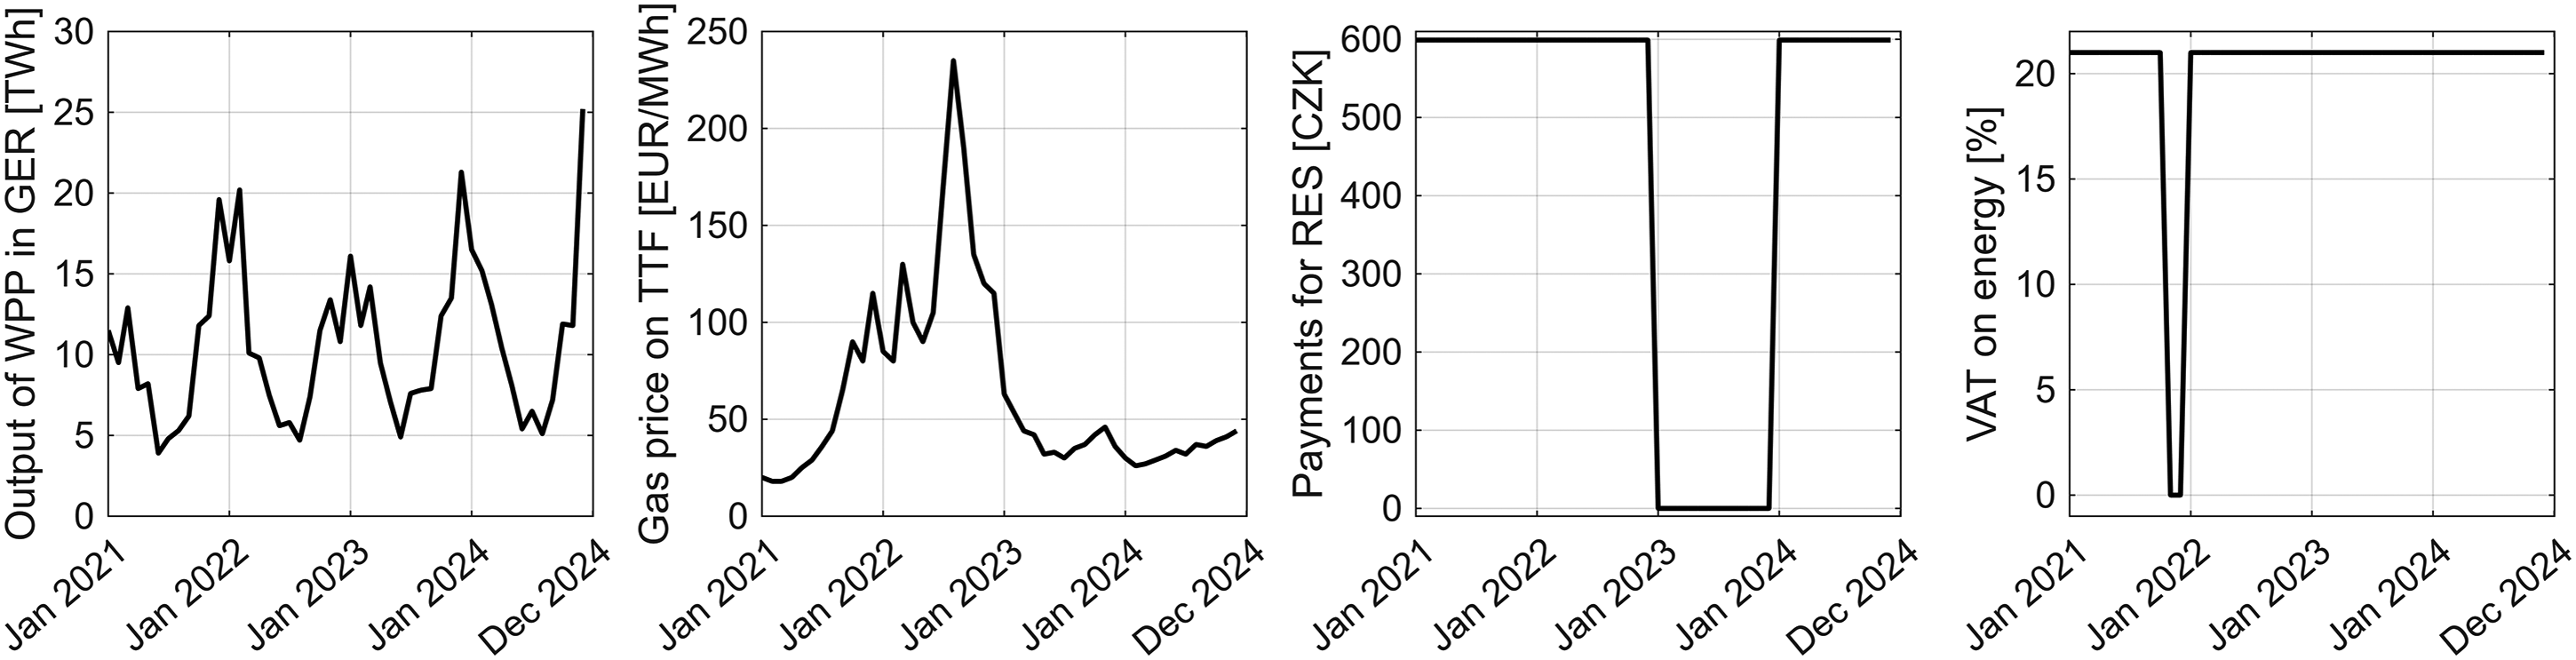
Development of instrumental variables between 2021 and 2024.
Methods
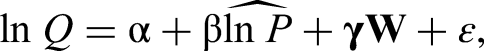
The price elasticity of demand for both monitored energy types was estimated using a linear regression model

To verify the elasticity estimates obtained using this model, a 2SLS model with instrumental variables was also employed, in which the price is modelled in the first stage using the instrument matrix

In the second stage, consumption is modelled using the price prediction from the first stage of the model
For both monitored energies, models were estimated from daily market data and from Qe and Pe, or Qg and Pg, respectively. To verify the robustness of the results, adjusted prices Peadj and Pgadj were also used, and the time series were gradually shortened to the periods 2021–2023, 2022–2024, 2021–2022, 2022–2023, and 2023–2024. The estimated models are summarised in Table 1. All data operations and calculations were performed in MATLAB R (2024b) and Gretl (2025B), with a significance level of 0.05. Significance of variables is denoted as follows: ***p < .01; **0.05 < p ≤ .01; *0.1 < p ≤ .05; no star 0.1 ≤ p; N.S. indicates that the variable was eliminated from the model due to insignificance.
List of estimated models. In addition to the variables listed, the following are always among the initial independent variables: BEV, HEV, rain, CDD, HDD, gdp, sun_h, avg_t.
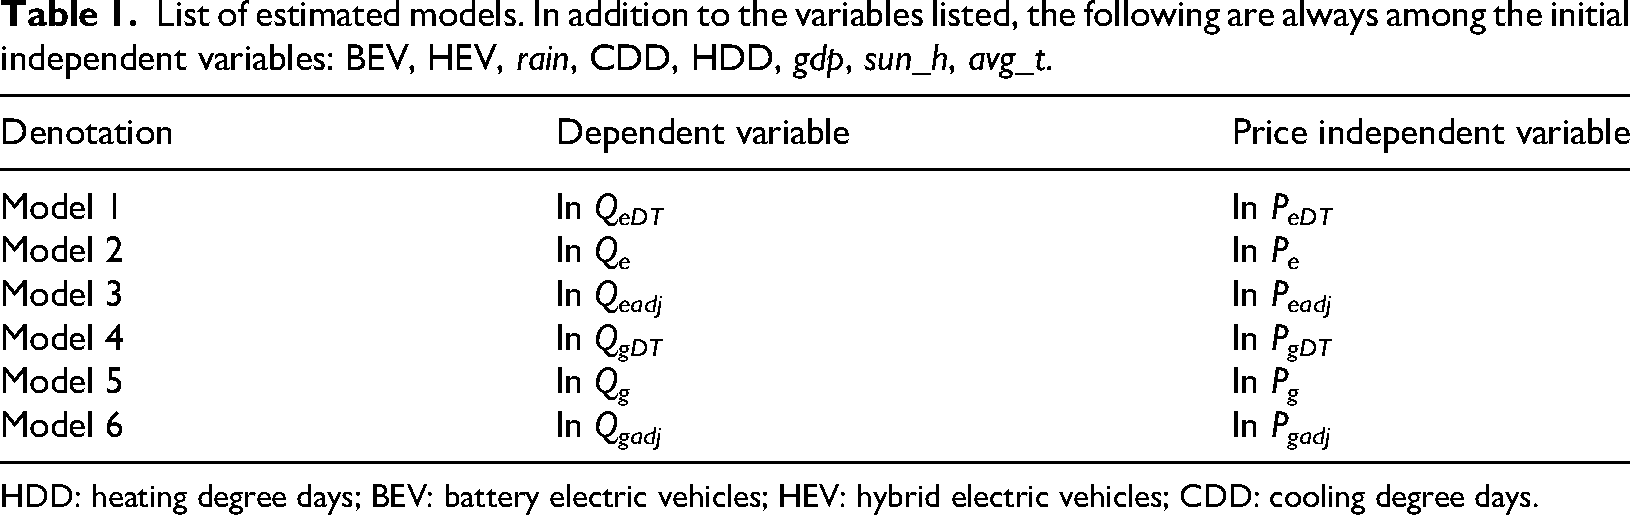
HDD: heating degree days; BEV: battery electric vehicles; HEV: hybrid electric vehicles; CDD: cooling degree days.
Results
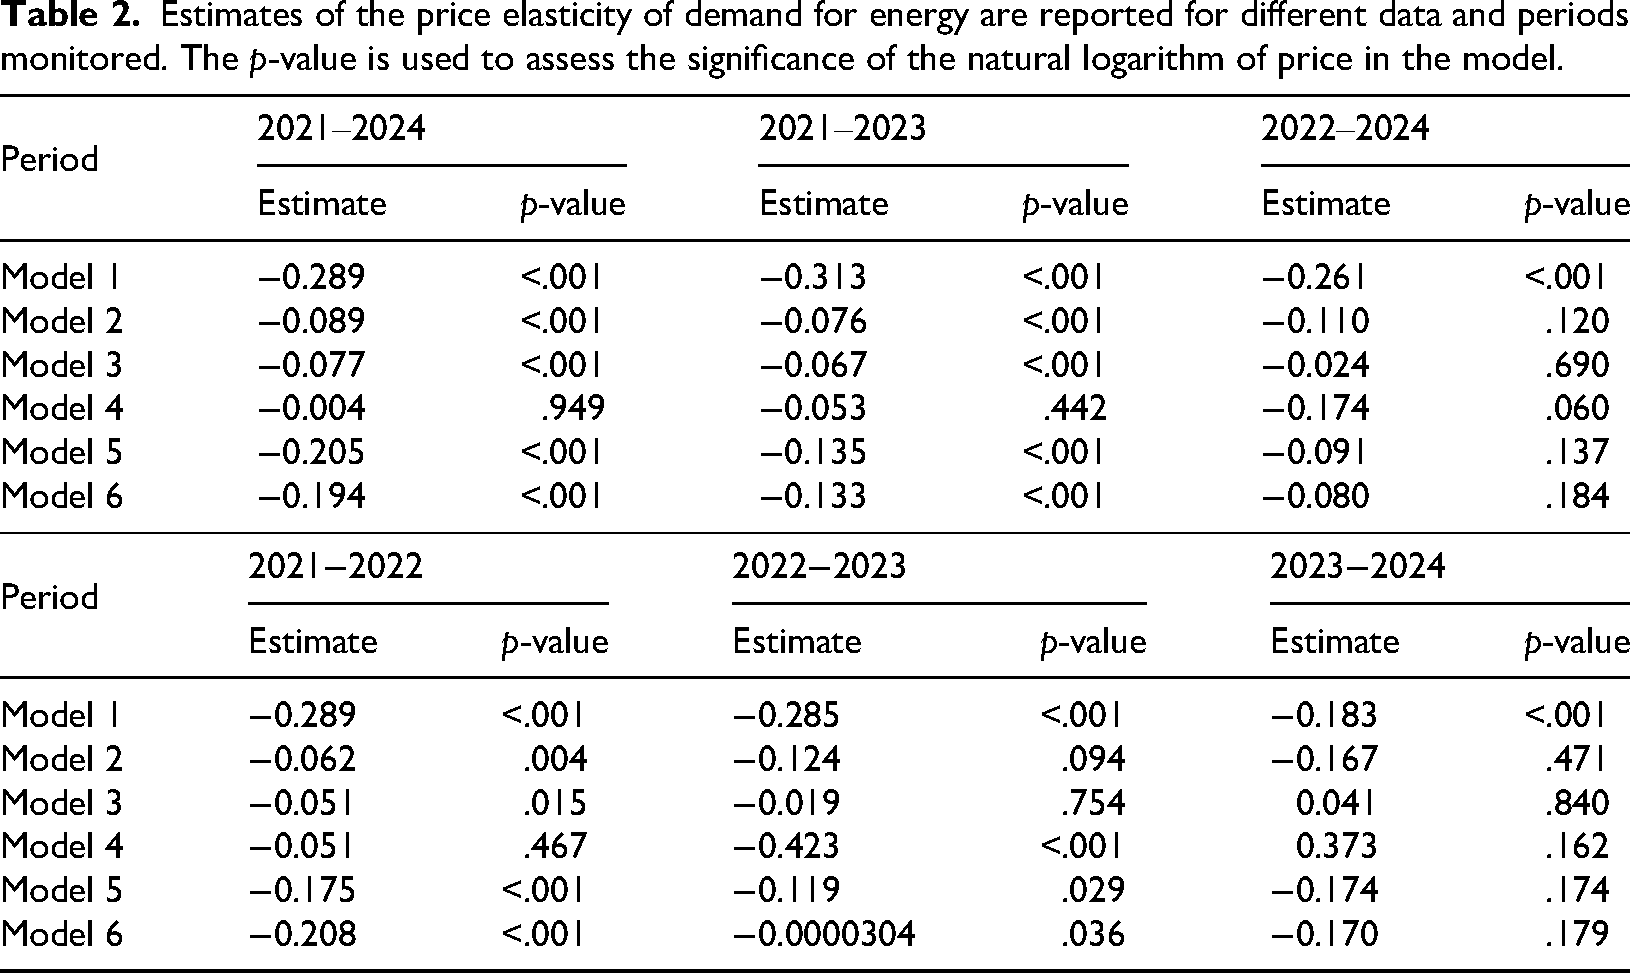
The elasticity estimates obtained using different models are summarised in Table 2. Models based on two-year data illustrate the challenges of estimating the price elasticity of demand for energy. The most serious problem is the model's positive estimate of elasticity for 2023–2024. Significant differences were observed for models with half-yearly prices and adjusted electricity prices in 2022–2023 and 2023–2024, and for natural gas in 2022–2023. The estimates based on the model for 2021–2022 appear to be the most reliable, except for the model for the daily natural gas market, which is statistically significantly different from zero, which is often not the case for other two-year periods. The model for the daily electricity market appears to be well specified for two-year data, with highly significant elasticities and realistic parameter estimates. Overall, however, estimates based on two-year data are unreliable and will not be discussed further. Estimates for models based on three and four years do not show the same serious problems as those for two-year models; the most significant difference is in estimates of the price of electricity for ordinary consumers, as provided by models for 2022–2024. With the exception of the daily natural gas market, greater elasticity in absolute terms is observed for the longer period (four years) than for the shorter three-year period. It can also be observed that the elasticity estimates for the period covering 2021 and 2022, when energy prices were virtually constant and then began to rise sharply, are statistically significant.
Estimates of the price elasticity of demand for energy are reported for different data and periods monitored. The p-value is used to assess the significance of the natural logarithm of price in the model.
Next, we examine the models for the daily electricity and natural gas markets presented in Table 3. A highly significant variable across nearly all models is the HDD index, which indicates the need for heating. In natural gas consumption models, this is typically the only variable that, on its own, explains natural gas consumption well. The only other variable in natural gas consumption models is the number of electric cars in the 2022–2024 period. In various models for estimating elasticity, the impact of this variable can be understood more broadly as a trend reflecting the emergence of electricity-based technologies. A positive sign is expected in electricity consumption models and a negative sign in natural gas consumption models, as the deployment of new electricity-based technologies is likely to reduce natural gas consumption. In daily market electricity consumption models, the length of sunshine is always a significant variable, and positive parameters are interpreted as indicating electricity use for room cooling. The CDD index is specifically designed for this purpose and is only significant in the model for 2021–2023.
Models for daily market data. The table shows the estimated parameters and their significance.
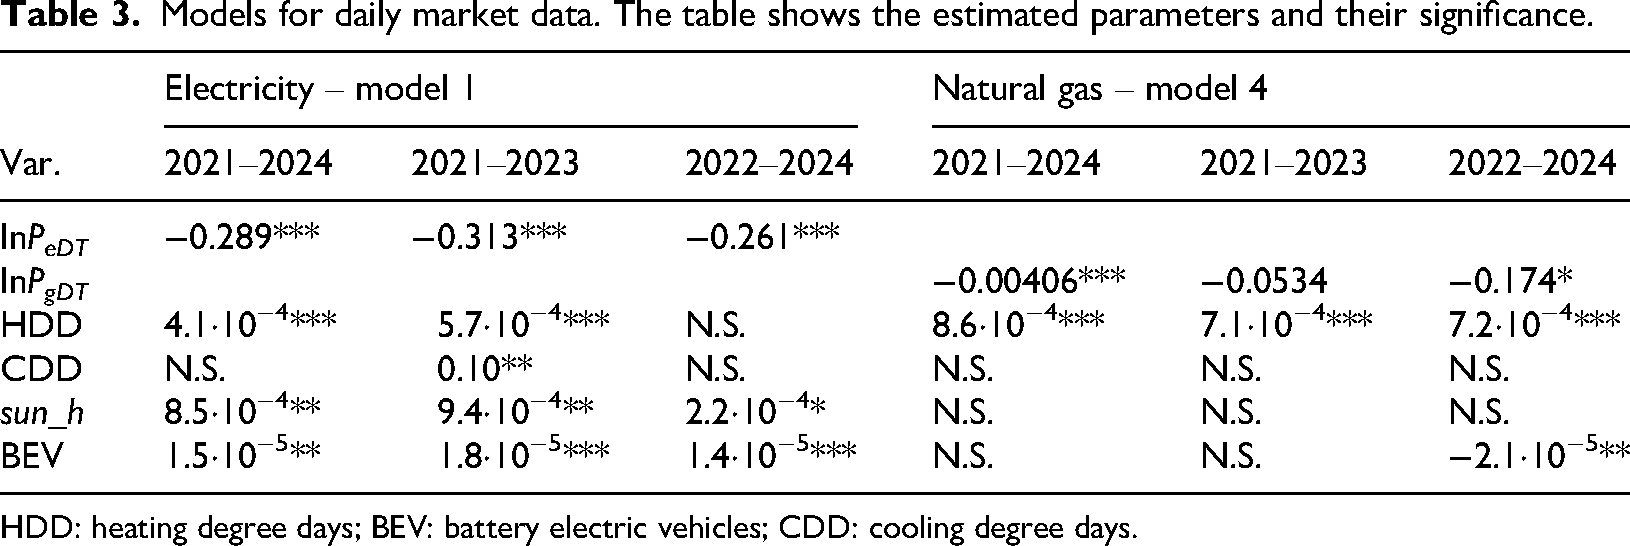
HDD: heating degree days; BEV: battery electric vehicles; CDD: cooling degree days.
Regarding the classical assumptions of the regression model, the correct specification was rejected for electricity consumption models based on three-year data. It would likely be desirable to include an additional variable in the model. For the model based on four-year data, the correct specification was not rejected. For the model of natural gas consumption from the daily market in 2021–2023, the KPSS test rejected the null hypothesis of stationarity in the residuals, indicating that the time series was not cointegrated. After adding a time trend to the model, the residuals became stationary, and the elasticity estimate changed slightly, from the original −0.0534 to −0.0750, but remained statistically insignificant.
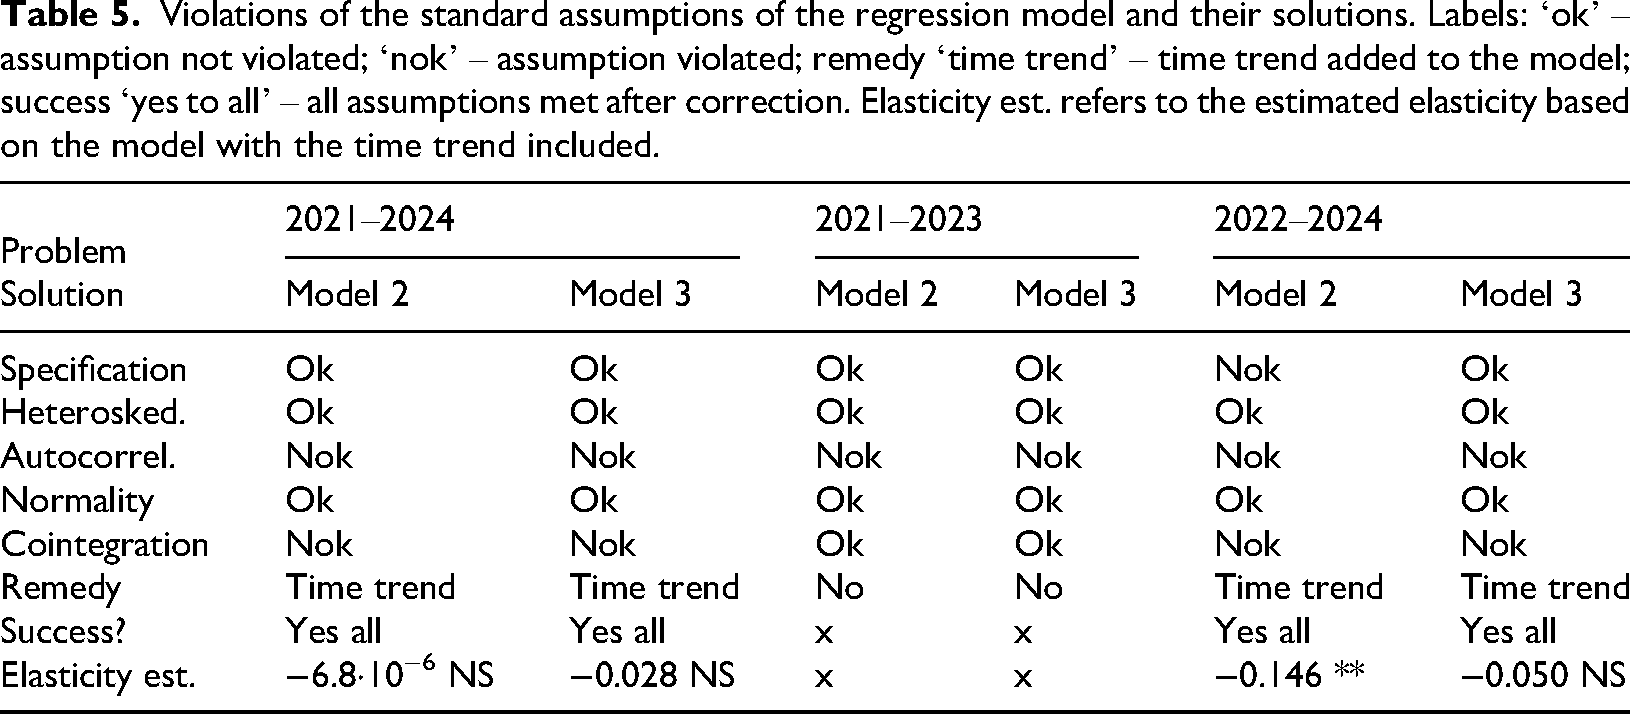
Models describing electricity consumption for ordinary consumers are shown in Table 4. They always include the HDD index, which effectively captures the seasonality in electricity consumption. The models for 2021–2023 also include sunshine duration, with expected positive parameters. All models exhibited significant autocorrelation in the error term (p-values between .01 and .05). Since autocorrelation does not bias regression parameter estimates, the presence of autocorrelation in the error term is not a major problem for elasticity estimates. For the 2022–2024 model with half-yearly prices, the correct model specification is rejected. In the 2021–2024 and 2022–2024 models, the KPSS test indicated non-stationarity in the residuals. After adding the time trend to the models, the residuals were stationary, their autocorrelation was not proven, the specification of one model was corrected, and the elasticity estimates were slightly recalculated. The only exception is the model for 2021–2024 with half-yearly data, where the elasticity estimate changed from the original −0.0886 to −0.00000679 and no longer differed statistically significantly from zero. Given the very slow decline in electricity prices since the second half of 2023, half-yearly data indicate that electricity prices have been nearly constant over this period, which may pose a challenge for regression analysis. Table 5 summarises violations of the classical assumptions of the regression model and their remedies.
Models for electricity consumption. The table shows the estimated parameters and their significance.
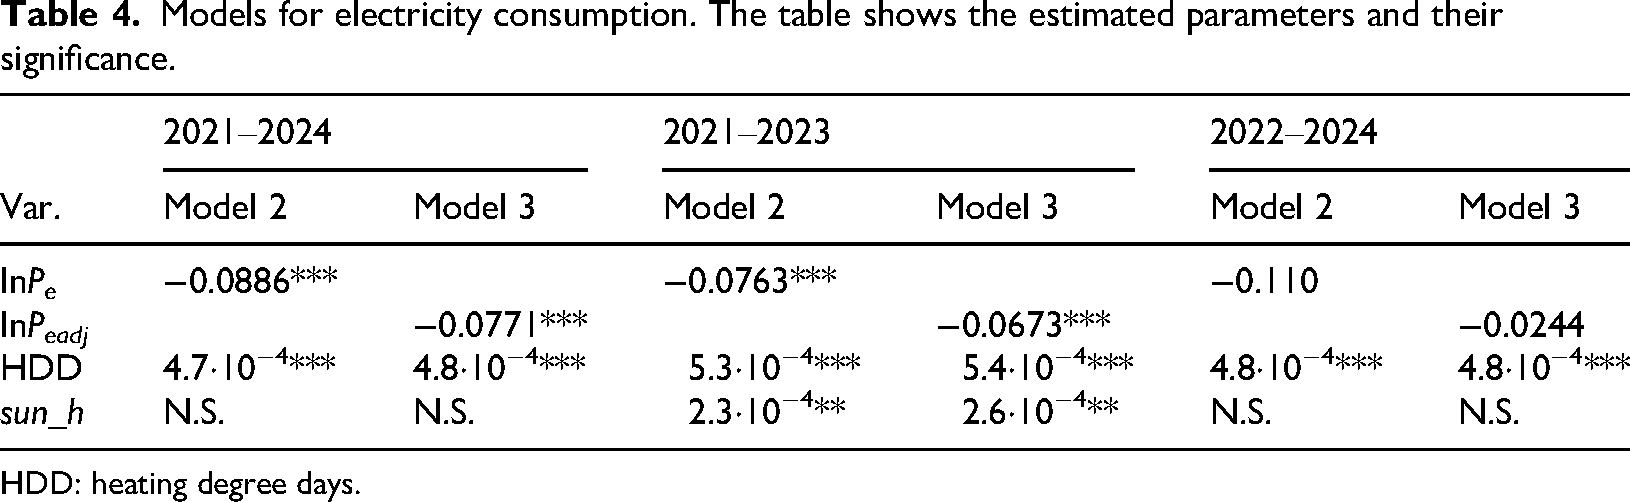
HDD: heating degree days.
Violations of the standard assumptions of the regression model and their solutions. Labels: ‘ok’ – assumption not violated; ‘nok’ – assumption violated; remedy ‘time trend’ – time trend added to the model; success ‘yes to all’ – all assumptions met after correction. Elasticity est. refers to the estimated elasticity based on the model with the time trend included.
Finally, we will examine the natural gas consumption models presented in Table 6. The HDD index is always included in the models, with parameters an order of magnitude larger than those for electricity consumption. Somewhat surprisingly, the CDD index is statistically significant in the 2021–2024 models. The negative parameter can be interpreted as very warm weather, when heating is not necessary, but it is more likely to reflect lower natural gas consumption for water heating due to the use of solar heating systems, which are effective in months with high CDD. In the 2021–2023 models, gross domestic product is significant, with the parameter estimated in the expected direction. The number of electric cars is also significant, as with the natural gas consumption models from the daily market, and should be understood as a trend towards the emergence of electricity-based technologies. Given the modelled period, it also serves as an indicator of consumers’ transition from natural gas-based technologies (heating, water heating, cooking) to electrical alternatives, possibly accompanied by the installation of photovoltaic solar systems. There were no econometric issues with the natural gas consumption models.
Models for natural gas consumption. The table shows the estimated parameters and their significance.
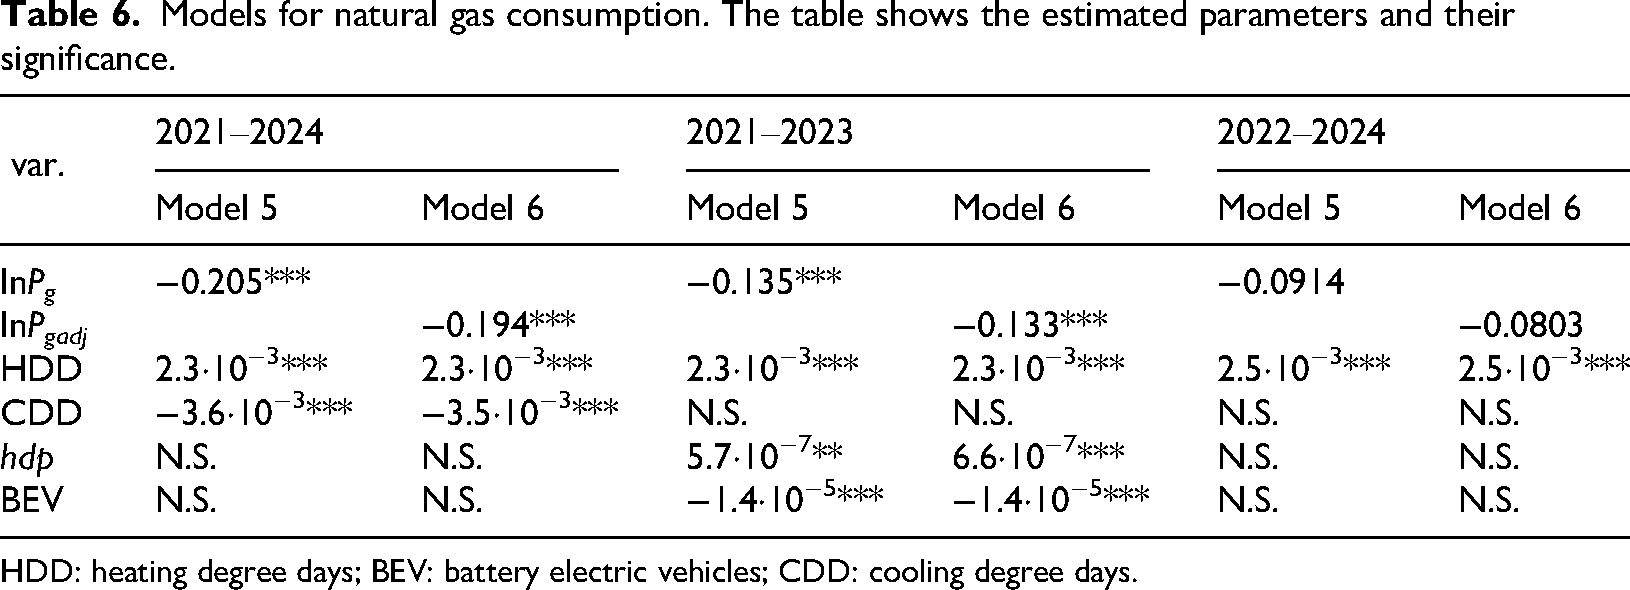
HDD: heating degree days; BEV: battery electric vehicles; CDD: cooling degree days.
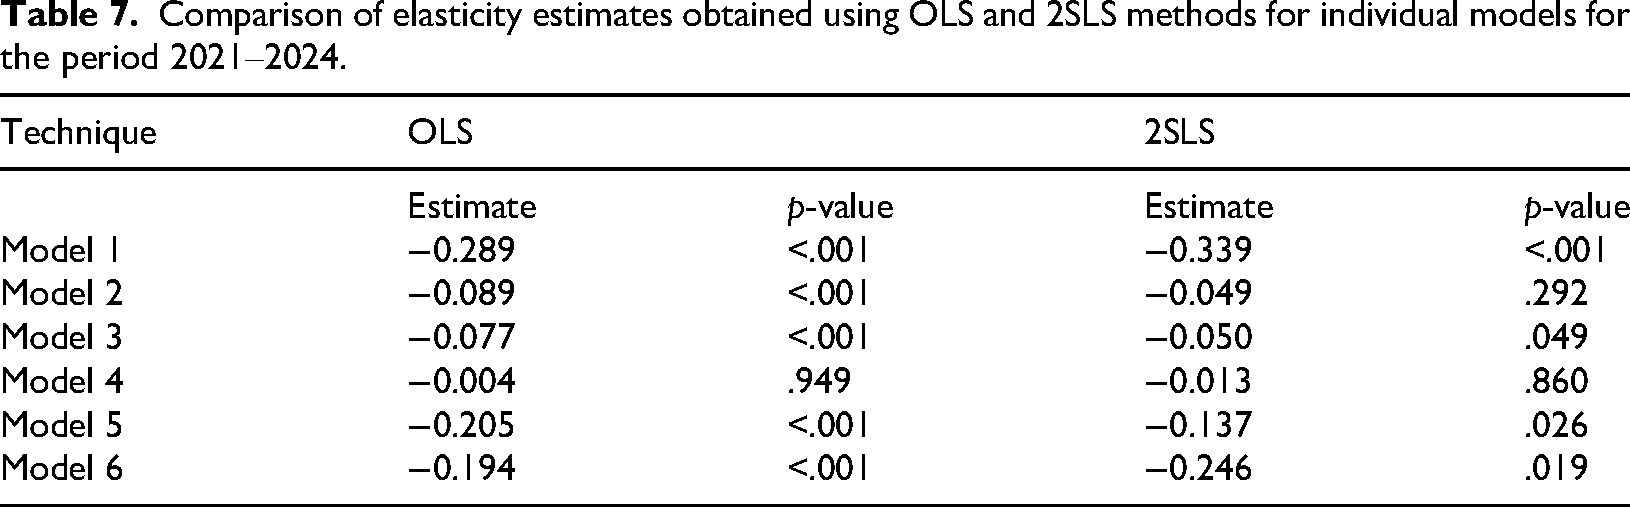
Finally, we compare estimates of the price elasticity of energy demand obtained using the OLS method and a two-stage regression model with instrumental variables. The estimates for each model for the period 2021–2024 are presented in Table 7. The estimated elasticity values are very similar across the corresponding models. No systematic bias is apparent. The 2SLS model yields higher p-values, supporting the overall conclusions of this study regarding a relatively weaker influence of price on energy demand.
Comparison of elasticity estimates obtained using OLS and 2SLS methods for individual models for the period 2021–2024.
We will now focus on answering the research questions and evaluating the research hypotheses. RQ1, regarding the influence of the scope and length of the analysed period on the quality of price elasticity estimates, can be answered in the affirmative. Elasticity estimates based on two-year data exhibit serious shortcomings: some estimates are positive, and many are not statistically different from zero. Furthermore, two-year models are accompanied by problems with regression assumptions. However, a longer observation period does not automatically result in a higher-quality elasticity estimate. The presence of periods of low prices, price increases, price peaks, and price declines significantly affects the quality of the elasticity estimate. These elements are included in the models for the years 2021 to 2024 and 2021 to 2023, which is reflected in their superior quality. Models that do not include the year 2021, i.e. the period of lower prices prior to the onset of price growth, exhibit poorer performance in estimating elasticity. These findings support research hypothesis H2.
RQ2, concerning inelastic demand for both energy sources amid rapid price increases, is also answered in the affirmative. Systematically higher absolute elasticity values are estimated for the daily electricity market, but even here, the values remain low, around 0.3. For the period with the most dynamic changes in energy prices, 2021 to 2023, we obtain elasticities of −0.08 for electricity and −0.14 for natural gas, indicating highly inelastic demand. This confirms research hypothesis H1.
Finally, we will examine research hypothesis H3, which states that HDD is significant in modelling the consumption of both natural gas and electricity. HDD is statistically significant in natural gas consumption models, and the estimated parameters associated with HDD are stable; see Table 6. This is expected, as natural gas is consumed primarily for building heating. Surprisingly, HDD also appears in electricity consumption models as significant, with stable parameters (Table 4), a pattern that is less obvious. Electricity is traditionally used for cooling on hot days; electric heating has been gradually minimised due to high costs. Currently, however, the Czech Republic is transitioning from natural gas consumption (primarily due to the elimination of Russian supplies) to other energy sources, including electricity, and is deploying more advanced technologies, such as heat pumps.
Discussion
The estimated absolute values of price elasticity of demand for both electricity and natural gas are low, indicating inelastic energy demand. Price increases lead only to a slight decline in consumption. This pattern may be driven not only by the need to use energy but also by the limited ability to switch from technologies that rely on one energy source to those that rely on another. Lower elasticity may reflect the specifics of the Czech energy market, such as lower price volatility, a higher share of regulated price components, and fewer opportunities for households to respond to price changes in real time.
The estimated short-term price elasticity of demand for electricity and natural gas aligns with most empirical findings in the literature, which indicate that energy demand is generally inelastic in the short term. Labandeira et al. (2017), in their meta-analysis of hundreds of studies, report that the average short-term elasticity of demand for electricity ranges from −0.09 to −0.76. Zhu et al. (2018) confirm, based on the studies analysed, that the average short-term elasticity of household demand for electricity is −0.228, while the long-term elasticity is −0.577. Their results suggest a difference between short-term and long-term effects. Given that our model is based on monthly data and does not capture long-term adaptation mechanisms (e.g. investment in savings), the lower elasticity estimate is expected. From a long-term perspective, Fouquet (2014) shows that the elasticity of demand for energy services was historically higher in absolute terms but has gradually declined with technological development and income growth, making demand more inelastic. This trend confirms that, in a modern economy, consumers’ short-run response to price changes is often weak.
Our results are consistent with the study by Idsø et al. (2024), which focused on short-term elasticity in Norway. The authors found that price elasticity is insignificant when the temperature falls below 0 °C and very low when the temperature is above 0 °C (0.01), which is consistent with our findings. The authors also emphasised the importance of temperature as a key demand factor. The price elasticity of demand for natural gas in Italy, based on monthly billing data from 51,177 end users, shows that residential customers respond to price changes more than non-residential customers, but the overall price elasticity is less than 1%, indicating relatively inelastic demand (Favero and Grossi, 2023). This work provides a micro-level analysis useful for energy policy and public service management. The work also shows that natural gas consumption is significantly influenced by environmental factors, particularly temperature. Our models corroborate the findings of the aforementioned studies by frequently including the HDD index and other supplementary meteorological variables. The ad hoc inclusion of the CDD index in the models raises doubts about its suitability for the conditions in the Czech Republic, but it is possible that cooling-related energy consumption is not sufficiently significant here to systematically affect consumption models.
An important issue is the choice of method for estimating price elasticity. The use of EC or ARDL models for the Czech Republic is constrained by the structure and length of the available data. Monthly or quarterly data are ideal for EC or ARDL models; the time series must be either stationary or cointegrated. A sufficiently long time series, at least 15–20 years for annual data or at least 60 observations for monthly data, is essential so that the model can reliably identify a long-term cointegration relationship. This is not guaranteed in the case of the Czech Republic, and furthermore, the originally semi-annual energy price data may pose substantial problems.
The use of 2SLS models with instrumental variables may seem ideal for the Czech Republic, given its status as a small open economy. There is strong support for the model's underlying principle here: demand shocks in the Czech Republic (e.g. a local energy-saving campaign) have virtually no impact on pan-European gas or electricity prices. By contrast, supply shocks in Europe or elsewhere in the world (e.g. calm or windy weather in Western Europe) immediately affect energy prices in the Czech Republic. However, most households in the Czech Republic have prices fixed for a longer period or indefinitely, with the price list updated once a year. Instruments reflecting immediate price formation in Europe will be well suited to businesses, but only a small share of households purchase at spot prices. For households, a delay must be accounted for, which could be addressed at least in part using lagged instruments, but this would result in a critical shortening of the modelled time series.
An important limitation of this study is the mismatch between monthly consumption data and semi-annual retail price observations available to ordinary consumers. However, household retail electricity and natural gas prices in the Czech Republic are typically adjusted only a few times per year due to contractual rigidities, regulated tariff components, and delays arising from wholesale market developments. Consumers therefore respond primarily to relatively stable retail tariffs rather than to short-term wholesale price fluctuations. For this reason, semi-annual price observations provide a reasonable approximation of effective consumer price signals. The adjusted price series (Peadj and Pgadj), constructed using daily market developments, serve as an additional robustness check rather than a simple replacement. This interpretation is further supported by the similarity of the estimated elasticities obtained using both the original semi-annual price series and the adjusted monthly price series. For electricity demand in 2021–2024, the estimated elasticity changes only from −0.089 (Model 2) to −0.077 (Model 3), while for natural gas demand it changes from −0.205 (Model 5) to −0.194 (Model 6). This close correspondence suggests that the main conclusions are not driven by the specific construction of the price variable and confirms the robustness of the estimated short-run demand responses.
Further, for more detailed research on the price elasticity of demand, it would be useful to obtain a finer breakdown of consumption and prices, such as by socioeconomic strata or at a finer territorial level than the Czech Republic as a whole. It would also be useful to focus on daily market data, which is available in great detail and provides an overview of consumption directly linked to the daily market price. However, data on accompanying variables are not available at higher frequencies, and the daily natural gas market accounts for only a small fraction of total natural gas consumption in the Czech Republic. Another area that has been little researched due to a lack of data is self-generated electricity and its impact on consumption and consumer behaviour. All data currently comes from consumption on the public grid, yet some households already cover a significant share of their consumption from their own sources. Finally, it would be possible to take a broader view and estimate price elasticity across a wider range of commodities classified as energy sources, such as fuels, as in van Eyden et al. (2021). In this context, the effect of the transition away from Russian sources could again be observed; high price volatility would likely enable estimation of the price elasticity of demand for fuels. The problem is the availability of the necessary data, and the accompanying variables would be significantly different from those for electricity and natural gas.
Conclusions
Our results identified shortcomings in models based on two-year monthly data, while those built on three-year and four-year data are fully usable. It is appropriate to estimate the price elasticity of energy demand during periods of rapid change, in our case, for data from 2021 to 2023. The results support the claim that households have only a limited ability to respond to price stimuli in the short term. Low elasticity values indicate that prices alone are insufficient as the primary tool for reducing energy consumption. This low elasticity may mean that price increases will disproportionately affect low-income groups, as they typically have little room to reduce consumption and are tenants without the option to implement energy-saving measures in buildings. This risk of growing energy poverty could be addressed by introducing compensation mechanisms. In the short term, households do not respond flexibly, but long-term measures, such as reducing the energy intensity of buildings, could have a more significant impact on consumer behaviour. Policies aimed at changing consumer behaviour may include support for measures such as insulating building envelopes and replacing energy-intensive appliances with more energy-efficient versions. Our study also identifies an area that would enable consumers to respond more flexibly to price changes. One solution is to promote dynamic tariffs, supported by adequate education. In conducting this study, we also encountered a lack of data that would provide a clearer picture of energy consumption and prices in the Czech Republic. It would be appropriate for the state to invest in the collection of high-quality, regular, and detailed consumption data, which could then be used to research consumer behaviour, improve understanding, and enable more accurate targeting of measures. Future research in the field should utilise even more granular household-level data to examine how socioeconomic status further moderates elasticity estimates, as current national-level data may mask important disparities.
Supplemental Material
sj-docx-1-eea-10.1177_01445987261458500 - Supplemental material for Estimation of price elasticity of energy demand in a small open economy: Evidence from the Czech Republic (2021–2024)
Supplemental material, sj-docx-1-eea-10.1177_01445987261458500 for Estimation of price elasticity of energy demand in a small open economy: Evidence from the Czech Republic (2021–2024) by Martin Baťka, Natália Várošová and David Hampel in Energy Exploration & Exploitation
Footnotes
Acknowledgements
This project was supported by the Agency of Technology of the Czech Republic Decision support system for achieving climate and energy goals in the Czech Republic.
Declaration of generative AI and AI-assisted technologies in the writing process
During the preparation of this work, the authors used ChatGPT, Elicit, and Scopus AI to support the literature review. After using this tool, the author reviewed and edited the content as needed and takes full responsibility for the publication's content.
Funding
The authors disclosed receipt of the following financial support for the research, authorship, and/or publication of this article: This work was supported by the Agency of Technology of the Czech Republic (Grant No. TS01010108).
Declaration of conflicting interests
The authors declared no potential conflicts of interest with respect to the research, authorship, and/or publication of this article.
Supplemental material
Supplemental material for this article is available online.
References
Supplementary Material
Please find the following supplemental material available below.
For Open Access articles published under a Creative Commons License, all supplemental material carries the same license as the article it is associated with.
For non-Open Access articles published, all supplemental material carries a non-exclusive license, and permission requests for re-use of supplemental material or any part of supplemental material shall be sent directly to the copyright owner as specified in the copyright notice associated with the article.